1. Introduction
The building sector, responsible for more than one third of the total energy use and associated greenhouse gas emissions [
1], needs continuous and constant energy efficiency improvement. The future of this sector is strongly related to the reduction of such alarming quota, that can be pursued by improving the thermal performance of structural elements, responsible for the heat losses, and by increasing the efficiency of buildings’ technical plants.
The dispersing elements have a relevant impact on the buildings ‘energy consumption [
2] and their thermal characteristics can be experimentally studied by means of hot boxes able to recreate real and repeatable operating conditions [
3]. A hot box allows to analyze real size structural components subject to a known thermal forcing (steady and dynamic) imposed as boundary conditions.
A hot box is essentially constituted in terms of two main chambers (hot and cold), while the building component under investigation is interposed between them. Known thermal conditions are created, in order to reproduce a typical thermal stress that characterizes the actual use of the sample: for instance, 20 °C are imposed in hot chamber and 0 °C in cold chamber, with the aim of having enough temperature difference for giving rise to an appreciable thermal flow. The considerable dimensions of common hot boxes and the actual dimensions of the analyzed object determine a burdensome control of the thermal phenomena, especially when the requirements of technical standards are met. In fact, hot box experiments require measuring and control systems able to save temperature values from several (order of hundreds) probes and for long-lasting campaigns, and to maintain imposed boundary conditions by controlling the heating and cooling systems that equip the hot box itself. Add to this that the sizes and features of the hot box components directly influence the number of installed probes and, therefore, the control system complexity. In literature, there are many examples of laboratory tests carried out using hot boxes, morphologically different from each other. Caruana et al. [
4] employed a hot box to investigate the thermal properties of a new building block (specimen dimensions equal to 165 × 190 cm), to improve its U-value without changing compressive strength, physical dimensions or manufacturing process. Gullbrekken et al. [
5] discussed how natural convection in air-permeable glass wool insulation affects the thermal transmittance in walls, roofs and floors. The study was carried out by means of a rotatable guarded hot-box (with a metering area equal to 245 × 245 cm). Prata et al. [
6], studied the dynamic thermal behavior of a Linear Thermal Bridge (LTB) in a wooden building corner by means of a calibrated hot box. The specimen was made up of two cross laminated timber (CLT) panels bolted together to simulate the dynamic thermal behavior of a wooden building corner (each panel had dimensions equal to 100 × 215 cm). The work of Lechowska et al. [
7] presented experiments in a guarded hot box for improving the PVC window frame thermal transmittance without frame geometrical dimension and material variations (the external dimensions of the window frame were 150 × 150 cm).
The sizes of the specimen (that can be up to 3 m), the maintenance of stable thermal conditions, and the knowledge of the thermal phenomena that happen between the layers of the sample, and between sample and chambers require complex measuring and control systems.
Therefore, despite its basic working principle, a hot box requires the use of a manifold equipment, often difficult to manage. Indeed, if the hot box equipment is not adequate or the number of temperature probes is not sufficient, a partial knowledge of thermal phenomena and not suitable thermal conditions inside the chambers are obtained. Some authors claim that, given the state of the art, climate chambers can be precisely controlled and programmed with temperature cycles [
8]. Being missing an analysis of the measuring and control systems commonly employed in hot box experiments, a literature insight on such systems is presented in the following (
Section 2), highlighting the frequent employment of commercial (and sometimes expensive) devices.
Given that: (i) a hot box requires a burdensome management of the temperature probes and of the devices installed in it; (ii) commonly, separated measuring and control systems equip hot boxes, causing possible rough temperature regulation; (iii) by now, there is no possibility for commercial devices to real-time monitor the thermal distributions inside the chambers (i.e., it is impossible to assess potential thermal stratifications); there is the need for a novel, cheap, integrated and reliable measuring and control system for thermal analyses in hot box experiments, presented in this paper. Moreover, to test the capabilities of the system and the data post-processing of the measured values, a real application on a X-lam sample wall with double insulating layer is performed.
The paper is structured as follows.
Section 2 proposes a review of the measuring and control systems commonly employed in hot boxes experiments. The new system and its properties are presented in
Section 3.
Section 4 shows the results obtained from the application of the system to a real case. The conclusions are reported in
Section 5.
2. Common Systems and Literature Background
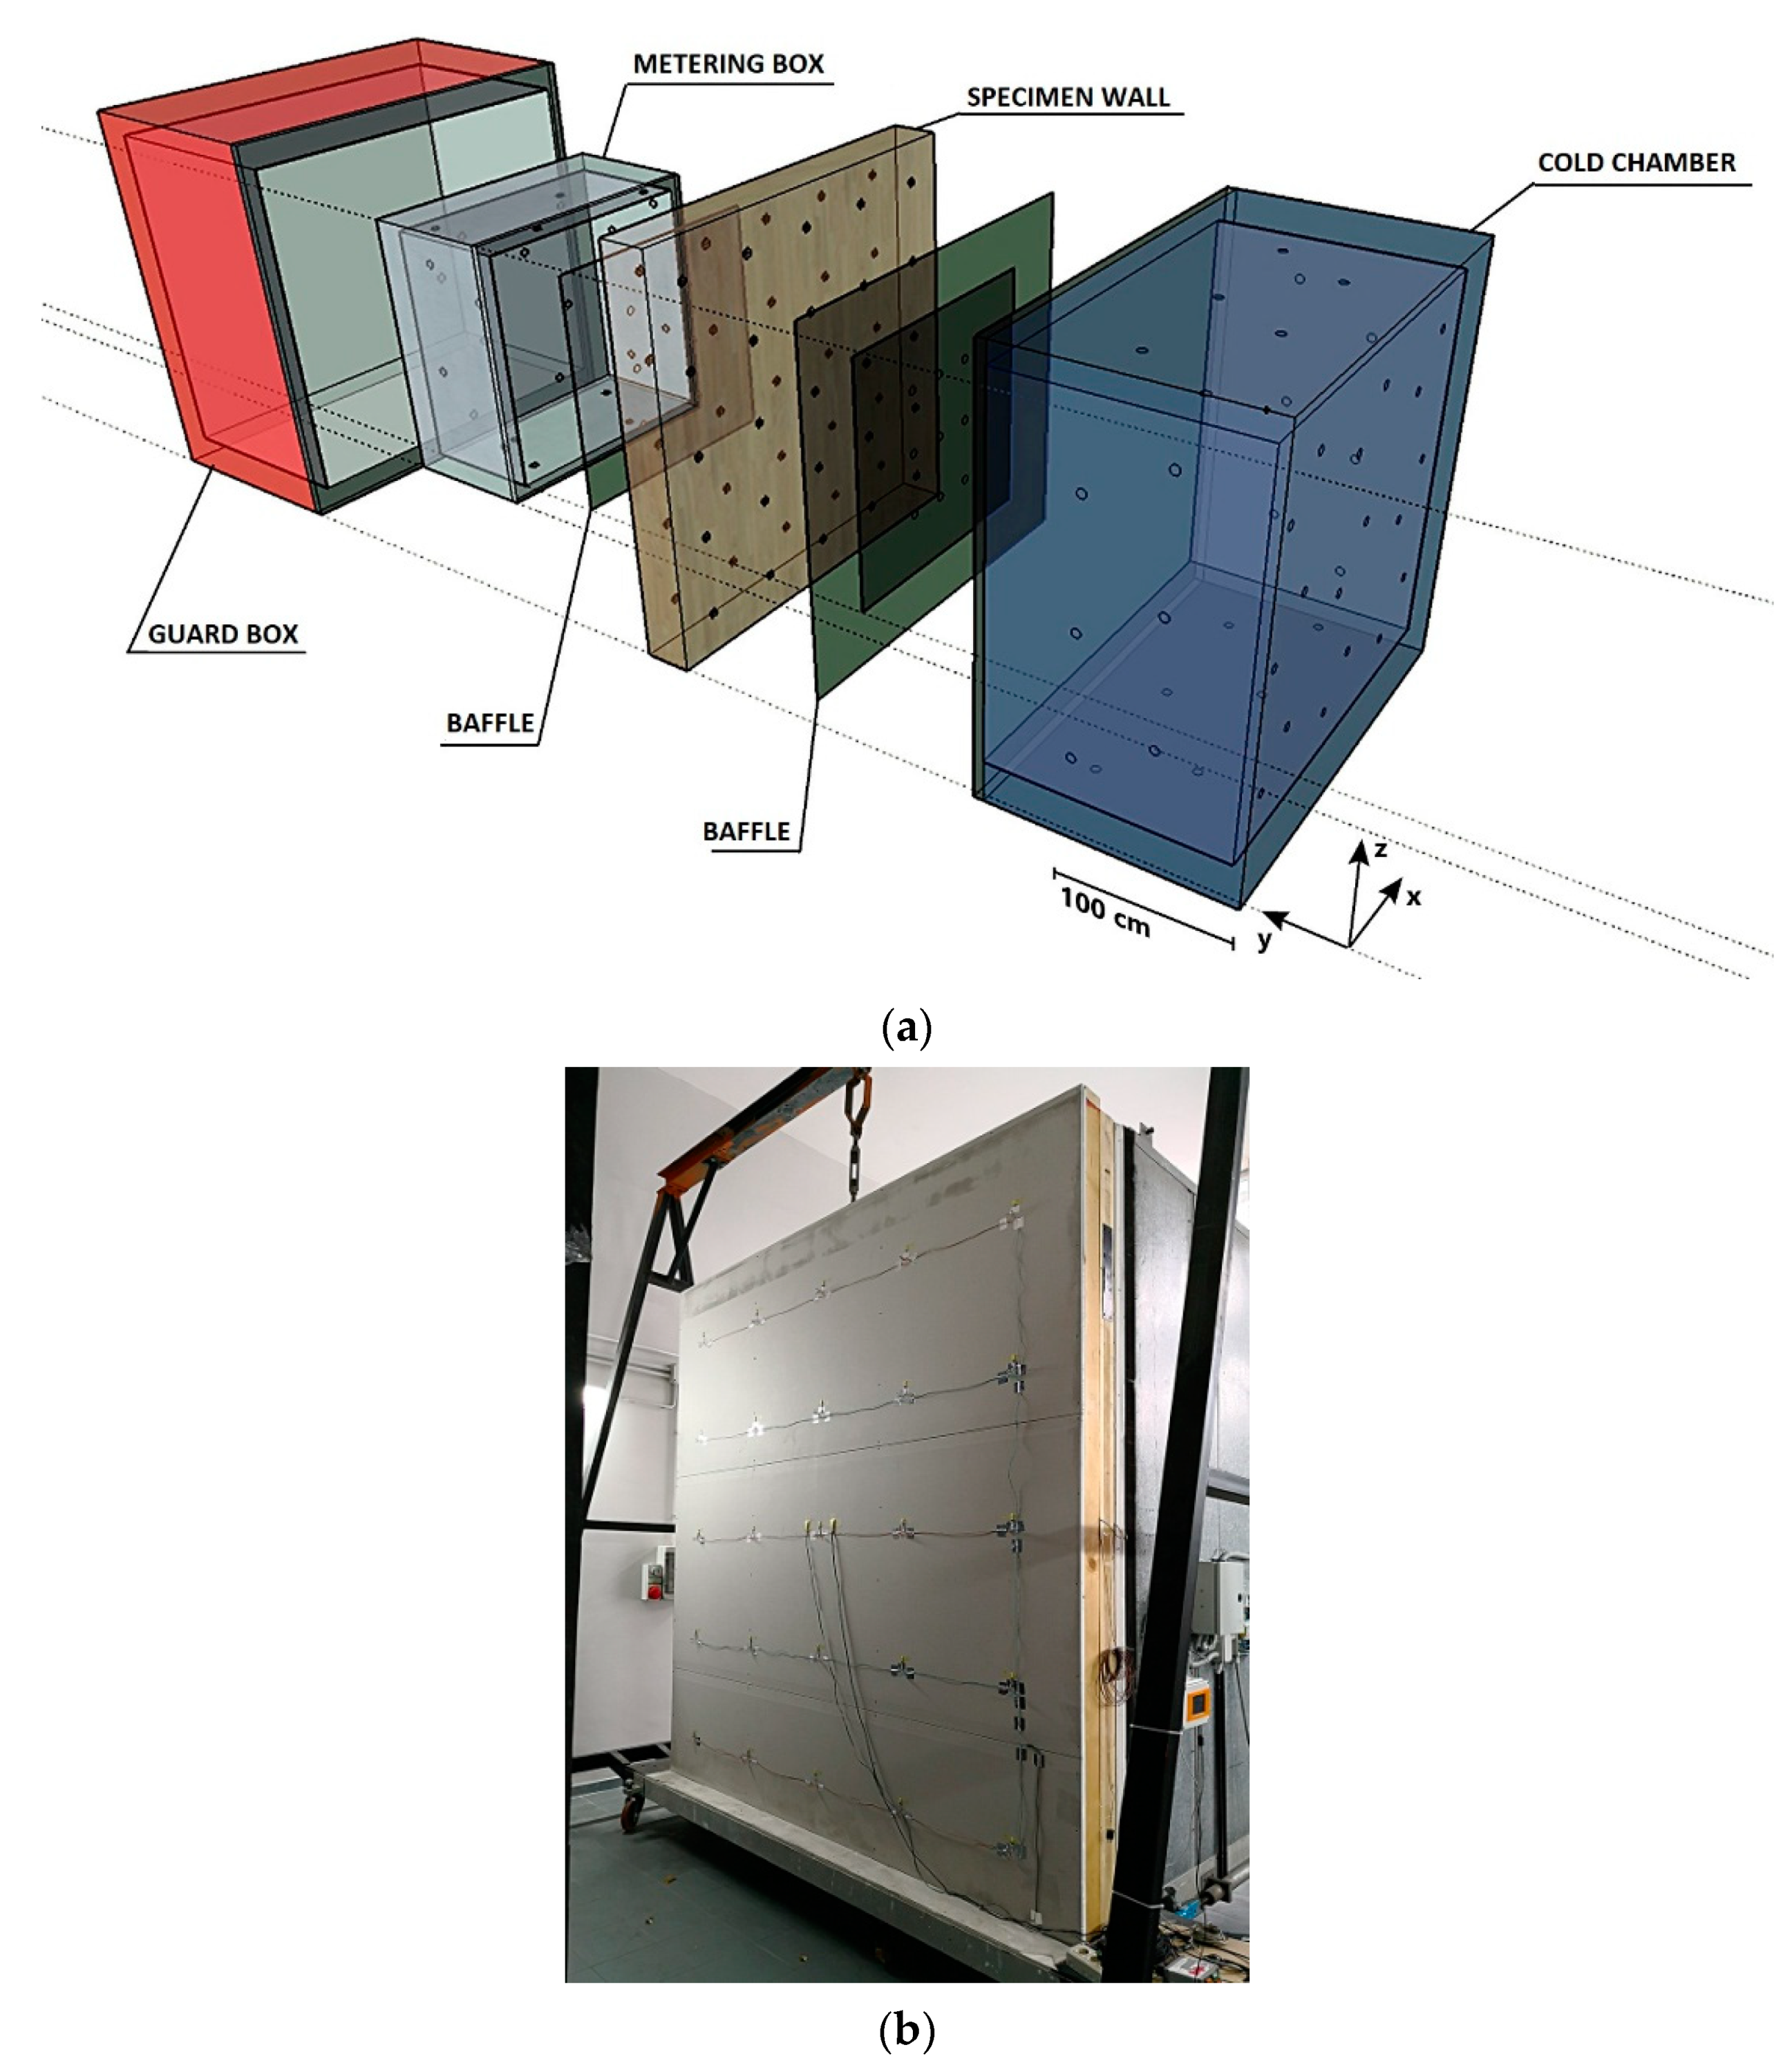
The measuring and control system, presented in this work, equips a Guarded Hot Box (GHB), constituted by three boxes: a guard box, a metering box (inside the hot one) and a cold box. A detailed description of GHB and its operation is presented in previous works [
9,
10,
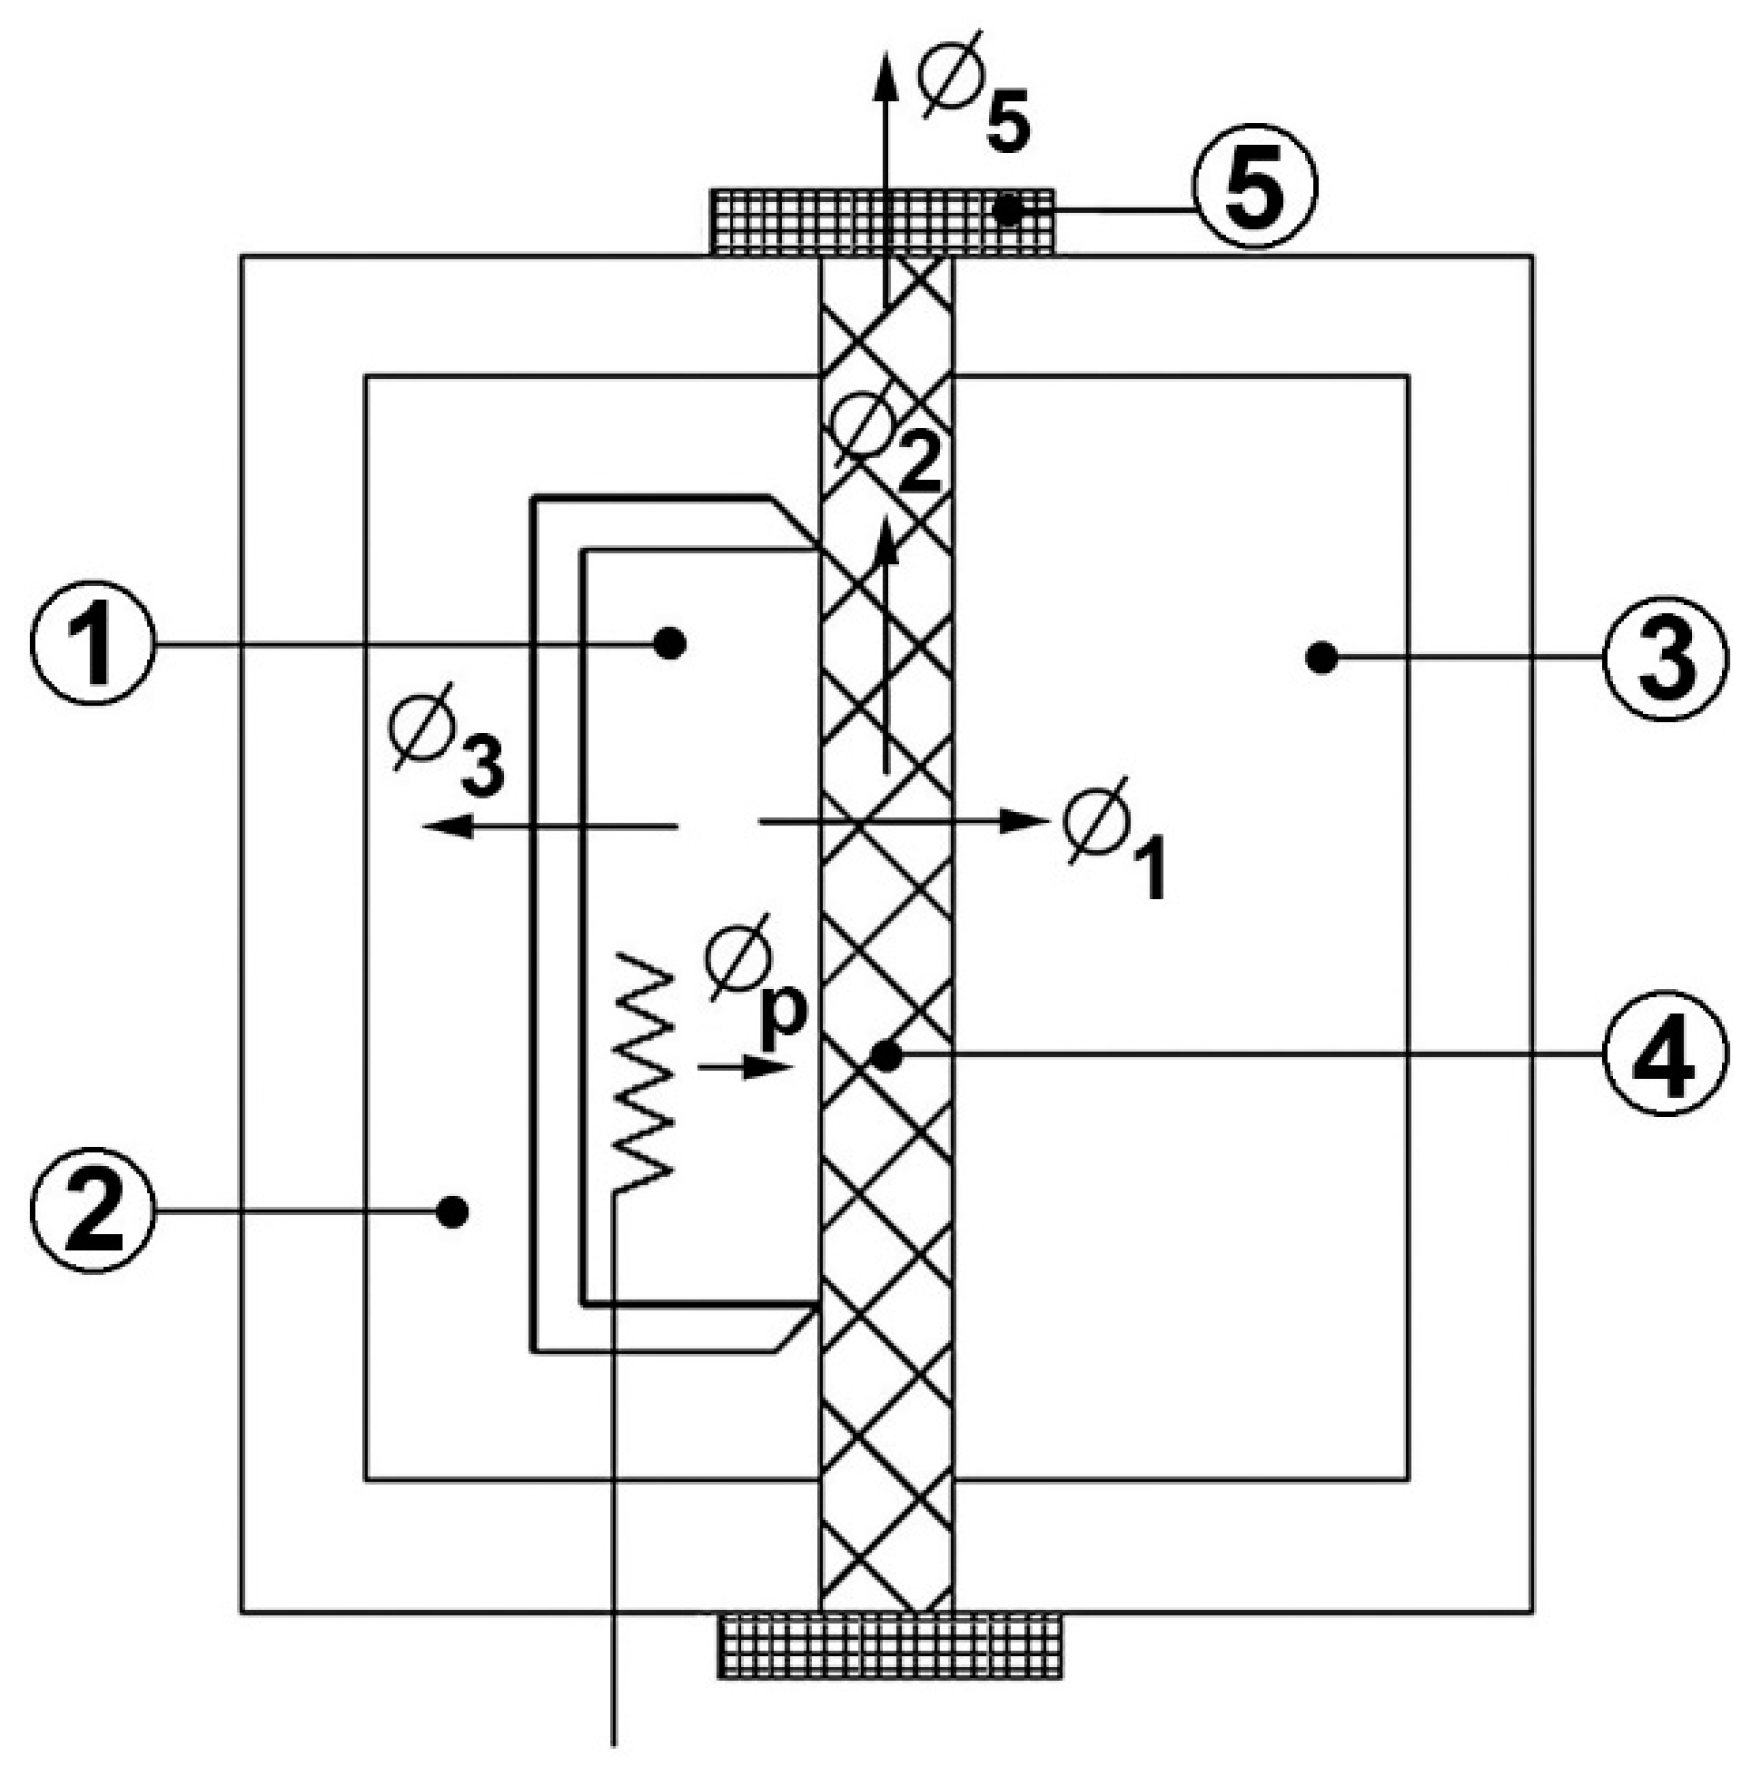
11]. The knowledge of energy balance inside the hot box allows to understand how complex the thermal phenomena (that characterize the operation of a GHB) and the management of the systems (that control the thermal steady-state conditions) are. The heat flows distribution in the GHB is shown in
Figure 1, where Φ
1 represents the heat flow rate through the specimen, Φ
p is the total power input into the hot chamber, Φ
2 is an imbalance, i.e., the heat flow rate parallel to the specimen, Φ
3 is the heat flow rate through metering box walls. Φ
5 is the heat flow rate parallel to the specimen surface at the edges of the specimen, called peripheral heat loss.
Known the thermal energy input into the hot chamber and the internal flanking losses inside guard and metering boxes, it is possible to determine the amount of heat that passes through the sample, that represents the main goal of hot box experiments. What retrieved by theoretical analysis should be confirmed by measurements.
Hot box experiments shall be conducted imposing temperature differences between hot and cold chambers usually chosen for the end-use application: 20 °C is a common temperature difference for building applications. These conditions are generally guaranteed using electric resistances, for the energy input into the hot chamber, and refrigerating unit for the energy input into the cold chamber.
The temperature sensors are installed on both the surfaces of the sample (hot and cold sides) and on the walls of metering and guard boxes to quantify the effects of flanking losses and the heat flow that passes through the specimen. Further sensors are placed to monitor the air temperature values inside chambers and laboratory. A current and voltage meter allows to know the thermal energy input into the hot chamber by the Joule effect, being the heating supplied by electric resistances. The minimum number of temperature probes to be installed is defined by the standard UNI EN ISO 8990 [
12], and it shall be of at least two probes for square meter.
Before presenting the integrated measuring and control system proposed in this work, a literature review of the common measuring and control systems employed for hot box experiments is proposed. The works were selected based on the following research questions:
what types of hot boxes are commonly used?
what types of probes are commonly employed to measure temperatures on the specimen and inside the chambers?
what types of measuring and control systems are commonly used?
Based on the parameters mentioned above, the works selected from literature are summarized in
Table 1.
Therefore, the literature review shows that the calibrated hot box is the most used [
3,
4,
6,
13,
17,
19,
20,
23,
24,
25,
26,
28,
30,
32,
33,
36,
37] followed by the guarded hot box [
5,
7,
14,
15,
18,
21,
22,
29,
31,
34,
35] and the simple hot box [
16,
27,
38]. The measuring systems always employ analog probes and the thermocouples are more widely used [
3,
4,
5,
6,
13,
14,
15,
16,
18,
21,
22,
23,
24,
25,
26,
27,
29,
31,
33,
34,
35,
36,
37,
38] with respect to the thermoresistances [
17,
19,
20,
28,
34]. The number of probes installed that, as mentioned, depends on the size of the hot box, is very variable: some cases have less than 20 probes [
13,
16,
19,
20,
27,
28,
38], most cases have a number of probes between 20 and 100 [
4,
5,
6,
14,
15,
23,
24,
25,
33,
36], while in three cases there are more than 100 probes [
34,
35,
37]. The measuring and control systems are mainly commercial [
3,
6,
7,
16,
19,
20,
21,
23,
24,
25,
27,
28,
31,
33,
37] except for one customized system [
17].
Based on the literature review, the following observations can be made: (1) all the analyzed cases employ analog temperature sensors; (2) except for one case, all the analyzed hot box facilities use commercial and separated measuring and control systems; (3) none of the cases analyzed would appear to show the possibility of real-time monitoring the thermal distributions.
The first observation allows to underline how the management of many analog sensors is complex because of several disadvantages due to losses and signal noise along the connection cables [
40] that require compensation circuits for each probe [
41,
42,
43].
The second observation highlights that, besides being commercial, the measuring and control systems are also separated and independent: the measuring system permits to monitor and measure the thermal properties of the sample inside the chambers, while the control systems permit to turn on/off the heating and cooling systems of the hot box to reach the wished thermal conditions. However, the choice of employing separated systems can cause a rough temperature regulation inside the chambers. In fact, the control systems regulate the temperatures by using their own sensing probes that differ from those employed to measure the thermal properties of the sample. Therefore, if the regulation of the wished thermal conditions is difficult or approximate, the fluctuations between the two chambers become considerable and the experiments may be far from the steady-state condition.
The last observation points out that the lack of real-time monitoring determines the inability of displaying anomalous thermal stratifications inside the chambers and their incidence.
Therefore, the main problems that can be encountered for hot box experiments can be summarized as follows: (1) burdensome management of the temperature probes installed; (2) possible considerable thermal fluctuations between the two chambers; (3) difficult control of thermal stratifications inside the chambers.
The hot box employed in this work has quite large dimensions (300 × 300 × 320 cm) and summing up the number of probes installed in the chambers, the total amount of sensors needed is extremely high and, therefore, their management becomes complex. Moreover, the experimental tests need steady-state conditions guaranteed by small temperature fluctuations between the two chambers as indicated by the standard UNI EN ISO 8990 [
12]). Therefore, the management of controllers represents a further difficulty.
Based on this analysis, the measuring and control system presented in this work tries to overcome these difficulties, in order to simplify the carrying out and accuracy of the experiments. In particular, the main novelties of the proposed systems are:
measuring, control and post-processing phases integrated into one system;
scalability of the number of temperature probes usable, without the need of compensation circuit and additional devices;
arbitrary choice of number and typology (ambient or surface) of temperature probes usable for regulating temperature setups inside the chambers;
management of temperature fluctuations between hot and cold chambers (through a specific PI regulator);
instantaneous visualization of the thermal phenomena that characterize the experiment and control of the correct evolution of the experimental tests;
low-cost of the system.
3. Proposal of a New Integrated System
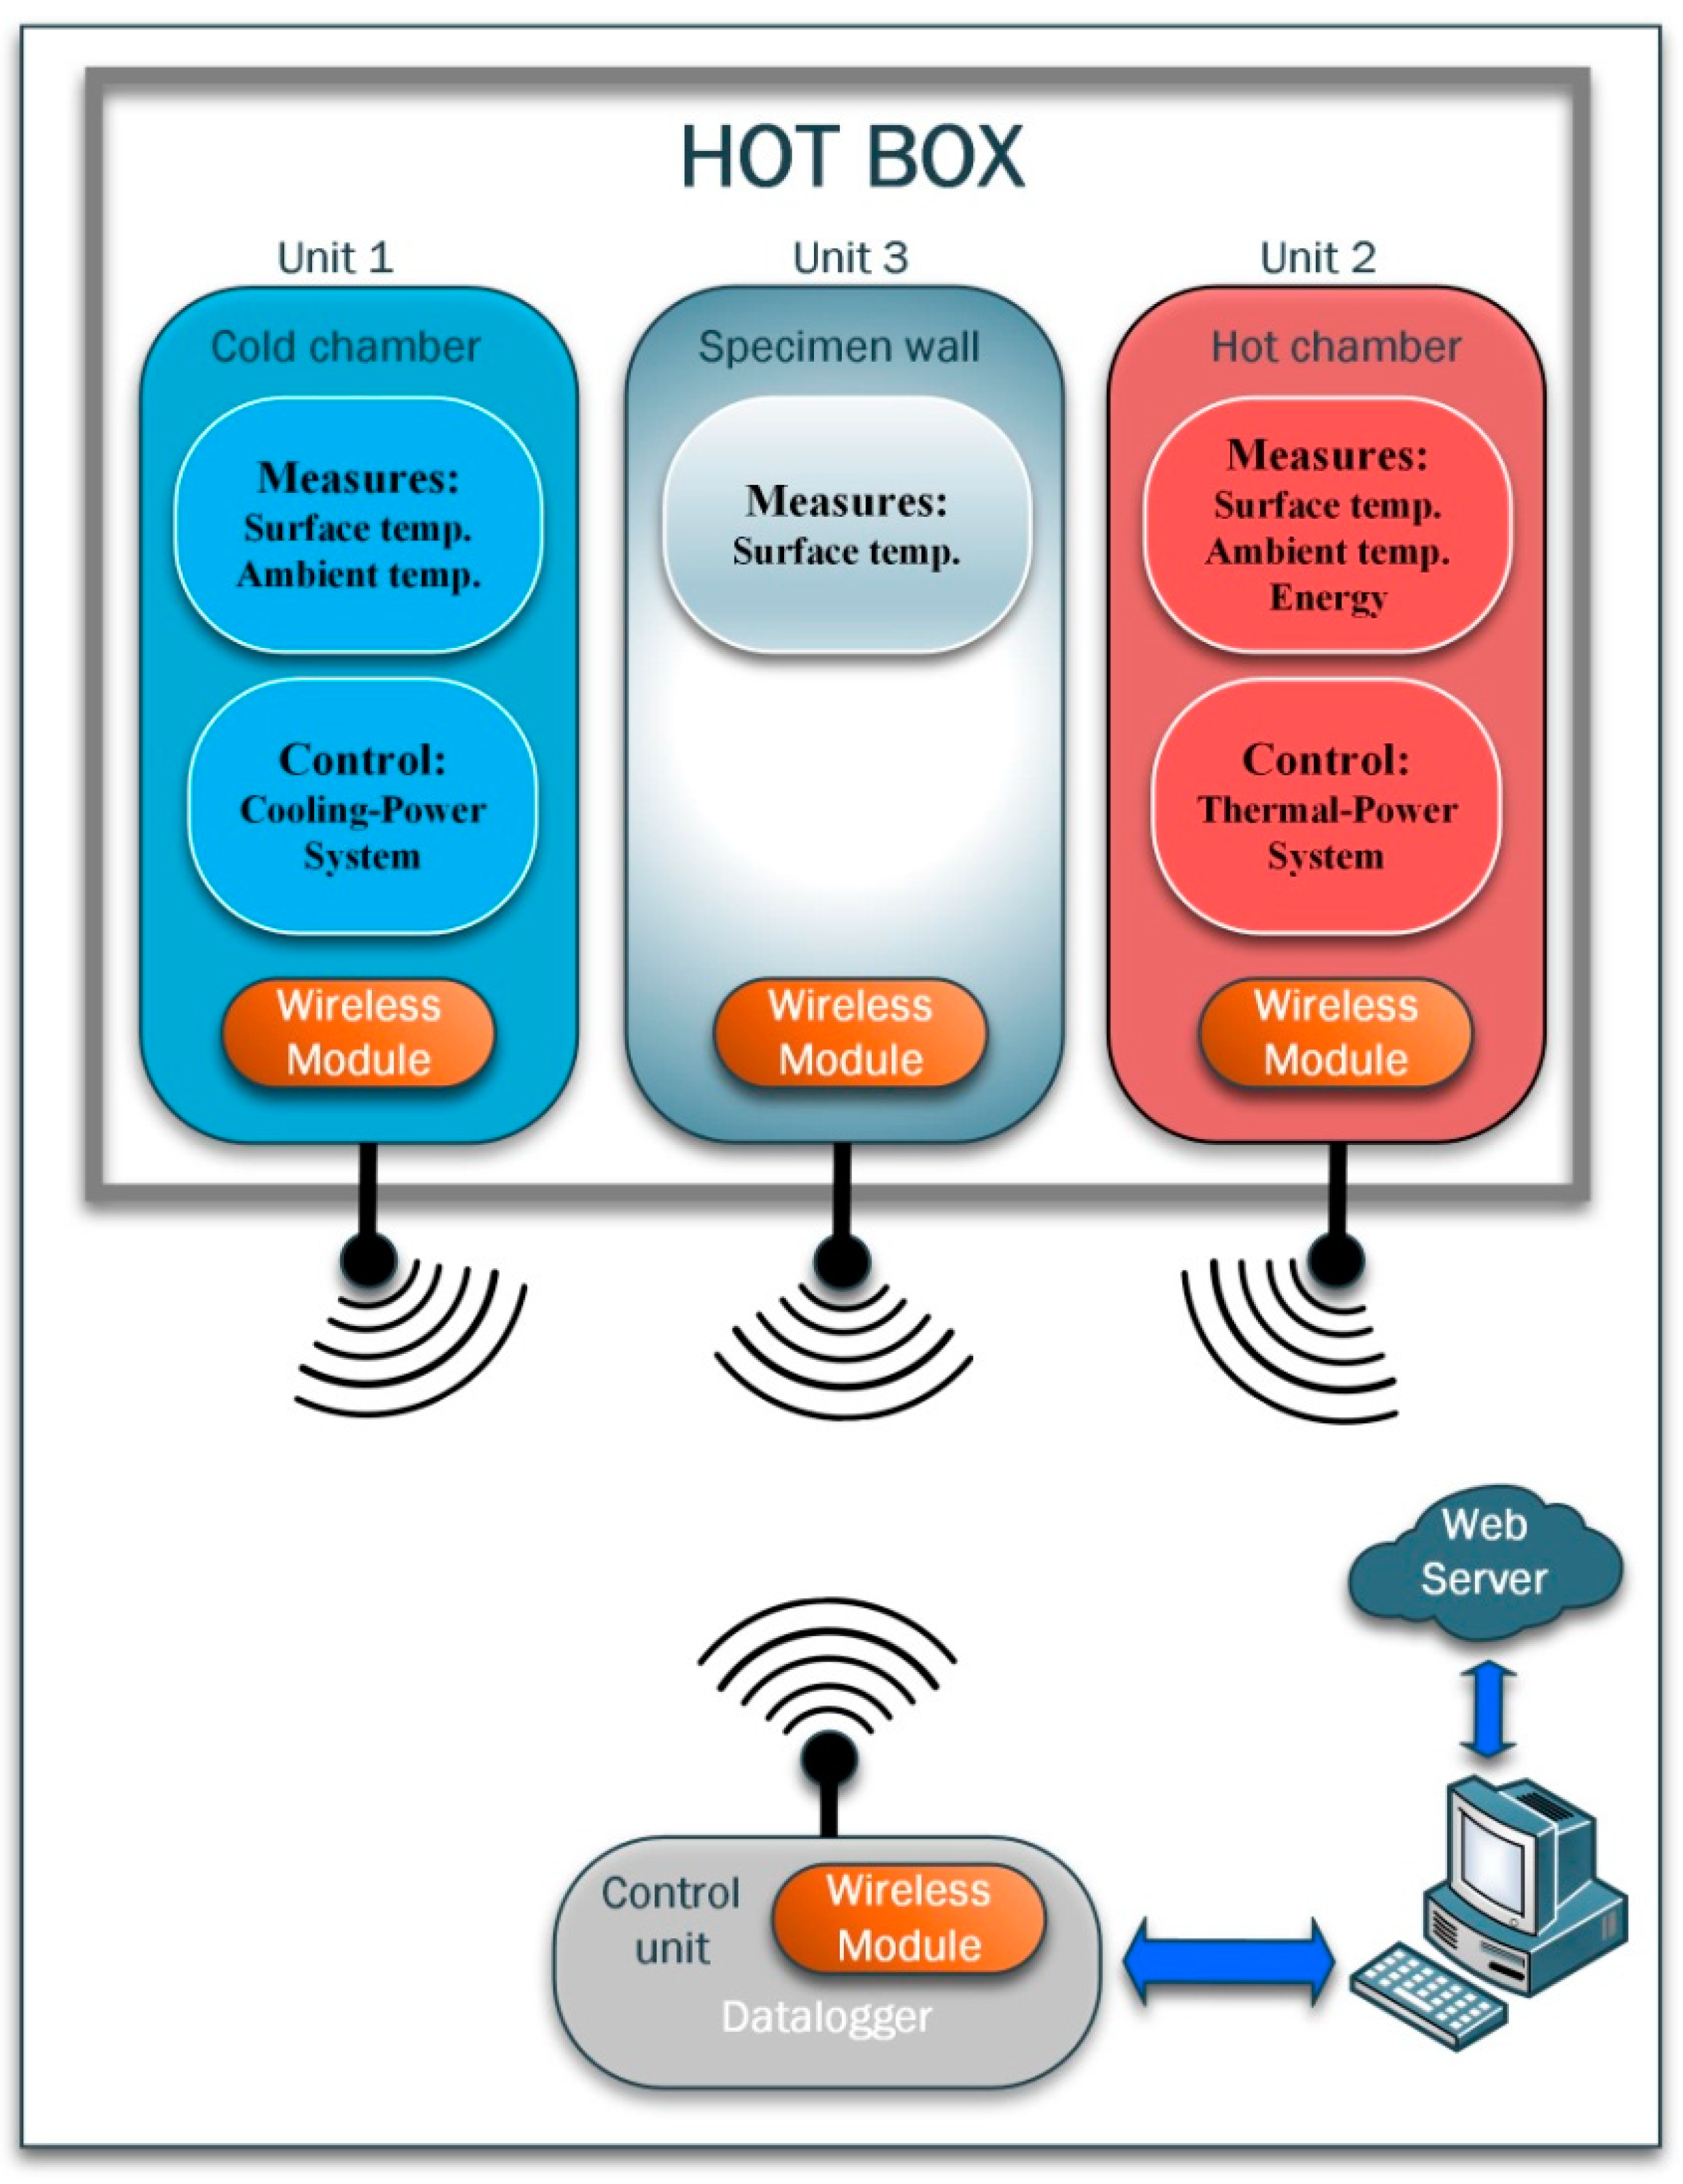
Given the literature background on hot boxes and their weak points, an integrated measuring and control system, based on several sensors and actuators, for laboratory experiments in hot box is presented. The system is made up of a master control unit and three slave units respectively dedicated to cold chamber, hot chamber and specimen wall under analysis (
Figure 2). Through a wireless “ad hoc” protocol, the master unit communicates with the slaves for the parameters setting and for receiving the values measured inside the chambers. The UART (Universal Asynchronous Receiver-Transmitter) protocol is employed to realize a master-PC communication allowing the data post-processing, which are later sent to a web server. Although the data post-processing is obtained through a dedicated designed software, data can be elaborated by any custom object-oriented software. The master control unit can log all the measured values and manage the devices and equipment (slave units) that control thermal conditions inside the chambers. In detail, it allows: (1) to measure ambient and surface temperatures needed to evaluate the thermal models inside the chambers and the thermal properties of the specimen; (2) to measure the energy input for heat up the hot chamber needed to know the heat flux that passes through the sample; (3) to control cooling and thermal-power systems.
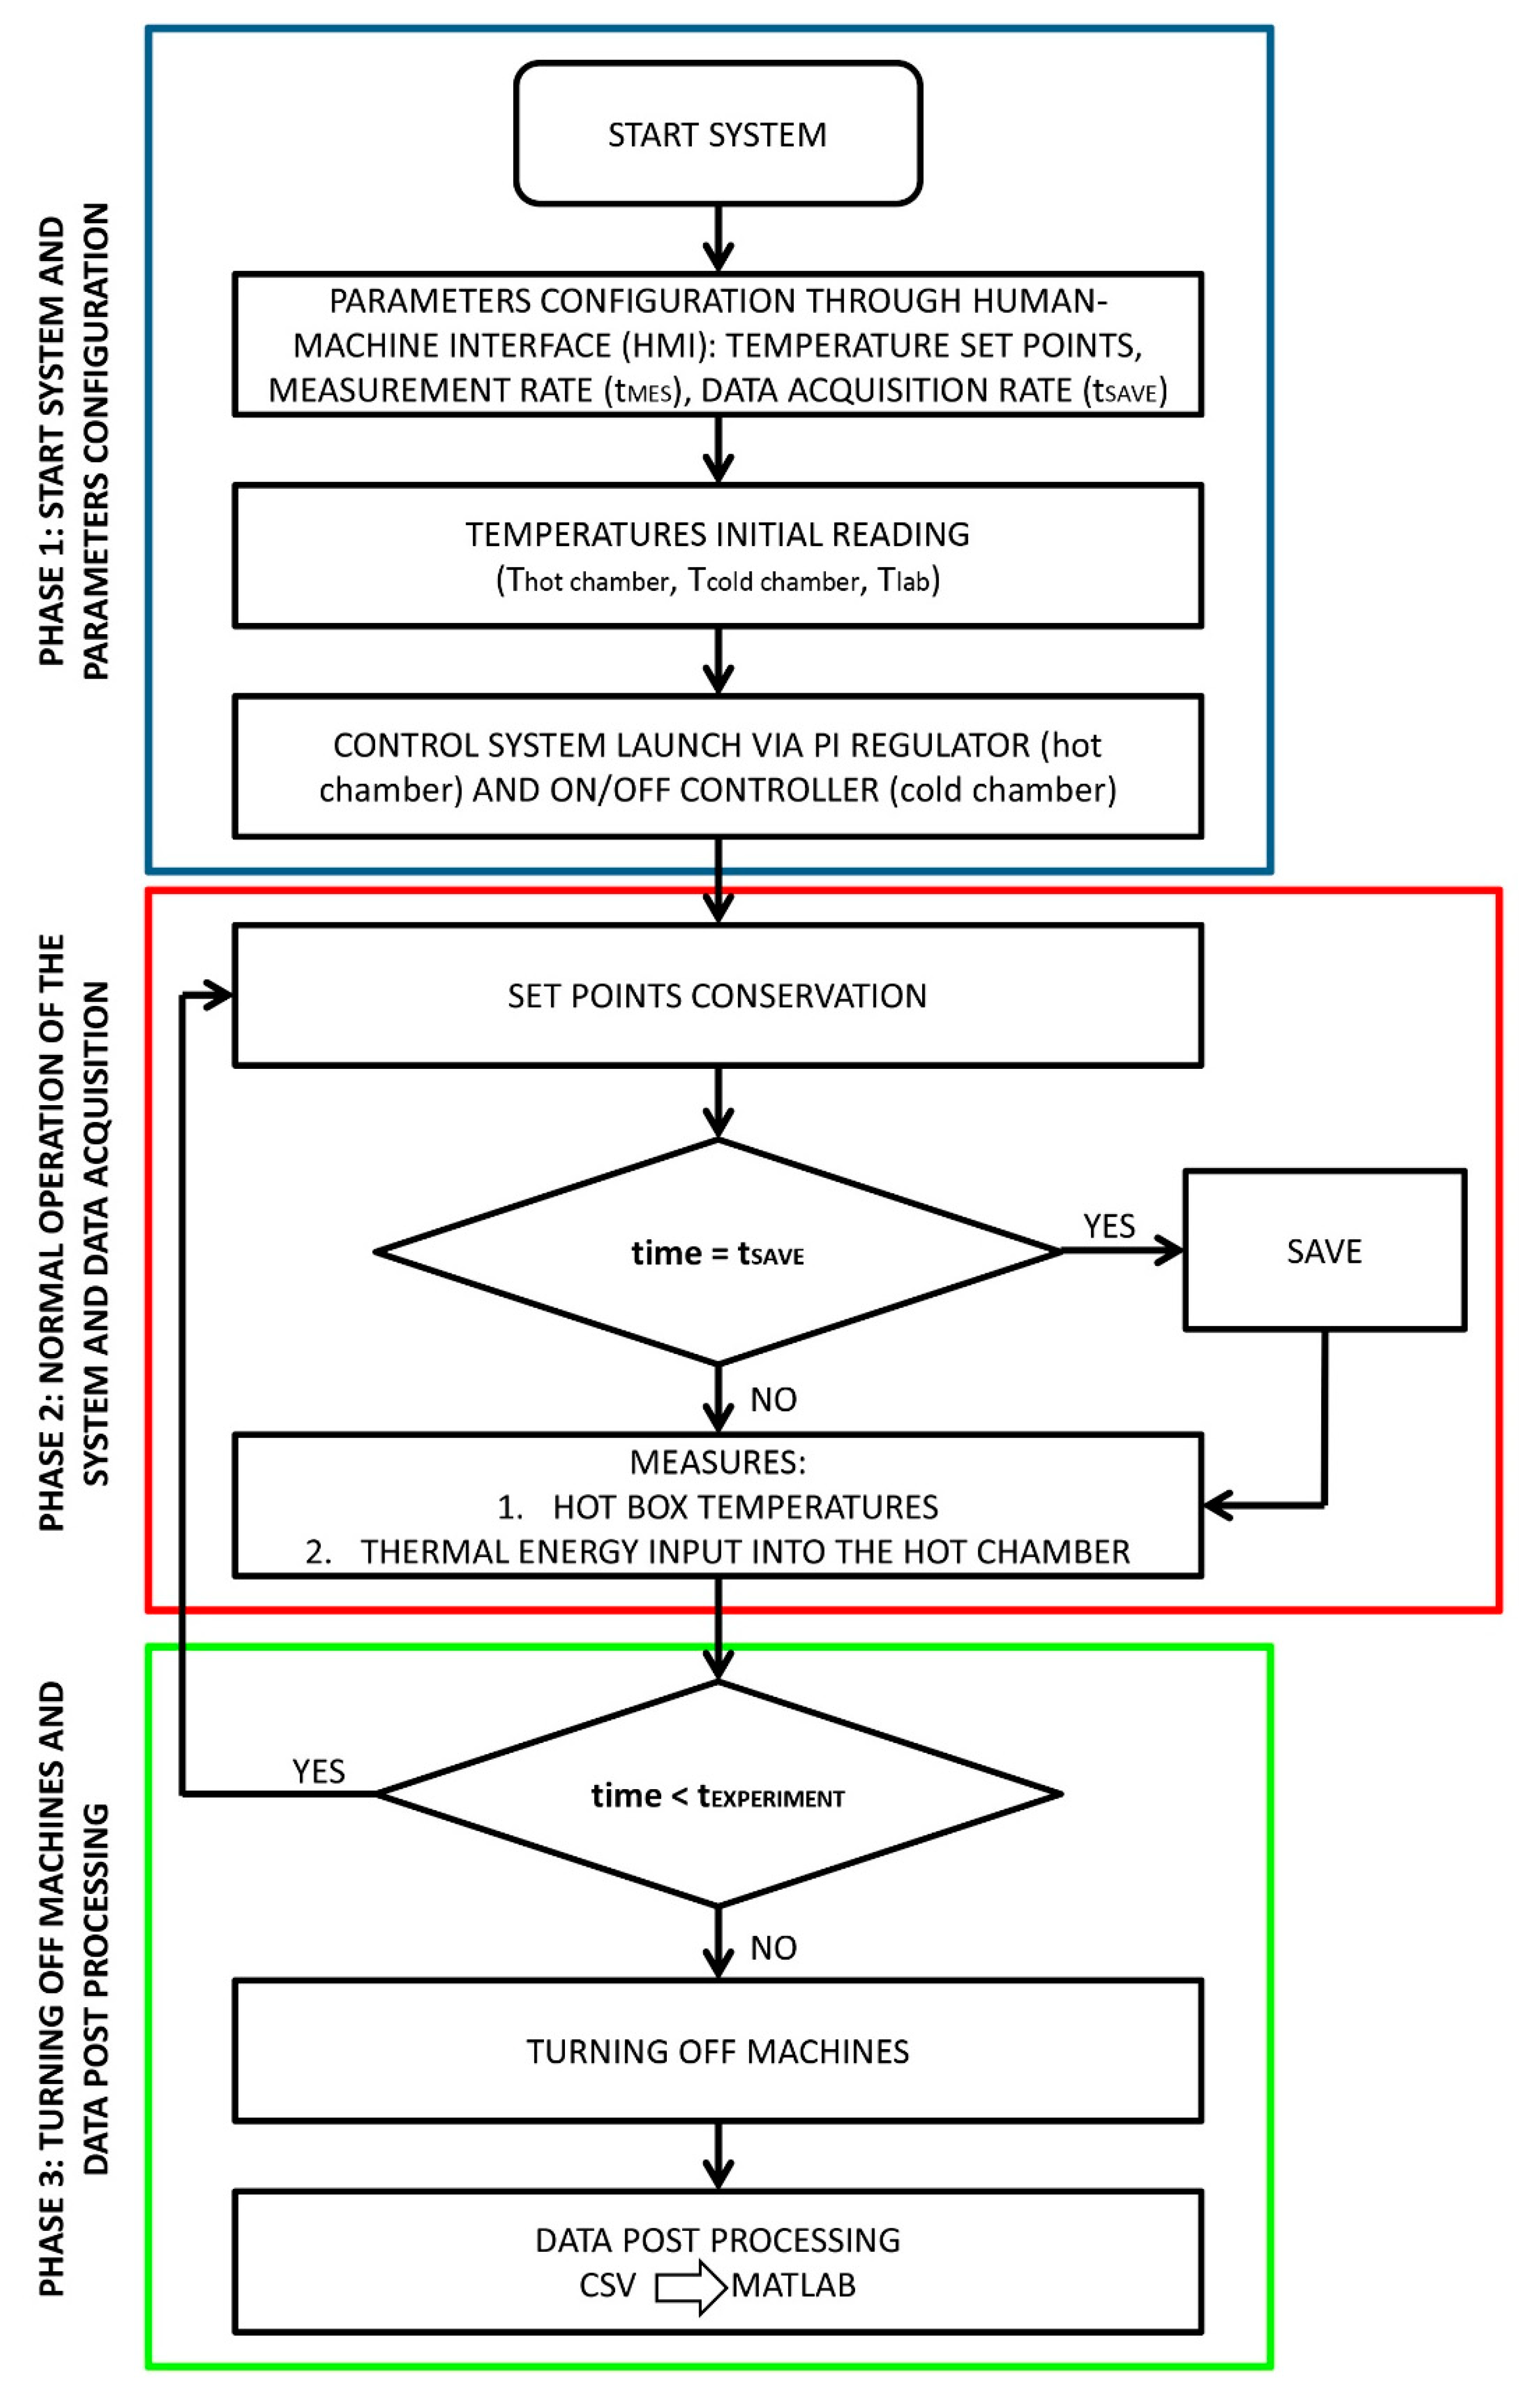
The working principle of the system consists of three distinct phases. The first phase includes the system start up and the configuration of the parameters of interest (temperatures set points, data acquisition and measurement rates) through a Human-Machine Interface (HMI). In the second phase, the system maintains the desired conditions controlling the machines that equip the hot box and, at the same time, acquiring the measured data. In the third and last phase, the post-processing of the data takes place thanks to a semi-automatic interaction between the system algorithm and a dedicated MATLAB
® code. An overall schematic of the system operating phases is shown in
Figure 3.
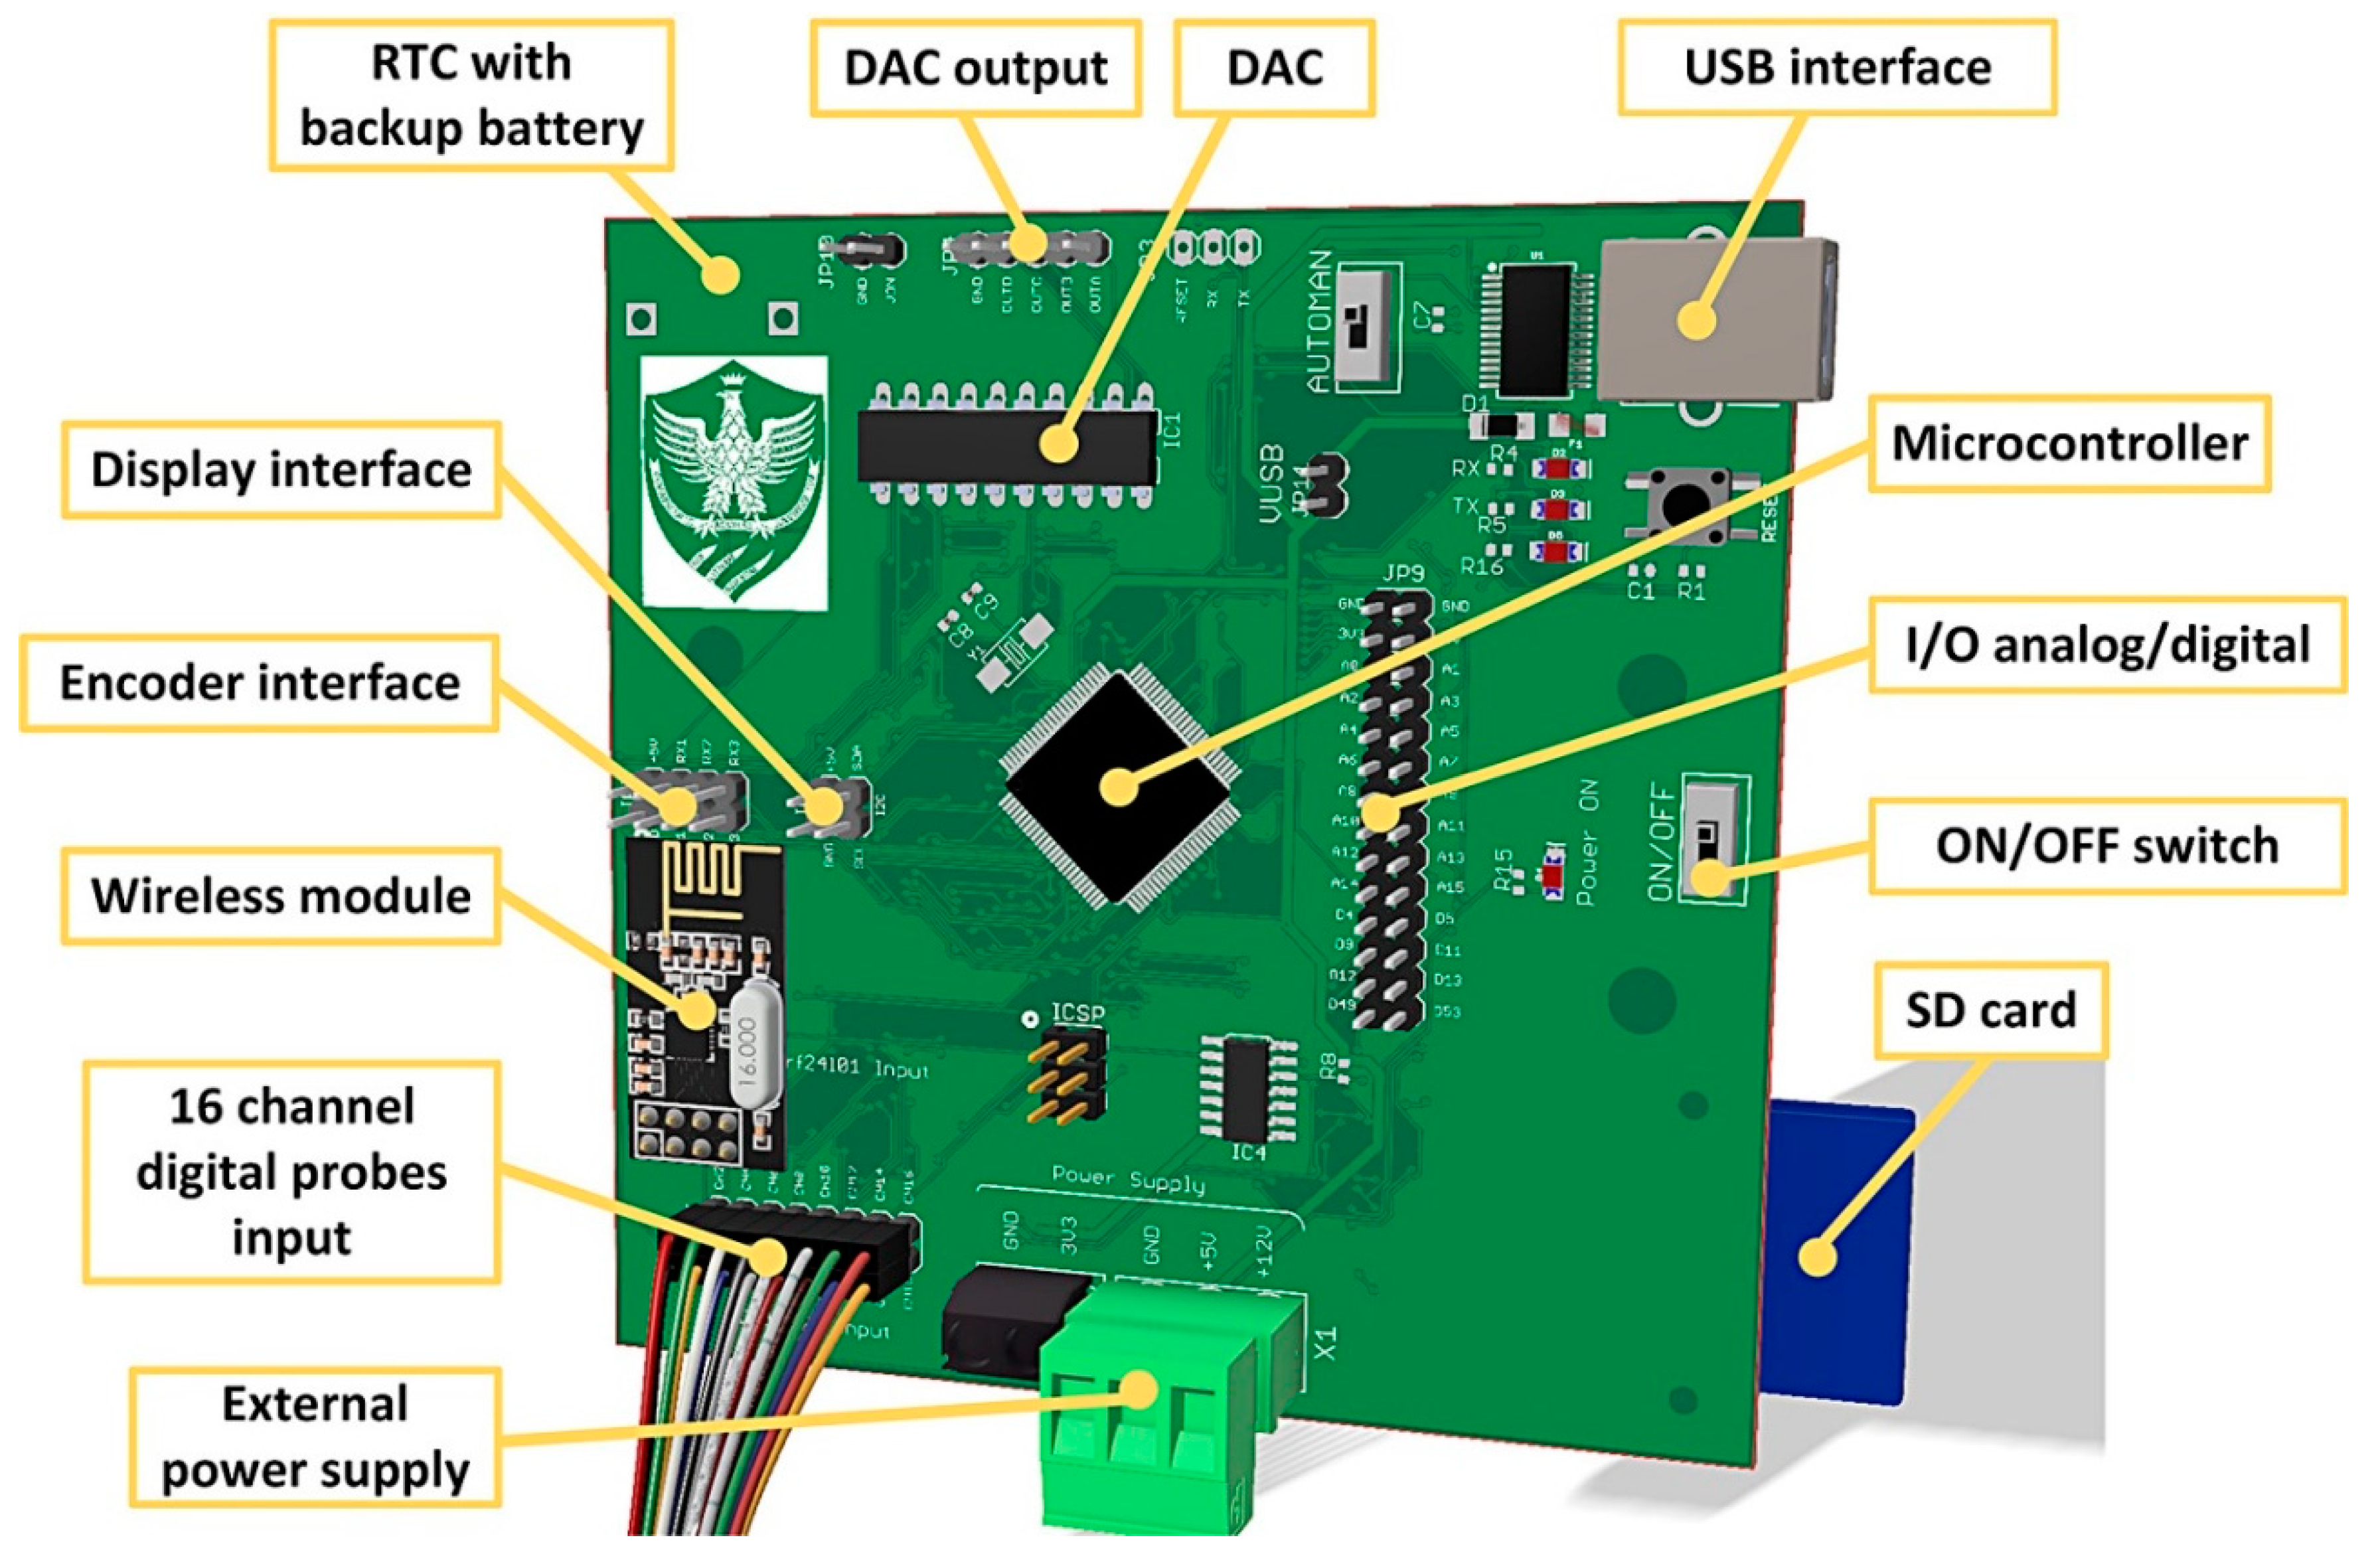
To give a universal feature to the system, each unit has the same PCB (printed circuit board), based on a general-purpose microcontroller ATmega2560 for the input/output (I/O) control management. Therefore, each control unit has enabled only the specific I/Os to its functionality. The PCB is programmable via USB port, it has an external DAC (digital analog converter) device for the hot chamber regulation and a digital output for the cold chamber control. Moreover, the system is equipped with an SD card reader for the data backup, 16 input channels for digital probes, a built-in wireless module, a real time clock (RTC) with a backup battery to work when there is no power supply, and additional connectable I/Os usable for any system upgrade. All the units are supplied by external power sources.
A 3D view of the board employed for the system is shown in
Figure 4.
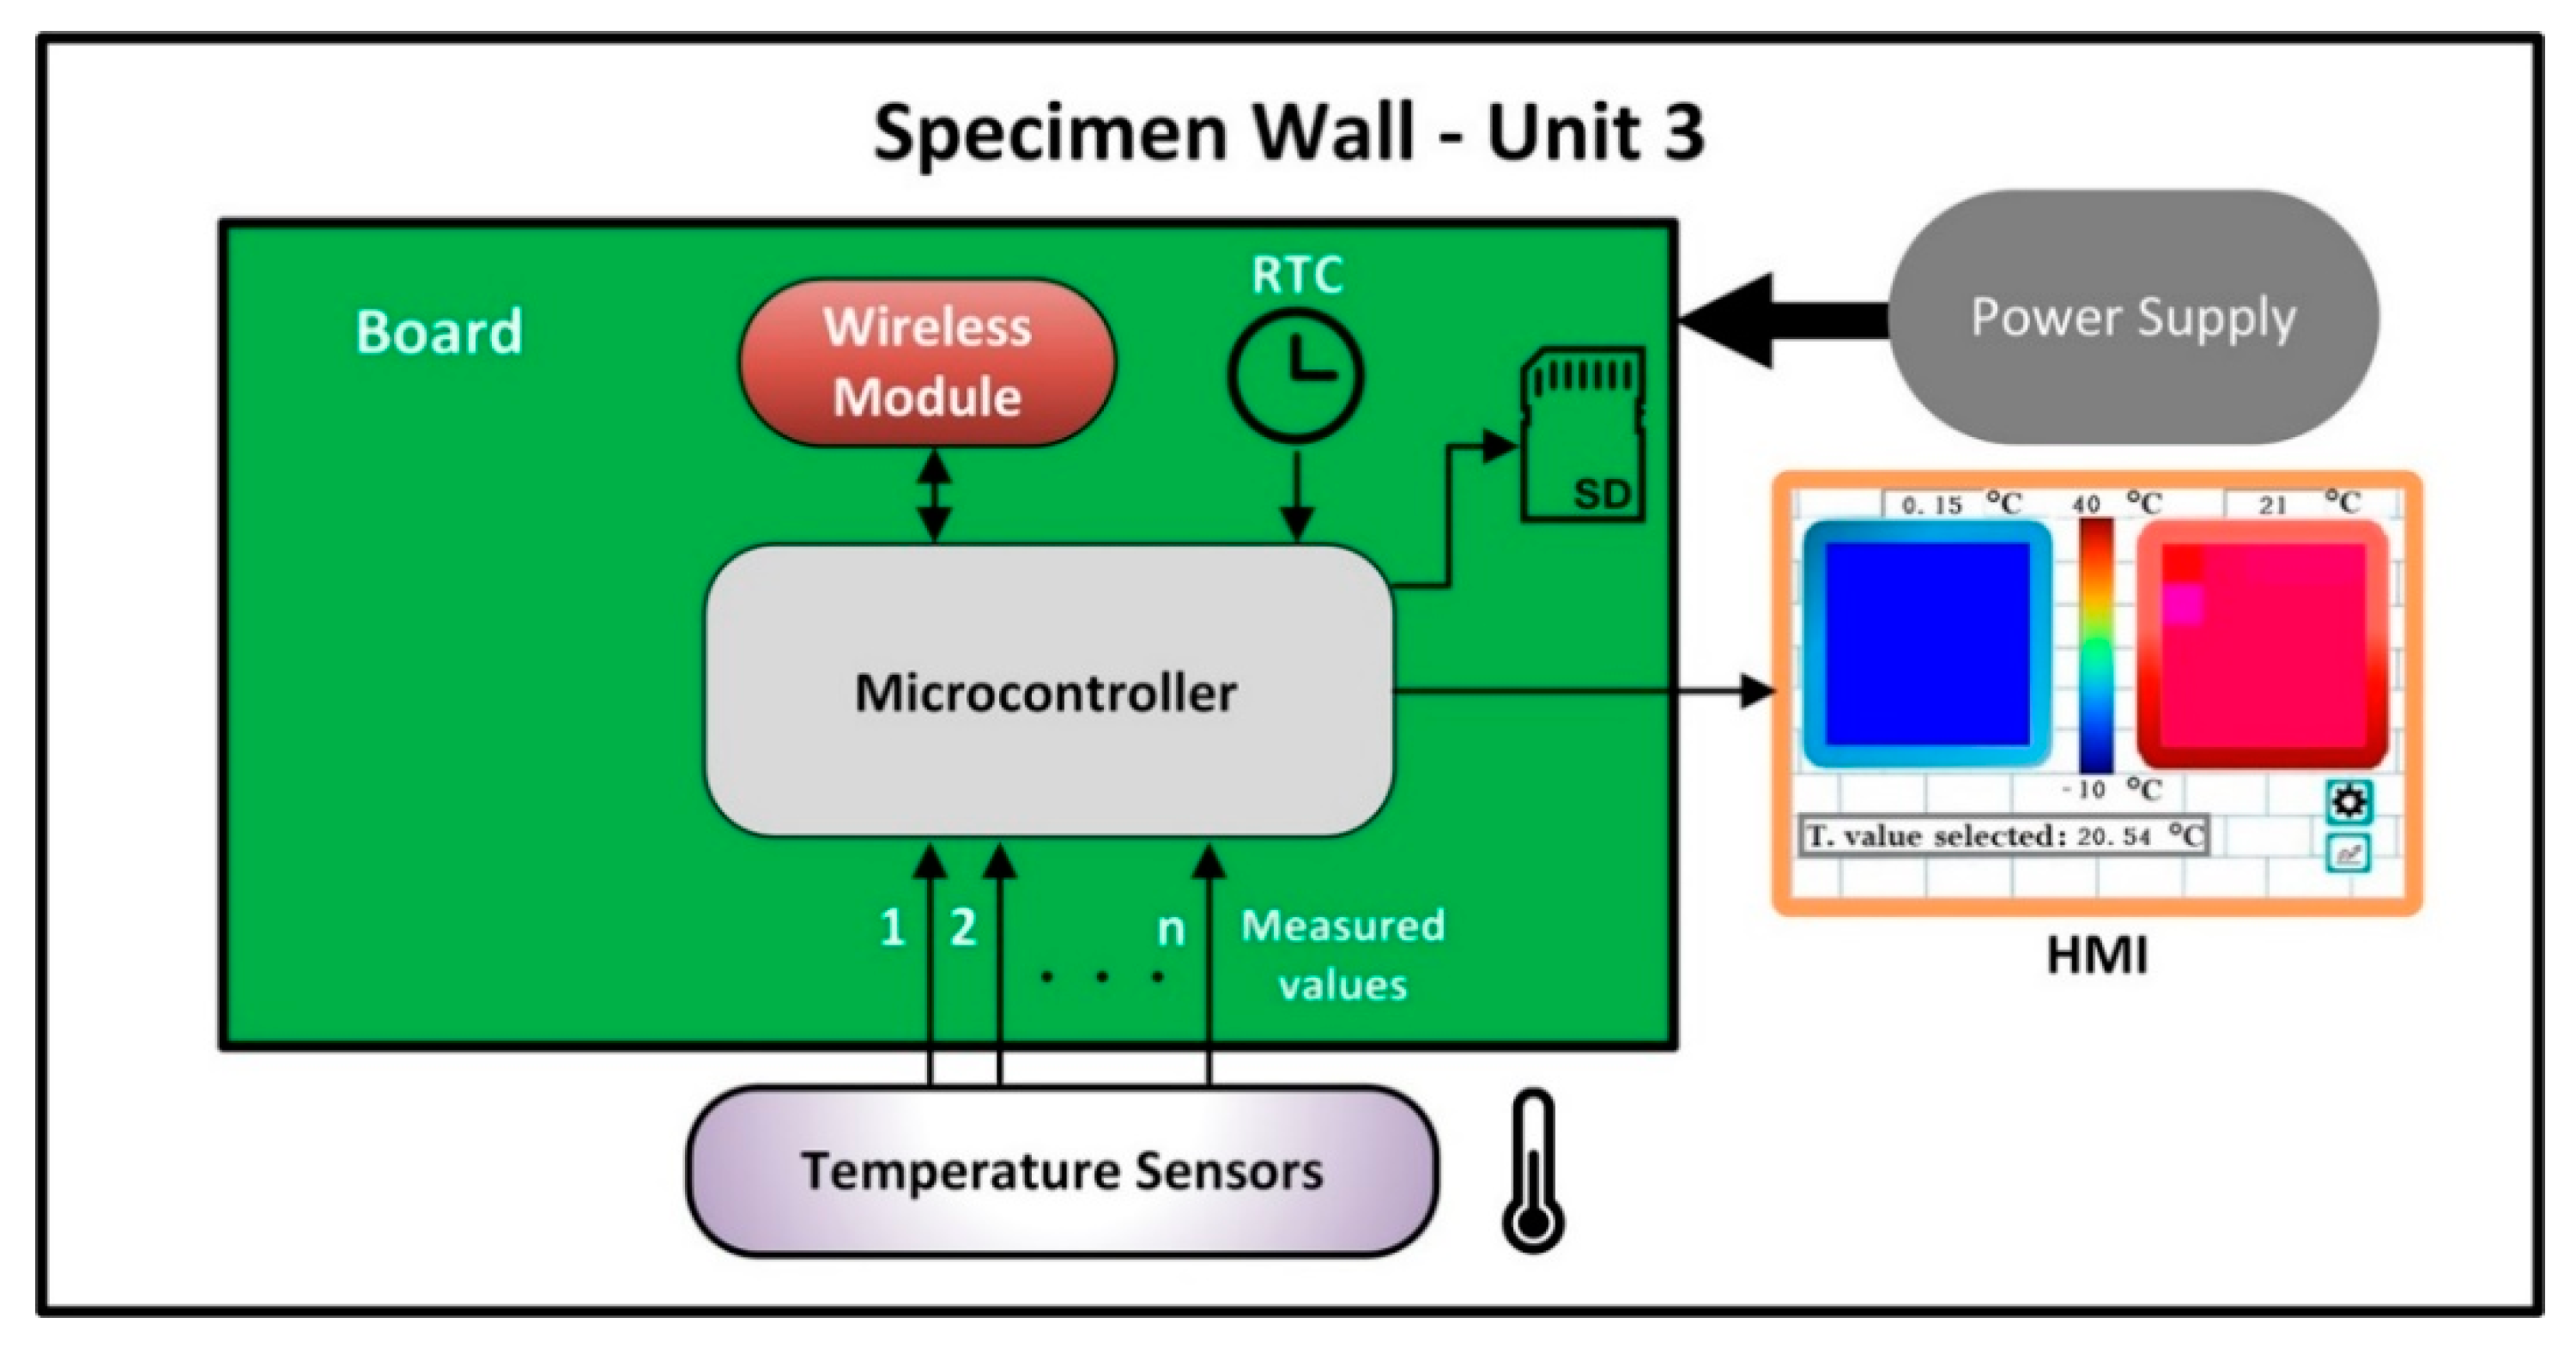
In detail, the unit dedicated to the specimen wall (
Figure 5) allows to measure the surface temperature values of both sides of the sample. The probes distribution has been divided into two channels having 25 probes each to minimize the number of cables and simplify their installation. The real-time visualization of the surfaces thermal models of the sample is carried out through an HMI, consisting of a 3.5″ touch display, with a designed graphical interface. The touch display interrogation permits to show the surface temperature value corresponding to a specific probe, both with a numerical value and by means of a false-color scale. The spatial discretization reproduced on the touch panel is the same of that chosen for the probes’ installation, which in our case is equal to 50 × 50 cm.
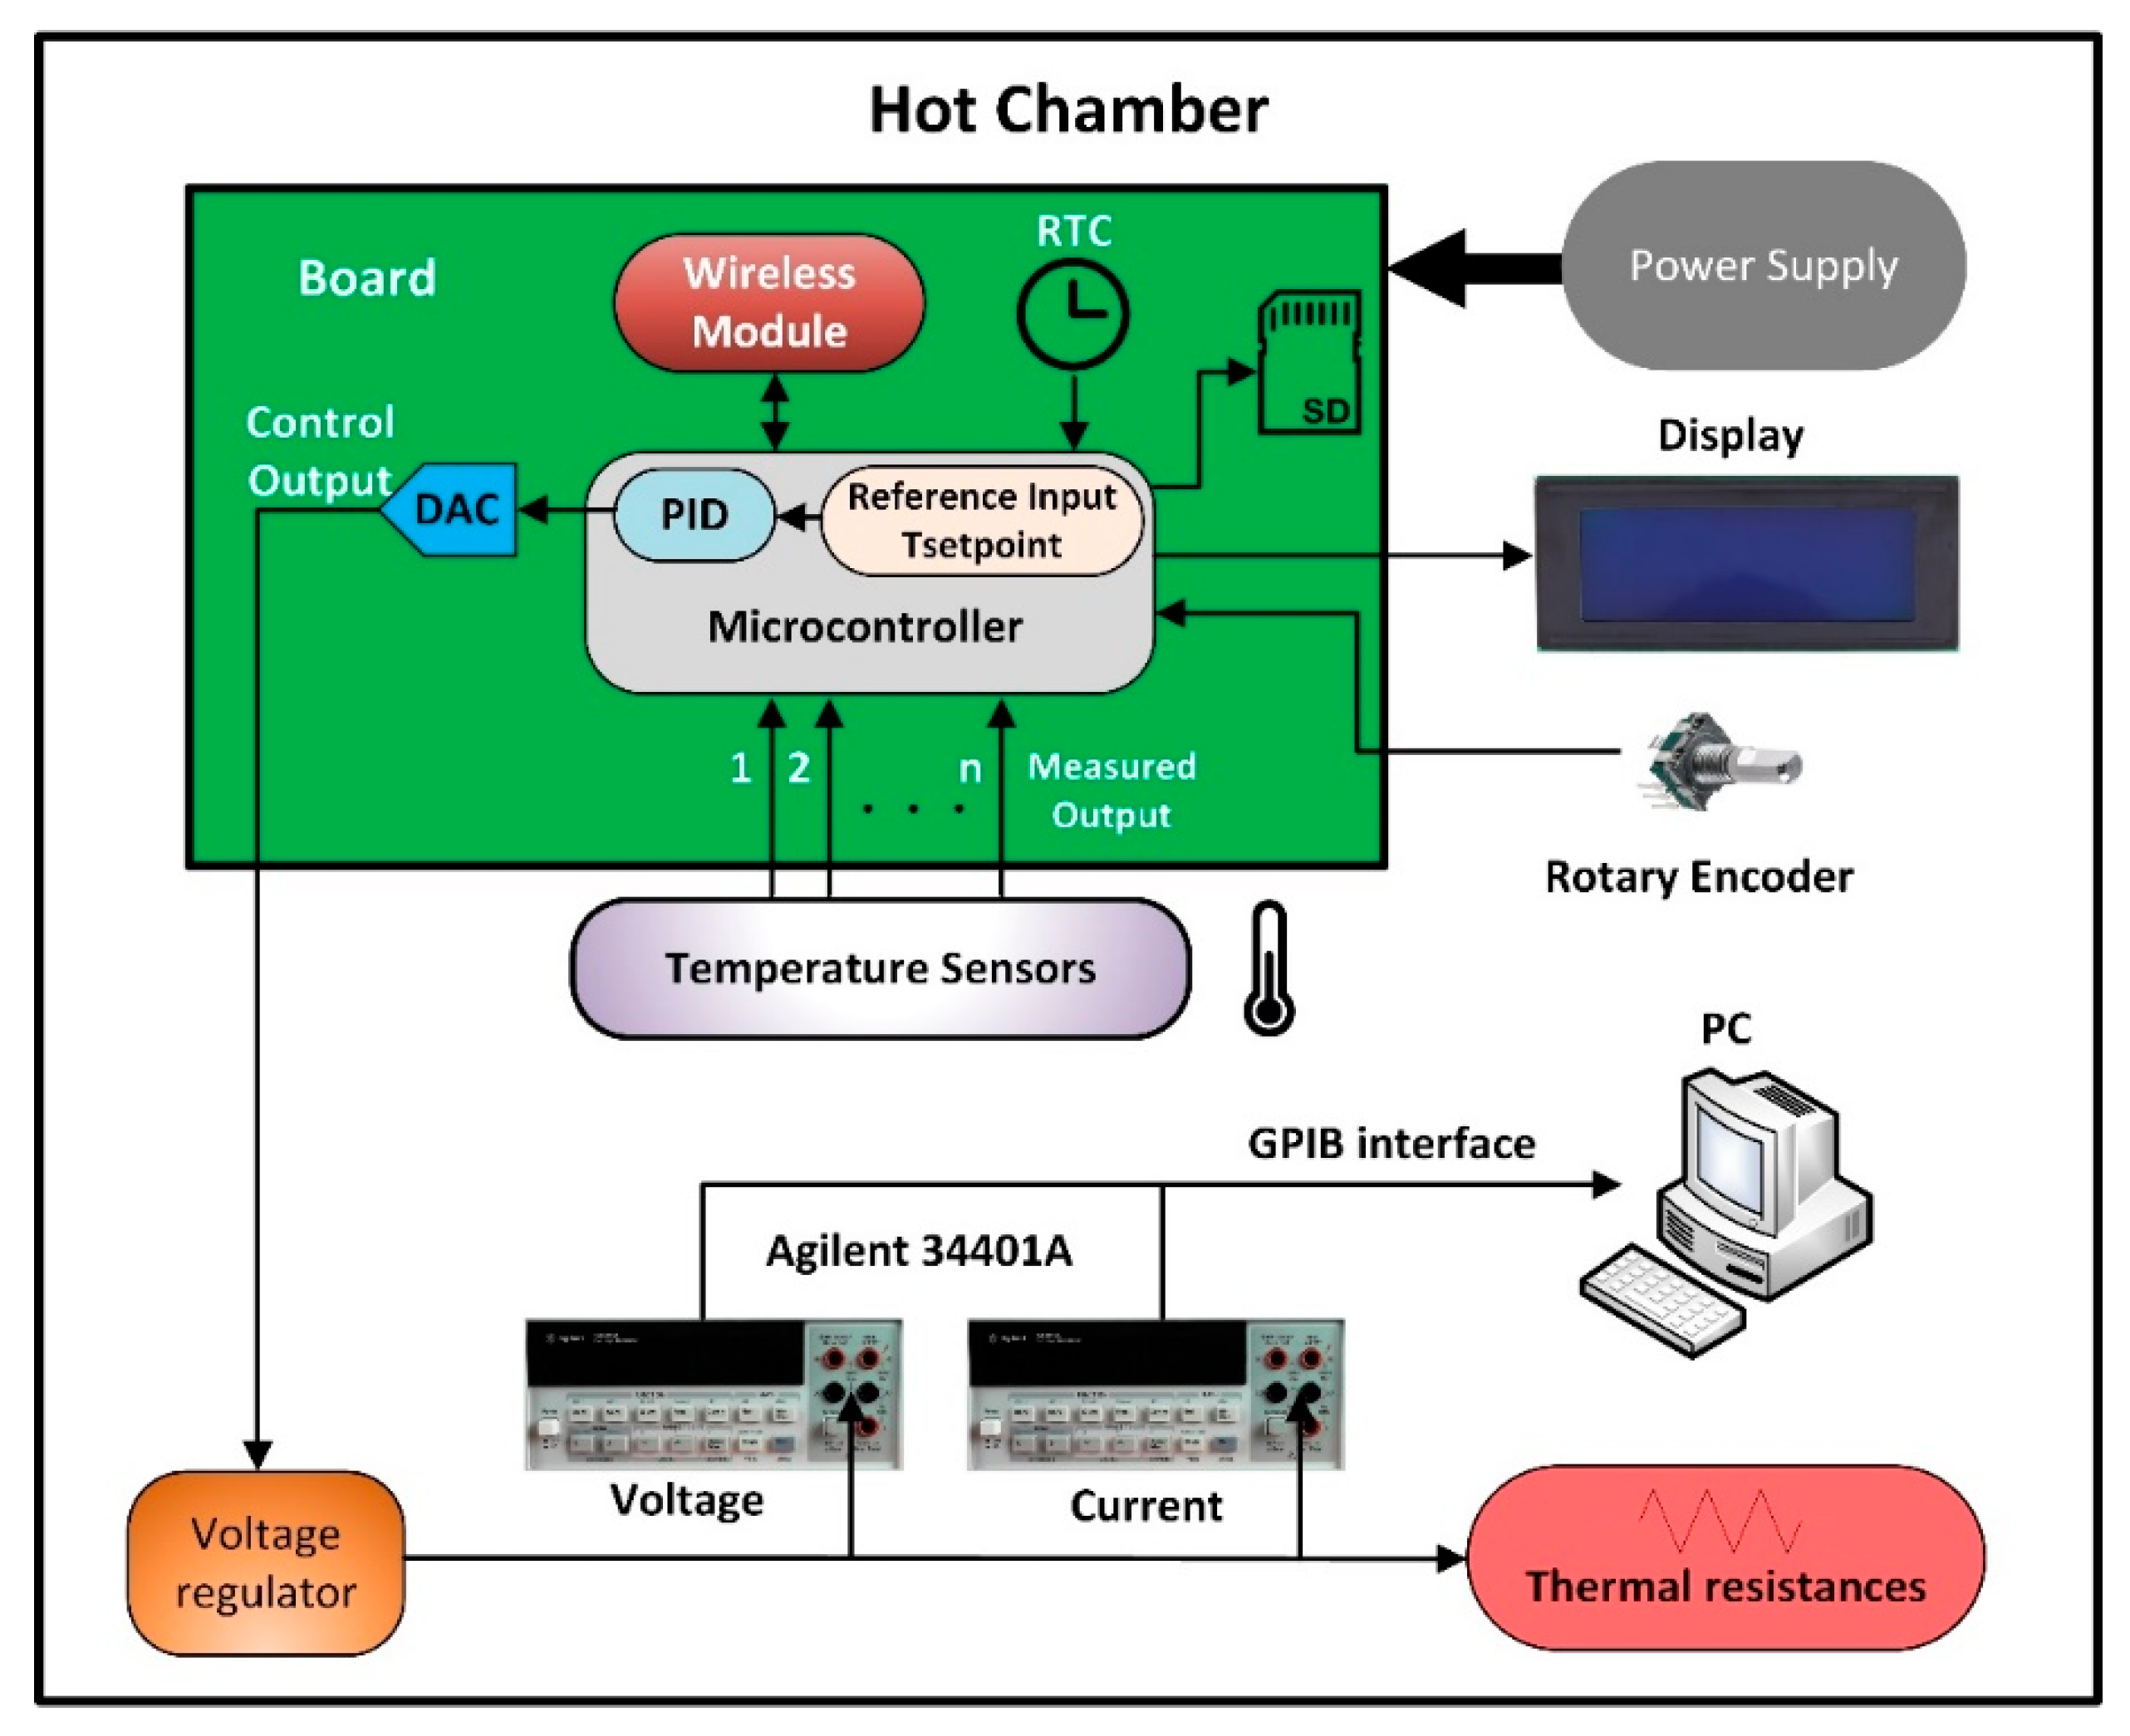
The PCB of the hot chamber control unit (
Figure 6) is the most complex, due to the many measurement and control operations it must carry out. Indeed, unlike the unit of the specimen wall, which performs only measuring actions, the hot chamber unit allows to control the machines that equip the chamber and measure both temperatures (surface and ambient) and thermal energy input. All these operations take place simultaneously. The thermal energy is input into the hot chamber by means of electric resistances (Joule effect), to achieve and maintain the pursued set point temperature. The electric resistances control happens through a PI (proportional-integral) regulator, whose algorithm has been implemented on the microcontroller. The PI parameters were determined by means of the Ziegler-Nichols method [
44]. The control phase is performed by voltage regulation of the electric resistances thanks to a full AC wave control circuit, managed by a trigger module. Specifically, the trigger module controls the gates of the full AC wave control circuit components modulating the output voltage. The input control voltage of the trigger module ranges from 0 to 5 V and it is generated by an external 8-bit parallel DAC managed by the microcontroller via eight digital outputs. The measurement of the energy fed into the hot chamber occurs through a current-voltage method by means of two Agilent 34401A instruments connected to a computer via GPIB interface.
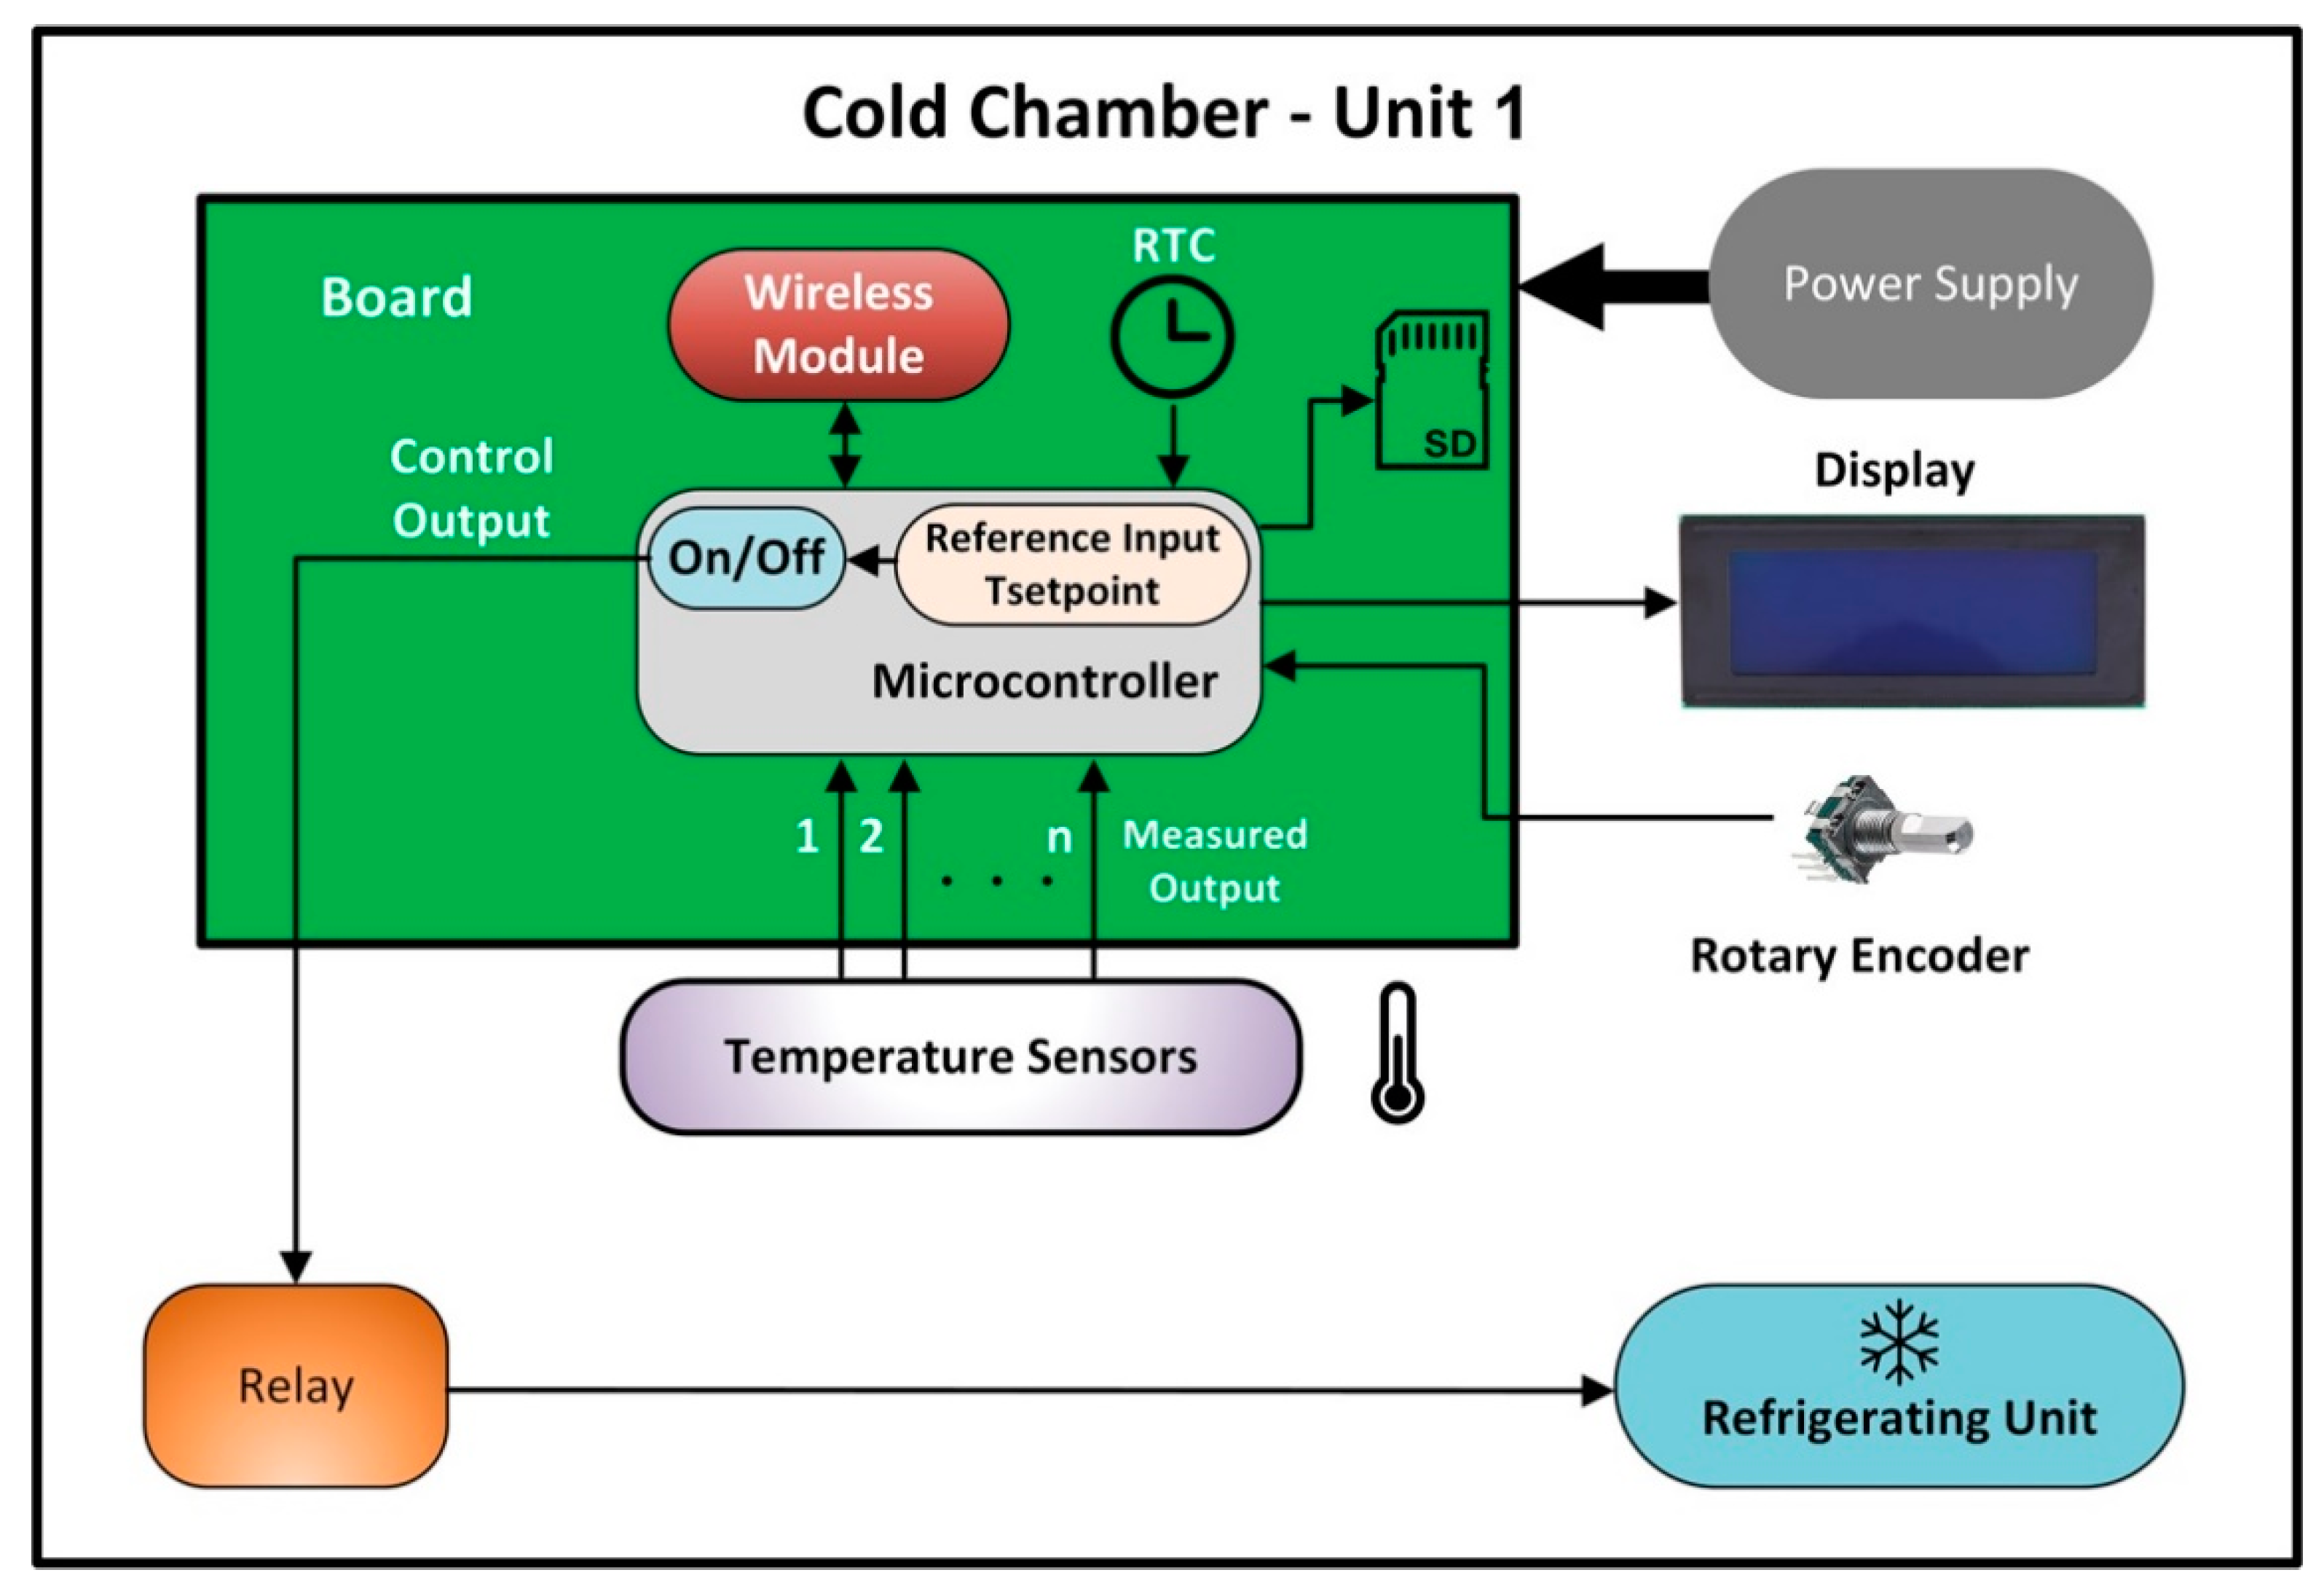
Analogously to what described for the hot chamber, the cold chamber control unit (
Figure 7) permits to perform simultaneously temperature measurements (surface and ambient) and the management of the refrigerating unit that provides the necessary energy for maintaining the wished temperature set point. The microcontroller regulates the cold chamber temperature by means of an on/off control of the refrigerating unit operating on a relay.
Unlike what usually happens with traditional hot box controllers, the architecture of the proposed control units of both the chambers allows to choose the reference temperature probes (surface or ambient) to be used for the wished set point temperature control. Moreover, to guarantee high measurements precision and high flexibility of the system employment, the number of probes can be arbitrarily increased (without the need for further hardware components) and the procedures for parameters configuration (set-point temperatures, acquisition time rate, etc.) can be performed run-time, without interrupting the normal system operation. The control unit parameters configuration takes place via rotary encoder and their visualization on 20 × 4 LCD displays.
The temperature sensors chosen for the proposed system are the DS18B20 digital thermometers of Maxim Integrated [
45]. These probes, frequently employed for thermal experiments [
46], communicate with a proprietary 1-Wire protocol that allow to connect many probes on the same data line simplifying the installation phase. Moreover, being digital sensors, they are not affected by disturbances on the transmission lines. This choice allows to use long connection cables (order of 100 m) avoiding the employment of specific matching circuits, as it happens for thermocouples and RTDs (Resistance Temperature Detectors) sensors. The digital thermometers operate in the range 3–5.5 V and their temperature interval ranges between −55 °C and 125 °C with a settable resolution. With a 12-bit resolution the analog-digital conversion time is equal to 750 ms. Each sensor univocally has a 64-bit address identified by the microcontroller. This feature is appropriate when the system has many sensors because they can be connected on the same bus allowing theoretically infinite devices. The digital thermometers DS18B20 allow to receive a broadcast command by the microcontroller in order to obtain the same start conversion time for the probes connected along the bus.
The current consumption of the digital sensors is equal to 750 nA, in idle mode, and 1 mA, in conversion mode. The worst case happens when all the probes are in conversion mode. During the normal operation, the system, without considering probes, has a current absorption equal to 100 mA and, when the wireless transmission is activated, the electric consumption grows up to 500 mA.
4. Application on a Real Case
In this section, the sample wall, the probes arrangement, and the results of the experimental test obtained through the application of the proposed measuring and control system are presented.
4.1. Sample Wall Description
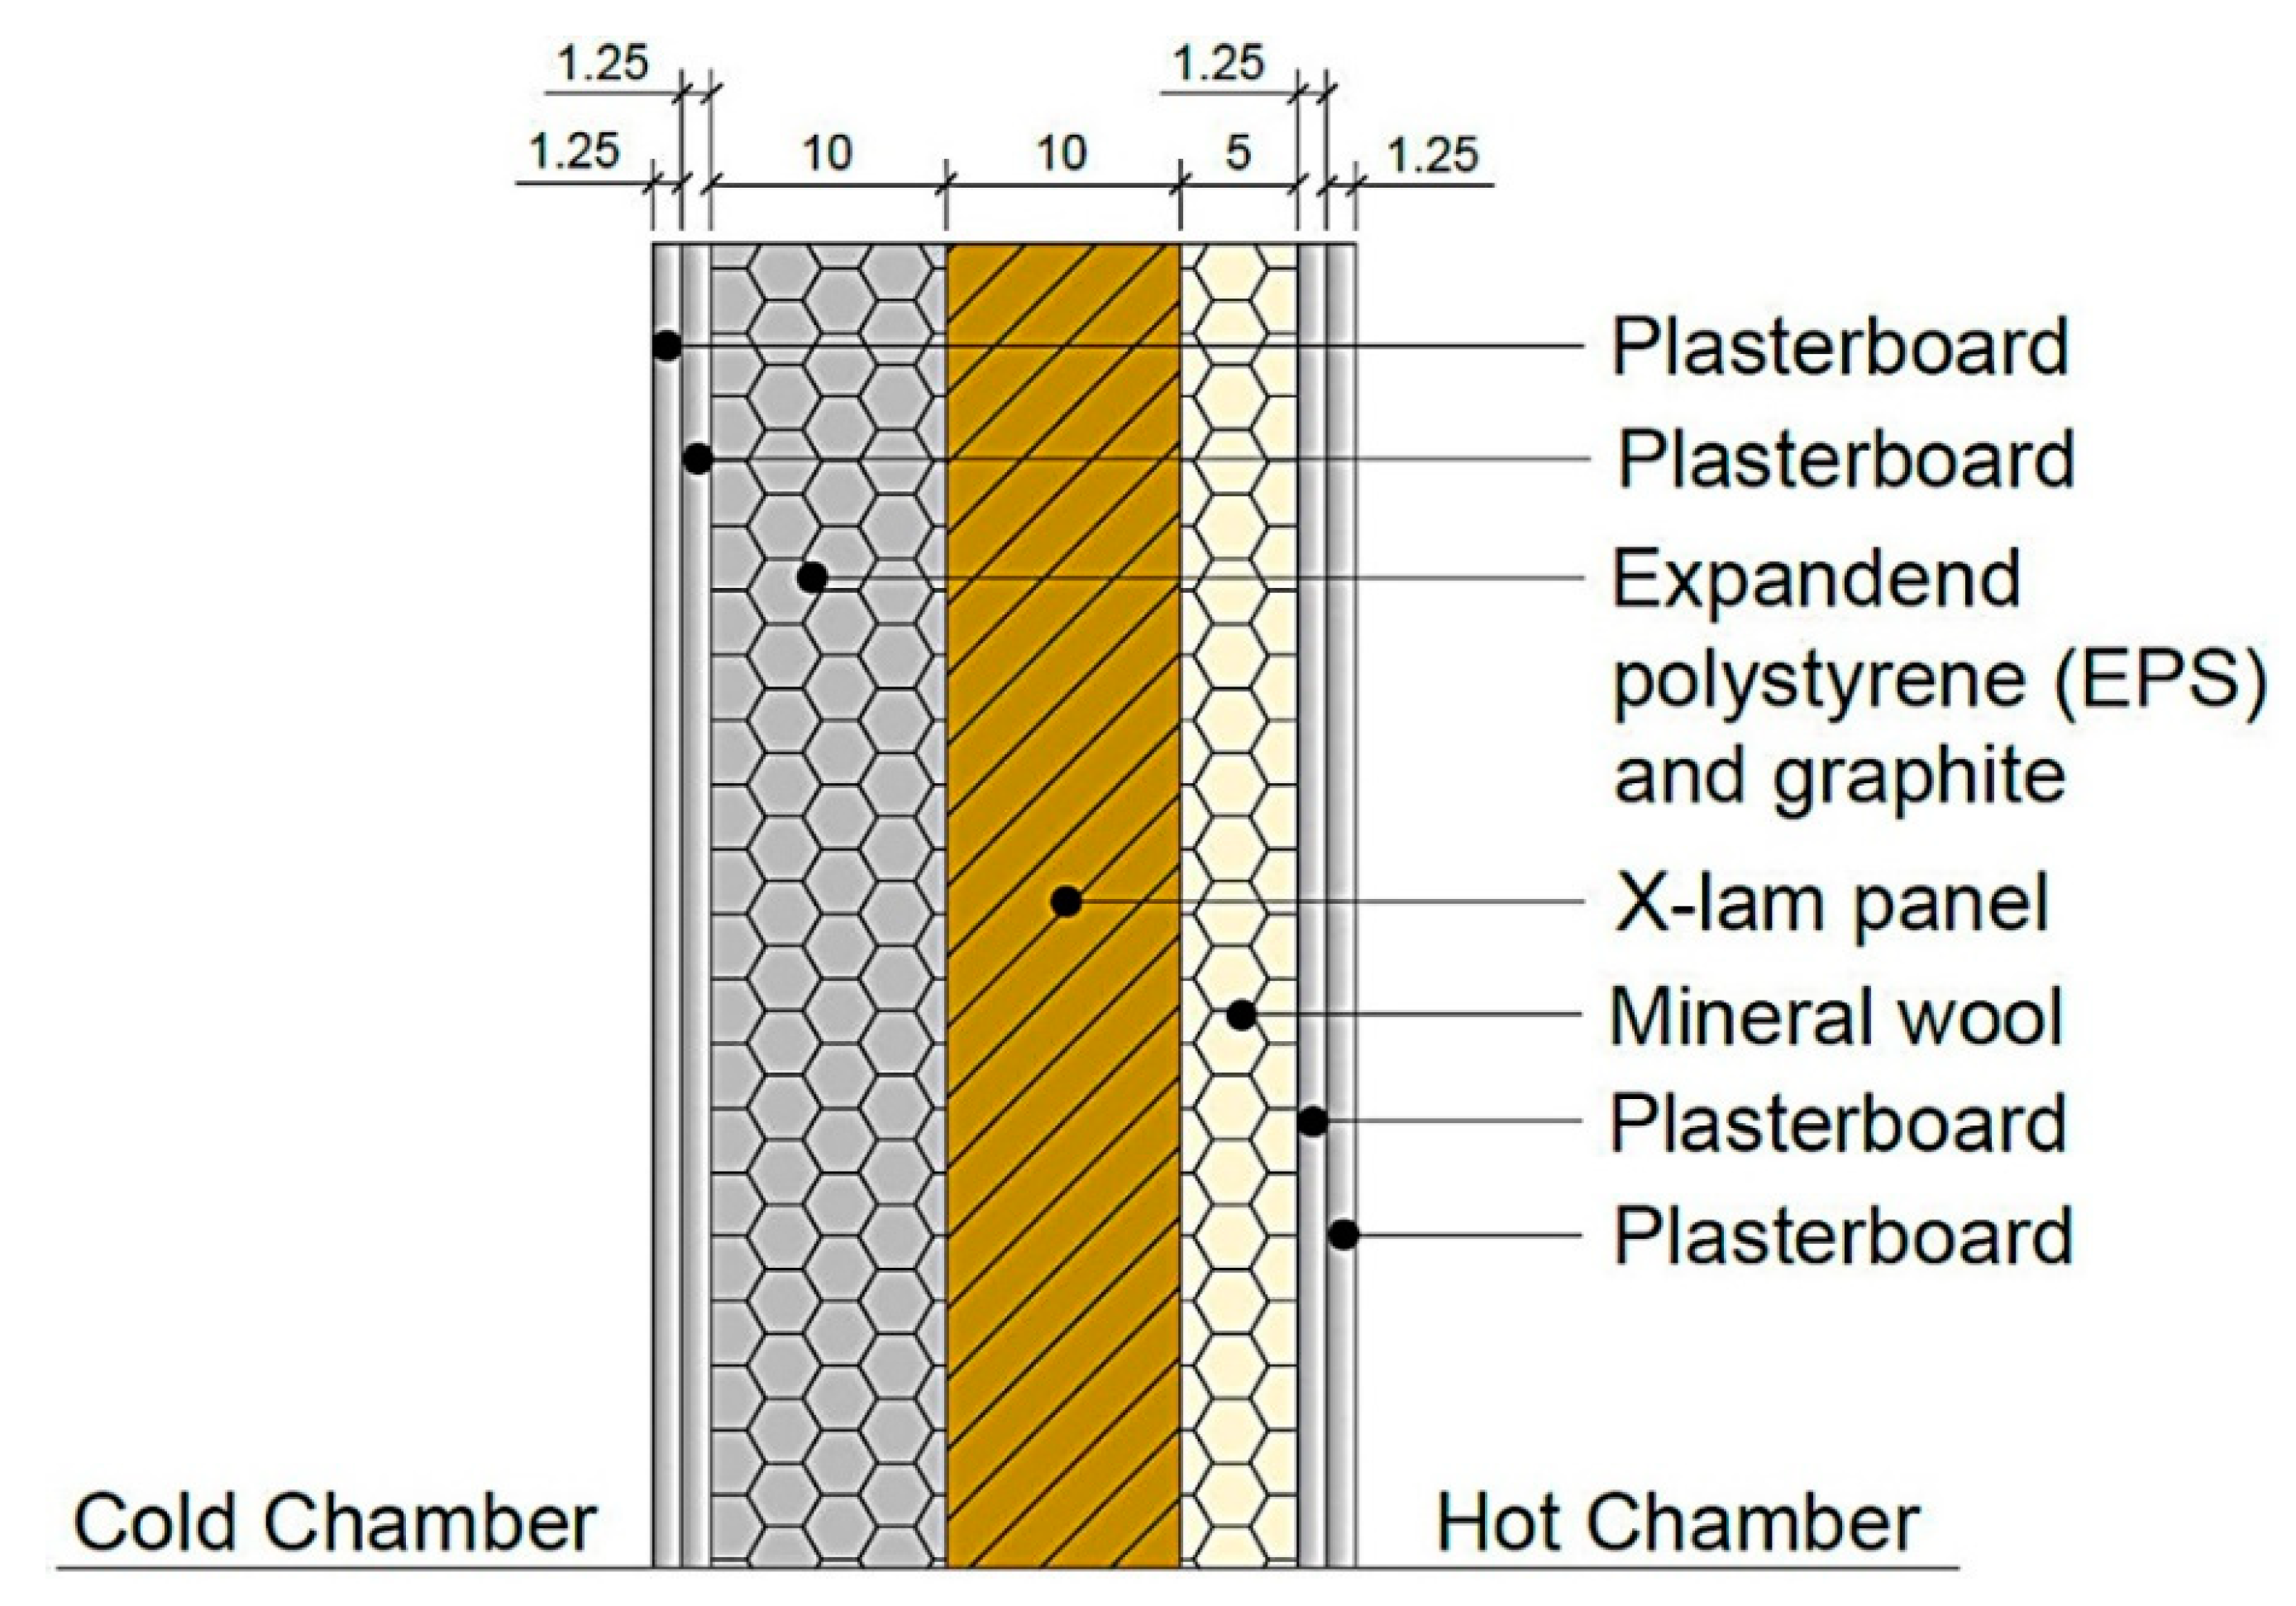
The specimen wall (
Figure 8) is constituted by a double insulation X-lam bearing member, also known as CLT (Cross Laminated Timber). This type of specimen was chosen to test the energy performance of rather innovative walls that, thanks to their energy and seismic properties, can represent an alternative to the classic masonry walls. Indeed, the employment of new materials for the building envelope is experiencing a growing spread [
47]. The specimen has real dimensions equal to 300 × 300 cm. The X-lam panel is made up of solid wood with crossed layers (several superimposed layers glued one on the other), so that the grain of each layer is rotated in the plane of 90° with respect to the adjacent layers. Each layer is made up of dried spruce boards. The side of the wall facing the hot chamber is insulated with mineral wool, while the other one has expanded polystyrene (EPS) mixed with graphite. The X-lam panel and the insulation layers are sandwiched between double plasterboard layers.
The thermal properties of the wall’s layers and the calculated thermal resistance (according to ISO 6946 [
48]) of the wall are shown in
Table 2.
4.2. Sensors Arrangement
The hot box was equipped with 135 sensors to measure surface and ambient temperatures including the temperature inside the laboratory. An overall view of the hot box with the sample wall and the installed temperature probes is shown in
Figure 9a. Each side of the sample wall was equipped with 25 probes (symmetrically positioned on the two sides), in a grid 5 by 5 probes (
Figure 9b). The internal surfaces of the cold chamber had a total of 42 temperature sensors, while the internal walls of the metering box had 24 probes. To calculate the mean radiative temperature, both in hot and cold chambers, the temperatures of the apparatus surfaces “seen from the specimen” (baffles) must be known. Therefore, 9 surface temperature sensors were installed in the cold chamber and 6 probes in the hot chamber; although the probes number differs, requirements of UNI EN ISO 8990 [
12], already explained in
Section 2, have been fulfilled. Both chambers and laboratory have been equipped with ambient temperature probes.
4.3. Results of the Measuring and Control System Application
The testing phase of the system had a total duration of 88 h, from 1st March at 10:20 am to 5th March at 2:20 am, 2019. If the initial achievement of the steady-state condition and the thermal equilibrium of the hot box after the machines turning off are not considered, the actual duration of the test was 72 h. The turning on of the electric resistances and the introduction of the thermal energy into the hot chamber have led to a temperature increase, until the set point value, equal to 20 °C, was reached. The thermal conditions of the cold chamber were regulated by the refrigeration unit, also activated by the measuring and control system, until reaching the set point value equal to 0 °C. The parameters configuration of the test is summarized in
Table 3. In this experimental phase, the control of the machines was carried out by means of the ambient temperature probes of metering and cold boxes, although this choice is arbitrary and non-binding.
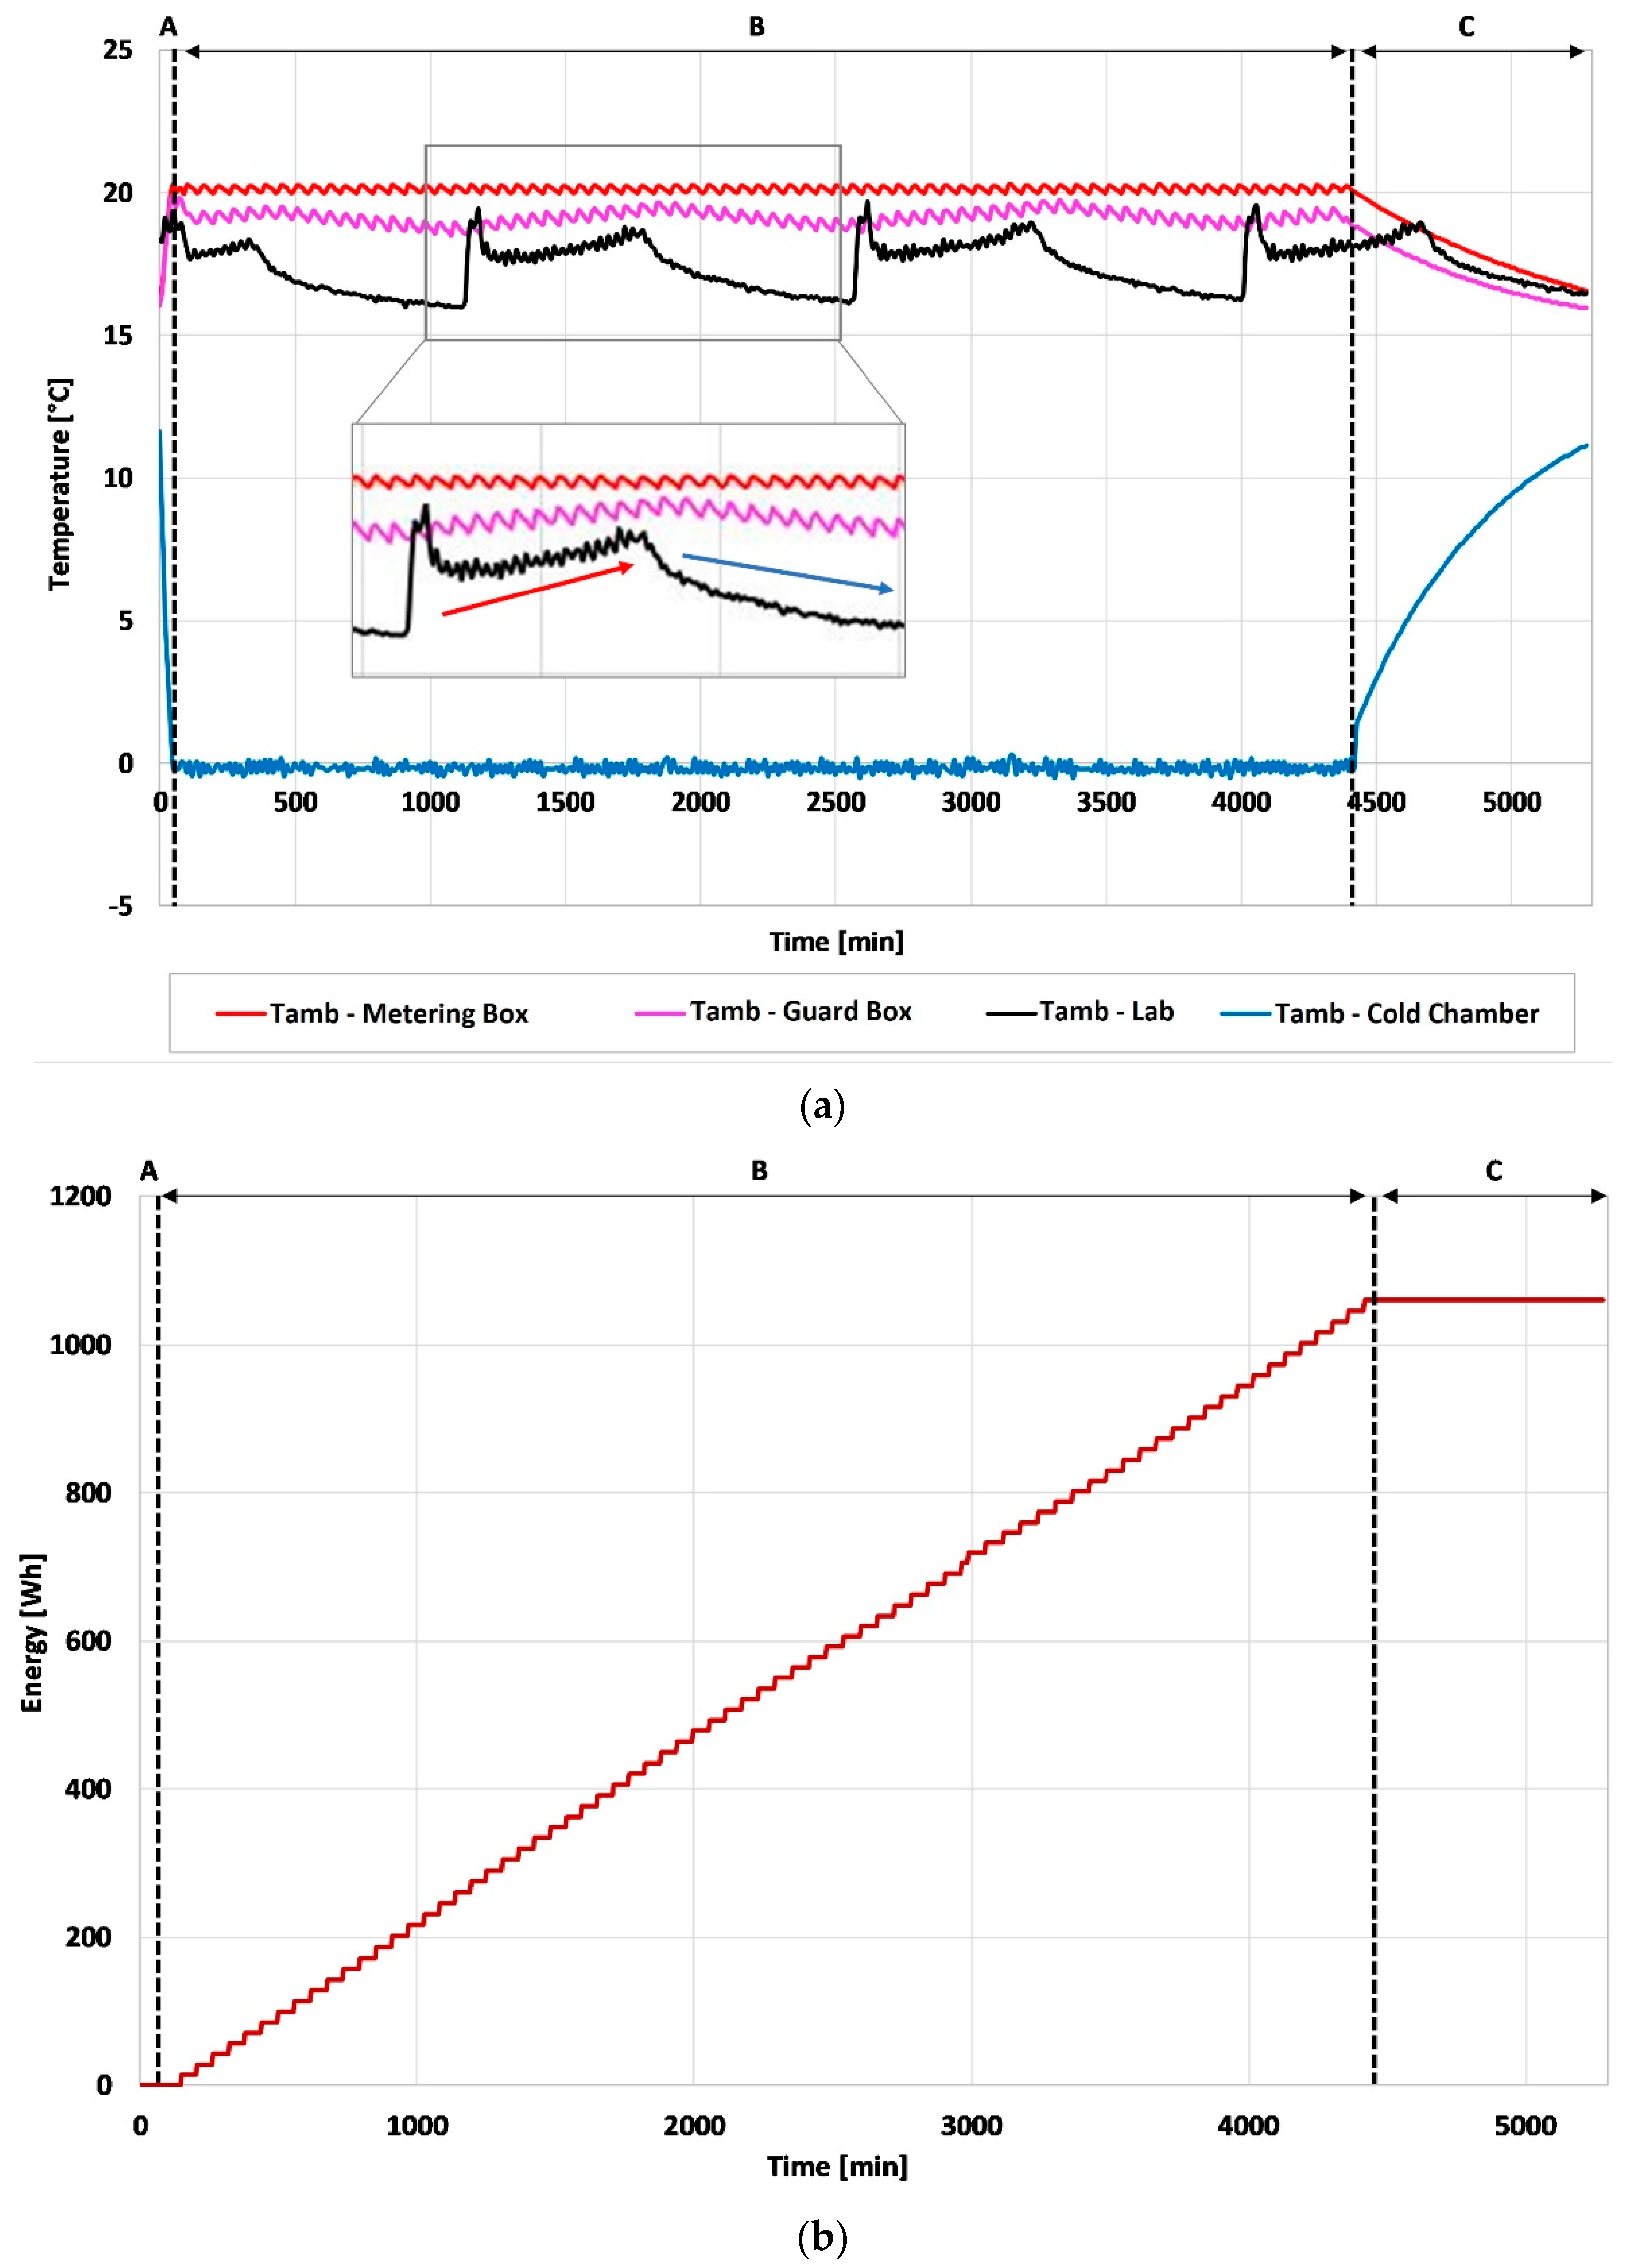
Since the system allowed to measure and log temperature values along time of each hot box component and the thermal energy input into the hot chamber via electric resistances, it was possible to identify three different phases of the experiment through which the proposed system and the hot box response were analyzed.
The first phase (phase “A” in
Figure 10) includes the system activation and the set points achievement in both the chambers and it shows how quickly the set point values were reached. The second phase (phase “B” in
Figure 10) is characterized by the maintenance of the steady-state conditions between the two chambers minimizing the temperature fluctuations. At the end of the second phase, the machines (electric resistances and refrigerating unit) were turned off to return to the initial conditions (phase “C” in
Figure 10). The total value of the energy input into the hot chamber during the phase “B” was equal to 1.06 kWh. It is worth noting that the measure of energy fed takes place only when the phase “A” is concluded, namely when the steady-state conditions are verified inside the chambers. During the phase “B”, the temperature values in the metering box were subject to minimum fluctuations, always lower than ± 0.3°C. Furthermore,
Figure 10a highlights that, although the guard box was rather influenced by thermal fluctuations of the laboratory, it allowed to maintain very stable thermal conditions inside the metering box. Small temperature fluctuations, due to the on/off setting of the refrigeration unit, can also be observed in the cold chamber, where the fluctuations were always lower than ±1.4 °C.
4.4. Experimental Analysis of the Specimen Wall Thermal Properties
During the experimental phase, heat flow meter and guarded hot box approaches were performed to carry out the performance of the specimen wall and to test the proposed system.
A comparison between these two approaches allows to underline some useful observations. The heat flow meter (HFM) method is widely employed for in-situ measurements of thermal transmittance of building components thanks to its ease of use, given the simplicity of the involved probes (a thermopile for the flux, and thermoresistances or thermopiles for the temperatures) and the availability of proprietary software that permits to process the measured data and to retrieve the U-value.
The guarded hot box approach allows to set and control the temperatures inside the chambers and, therefore, it permits repeatable conditions and the assessment of the influence of boundary conditions on the thermal behavior of the analyzed building component. Despite these pros, the con is mainly due to the sizes of such apparatus and its cost. Indeed, many probes are needed, besides an accurate system for temperature setting and control.
Therefore, if on one hand the heat flow meter approach lets to know punctual spatial information about thermal transmittance of building components with ease of use in non-repeatable conditions, on the other hand the GHB permits to evaluate the U-value of building elements on a wide spatial scale and in repeatable conditions, but with a more complex measuring and control system and higher costs.
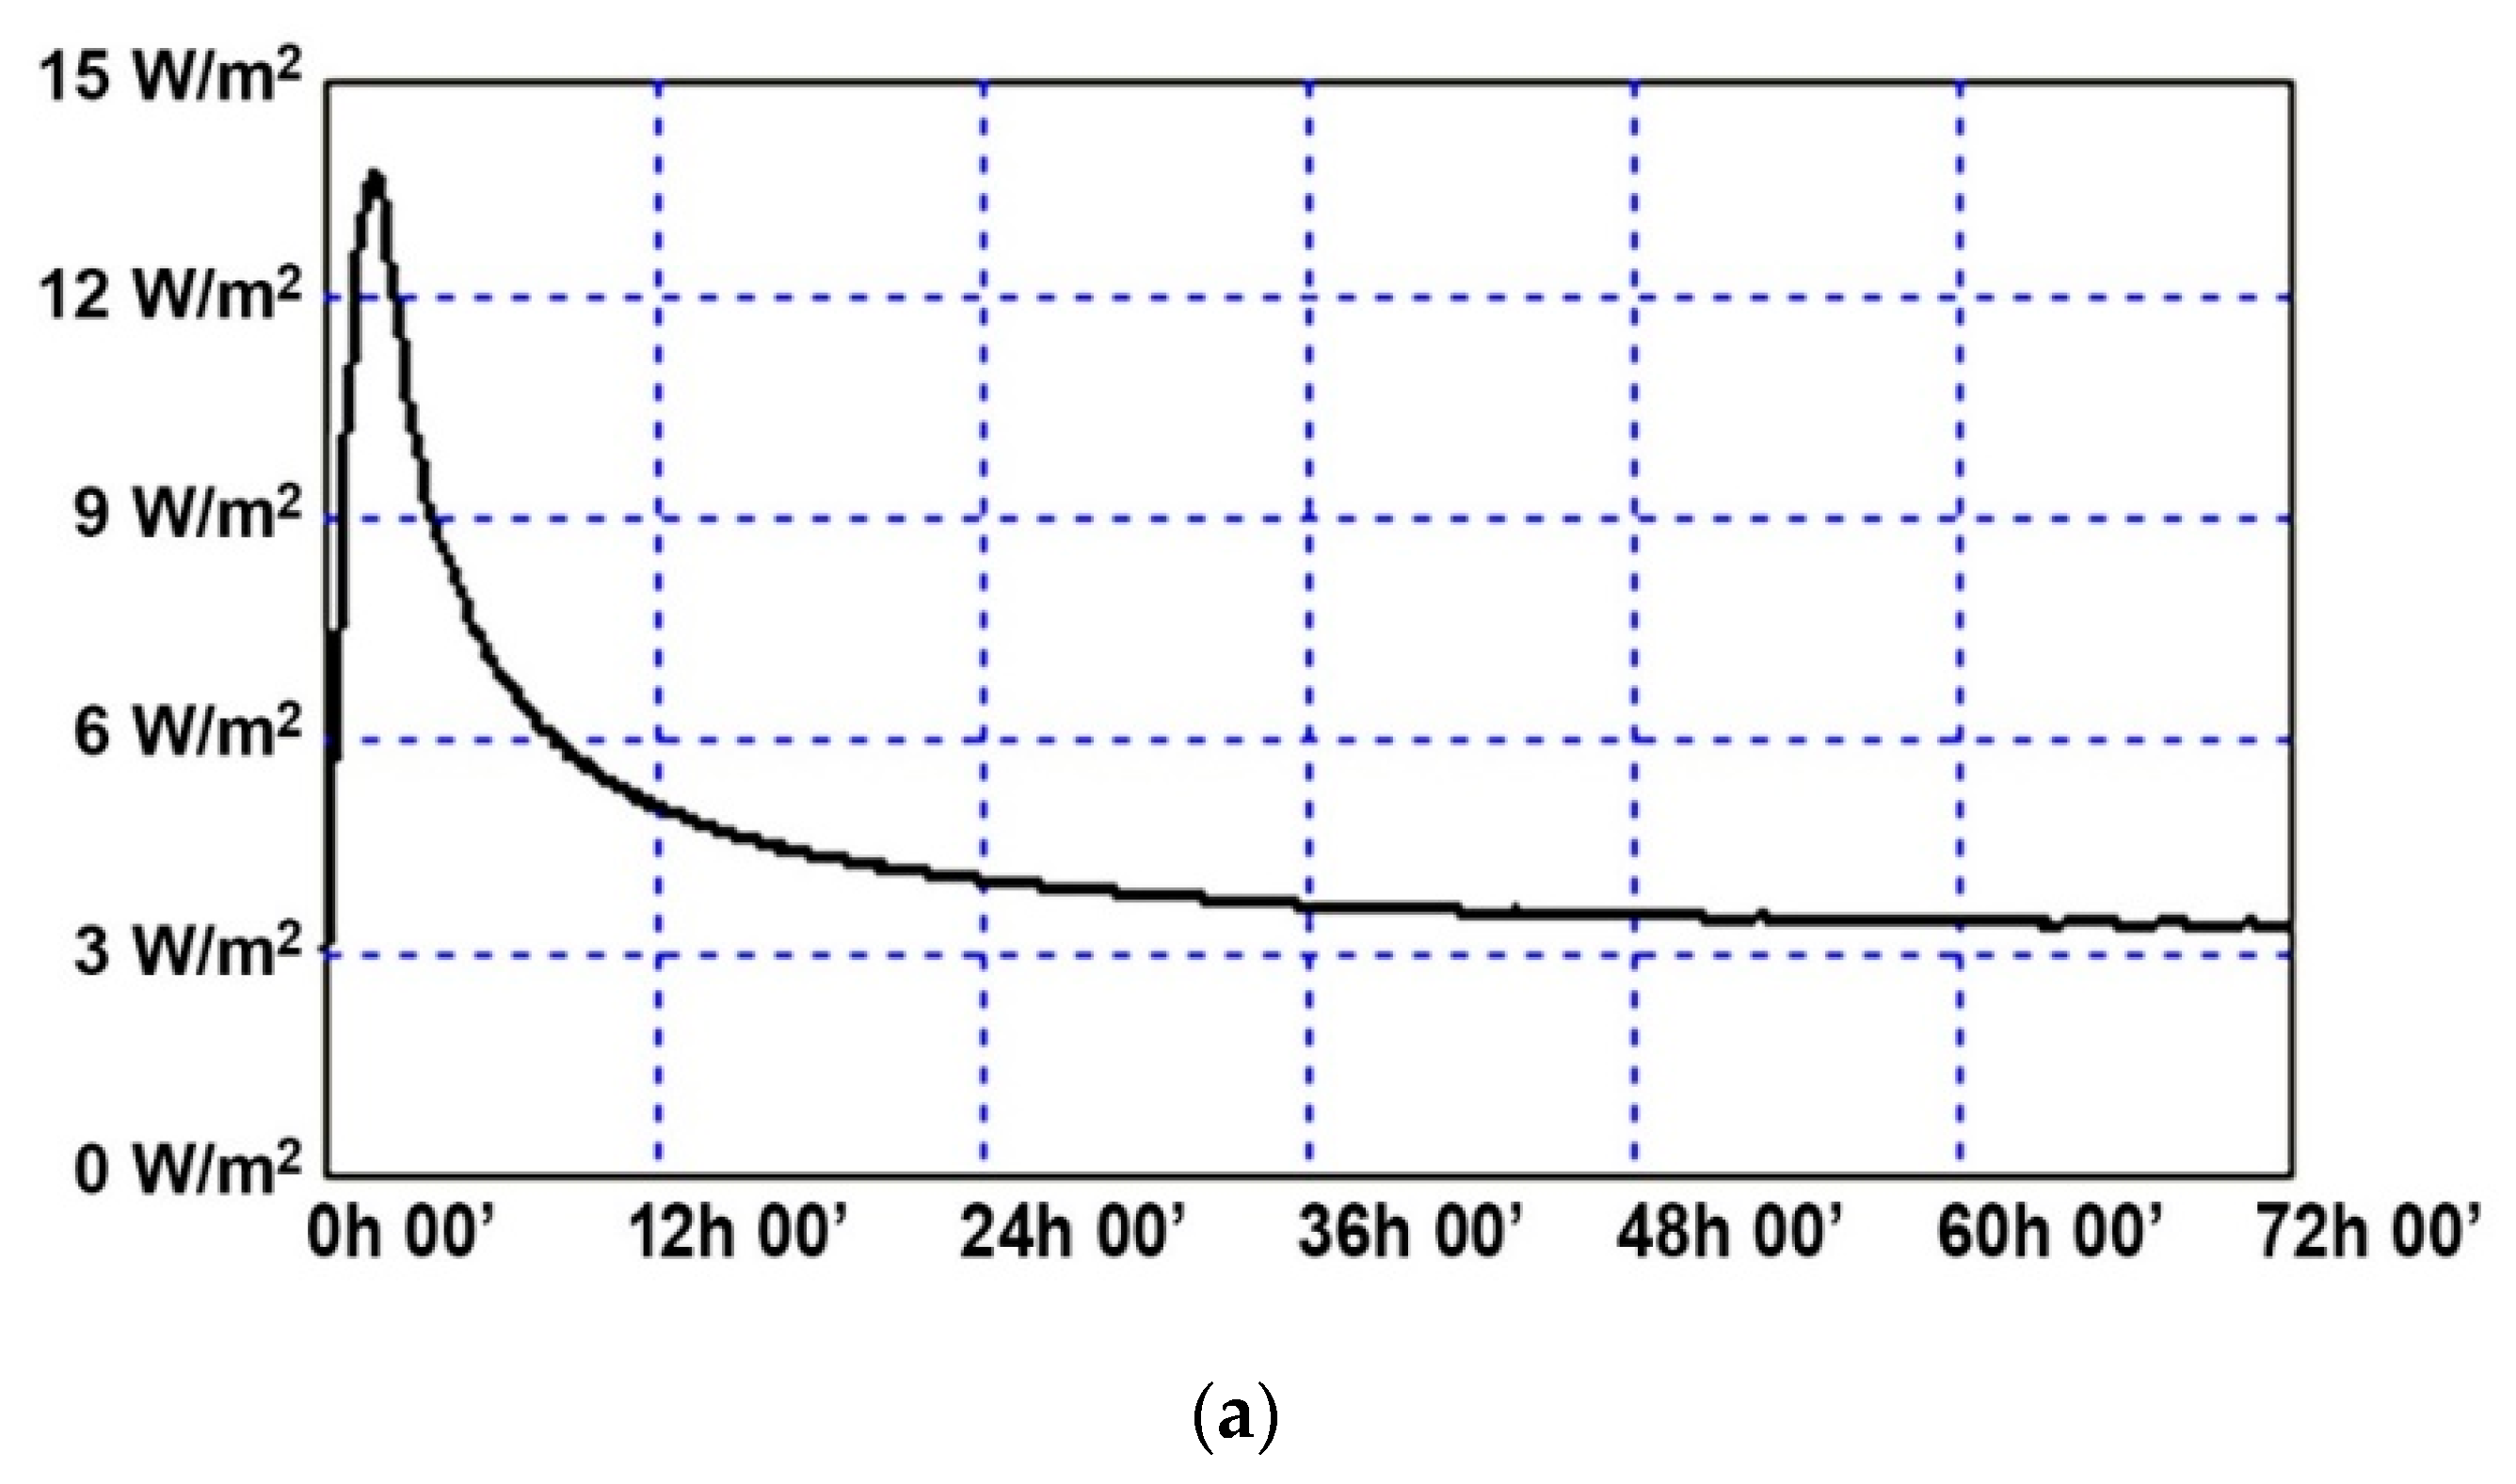
In this work, a heat flow meter was installed on the specimen surfaces following the recommendations provided by ISO 9869 [
49]. The analysis had a duration of 72 h and it was carried out through a Hukseflux HFP01 heat flow meter, whose characteristics are summarized in
Table 4.
The results of the HFM campaign (
Figure 11), obtained via progressive average method, showed a mean heat flux equal to 3.39 W/m
2, and a U-value equal to 0.177 ± 0.01 W/m
2K, determined considering internal and external surface resistances (R
si and R
se), equal to 0.13 and 0.04 m
2K/W respectively, as provided by the standard UNI EN ISO 6946 [
48].
It is worth noting that the U-value determined through the HFM campaign is very close to the value obtained with theoretical calculation equal to 0.176 ± 0.03 W/m
2K (
Table 2).
The performance of the specimen wall was experimentally evaluated in guarded hot box by means of the measuring and control system proposed in this work. The data measured by the proposed system were processed by using a designed MATLAB
® GUI (Graphical User Interface) which, after importing the data, allowed to determine the U-value of the sample. The post-processing algorithm was realized following the standard UNI EN ISO 8990 [
12], according to which the value of the thermal transmittance (
U) is calculated by Equation (1).
where
is the power supplied to the metering box [W], A is the metering area [m
2],
and
are the environmental temperatures inside the chambers, hot and cold side respectively [°C], calculated by Equation (2).
where
is the measured mean air temperature [°C],
is the measured mean baffle temperature [°C],
is the measured mean surface temperature [°C],
is the emissivity factor (assumed equal to 0.9 as provided by the UNI 8990),
is the calculated radiation coefficient [W/m
2K], provided by Equation (3) [
12].
where
is the Stefan’s constant and
is the calculated appropriate mean radiant absolute temperature provided by Equation (4).
Therefore, the proposed system and the probes that equip the hot box allowed to determine the experimental U-value of the specimen wall that resulted equal to 0.216 ± 0.01 W/m
2K. A comparison between the U-values obtained with the different approaches is showed in
Table 5.
4.5. Uncertainty Analysis
Uncertainty analysis of the thermal transmittance values was carried out by using the Holman’s method [
50,
51], according to which, if a set of measurements is supposed, the calculated result uncertainty is estimated on the basis of the uncertainties in the primary measurements. The result
is a given function of the independent variables
;
is the result’s uncertainty and
are the uncertainties in the independent variables. Therefore, the uncertainty in the result is determined by Equation (5) [
50,
51].
The uncertainties of the data measured (e.g., temperature probes, heat flux, etc.) have been evaluated from the manufacturers’ datasheets.
Based on the uncertainties obtained, it is worth noting that the digital nature of the probes and the system architecture allow to easily increase the number of sensors installed to improve the measurement precision. Indeed, this flexibility of the number of sensors would be more complex for systems equipped with analog probes due to losses and noise along the connection cables that require the use of compensation circuits for each probe.
4.6. 2D and 3D Thermal Model Visualization
In addition to the standard analysis of temperatures and energy trends (
Figure 10), thanks to the considerable number of probes installed, the system allowed to perform a post-processing analysis of the measured data through which 2D and 3D thermal models of the specimen wall and hot box surfaces were created. Indeed, the designed MATLAB
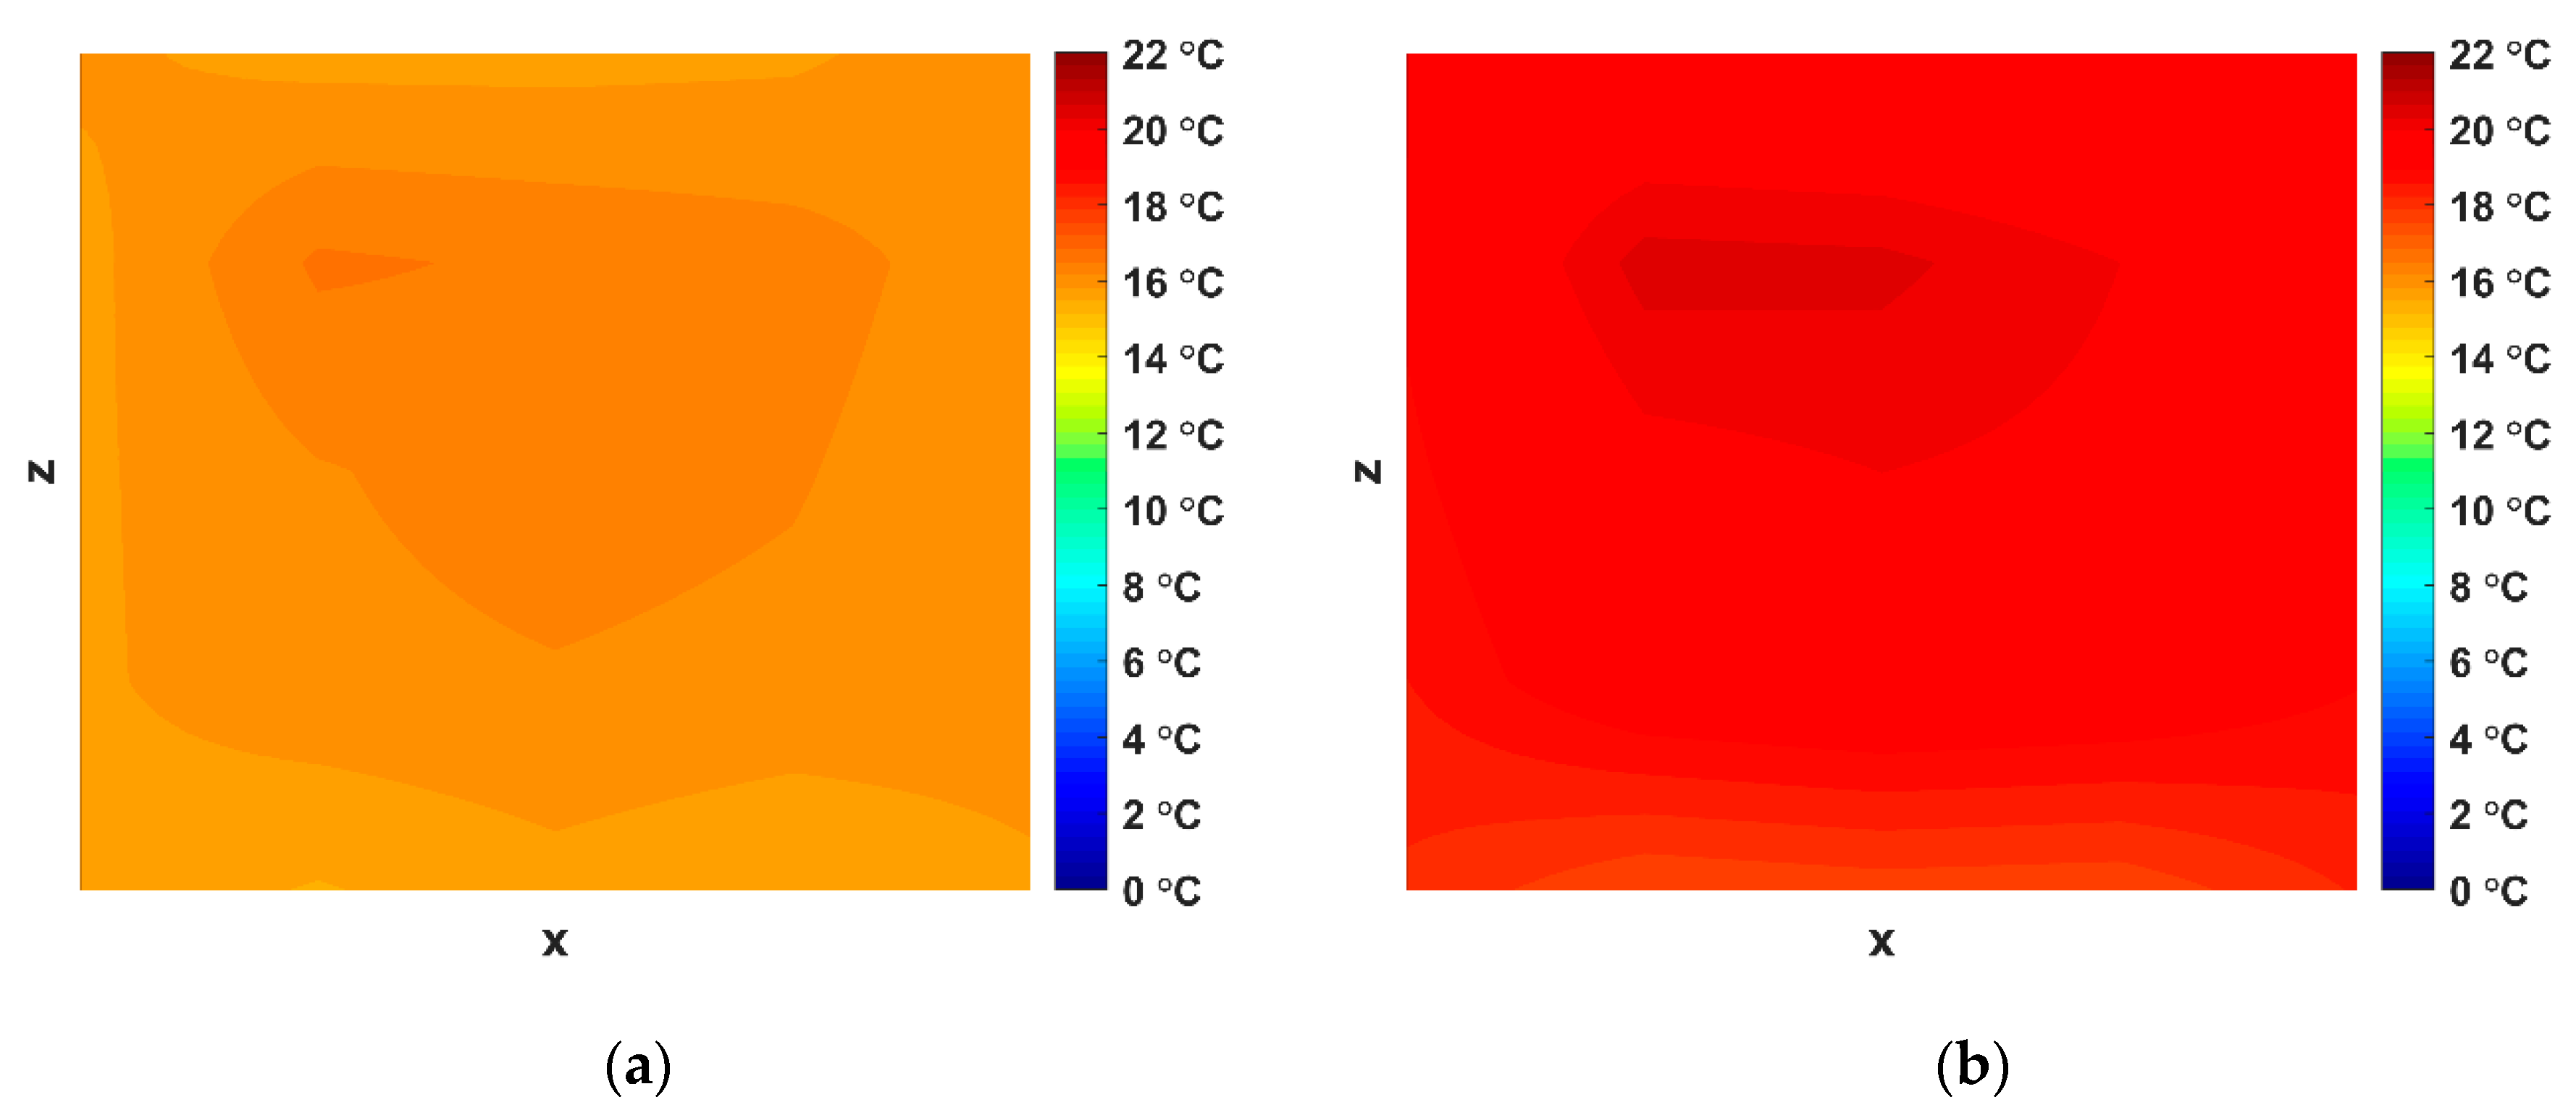
® GUI, besides allowing the U-value evaluation, allowed to carry out 2D and 3D thermal distributions at any desired time. An example of 2D view of the sample wall surfaces is shown in
Figure 12. This display mode is useful to visualize the thermal evolution on the wall surfaces during the experiments and to check that there are no thermal anomalies such that measurements results can be compromised. Moreover, a video containing the 2D thermal evolution of the sample wall surfaces is shown in
Supplementary Materials Video S1.
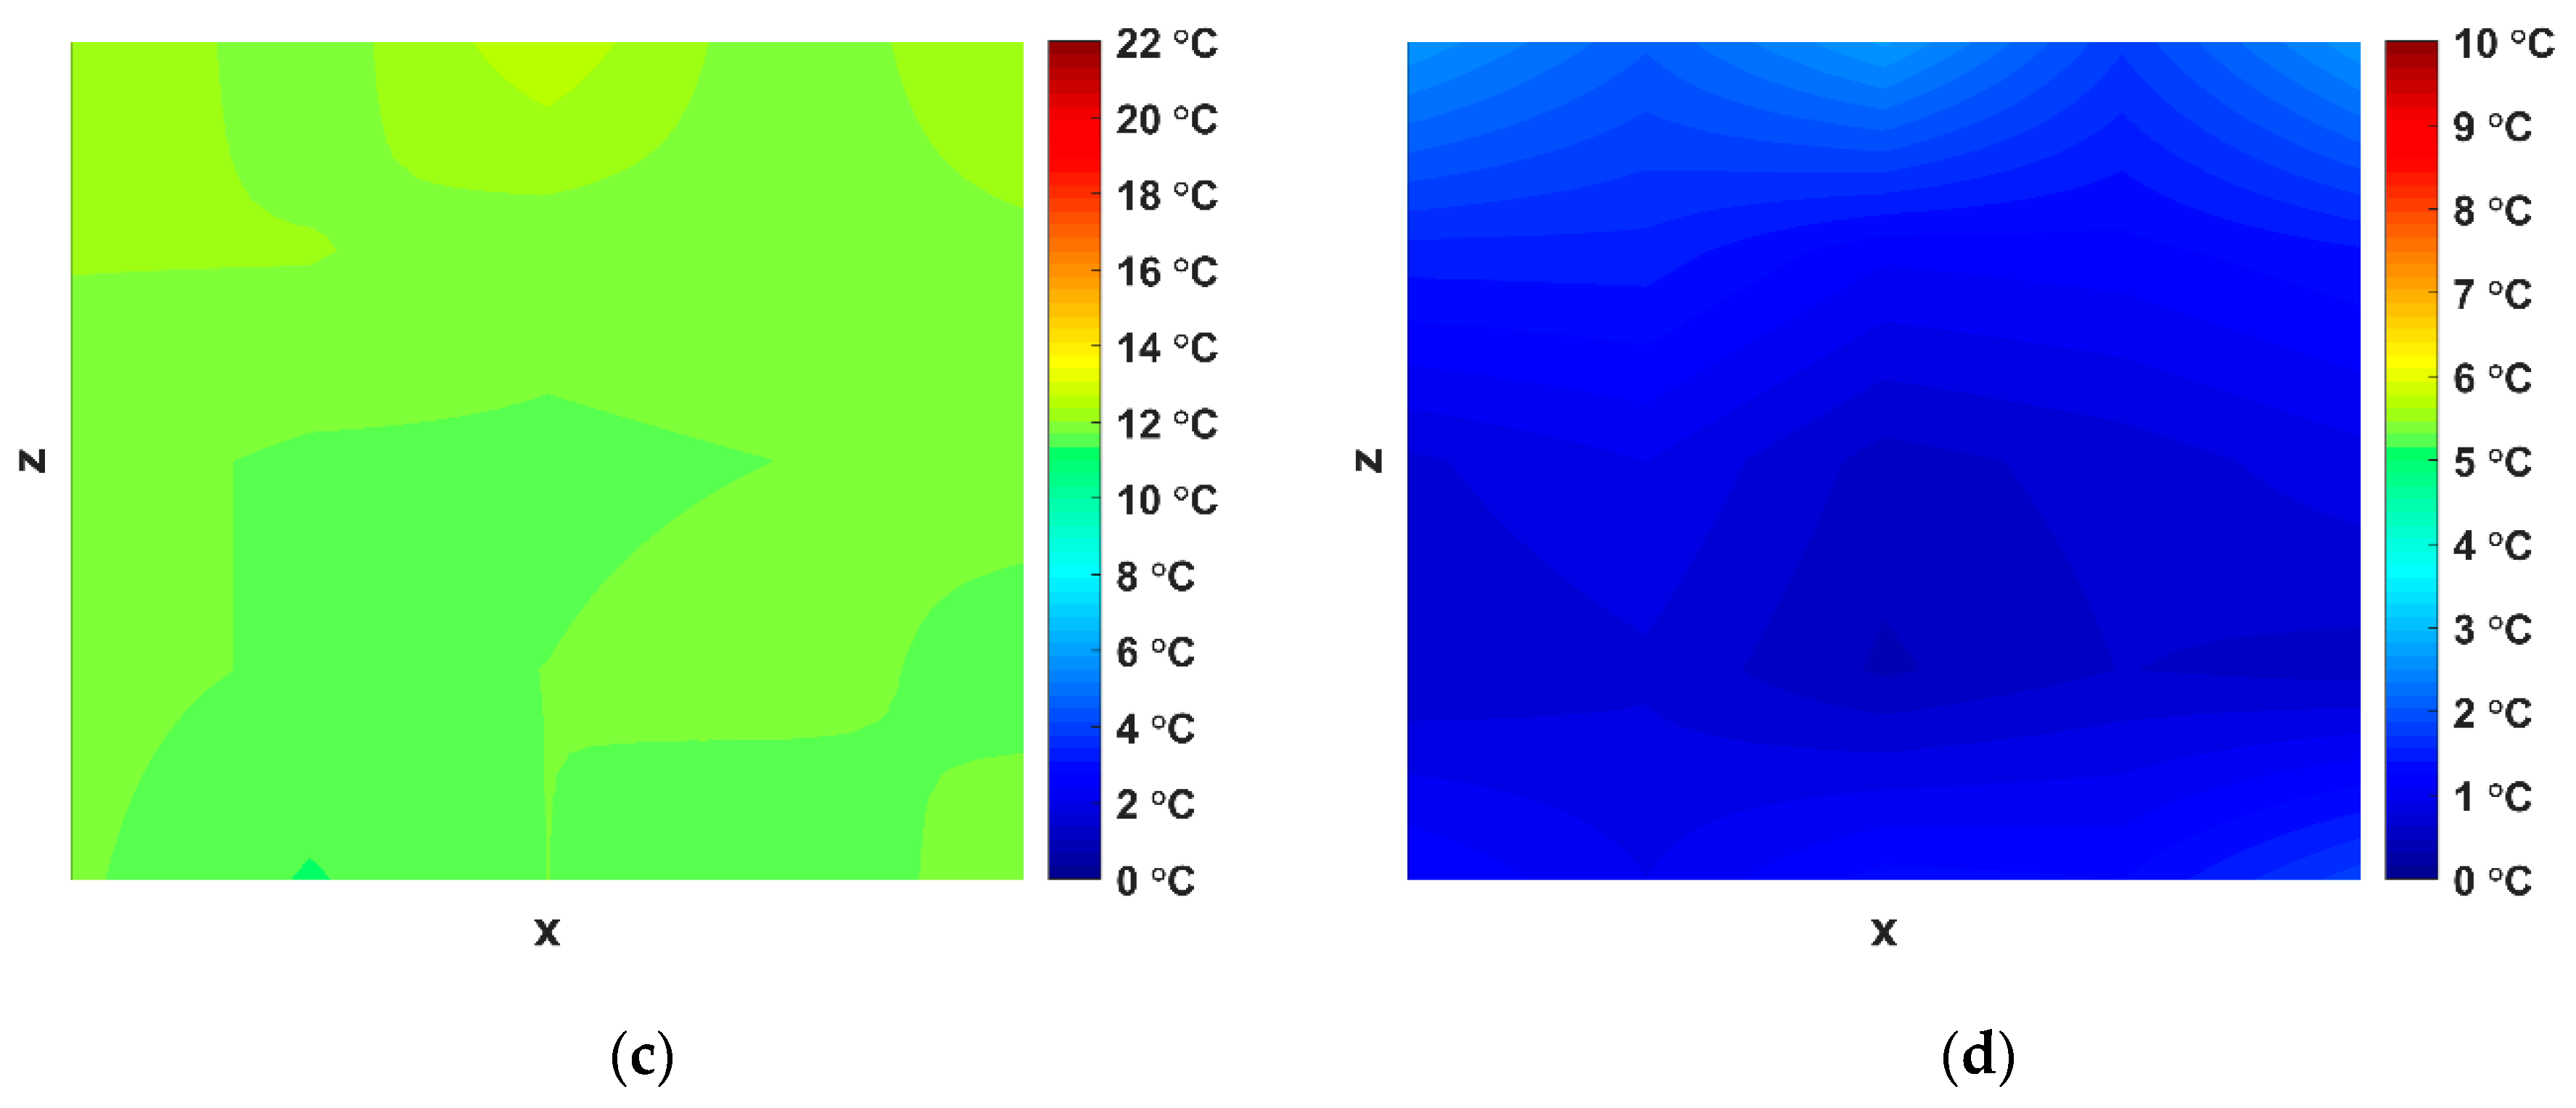
Furthermore, the analysis of thermal models allowed to create a three-dimensional representation of the temperatures’ distribution inside the chambers, by using a 3D CAD software. An example of the three-dimensional representation is shown in
Figure 13. It is worth noting that the surface temperature distributions of the two chambers is rather uniform with very small thermal variations. The cold chamber is characterized by a vertical thermal stratification, while the metering box thermal distribution is less uniform, due to the positioning of the electric resistances inside the hot chamber.
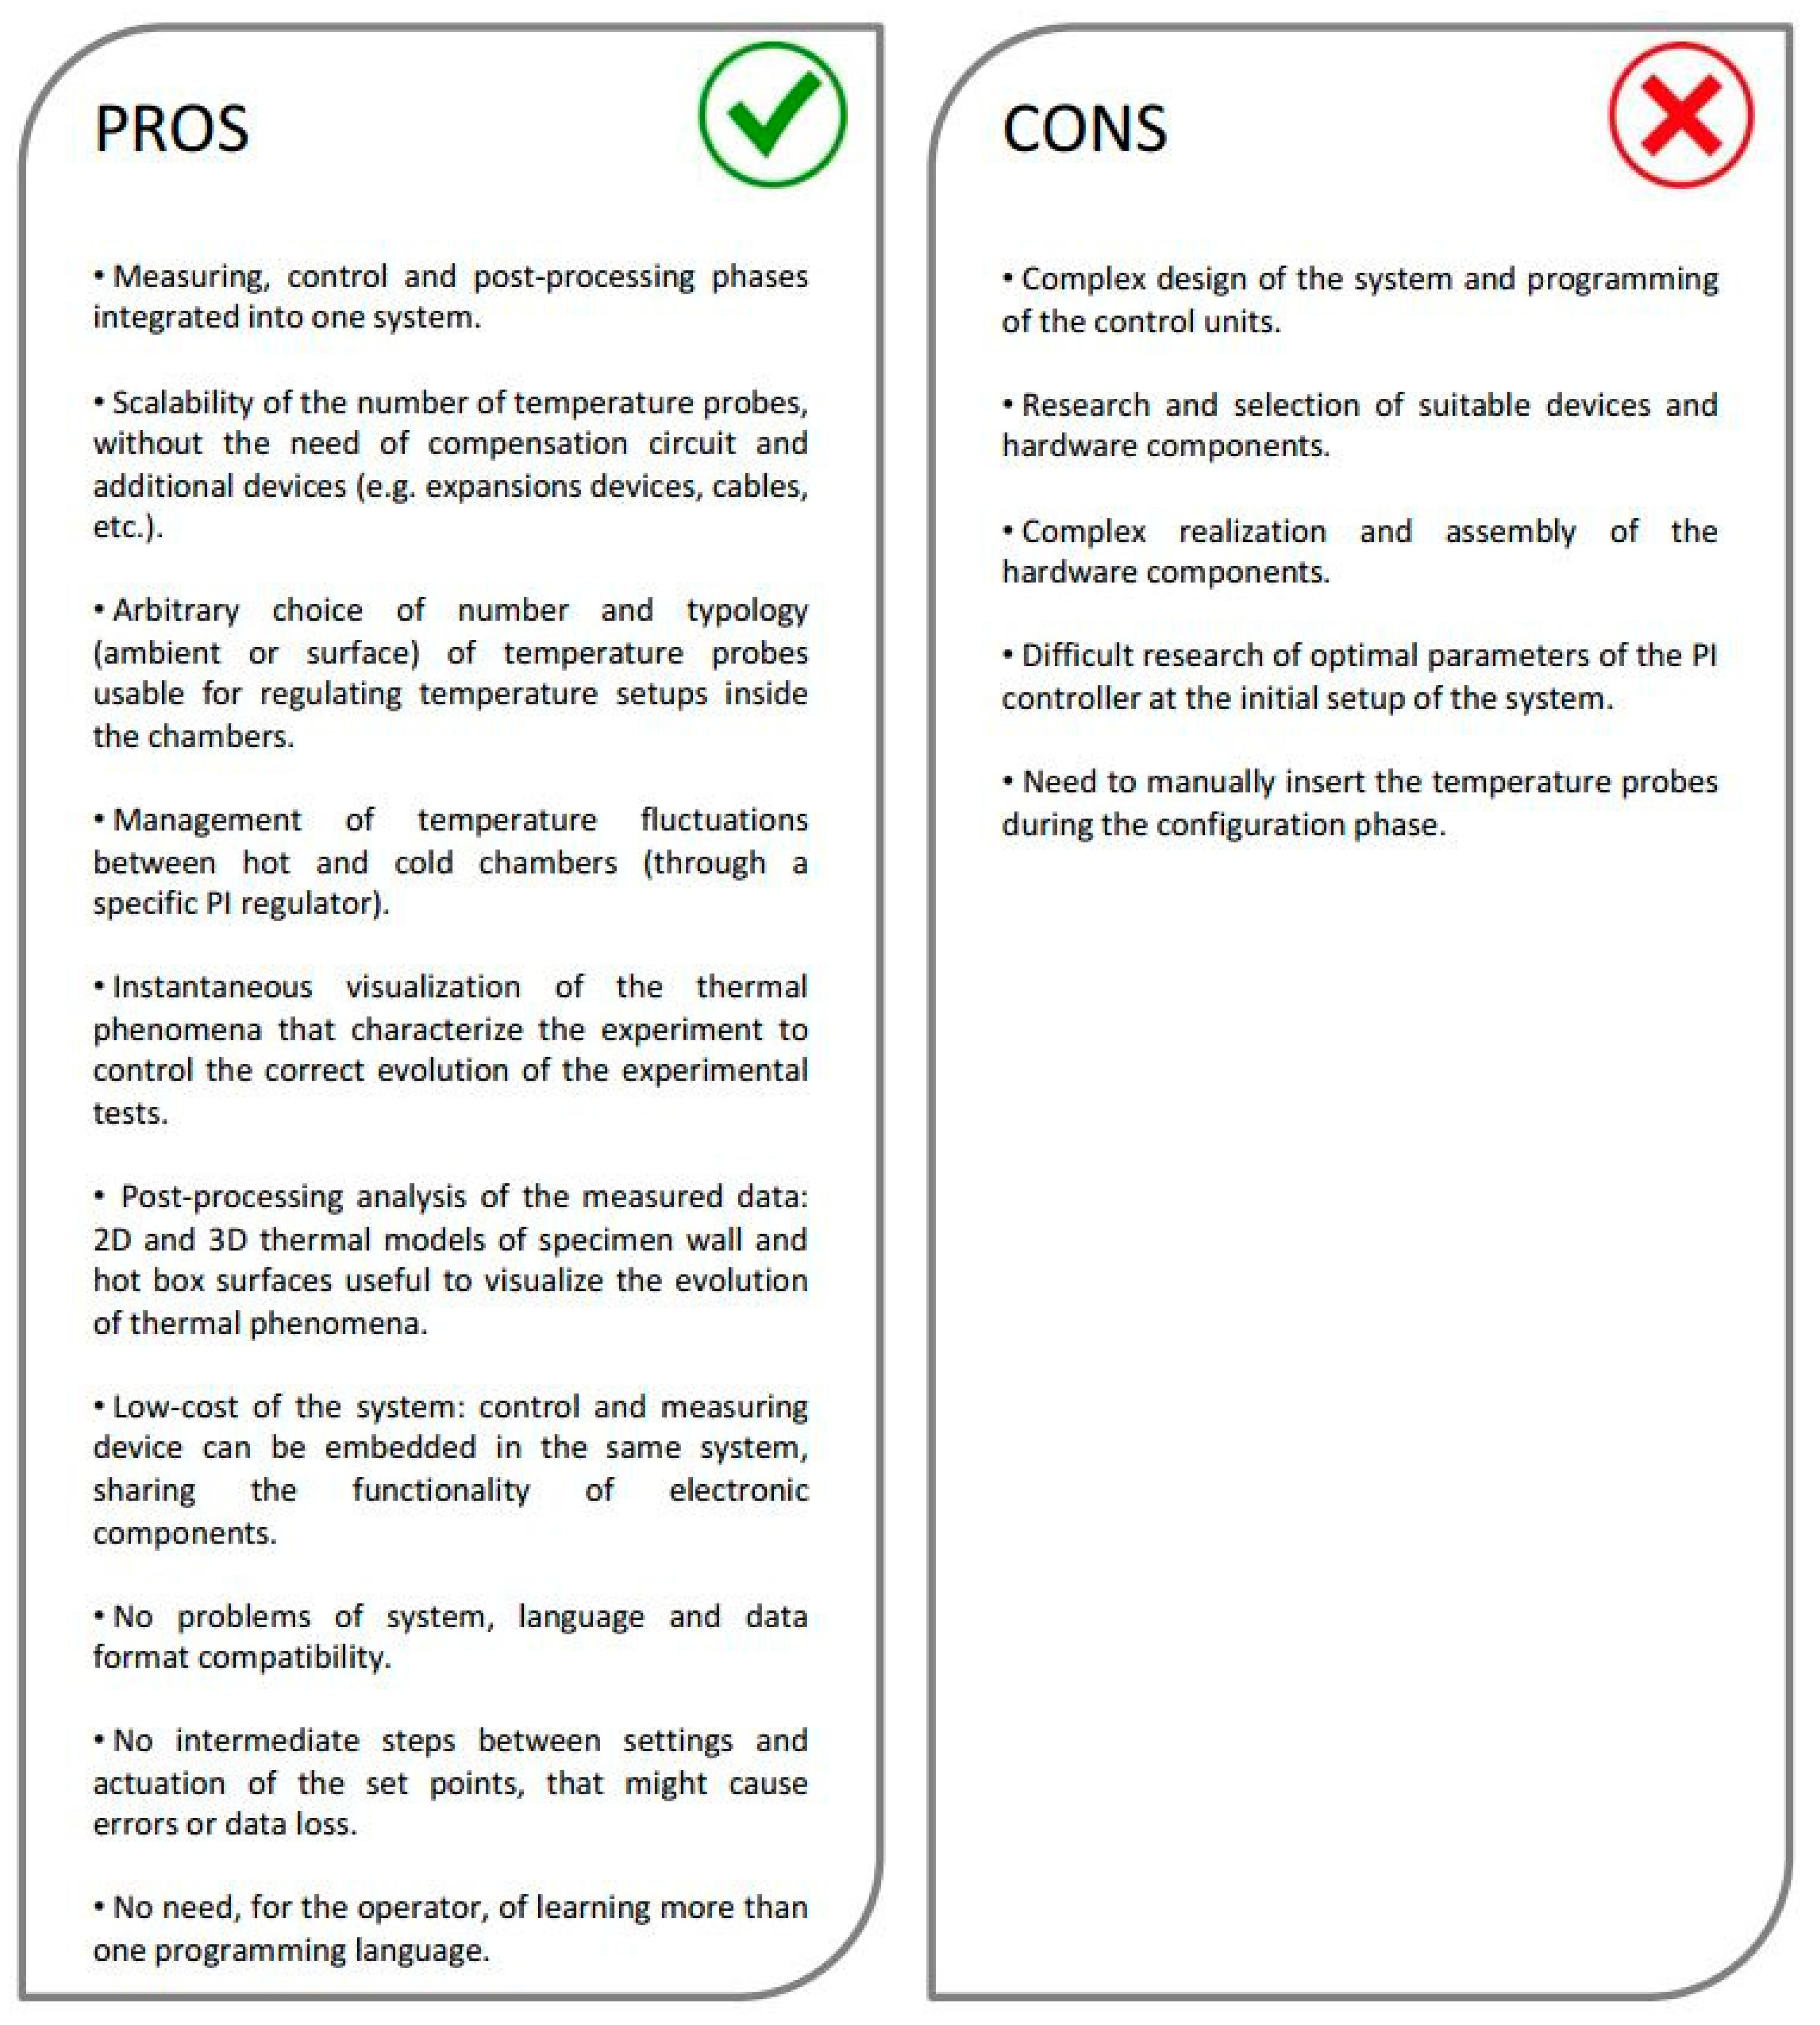
4.7. Pros and Cons of the System
Based on the experience carried out in this work and after the testing phase of the sample wall by means of the hot box approach, pros and cons of the proposed measuring and control system can be highlighted. In this sense,
Figure 14 summarizes the main advantages and disadvantages deriving from the use of the proposed system.
5. Conclusions
In this paper, after a detailed literature review, an integrated measuring and control system for hot box experiments is presented and its capabilities are tested through a real application on a X-lam sample wall with double insulating layer.
The system, based on a general-purpose microcontroller, digital thermometers, and on the use of an “ad hoc” wireless sensors network, is described both at hardware and firmware levels. The novelties of the proposed system and its main properties are presented.
The system’s capability has been tested on a double insulation X-lam wall. The results of the 72 h experiment have shown the system’s capability to maintain the wished thermal conditions with small fluctuations (maximum temperature fluctuations in hot and cold chambers equal to ±0.3 °C and ±1.4 °C, respectively) and to measure temperatures and energy input into the hot chamber that resulted equal to 1.06 kWh. The U-value of the wall, equal to 0.216 ± 0.01 W/m2K, was determined by means of the data post-processing of the measured data and it has been compared with the transmittance values obtained through theoretical calculation (equal to 0.176 ± 0.03 W/m2K) and heat flow meter measurements (equal to 0.177 ± 0.01 W/m2K). Moreover, the data post-processing allowed to create 2D and 3D thermal models of specimen wall and chambers.
Finally, the proposed system can represent a convincing improvement with respect to the traditional approaches used in hot box experiments, and, therefore, its employment can be an alternative for those who carry out this kind of analysis. The ease of installation and management of the system, and the low costs, could also favor a more widespread of hot boxes, increasing the research of materials with high energy performance.

 ,
, 


