Enhanced Biogas Production of Cassava Wastewater Using Zeolite and Biochar Additives and Manure Co-Digestion


1
Department of Environmental Science & Technology, University of Maryland, College Park, MD 20742, USA
2
Department of Civil Engineering, University of Ibadan, Ibadan 200284, Nigeria
*
Author to whom correspondence should be addressed.
Energies 2020, 13(2), 491; https://0-doi-org.brum.beds.ac.uk/10.3390/en13020491
Submission received: 30 November 2019
/
Revised: 30 December 2019
/
Accepted: 14 January 2020
/
Published: 19 January 2020
(This article belongs to the Special Issue Biogas for Rural Areas)
Abstract
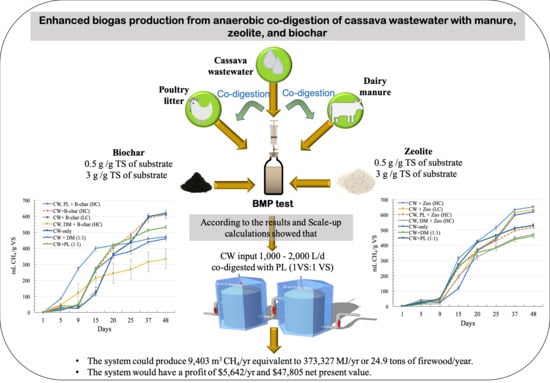
:Currently, there are challenges with proper disposal of cassava processing wastewater, and a need for sustainable energy in the cassava industry. This study investigated the impact of co-digestion of cassava wastewater (CW) with livestock manure (poultry litter (PL) and dairy manure (DM)), and porous adsorbents (biochar (B-Char) and zeolite (ZEO)) on energy production and treatment efficiency. Batch anaerobic digestion experiments were conducted, with 16 treatments of CW combined with manure and/or porous adsorbents using triplicate reactors for 48 days. The results showed that CW combined with ZEO (3 g/g total solids (TS)) produced the highest cumulative CH4 (653 mL CH4/g VS), while CW:PL (1:1) produced the most CH4 on a mass basis (17.9 mL CH4/g substrate). The largest reduction in lag phase was observed in the mixture containing CW (1:1), PL (1:1), and B-Char (3 g/g TS), yielding 400 mL CH4/g volatile solids (VS) after 15 days of digestion, which was 84.8% of the total cumulative CH4 from the 48-day trial. Co-digesting CW with ZEO, B-Char, or PL provided the necessary buffer needed for digestion of CW, which improved the process stability and resulted in a significant reduction in chemical oxygen demand (COD). Co-digestion could provide a sustainable strategy for treating and valorizing CW. Scale-up calculations showed that a CW input of 1000–2000 L/d co-digested with PL (1:1) could produce 9403 m3 CH4/yr using a 50 m3 digester, equivalent to 373,327 MJ/yr or 24.9 tons of firewood/year. This system would have a profit of $5642/yr and a $47,805 net present value.
1. Introduction
Eutrophication and organic pollution resulting from poor management of wastes from food processing industries, such as cassava processing industries, is a major problem in many developing countries [1,2]. Cassava (Manihot esculenta) is a starch-containing root crop of global importance that can be processed into food, feed, and other non-food products [3]. The cassava processing industry is a key industry in many developing countries, especially in Africa, but also in parts of Latin America and Asia. In 2017, the African region contributed 55% of the global production of cassava, equivalent to 121 million tons, with 25–37% of the crop discarded as waste in the form of peels and pulp [4,5], and approximately 60,000 L of effluent generated from each ton of cassava tubers processed [3,6]. Meanwhile, more than 70% of cassava production in sub-tropical and tropical regions of the world is conducted by small and medium-scale farmers [7,8]. These small and medium-scale cassava industries lack the capacity to treat the large waste streams resulting from daily cassava roots processing, which can lead to environmental degradation and pollution of nearby water bodies [9]. Additionally, farmers often depend solely on firewood as a source of energy to process cassava, which has associated negative environmental impacts.
Bioenergy from organic wastes materials through anaerobic digestion (AD) can be used to produce renewable energy from this organic-rich wastewater, while reducing the concentrations of organic pollutants [10]. Cassava wastewater (CW) has a high organic loading, with high concentrations of chemical oxygen demand (COD), biochemical oxygen demand (BOD), and total solids (TS), as well as a low pH [3,11]. In parts of Thailand, Brazil, Vietnam, and India, CW has been managed using stabilization ponds, aerobic systems, and AD [12]. Reported concerns associated with digestion of CW are the low nitrogen concentration and rapid acidification (low pH) of CW [13,14]. Co-digestion with a nitrogen-rich substrate, such as manure, could decrease the carbon-to-nitrogen (C:N) ratio and provide buffering capacity for stabilizing the pH in order to increase methane (CH4) production. Previous studies have investigated cassava peels and pulps co-digested with livestock wastes [2,15], digestion of cassava starch effluent with separation of the acidogenic and methanogenic phases [16], re-circulation of methanogenic sludge [17], dolomitic limestone addition to increase alkalinity [13], and use of up flow anaerobic sludge blanket (UASB) digestion processing [18,19].
Porous adsorbents, such as biochar, zeolite, and activated carbon, have been used to enhance CH4 production and general AD processes [20]. Biochar is a carbonaceous material obtained from agricultural biomass through pyrolysis and gasification. Mumme et al. reported that biochar is relatively cheaper to manufacture than other adsorbents, which has increased interest in land application of biochar, and more recently, inclusion in AD processing [21]. The use of biochar as an additive in AD has not been fully investigated, and no work has been done with biochar and AD of CW. There is potential for biochar to enhance the operational stability of the AD process and increase the quality of the digestate produced.
Zeolite has also been reported to possess favorable characteristics for microorganism adhesion [22], with the capacity to induce ion exchange during AD due to the presence of Na+, Ca2+, and Mg2+ cations in its crystalline structure. These properties could be useful for improving AD of wastewaters with high concentrations of nitrogen, such as poultry manure, as it prevents process inhibition. Application of natural zeolites as support media in digesters treating wastewaters has been reported to increase microbial population density and provide greater opportunity for microbial growth and attachment, cross feeding, co-metabolism, and interspecies hydrogen and proton transfer [22].
A prior study by Montalvo et al. reported that the addition of natural zeolite at doses between 2 and 4 g/L increased CH4 production, with increasing inhibition at doses >6 g/L [23]. The use of porous materials, such as natural zeolites, to create surface area for microbial communities and increase retention of high biomass concentrations in the digestion of wastewater has been documented [22]. Zeolite was employed to enhance energy recovery, in the form of hydrogen (H2), from cassava-ethanol wastewater during the dark fermentation process. [24]. To our knowledge, zeolite additions have not been used during the digestion of CW to enhance CH4 production.
General implementation and adoption of large-scale biogas technology in most African countries have been limited due to the high costs associated with investments and operations of AD systems [25], especially when there is an additional cost of transporting wastes to offsite AD reactors. The availability of agricultural biomass, which is abundant in the rural cassava industry, along with the large volume of CW generated daily in this industry, would provide larger quantities of organic material to be treated onsite using AD. This study focused on investigating the impact of the co-digestion of CW with selected livestock manures and porous adsorbents on biogas production for potential implementation and adoption in cassava industries. The objectives of the study were to: (1) characterize cassava wastewater as a substrates for AD and identify appropriate substrates for co-digestion, (2) investigate the CH4 potential of cassava digestion, with and without co-digestion with manure, biochar, and zeolite, in terms of cumulative production and retention time, (3) characterize the wastewater transformations during digestion in terms of organic and nutrient transformations, and (4) analyze the economic viability and environmental impact of employing digestion for the rural cassava industry.
2. Materials and Methods
2.1. Substrate and Inoculum Collection and Preparation
2.1.1. Cassava Wastewater Substrate
The cassava tubers were obtained from a farmer’s market in Adelphi, Maryland, USA. The cassava tubers were manually peeled and soaked for 5 days in the laboratory using 1 L/kg of deionized water to replicate the rural cassava processing steps for ‘fufu’ production, a popular African dish derived from fermented cassava paste. Fermented tubers were manually squeezed, and the cassava wastewater (CW) was collected and used for the experiments. The substrate characteristics and the experiment design are given in Table 1 and Table 2. The CW had a COD range of 29.8–33.4 g/L, volatile solids (VS) of 17.3 g/kg, total solids (TS) of 17.8 g/kg, and a pH of 5.5.
2.1.2. Dairy and Poultry Manure Substrates and Inoculum Source
The dairy manure (DM) used as a co-substrate was obtained from the 100-cow dairy at the US Department of Agriculture (USDA) Beltsville Agricultural Research Service (ARS) in Beltsville, MD. Poultry litter (PL) was obtained from a poultry (broiler) farm at the University of Maryland Extension—Talbot county, Easton Maryland. The poultry litter consisted of poultry droppings and beddings from wood shavings. Both manure substrates were collected onsite and stored at 4 °C before use. The inoculum used for the experiment was digestate of a complete mixed wastewater sludge digester (Alexandria, VA, USA) and was stored at 4 °C prior to use.
2.1.3. Biochar and Zeolite Additives
Two porous materials, biochar (B-Char) and clinoptitolite zeolite (ZEO), were added to the CW as co-treatments. The biochar (B-Char) substrate was derived from corn stover prepared through pyrolysis under an O2-free atmosphere at 500 °C, with a holding time of 10 min (ArtiCHAR, Prairie City, Iowa, USA). The biochar particle size varied from 841 mm to <74 mm, with a VS and TS of 690 and 980 g/kg, respectively. The zeolite was a high purity 97% clinoptilolite zeolite produced at Amargosa Valley (Nye county, NV, USA). The zeolite used was in the form of granules with an angular shape and gray color. The pore diameter was between 4.0–7.0 angstroms.
2.2. Experimental Design
A batch digestion experiment was conducted based on the biochemical methane potential (BMP) test following methods by Moody et al. [26]. The digestion tests were conducted at the University of Maryland’s Department of Environmental Science and Technology (ENST) Water Quality Laboratory (College Park, MD USA). Prior to starting BMP tests, the TS and VS for CW, PL, DM, and inoculum were determined and used to combine the co-substrate ratios based on VS. The experiment was designed for 16 treatments, with three replicates for each treatment (48 total digestion reactors). Each digestion reactor consisted of a 250 mL serum bottle, with the substrates and inoculum loaded at a 2:1 inoculum to substrate ratio (ISR) based on VS and operated in mesophilic conditions (35 °C). For all treatments, an equal volume of inoculum (92.1 g) was added to each triplicate reactor.
The biochar (B-Char) and zeolite (ZEO) treatments were prepared using a low concentration (LC) (0.5 g adsorbent/g TS of substrate) and a high concentration (HC) (3 g adsorbent/g TS of substrate) added to 57.82 g CW. For the manure co-digestion treatments, 3.42 g of PL and 3.26 g of DM were digested alone and co-digested with 28.91 g CW with and without the HC of ZEO. Additionally, PL was co-digested with 28.91 g CW and the HC of B-Char. Inoculum-only reactors were also incubated, and the CH4 production from the inoculum was subtracted from each treatment to account for residual CH4 production from organics in the inoculum.
Prior to incubation, the headspace in each vessel was purged with N2 for three minutes to ensure anaerobic conditions and immediately capped with a rubber septum, and the bottles were placed on a shaker (120 rpm) in a controlled environmental chamber at 35 °C for 48 days. The daily biogas volume was measured by volumetric displacement using a graduated, gas-tight, wet-tipped 50 mL glass syringe inserted through the top of the rubber septum. Biogas production was quantified volumetrically at normal temperature and pressure conditions using a glass gas-tight syringe, equilibrated to atmospheric pressure [26]. All CH4 production values are reported in normal temperature and pressure conditions (1 atm and 20 °C).
2.3. Analytical Methods
The pH of substrates and inoculum were determined with an Accumet AB 15 pH meter (Fisher Scientific, Hampton, NH). For all samples, TS (Method 2540B) and VS (Method 2540E) concentrations were determined using standard methods for the examination of water and wastewater [27]. Total Kjeldahl nitrogen (TKN) and total phosphorus (TP) samples were analyzed on a Lachat autoanalyzer (Quikchem 8500, Hach Company, Loveland, CO, USA) using QuikChem methods 13-107-06-2-D for TKN and 13-115-01-1-B for TP. The COD concentration was measured using a Hach DR 5000 spectrophotometer (Hach Company, Loveland, CO, USA).
The carbon content of the CW, PL, DM, and inoculum were calculated using the equation from Adams et al. [28], where % Carbon = % VS/1.8.
Biogas was analyzed for CH4 and CO2 content by injecting 0.10 mL of gas sample using a luer-lock, gas-tight syringe into an Agilent HP 7890 A gas chromatograph (Agilent Technologies, Santa Clara, CA, USA) equipped with a thermal conductivity detector (TCD) and single HP porous layer open tubular (PLOT) Q column with an injection temperature of 250 °C, a detector temperature of 250 °C, an oven temperature of 60 °C, and conveyed using He gas at a flow rate of 8.6 mL He/min [10].
2.4. Statistical Analysis
Cumulative CH4 production was analyzed using analysis of variance (ANOVA) to determine significantly differences, with p-values < 0.05 considered significant. Tukey’s honestly significant difference (HSD) post-hoc tests were performed for multiple comparisons between variables based on different digestion periods during the 48 days of the experiment. All results presented in the tables and charts are average values with standard error (SE).
3. Results and Discussion
3.1. Characterization of Substrate and Inoculum
The pH of the CW substrate was between 5.5 and 6.5 (Table 2). Some studies have reported lower pH values for CW, ranging from 3.9–4.5 [29]. The pH of mixed substrates before and after AD was within the ideal pH range (6.5–8) for CH4 production [30]. The TS and VS of the cassava wastewater (17.8 and 17.3 g/L, respectively) was 75.8% and 60.4% lower than PL respectively, and 11.3 and 9.7% lower than DM, respectively. As the CW was a liquid wastewater, it was a more dilute waste stream than the manure substrates and had comparatively less TS and VS.
The TKN and TP of the CW were 375 and 222 mg/L respectively (Table 2), whereas, the PL had higher TKN and TP values (3675 and 1245 mg/L, respectively), which were similar to DM (3450 and 603 mg/L, respectively). The low nitrogen content of CW observed in this study was consistent with findings from others CW studies [1,2,8]. The C:N ratio of the CW substrate was 27.8, which was similar to the value 29.1 reported by Lin et al. [31]. The carbon to nitrogen ratio is a key factor affecting anaerobic digestion [32], with C:N ratios between 25 and 30 reported as the most suitable for CH4 production [2,31]. The C:N ratio for PL and DM in this experiment was 13.0 and 15.2 respectively, which were lower than the optimal conditions, while the CW was higher. When the substrates were combined, the C:N ratio of the mixtures were 20.4 and 21.1, for PL and DM, respectively.
3.2. Effect of Livestock Manure Co-Digestion with Cassava Wastewater on Biogas Production
3.2.1. Cumulative CH4 Production Based on VS Addition into the Digestion Reactor
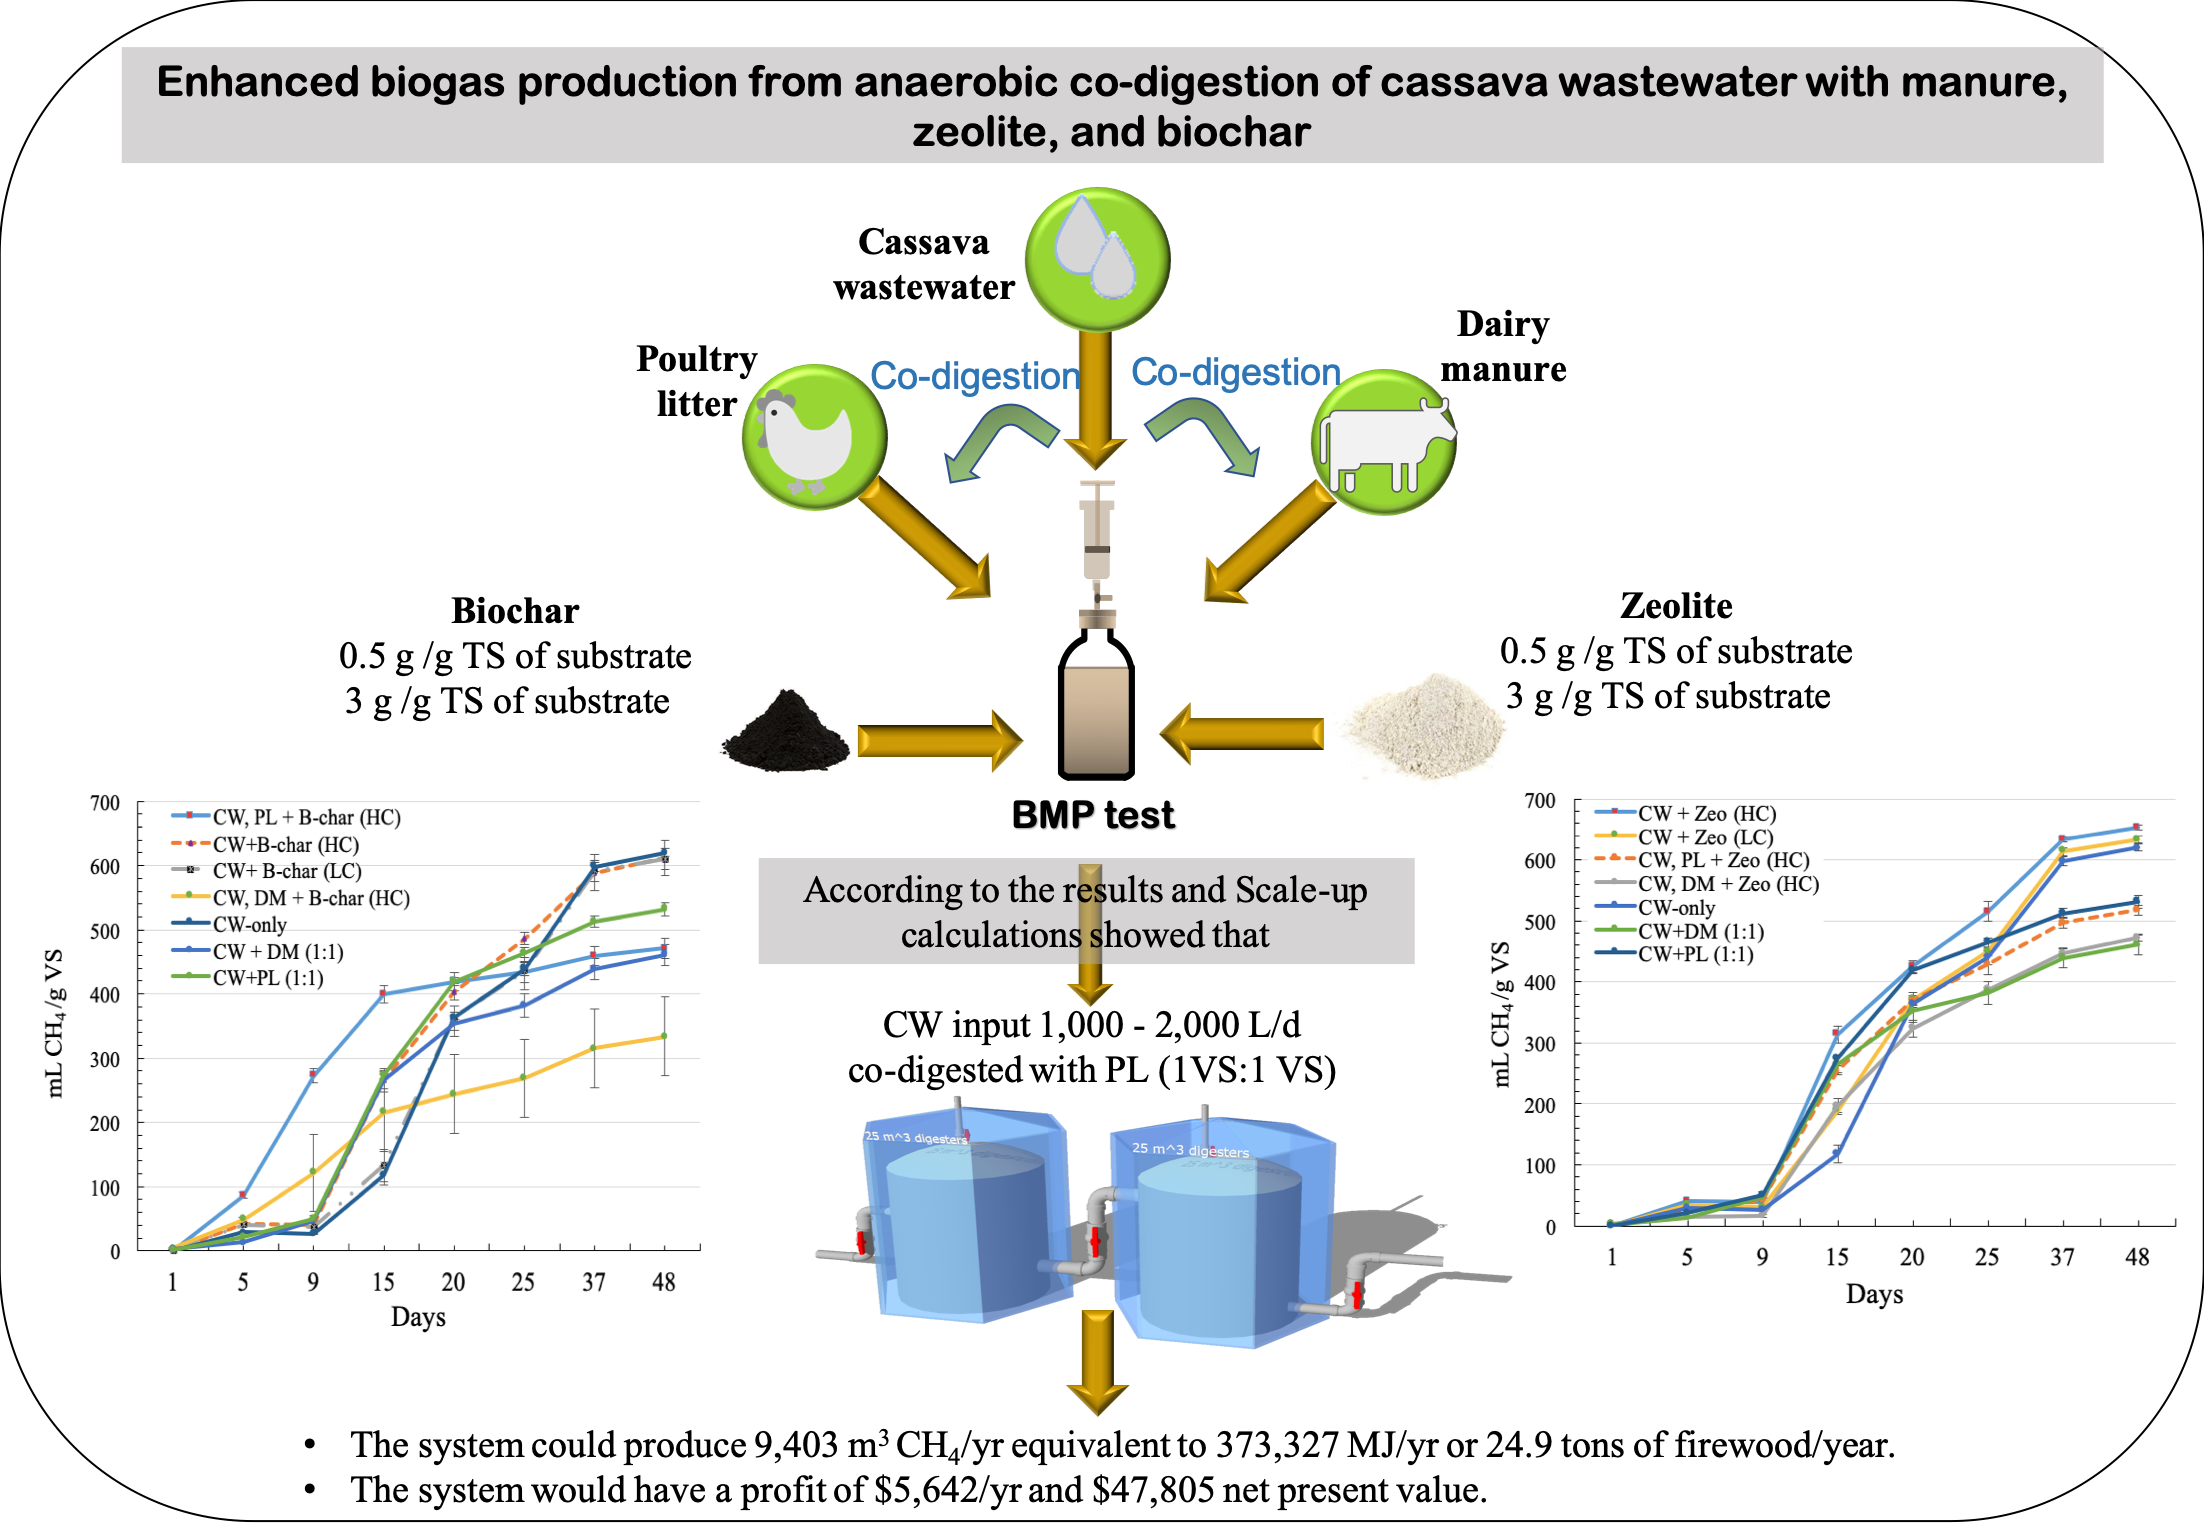
After 48 days of digestion, the cumulative CH4 production (on a per g VS-basis) from CW-only (620 mL CH4/g VS) was 15.8% higher than co-digestion of CW:DM at a 2:1 ratio (522 mL CH4/g VS; p-value < 0.001; Figure 1; Table 3). The CW-only digestion had 5.8% higher CH4 production than CW:PL at a 2:1 ratio (590 mL CH4/g VS), but this difference was not statistically significant (p-value = 0.864). Similarly, CW-only was 14.4% and 25.6% higher respectively, than CW co-digested at a 1:1 ratio with DM and PL (461 and 531 mL CH4/g VS; p-values < 0.001 and 0.001, respectively).
When CH4 production is normalized on a VS basis, the efficiency of the organic material to CH4 conversion process is shown. These results show that CW can be co-digested or digested alone, and co-digestion of CW with manure resulted in similar or slightly lower CH4 production efficiency values (5.8%–25.6% decrease with co-digestion). It should be noted that the inoculum included in the digestion reactor helped to lower the C:N ratio from 27.8 in the CW substrate to 21.7 in the digestion reactor with the inoculum and CW mixture, with an increase in the pH value from 5.53 to 7.75 due to inoculum inclusion. The significance of pH as a key determining factor for AD process, especially in full-scale continuous reactors were highlighted in Calabrò et al. [33,34]. In field conditions, it would be important to have a viable inoculum source for initiating digestion and to consider a co-digestion material that can help to neutralize the low pH and is high in nitrogen to ensure that the microbes are not nitrogen-limited.
3.2.2. Cumulative CH4 Production Based on the Mass of Substrate Added to the Digestion Reactor
Due to the high VS concentration of the manure substrates, the PL-only reactors had an order a magnitude higher CH4 production on a mass basis (193 mL CH4/g substrate) than DM-only (22.9 mL CH4/g substrate) and all CW reactors (Table 3). The DM and PL manure substrates had 84.8% to 97.2% higher VS concentrations respectively, than the CW substrate (Table 2). Digestion of CW yielded 83.9% and 74.8% more cumulative CH4 (on a VS-basis) than DM-only and PL-only digestion (100 and 156 mL CH4/g VS, respectively; Table 2), as the organic matter in the CW substrate was converted into CH4 more efficiently than the manure substrates, likely due to the more recalcitrant nature of the VS in the complex manure substrates compared to the cassava wastewater. The CW:PL (1:1) had the highest CH4 production (17.9 mL CH4/g substrate) of the CW co-digestion treatments (on a mass basis). The PL co-substrate had higher CH4 production efficiencies than CW co-digested with DM at both the 1:1 and 2:1 ratios (p-values = 0.017 and 0.025, respectively), indicating that a continuously-fed CW digestion system would benefit from co-digesting with PL due to the high organic loading of the PL substrate.
3.2.3. Cumulative CH4 Production Based on Digestion Period
While the overall CH4 production efficiency from the CW-only was higher than the manure substrates, the CW-only treatment produced 118 mL CH4/g VS (19% of the cumulative CH4) in the first 15 days of the 48-day digestion period (Table 4; Figure 2). During this first third of the digestion period (Days 1–15), the CH4 production from the CW-only treatment was significantly lower (38.6%) than CW:DM at 1:1 (265 mL CH4/g VS) and 32.6% lower CW:PL at 1:1 (274 mL CH4/g VS; p-values < 0.001). When the ratio of CW to manure was doubled (2:1), the CH4 production from Days 1–15 in the CW:PL (2:1) and CW:DM (2:1) reactors was 263 and 211 mL CH4/g VS respectively, which was 25.7 and 21.5% higher than CW-only (p-value < 0.001 and 0.002, respectively).
There was no significant difference in cumulative CH4 production between CW:PL at the 1:1 and 2:1 ratios (p-value = 0.087). The CW:PL (2:1) had 4.1% less CH4 in the first 15 days of digestion, showing a slight decrease in lag phase during digestion without a significant effect on the overall CH4 production potential (Figure 2). A similar trend was observed when comparing the CW:DM at 1:1 and 2:1 ratios, with 265 and 211 mL CH4/g VS respectively, in the first 15 days of digestion, which were not significantly different (p-value of 0.061).
Generally, co-digestion of CW with PL or DM reduced the lag phase for CH4 production. The highest rate of CH4 production occurred within the first two weeks, which is consistent with the results from Witarsa and Lansing [30], where a large percentage of CH4 production from digestion of separated and unseparated dairy manure (DM) occurred in the first 16 days of a 216 day digestion period (40% and 36%, respectively). Cassava wastewater (CW-only) generated 19% of the total cumulative CH4 in the first 15 days of our 48-day digestion period, while DM-only generated 48.2% of the total cumulative CH4 and CW:DM (1:1) generated 57.6% of the cumulative CH4 production in the first 15 days.
The observed increase in CH4 production with co-digestion of CW within the first two weeks was consistent with other findings, which emphasized the advantages of co-digestion over single digestion of substrates [2,32,35,36,37]. Panichnumsin et al. [2] examined the potential of co-digestion of cassava pulp and swine manure in a semi-continually fed stirred tank reactor in mesophilic conditions (37 °C) at a constant organic loading rate of 3.5 kg VS/m3d for 15 days and reported a 41% increase in CH4 yield compared with digestion of swine manure alone. Similar to our study, a batch experiment conducted by Riano et al. [37] at 35 °C for 55 days reported that co-digestion of winery wastewater (10–40%) and swine manure increased CH4 production by 45–75% and improved digestion stability compared to digestion of swine manure alone.
Abouelenien et al. [35] co-digested, poultry manure (PM) with mixed agricultural wastes comprised of coconut wastes, cassava wastes, and coffee grounds. The cassava waste used in their study was root residue and wet cake from cassava, while our study utilized cassava wastewater. Similar to our study, co-digestion was conducted under mesophilic conditions (35 °C) and saw an increase in CH4 yield of up to 50% (506 mL CH4/g VS) compared to PM-only after 40 days of digestion. Their results were comparable to our study, with cumulative CH4 production of 531 mL CH4/g VS for CW:PL (1:1) after 48 days, which was significantly (p-value = 0.001) higher than PL-only, which yielded only 156 mL CH4/g VS. Contrary to our findings, Abouelenien et al. [37] reported an elongation of the lag phase due to co-digestion, which was attributed to the complex organic matter in the mixed agricultural wastes compared to the PM substrate. Whereas in our study, a reduction in lag phase was recorded due to the liquid state of the CW substrate, which was more readily accessible for the rate-limiting hydrolysis phase of digestion.
3.3. Impact of Porous Adsorbent on AD of Cassava Wastewater
3.3.1. Zeolite Addition with Cassava Wastewater Digestion
Digesting CW and a high concentration (HC) of zeolite (CW + ZEO-HC) produced the highest cumulative CH4 (653 mL CH4/g VS) for all treatments after 48 days, followed by the treatment with a lower concentration (LC) of zeolite (CW + ZEO-LC), which produced 634 mL CH4/g VS, with no significant different between the two zeolite concentrations (p-value = 1.00; Figure 1; Table 2). The two porous adsorbents used in this study at the HC were also not significantly different (p-value = 0.50), with the cumulative CH4 produced from CW + ZEO-HC (653 mL CH4/g VS) only slightly higher than CW + B-Char-HC (611 mL CH4/g VS).
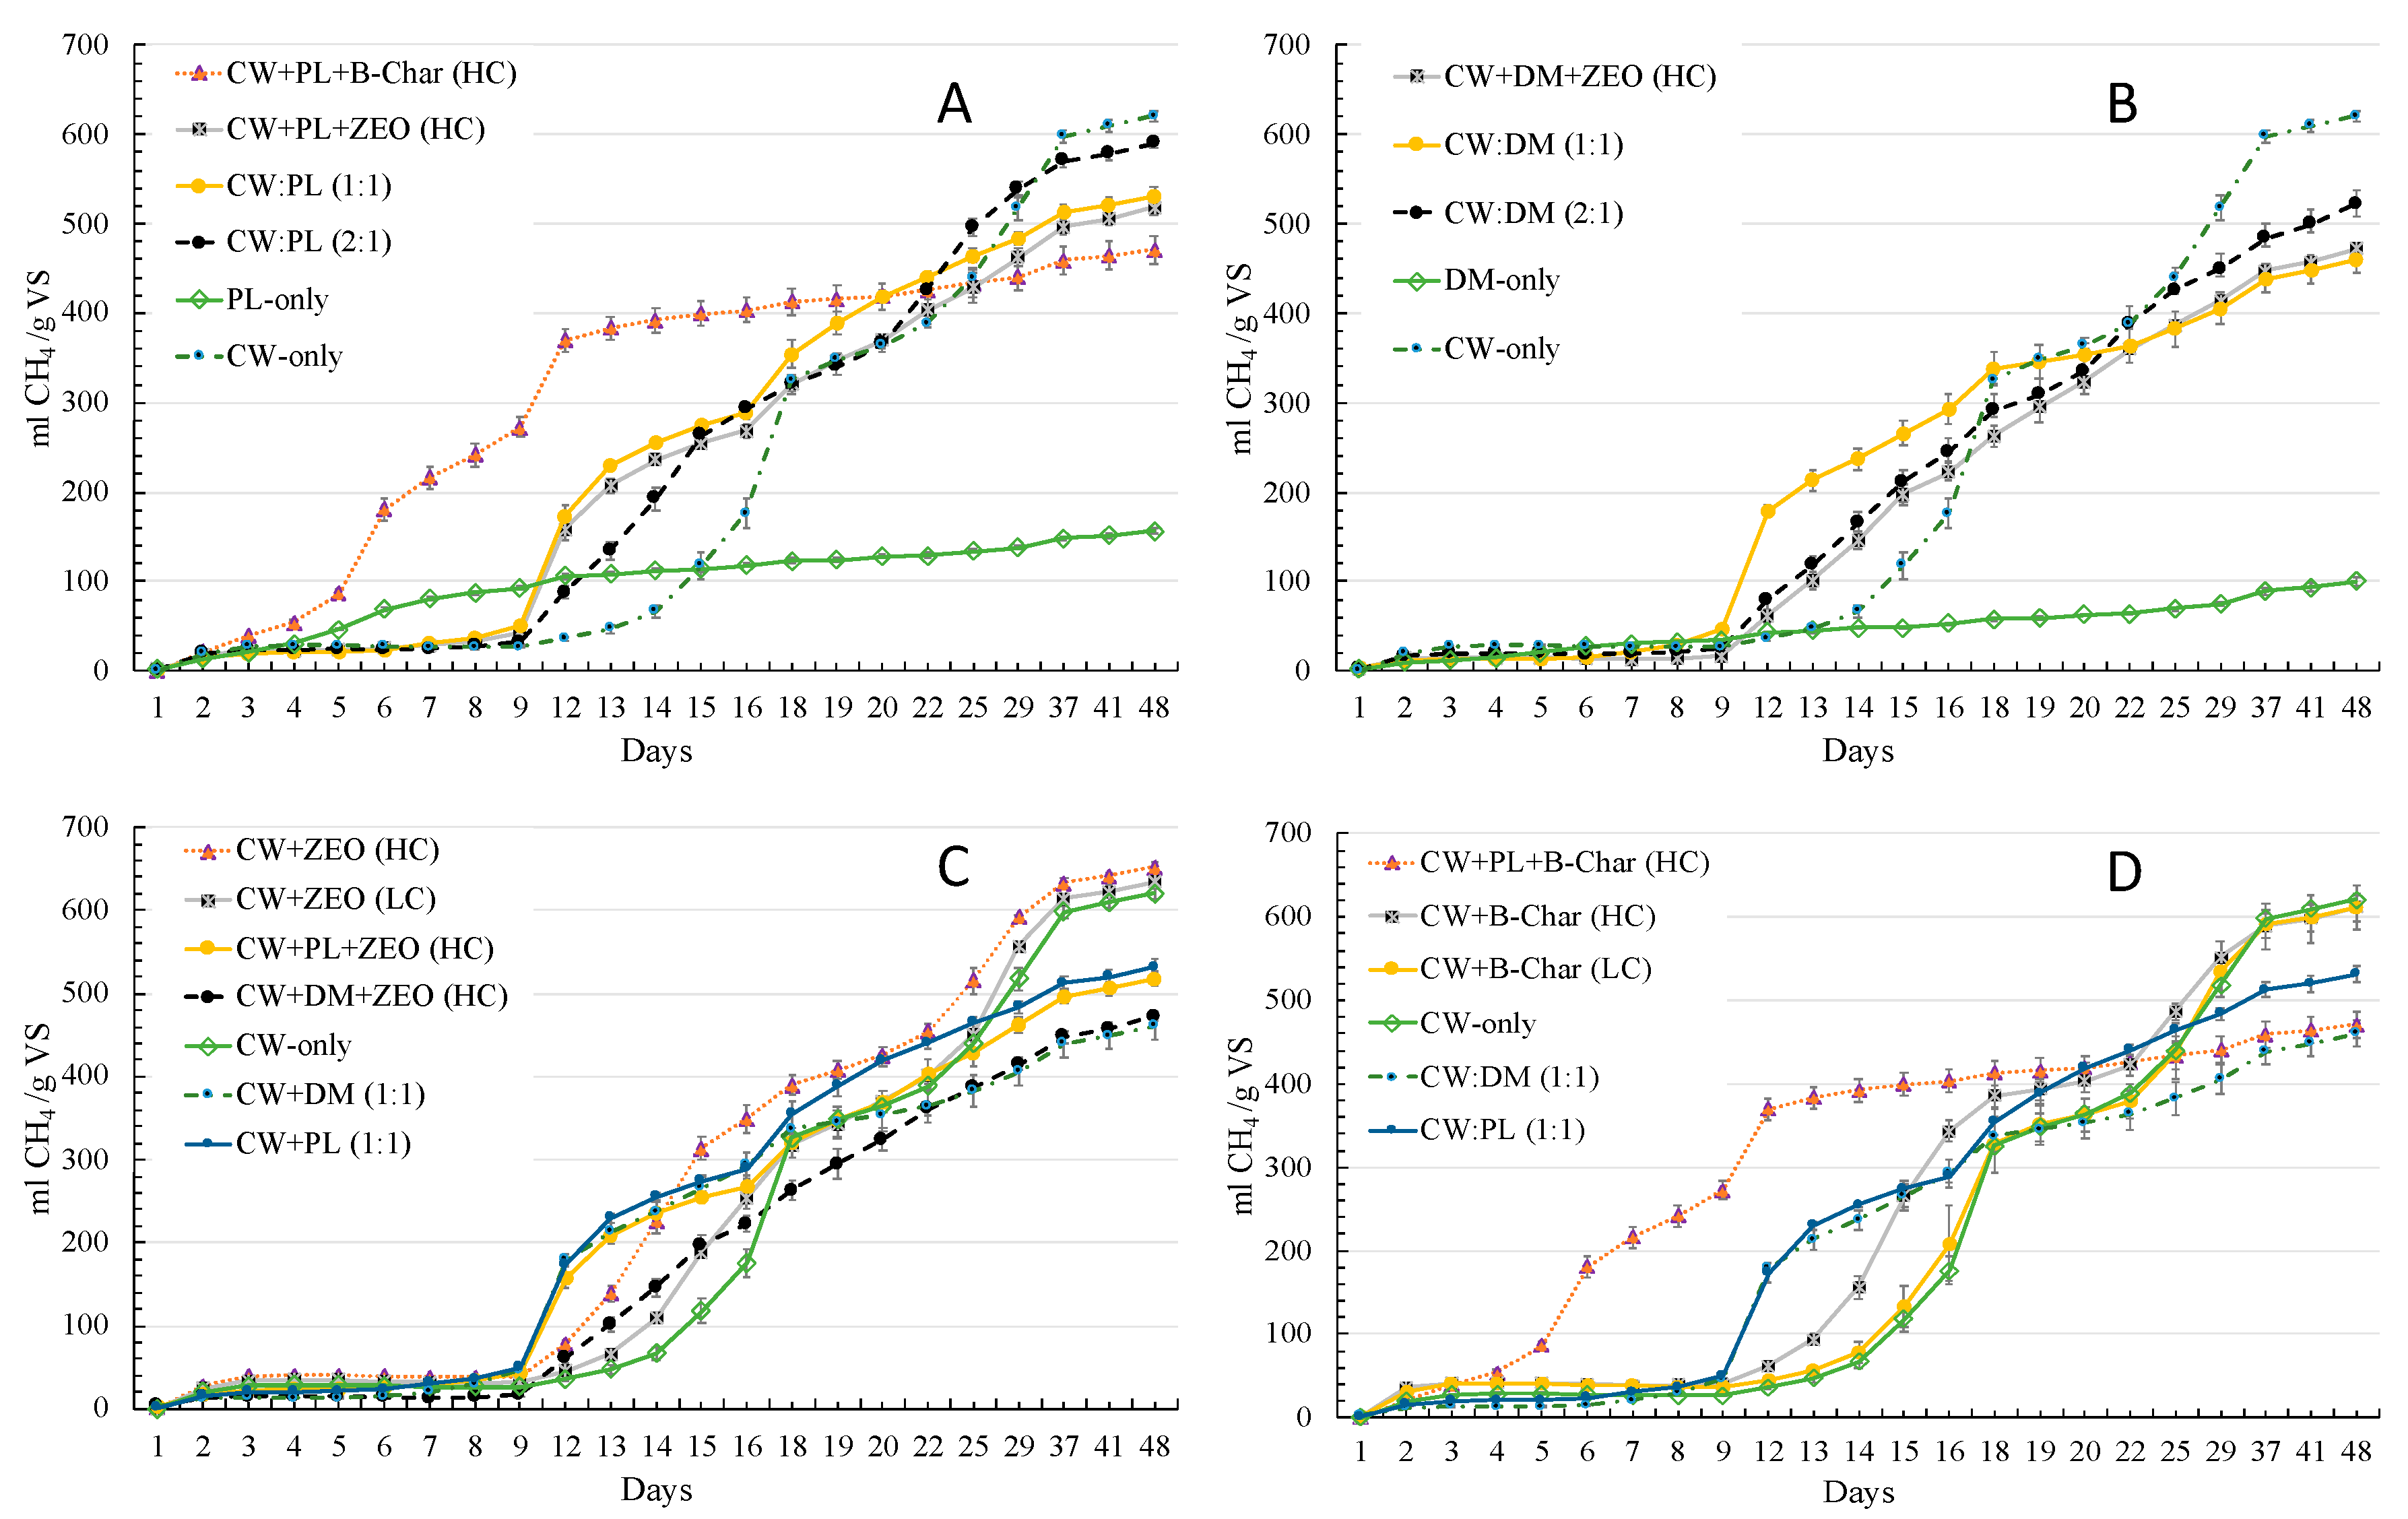
After 9 days of digestion, a significantly higher percentage of the total CH4 production (37.8%) was observed in CW + ZEO-HC compared to CW-only (Table 3; Figure 2). This observation is consistent with Milan et al., where doses of zeolite between 2 and 4 g/L increased CH4 production of swine manure and of zeolite, while doses above 6 g/L inhibited the process [38]. In our study, the effect of zeolite on digestion of CW, singly and co-digested with manure, the 3 g/L of zeolite (CW + ZEO-HC) had 90.7% and 15.5% more CH4 production on Days 15 and 20 than CW-only (p-value < 0.001 and 0.045, respectively). The effect of zeolite addition was significant during the early stages of digestion process, up to the first three weeks. At Days 37 and 48, there was no significant difference between CW-only and CW + ZEO-HC, with the cumulative CH4 from CW + ZEO-HC only 5.1% higher than CW-only (p-values = 0.68 and 0.82, respectively).
3.3.2. Biochar Addition with Cassava Wastewater Digestion
Similarly, an increase in CH4 production with a shortened lag phase was observed due to biochar addition (Figure 2). The effect of biochar addition in reducing the lag phase in AD has been previously reported [39,40]. Jang et al. showed a 24.9% increase in cumulative CH4 (467 mL CH4/g VS) with 10 g/L of biochar compared to 1 g/L of biochar (395 mL CH4/g VS) with mesophilic conditions and 40 days of digestion [40]. Our findings showed that on Day 15, CW + B-Char-HC had 76.8% more CH4 production than the CW-only treatment, which Jang et al. suggested was due to the high alkalinity of biochar enhancing CH4 production and shortening the lag phase [40].
Comparing the concentrations of porous adsorbent added, there was a significant difference in cumulative CH4 production between the low and high concentrations of biochar (p-value < 0.001) on Day 15 of digestion (Figure 2). In the first two weeks of digestion, CW + B-Char-HC yielded 265 mL CH4/g VS, while CW + B-Char-LC yielded 133 mL CH4/g VS, illustrating the decrease in lag phase with an increase in the quantity of biochar added.
Comparing the LC and HC of zeolite showed no significant difference (p-value = 1.000) after 48 days of digestion. The ZEO-LC and ZEO-HC at Day 15 produced 8.1% and 4.7% more CH4 than B-Char-LC and HC, respectively. Yet, by 48 days, there were no significant differences between LC and HC of B-Char and ZEO (p-values = 0.974 and 1.000, respectively). The observed lag in digestion in the mixtures containing CW alone or low concentrations of zeolite or biochar could be as a result of the rapid acidification of CW and inadequate buffer to provide the necessary buffer for microbial community and methanogens, and thus, a longer lag phase for microbial recovery.
The combined effects of manure and biochar showed that CW + PL + B-Char produced significantly more CH4 at Days 15 and 20 (273 and 400 mL CH4/g VS, respectively; p-values < 0.001) than CW + B-Char (39.9 and 265 mL CH4/g VS, respectively). After Day 20, the daily CH4 production of CW + PL + B-Char decreased, while CW + B-Char increased and resulted in higher cumulative CH4 over 44 days. While the addition of PL or DM to CW increased CH4 production in the first 15 days of digestion, the CW + PL + B-Char-HC treatment yielded 400 mL CH4/g VS (84.8% of total cumulative CH4) in the first 15 days, with this reduction is lag phase likely attributed to the combined presence of biochar and poultry litter.
The ability of biochar to catalyze digestion by providing surface area for the colonization of the microbial cell was previously reported in a review by Mumme et al. [21]. The CW substrate used in our experiment contained a low pH and when co-digested with biochar and manure showed an improved AD process due to the buffer provided by manure and biochar [20], as observed in the first two weeks of our experiment.
3.4. Volatile Solids and COD Reduction during Digestion
Chemical oxygen demand (COD) and VS reduction is associated with CH4 production. The substrate mixture containing CW + ZEO-HC showed the highest VS and COD reductions during digestion (66% and 49%), which corresponded with the highest cumulative CH4 production (Table 2). Similar trends were reported in previous work [18,29]. Jiraprasertwong et al. used cassava wastewater in a three-stage up flow anaerobic sludge blanket (UASB) reactor and showed a steady reduction in COD removal with increasing COD loading and an increasing biogas production up to 15 kg COD/m3d (one reactor) and 10 kg/m3d (two reactors) [18]. For comparison, our batch study had a one-time COD loading for each substrate tested that ranged from 25 to 43 kg COD/m3, respectively.
3.5. Scale-Up Model
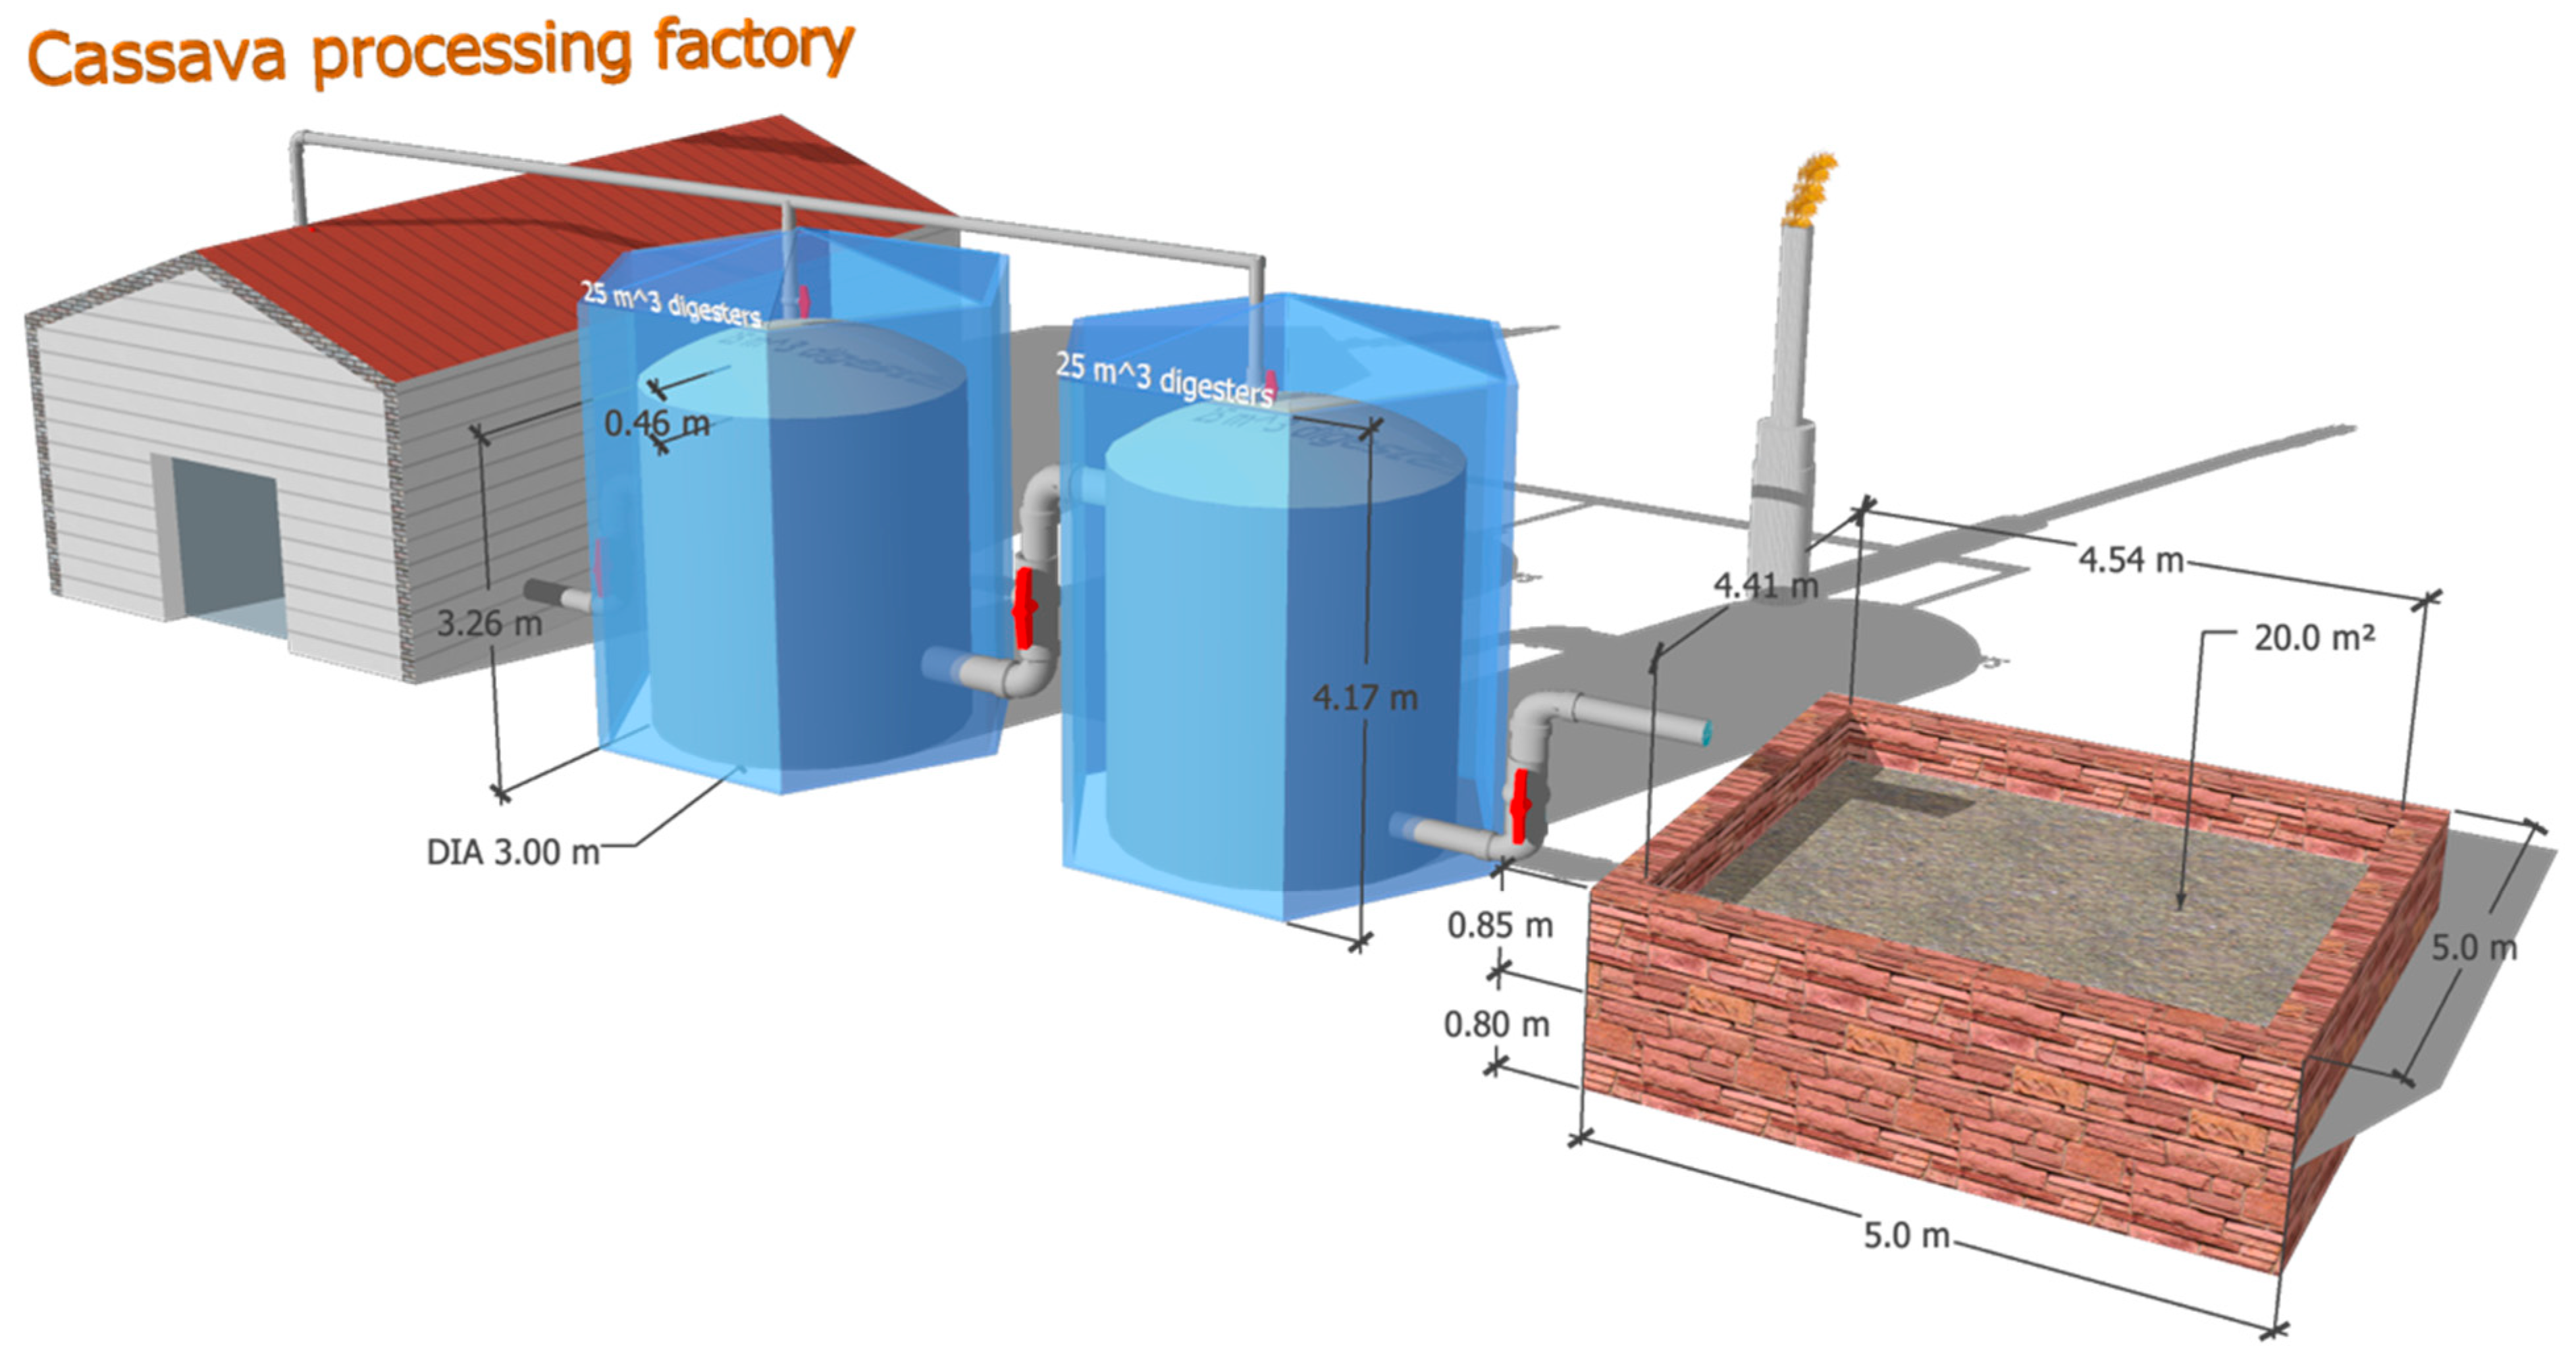
A medium size cassava factory in Nigeria processes 3000–6000 kg of cassava tubers per day, yielding 1000–2000 L CW/d. The size of the digester needed to co-digest CW with PL was calculated to be 50 m3 (40 m3 liquid and 10 m3 biogas headspace), as shown in Figure 3. The quantity of PL added to digester would vary from 56 kg/d during high cassava production (March to October) to 28 kg/d during low cassava production (November to February) to maintain a 1:1 ratio (by VS). The hydraulic retention time (HRT) would vary from 20 days during high cassava production to 40 days during low cassava production, which should result in 78.8% to 96.5% of the cumulative CH4 production from the 48-day BMP test (Table 4). Using the results from CW:PL (1:1), the daily CH4 production in the 50 m3 digester would be 28.9 m3 CH4/d (20-day HRT) to 19.2 m3 CH4/d (40-day HRT), with an annual CH4 production of 9403 m3 CH4/yr. Using Gibbs free energy (ΔGCH4 = 890.4 kJ/mol) [41], the annual CH4 production would be equivalent to 373,327 MJ/yr and 24.9 tons of firewood/yr saved, based on 15 MJ/kg of firewood used for heating [42].
The estimated cost of the digester system, including two flexible PVC bag digesters, greenhouse enclosures, plumbing, and gas piping, was estimated to be $7500 ($150/m3 digester) (Shenzhen Puxin Technology Co. Ltd., Shenzhen, China). This cost does not take into consideration the land value or the cost of a heating system. A heating system would likely not be necessary in Nigeria, with average maximum and minimum ambient temperatures of 33 and 25 °C respectively [43], which are within the mesophilic temperature range. While biogas production decreases with temperature, this decrease is more pronounced below the mesophilic range (<25 °C) [30]. The digester design also includes a greenhouse covering the digester, which our previous research has shown can significantly increase (6.8–24.5 °C) the digester temperature and help maintain a more consistent digestion temperature throughout the day [44]. Assuming a 10-year lifetime and 8% discount rate, the discounted capital investment would be $8617. Based on the expected annual CH4 production, the cost would be $0.09/m3 CH4, which does not take into account the value of the produced fertilizer from the digester effluent. Assuming a natural gas price of $0.6/m3 ($1.2/kg natural gas) [45], the system would have a yearly profit of $5642/yr. The net present value (NPV) is calculated as $47,805, which does not take into consideration the value of the digestate, which can provide valuable nutrients to produce cassava and/or other crops. The price of adding zeolite or biochar was not included, since these additives may not be available and did not increase the overall biogas production, only decreased the lag phase associated with biogas production. If a higher throughput is desired or if the pH is not stabilized, the addition zeolite or biochar could be added to the full-scale system, if available.
4. Conclusions
Anaerobic digestion of cassava wastewater was shown to be viable, with CH4 production enhanced by additions of zeolite and biochar. Co-digestion with dairy and poultry manure decreased the lag phase of digestion but did not increase overall CH4 production, likely due to the more recalcitrant materials within the manure feedstock compared to CW. While CH4 production was more efficient with CW-only (higher CH4/g VS included), more gross energy production (CH4/g substrate added) occurred with the manure substrates due to the higher VS content of these substrates compared to the relatively dilute CW. Poultry litter generally contributed to higher CH4 production when digested with CW compared to the use of DM, likely due to the higher N content of the PL raising the low C:N value of CW. All combinations of DM and PL showed that adding CW increased their overall CH4 potential compared to the mono-digestion of PL or DM-only.
Co-digesting CW with PL with or without biochar in a typical rural cassava processing industry can significantly enhance the valorization of CW by yielding more CH4 in less time and an estimated profit of >$5000/yr, with the creation of valuable fertilizer. The reduction in COD achieved through the digestion of CW could contribute significantly to reducing pollution of surface water due to indiscriminate disposal of untreated CW, as currently practiced in many rural settings. The potential application of digestate for land treatment should be further explored as a means of adding value to the overall cassava processing and value chain.
Author Contributions
Conceptualization, C.G.A., A.H., and S.L.; Data curation, C.G.A.; Formal analysis, C.G.A. and A.H.; Funding acquisition, C.G.A. and S.L.; Investigation, C.G.A.; Methodology, C.G.A., A.H., and S.L.; Project administration, S.L.; Resources, S.L.; Software, C.G.A. and A.H.; Supervision, S.L. and A.H.; Validation, C.G.A. and A.H.; Visualization, C.G.A., A.H., and S.L.; Writing—original draft, C.G.A.; Writing—review and editing, C.G.A., A.H., and S.L. All authors have read and agreed to the published version of the manuscript.
Funding
This research was funded by the US Department of State Fulbright Foreign Student Program, administered by International Institute for Education (IIE) and conducted at the Department of Environmental Science and Technology (ENST) at the University of Maryland, College Park, USA.
Acknowledgments
Special thanks to all the graduate students, especially Abhinav Choudhury, and to the undergraduate students who helped during sample preparation.
Conflicts of Interest
The authors declare no conflict of interest.
References
- Glanpracha, N.; Annachhatre, A.P. Anaerobic co-digestion of cyanide containing cassava pulp with pig manure. Bioresour. Technol. 2016, 214, 112–121. [Google Scholar] [CrossRef] [PubMed]
- Panichnumsin, P.; Nopharatana, A.; Ahring, B.; Chaiprasert, P. Production of methane by co-digestion of cassava pulp with various concentrations of pig manure. Biomass Bioenergy 2010, 34, 1117–1124. [Google Scholar] [CrossRef]
- Sun, L.; Wan, S.; Yu, Z.; Wang, Y.; Wang, S. Anaerobic biological treatment of high strength cassava starch wastewater in a new type up-flow multistage anaerobic reactor. Bioresour. Technol. 2012, 104, 280–288. [Google Scholar] [CrossRef] [PubMed]
- FAOStat 2017. Available online: http://www.fao.org/faostat/en/#data/QC/visualize (accessed on 4 November 2019).
- Achi, C.G.; Coker, A.O.; Sridhar, M.K.C. Utilization and Management of Bioresources. Proceedings of 6th IconSWM; Kumar Ghosh, S., Ed.; Springer: Singapore, 2018; pp. 77–90. [Google Scholar]
- Araujo, I.R.C.; Gomes, S.D.; Tonello, T.U.; Lucas, S.D.; Mari, A.G.; Vargas, R.J. Methane Production from Cassava Starch Wastewater in Packed-Bed Reactor and Continuous Flow. Eng. Agric. 2018, 38, 270–276. [Google Scholar] [CrossRef] [Green Version]
- FAO; IFAD. A review of cassava in Africa with country case studies on Nigeria, Chana, the United Republic of Tanzania, Uganda and Benin. In Processing of the Validation Forum on the Global Cassava Development Strategy; The Food and Agricultural Organization of the United Nations: Rome, Italy; International Fund for Agricultural Development: Rome, Italy, 2005; Volume 2, Available online: http://www.fao.org/3/a-a0154e.pdf (accessed on 4 November 2019).
- Zhang, M.; Xie, L.; Yin, Z.; Khanal, S.K.; Zhou, Q. Biorefinery approach for cassava-based industrial wastes: Current status and opportunities. Bioresour. Technol. 2016, 215, 50–62. [Google Scholar] [CrossRef] [PubMed] [Green Version]
- Kaewkannetra, P.; Imai, T.; Garcia-Garcia, F.J.; Chiu, T.Y. Cyanide removal from cassava mill wastewater using Azotobactor vinelandii TISTR 1094 with mixed microorganisms in activated sludge treatment system. J. Hazard. Mater. 2009, 172, 224–228. [Google Scholar] [CrossRef] [PubMed]
- Hassanein, A.; Lansing, S.; Tikekar, R. Impact of metal nanoparticles on biogas production from poultry litter. Bioresour. Technol. 2019, 275, 200–206. [Google Scholar] [CrossRef]
- Paulo, P.L.; Colman-Novaes, T.A.; Obregao, L.D.S.; Boncz, M.A. Anaerobic Digestion of Cassava Wastewater Pre-treated by Fungi. Appl. Biochem. Biotechnol. 2013, 169, 2457–2466. [Google Scholar] [CrossRef] [PubMed]
- Ubalua, A.O. Cassava wastes: Treatment options and value addition alternatives. Afr. J. Biotechnol. 2007, 6, 2065–2073. [Google Scholar]
- Palma, D.; Fuess, L.T.; de Lima-Model, A.N.; da Conceicao, K.Z.; Cereda, M.P.; Tavares, M.H.F.; Gomes, S.D. Using dolomitic limestone to replace conventional alkalinization in the biodigestion of rapid acidification cassava processing wastewater. J. Clean. Prod. 2018, 172, 2942–2953. [Google Scholar] [CrossRef]
- Amorim, M.C.C.; de S. e Silva, P.T.; Gavazza, S.; Sobrinho, M.A. Viability of rapid startup and operation of UASB reactors for the treatment of cassava wastewater in the semi-arid region of northeastern Brazil. Can. J. Chem. Eng. 2018, 96, 1036–1044. [Google Scholar] [CrossRef]
- Glanpracha, N.; Basnayake, B.M.N.; Rene, E.R.; Lens, P.N.L.; Annachhatre, A.P. Cyanide degradation kinetics during anaerobic co-digestion of cassava pulp with pig manure. Water Sci. Technol. 2018, 77, 650–660. [Google Scholar] [CrossRef] [PubMed]
- Carbone, S.R.; da Silva, F.M.; Tavares, C.R.; Dias Filho, B.P. Bacterial population of a two-phase anaerobic digestion process treating effluent of cassava starch factory. Environ. Technol. 2002, 23, 591–597. [Google Scholar] [CrossRef] [PubMed]
- Jiang, H.; Qin, Y.; Gadow, S.I.; Ohnishi, A.; Fujimoto, N.; Li, Y.Y. Bio-hythane production from cassava residue by two-stage fermentative process with recirculation. Bioresour. Technol. 2018, 247, 769–775. [Google Scholar] [CrossRef] [PubMed]
- Jiraprasertwong, A.; Maitriwon, K.; Chavadej, S. Production of biogas from cassava wastewater using a three-stage upflow anaerobic sludge blanket (UASB) reactor. Renew. Energy 2019, 130, 191–205. [Google Scholar] [CrossRef]
- Rajagopal, R.; Saady, N.M.C.; Torrijos, M.; Thanikal, J.V.; Hung, Y. Sustainable Agro-Food Industrial Wastewater Treatment Using High Rate Anaerobic Process. Water 2013, 5, 292–311. [Google Scholar] [CrossRef] [Green Version]
- Fagbohungbe, M.O.; Herbert, B.M.J.; Hurst, L.; Ibeto, C.N.; Li, H.; Umani, S.Q.; Semple, K.T. The challenges of anaerobic digestion and the role of biochar in optimizing anaerobic digestion. Waste Manag. 2017, 61, 236–249. [Google Scholar] [CrossRef] [Green Version]
- Mumme, J.; Srocke, F.; Heeg, K.; Werner, M. Use of biochars in anaerobic digestion. Bioresour. Technol. 2014, 164, 189–197. [Google Scholar] [CrossRef]
- Montalvo, S.; Guerrero, L.; Borja, R.; Sanchez, E.; Milan, Z.; Cortes, I.; Rubia, M.A. Application of natural zeolites in anaerobic digestion processes: A review. Appl. Clay Sci. 2012, 58, 125–133. [Google Scholar] [CrossRef] [Green Version]
- Montalvo, S.; Diaz, F.; Guerrero, L.; Sanchez, E.; Borja, R. Effect of particle size and doses of zeolite addition on anaerobic digestion processes of synthetic and piggery wastes. Process Biochem. 2005, 40, 1475–1481. [Google Scholar] [CrossRef]
- Lin, R.; Cheng, J.; Yang, Z.; Ding, L.; Zhang, J.; Zhou, J.; Cen, K. Enhanced energy recovery from cassava ethanol wastewater through sequential dark hydrogen, photo hydrogen and methane fermentation combined with ammonium removal. Bioresour. Technol. 2016, 214, 686–691. [Google Scholar] [CrossRef] [PubMed]
- Roopnarain, A.; Adeleke, R. Current status, hurdles and future prospects of biogas digestion technology in Africa. Renew. Sustain. Energy Rev. 2017, 67, 1162–1179. [Google Scholar] [CrossRef]
- Moody, L.B.; Burns, R.T.; Bishop, G.; Sell, S.T.; Spajic, R. Using biochemical methane potential assays to aid in co-substrate selection for co-digestion. Appl. Eng. Agric. 2011, 27, 433–439. [Google Scholar] [CrossRef]
- American Public Health Association (APHA); American Water Works Association (AWWA); Water Environment Federation (WEF). Standard Methods for the Examination of Water and Wastewater, 21st ed.; APHA-AWWA-WEF: Washington, DC, USA, 2005. [Google Scholar]
- Adams, R.C.; MacLean, F.S.; Dixon, J.K.; Bennett, F.M.; Martin, G.I.; Lough, R.C. The Utilization of Organic Wastes in N.Z.: Second Interim Report of the Inter-Departmental Committee. 1951. Available online: http://compost.css.cornell.edu/calc/carbon.html (accessed on 28 November 2019).
- Peres, S.; Monteiro, M.R.; Ferreira, M.L.; do Nascimento, A.F., Jr.; Palha, A.P. Anaerobic Digestion Process for the Production of Biogas from Cassava and Sewage Treatment Plant Sludge in Brazil. BioEnergy Res. 2018, 12, 150–157. [Google Scholar] [CrossRef]
- Witarsa, F.; Lansing, S. Quantifying methane production from psychrophilic anaerobic digestion of separated and unseparated dairy manure. Ecol. Eng. 2015, 78, 95–100. [Google Scholar] [CrossRef]
- Lin, R.; Cheng, J.; Murphy, J.D. Unexpectedly low biohydrogen yields in co-fermentation of acid pretreated cassava residue and swine manure. Energy Convers. Manag. 2017, 151, 553–561. [Google Scholar] [CrossRef]
- Hagos, K.; Zong, J.; Li, D.; Liu, C.; Lu, X. Anaerobic co-digestion process for biogas production: Progress, challenges and perspectives. Renew. Sustain. Energy Rev. 2017, 76, 1485–1496. [Google Scholar] [CrossRef]
- Calabrò, P.S.; Fazzino, F.; Folino, A.; Paone, E.; Komilis, D. Semi-Continuous Anaerobic Digestion of Orange Peel Waste: Effect of Activated Carbon Addition and Alkaline Pretreatment on the Process. Sustainability 2019, 11, 3386. [Google Scholar] [CrossRef] [Green Version]
- Calabrò, P.S.; Fazzino, F.; Folino, A.; Scibetta, S.; Sidari, R. Improvement of semi-continuous anaerobic digestion of pre-treated orange peel waste by the combined use of zero valent iron and granular activated carbon. Biomass Bioenergy 2019, 129. [Google Scholar] [CrossRef]
- Abouelenien, F.; Namba, Y.; Kosseva, M.R.; Nishio, N.; Nakashimeda, Y. Enhancement of methane production from co-digestion of chicken manure with agricultural wastes. Bioresour. Technol. 2014, 159, 80–87. [Google Scholar] [CrossRef]
- Abouelenien, F.; Namba, Y.; Nishio, N.; Nakashimeda, Y. Dry Co-Digestion of Poultry Manure with Agriculture Wastes. Appl. Biochem. Biotechnol. 2016, 178, 932–946. [Google Scholar] [CrossRef] [PubMed]
- Riaño, B.; Molinuevo, B.; García-González, M.C. Potential for methane production from anaerobic co-digestion of swine manure with winery wastewater. Bioresour. Technol. 2011, 102, 4131–4136. [Google Scholar] [CrossRef] [PubMed]
- Milan, Z.; Sanchez, E.; Weiland, P.; Borja, R.; Martõn, A.; Ilangovan, K. Infuence of different natural zeolite concentrations on the anaerobic digestion of piggery waste. Bioresour. Technol. 2001, 80, 37–43. [Google Scholar] [CrossRef]
- Fagbohungbe, M.O.; Herbert, B.M.; Hurst, L.; Li, H.; Usmani, S.Q.; Semple, K.T. Impact of biochar on the anaerobic digestion of citrus peel waste. Bioresour. Technol. 2016, 216, 142–149. [Google Scholar] [CrossRef] [PubMed]
- Jang, H.M.; Choi, Y.K.; Kan, E. Effects of dairy manure-derived biochar on psychrophilic, mesophilic and thermophilic anaerobic digestions of dairy manure. Bioresour. Technol. 2018, 250, 927–931. [Google Scholar] [CrossRef] [PubMed]
- Hassanein, A.; Witarsa, F.; Guo, X.; Yong, L.; Lansing, S. Next generation digestion: Complementing anaerobic digestion (AD) with a novel microbial electrolysis cell (MEC) design. Int. J. Hydrogen Energy 2017, 42, 28681–28689. [Google Scholar] [CrossRef]
- FAO 1998, Woodfuel Flow Study of Phnom Penh, Cambodia. 1998. Available online: http://www.fao.org/3/x5667e/x5667e04.htm (accessed on 28 November 2019).
- World Weather online. Ibadan Monthly Climate Averages. 2019 November 2019. Available online: https://www.worldweatheronline.com/ibadan-weather-averages/oyo/ng.aspx (accessed on 28 November 2019).
- Hassanein, A.; Qiu, L.; Junting, P.; Yihong, G.; Witarsa, F.; Hassanain, A. Simulation and validation of a model for heating underground biogas digesters by solar energy. Ecol. Eng. 2015, 82, 336–344. [Google Scholar] [CrossRef]
- Asikhia, O.; Orugbo, D. Marketing Cost Efficiency of Natural Gas in Nigeria. Pet.-Gas Univ. Ploiesti Bull. 2011, LXIII, 1–13. [Google Scholar]
Figure 1.
Cumulative CH4 production based on volatile solids (VS) added to each reactor for cassava wastewater (CW) digested alone and co-digested with poultry litter (PL) shown in (A), co-digestion with dairy manure (DM) shown in (B), and co-digestion with zeolite (ZEO) and biochar (B-Char) at low and high concentrations (LC and HC) shown in (C) and (D), respectively.

Figure 2.
Cumulative methane (CH4) production based on volatile solids (VS) added to each reactor for cassava wastewater (CW) digested alone and co-digested with poultry litter (PL), dairy manure (DM), zeolite (ZEO), and biochar (B-Char) at low and high concentrations (LC and HC) at five time points (Days 9, 15, 20, 37, and 48) in the 48-day digestion period.

Figure 3.
Scale-up model for a cassava processing factory, with two 25 m3 digesters plumbed in series to treat cassava wastewater and poultry manure with the utilization of the digestate for fertilizer.
Figure 3.
Scale-up model for a cassava processing factory, with two 25 m3 digesters plumbed in series to treat cassava wastewater and poultry manure with the utilization of the digestate for fertilizer.


Table 1.
Experimental design showing grams (g) of substrate addition into each triplicate 250 mL reactor.
Table 1.
Experimental design showing grams (g) of substrate addition into each triplicate 250 mL reactor.
| Treatment | Cassava Wastewater (CW) (g) | Zeolite (ZEO) (g) | Biochar (B-Char) (g) | Poultry Litter (PL) (g) | Dairy Manure (DM) (g) | Inoculum (g) | Water (g) |
|---|---|---|---|---|---|---|---|
| CW + PL + ZEO (HC) | 28.9 | 3.4 | 0.0 | 0.8 | 0.0 | 92.1 | 28.2 |
| CW + PL + B-Char (HC) | 28.9 | 0.0 | 3.4 | 0.8 | 0.0 | 92.1 | 28.2 |
| CW:PL (1:1) | 28.9 | 0.0 | 0.0 | 0.8 | 0.0 | 92.1 | 28.2 |
| CW:PL (2:1) | 38.6 | 0.0 | 0.0 | 0.5 | 0.0 | 92.1 | 18.9 |
| CW + DM + ZEO (HC) | 28.9 | 3.4 | 0.0 | 0.0 | 4.4 | 92.1 | 24.7 |
| CW:DM (1:1) | 28.9 | 0.0 | 0.0 | 0.0 | 4.4 | 92.1 | 24.7 |
| CW:DM (2:1) | 38.6 | 0.0 | 0.0 | 0.0 | 2.9 | 92.1 | 16.5 |
| CW + ZEO (HC) | 57.8 | 0.3 | 0.0 | 0.0 | 0.0 | 92.1 | 0.1 |
| CW + ZEO (HC) | 57.8 | 1.5 | 0.0 | 0.0 | 0.0 | 92.1 | 0.1 |
| CW + B-Char (LC) | 57.8 | 0.0 | 0.3 | 0.0 | 0.0 | 92.1 | 0.1 |
| CW + B-Char (HC) | 57.8 | 0.0 | 1.5 | 0.0 | 0.0 | 92.1 | 0.1 |
| CW-only | 57.8 | 0.0 | 0.0 | 0.0 | 0.0 | 92.1 | 0.1 |
| Inoculum-only | 0.0 | 0.0 | 0.0 | 0.0 | 0.0 | 92.1 | 0.0 |
Table 2.
Characterization of the substrates, cassava wastewater (CW), poultry litter (PL), and dairy manure (DM) and the inoculum source, including total solids (TS), volatile solids (VS), chemical oxygen demand (COD), pH, total Kjeldahl nitrogen (TKN), total phosphorus (TP), and the carbon to nitrogen ratio (C:N).
| TS (g/kg) | VS (% TS) | COD (g/L) | pH | TKN (mg N/L) | TP (mg P/L) | C:N Ratio | |
|---|---|---|---|---|---|---|---|
| CW | 17.8 ± 0.7 | 97.2 ± 0.7 | 33.7 ± 0.8 | 5.53 | 375 | 222 | 27.8 |
| PL | 776 ± 1 | 80.0 ± 0.2 | NA | 8.25 | 3675 | 1245 | 13.0 |
| DM | 131 ± 2 | 87.3 ± 0.6 | NA | 7.33 | 3450 | 603 | 15.2 |
| Inoculum | 29.5 ± 0.1 | 73.6 ± 7.0 | 25.1 ± 0.3 | 7.55 | 3050 | 1225 | 3.91 |
Table 3.
Reductions in volatile solids (VS) and chemical oxygen (COD) during digestion for the substrate and inoculum in each reactor. The cumulative methane (CH4) production is given using two normalizations: per g VS added and per g of total substrate added. Superscript letters (a through g) indicate significant differences within each column at p-value < 0.05.
| Substrate | VS Reduction (%) | Influent COD (g/L) | COD Reduction (%) | Cumulative CH4 (mL CH4/g VS) | Cumulative CH4 (mL CH4/g Substrate) |
|---|---|---|---|---|---|
| CW-only | 65.5 ± 0.1 a | 29.6 ± 0.4 ab | 40.6 ± 2.9 a | 620 ± 6.0 abc | 10.7 ± 0.1 a |
| CW + B-Char (HC) | 37.5 ± 0.1 b | 41.9 ± 0.7 c | 23.6 ± 7.5 b | 611 ± 27 bc | 10.6 ± 0.5 a |
| CW + B-Char (LC) | 62.7 ± 0.3 a | 34.9 ± 2.4 d | 48.8 ± 5.3 a | 611 ± 16 a | 10.6 ± 0.3 a |
| CW + ZEO (HC) | 66.0 ± 1.9 a | 33.7 ± 0.8 de | 49.2 ± 1.6 a | 653 ± 4 a | 11.3 ± 0.1 ab |
| CW + ZEO (LC) | 66.2 ± 2.6 a | 32.8 ± 1.0 de | 46.2 ± 1.0 a | 634 ± 6 ab | 11.0 ± 0.1 ab |
| CW + PL + B-Char (HC) | 6.88 ± 1.4 c | 41.6 ± 0.6 c | −31.1 ± 1.2 *c | 471 ± 16 d | 15.9 ± 0.5 dce |
| CW + PL + ZEO (HC) | 61.4 ± 0.6 a | 31.6 ± 2.1 ae | 44.0 ± 3.4 a | 518 ± 8 e | 17.4 ± 0.3 dce |
| CW + DM + ZEO (HC) | 57.3 ± 0.2 a | 25.8 ± 0.3 f | 21.9 ± 6.1 b | 473 ± 5 d | 14.2 ± 0.2 dbe |
| CW:PL (1:1) | 63.5 ± 0.6 a | 28.8 ± 2.0 b | 42.7 ± 3.2 a | 531 ± 10 e | 17.9 ± 0.3 c |
| CW:PL (2:1) | 64.8 ± 0.5 a | 28.9 ± 0.3 b | 39.6 ± 4.9 a | 590 ± 6 c | 15.1 ± 0.2 dce |
| CW:DM (1:1) | 59.9 ± 1.0 a | 29.5 ± 0.9 ab | 37.4 ± 0.5 a | 461 ± 17 d | 13.8 ± 0.5 abe |
| CW:DM (2:1) | 63.4 ± 0.3 a | 32.5 ± 1.9 e | 47.8 ± 2.7 a | 522 ± 14 e | 12.6 ± 0.3 abe |
| DM-only | 48.4 ± 5.3 d | 28.0 ± 0.7 bf | 20.9 ± 2.9 b | 100 ± 5 f | 22.9 ± 1.1 f |
| PL-only | 63.0 ± 8.4 a | 28.2 ± 1.3 b | 20.7 ± 0.1 b | 156 ± 3 g | 193 ± 4 g |
* a negative value indicates a percent increase due to addition of biochar not included in pre-COD.
Table 4.
Cumulative methane (CH4) during the 48-day digestion period for designated time periods, with the percent of the total cumulative CH4 production in parenthesis. Superscript letters (a through g) significant differences within each column at p-value < 0.05.
Table 4.
Cumulative methane (CH4) during the 48-day digestion period for designated time periods, with the percent of the total cumulative CH4 production in parenthesis. Superscript letters (a through g) significant differences within each column at p-value < 0.05.
| Treatment | Cumulative CH4 in mL CH4/g VS and (% of Total CH4 Production) | ||||
|---|---|---|---|---|---|
| 9 Days | 15 Days | 20 Days | 37 Days | 48 Days | |
| CW-only | 26.8 (4.3%) abc | 118 (19%) a | 364 (58.7%) ab | 598 (96.4%) abc | 620 (100%) abc |
| CW + B-Char (HC) | 39.9 (6.5%) adef | 265 (43.4%) b | 403 (66%) bc | 589 (96.4%) bc | 611 (100%) bc |
| CW + B-Char (LC) | 37.8 (6.2%) acdef | 133 (21.7%) a | 363 (59.4%) a | 591 (96.8%) bc | 611 (100%) bc |
| CW + ZEO (HC) | 39.3 (6%) acdef | 314 (48.1%) c | 425 (65.2%) c | 634 (97.1%) a | 653 (100%) a |
| CW + ZEO (LC) | 31.5 (5%) ace | 189 (29.8%) d | 370 (58.4%) ab | 614 (96.8%) ab | 634 (100%) ab |
| CW + PL + B-Char (HC) | 273 (57.9%) g | 400 (84.8%) e | 419 (88.9%) c | 459 (97.4%) de | 471 (100%) d |
| CW + PL + ZEO (HC) | 43.2 (8.3%) def | 255 (49.2%) b | 370 (71.4%) ab | 497 (95.9%) f | 518 (100%) e |
| CW + DM + ZEO (HC) | 17 (3.6%) b | 197 (41.7%) d | 323 (68.5%) d | 447 (94.7%) de | 473 (100%) d |
| CW:PL (1:1) | 49.8 (9.4%) c | 274 (51.6%) bc | 419 (78.8%) c | 513 (96.5%) f | 531 (100%) e |
| CW:PL (2:1) | 32.6 (5.5%) acde | 263 (44.7%) b | 366 (62%) ba | 571 (96.8%) c | 590 (100%) c |
| CW:DM (1:1) | 46.5 (10.1%) df | 265 (57.6%) b | 353 (76.6%) da | 439 (95.3%) d | 461 (100%) d |
| CW:DM (2:1) | 25.4 (4.9%) bc | 211 (40.5%) d | 336 (64.3%) da | 484 (92.8%) ef | 522 (100%) e |
| DM-only | 34.8 (34.6%) acde | 48.4 (48.2%) f | 62.6 (62.3%) e | 89.1 (88.8%) g | 100 (100%) f |
| PL-only | 92.3 (59%) h | 114 (72.9%) a | 128 (82%) f | 148 (95%) h | 156 (100%) g |
© 2020 by the authors. Licensee MDPI, Basel, Switzerland. This article is an open access article distributed under the terms and conditions of the Creative Commons Attribution (CC BY) license (http://creativecommons.org/licenses/by/4.0/).
Share and Cite
MDPI and ACS Style
Achi, C.G.; Hassanein, A.; Lansing, S. Enhanced Biogas Production of Cassava Wastewater Using Zeolite and Biochar Additives and Manure Co-Digestion. Energies 2020, 13, 491. https://0-doi-org.brum.beds.ac.uk/10.3390/en13020491
AMA Style
Achi CG, Hassanein A, Lansing S. Enhanced Biogas Production of Cassava Wastewater Using Zeolite and Biochar Additives and Manure Co-Digestion. Energies. 2020; 13(2):491. https://0-doi-org.brum.beds.ac.uk/10.3390/en13020491
Chicago/Turabian StyleAchi, Chibueze G., Amro Hassanein, and Stephanie Lansing. 2020. "Enhanced Biogas Production of Cassava Wastewater Using Zeolite and Biochar Additives and Manure Co-Digestion" Energies 13, no. 2: 491. https://0-doi-org.brum.beds.ac.uk/10.3390/en13020491
Note that from the first issue of 2016, this journal uses article numbers instead of page numbers. See further details here.