Semi-Analytical Model for Heat and Mass Transfer Evaluation of Vapor Bubbling


Department of Engineering for Innovation, University of Salento, 73100 Lecce, Italy
*
Author to whom correspondence should be addressed.
Energies 2020, 13(5), 1104; https://0-doi-org.brum.beds.ac.uk/10.3390/en13051104
Submission received: 30 January 2020
/
Revised: 21 February 2020
/
Accepted: 25 February 2020
/
Published: 2 March 2020
(This article belongs to the Special Issue Numerical Simulation of Convective-Radiative Heat Transfer)
Abstract
:Multi-stage refrigeration systems cover a wide range of possibilities and are diffusing more and more. The idea that inspired this work derived from the need to have a tool to model the energy behavior of the intercooler inside a multi-stage refrigeration system. In this work, a semi-analytical model of a single bubble, injected into the liquid of an intercooler of a multi-stage system, has been developed. The developed model is a set of equations derived from the Fourier equation for heat conduction in defined conditions and includes the effects of sensible and latent heat. The vapor bubble is supposed to be injected in the saturated liquid contained in a tank at a defined depth, at an intermediate pressure. The model has been implemented in Matlab and the results show the influence of the liquid surface tension, the injection depth and the thermal diffusivity of the vapor. The model developed here is a useful low-cost tool for evaluating heat transfer optimization of a separator/intercooler of a multi-stage refrigeration system.
1. Introduction
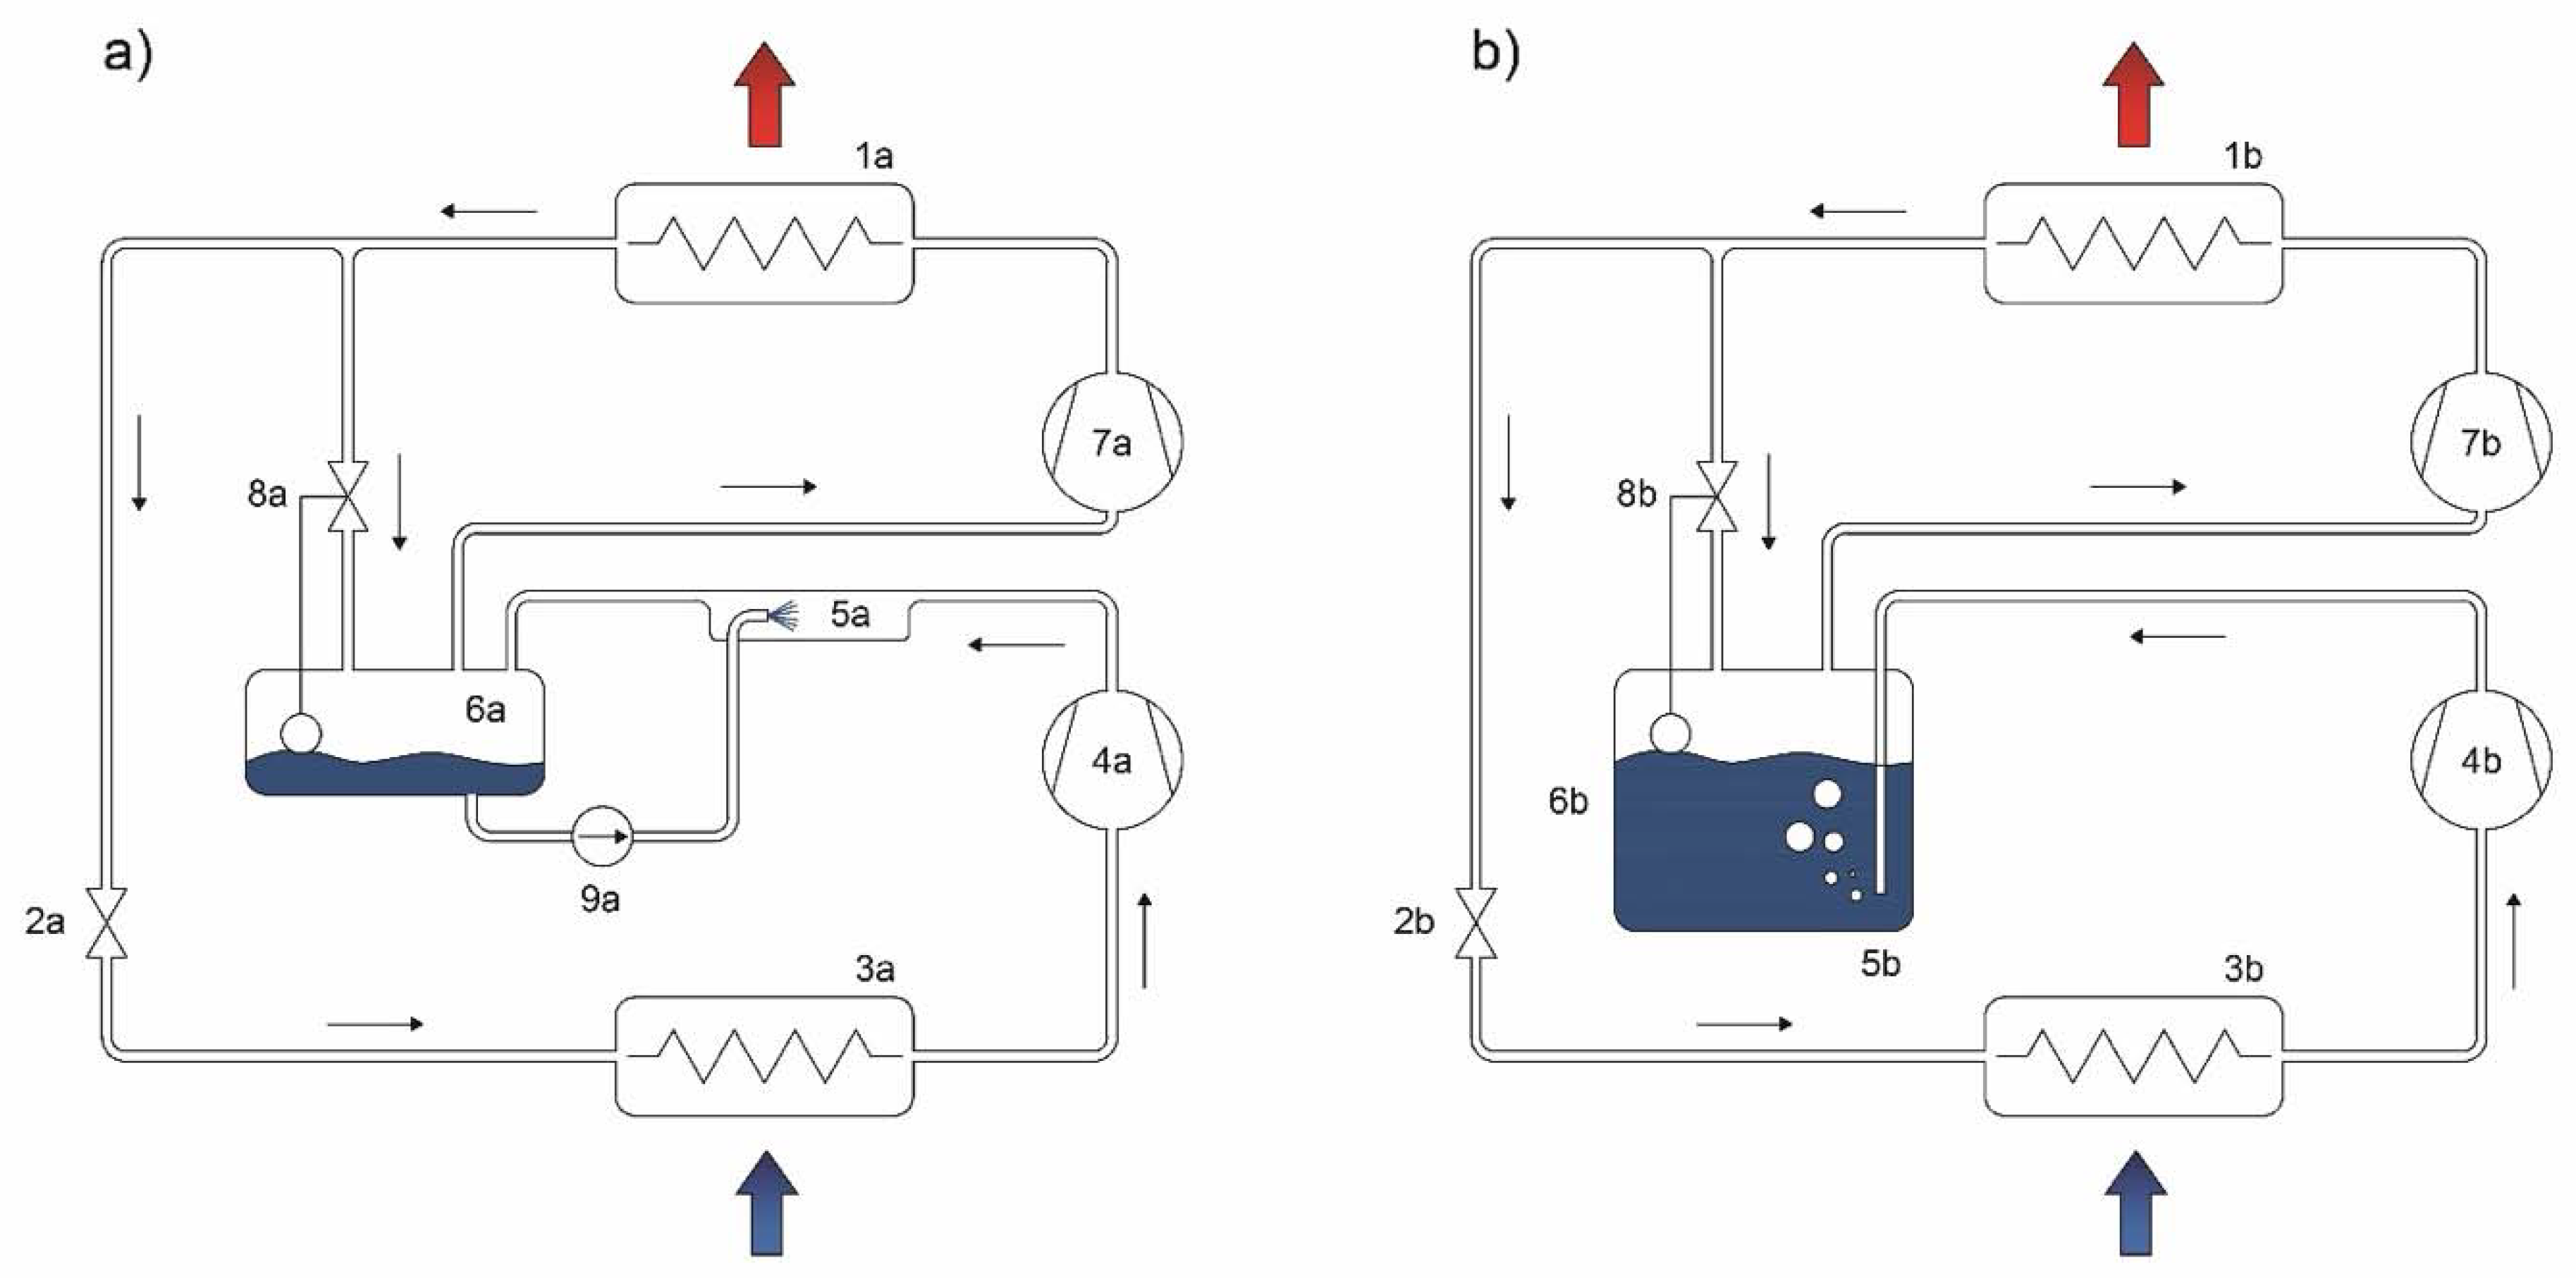
The growing demand for energy for industrial applications and the need to protect the environment for future generations requires effort to make the production processes more efficient, from the early design stages, through to the adoption of innovative techniques and systems both with low environmental impact and economic sustainability. In industrial refrigeration applications, the reduction of energy requirements is made, at a thermodynamic cycle level, through multi-stage intercooled compression techniques, which limit the increase of refrigerant temperature during the compression phase, approximating an almost isothermal process (ideally with a succession of small intercooled compressions). In a two-stage scheme, the low-temperature heat sink is obtained internally at an intermediate pressure and is formed by the expansion of saturated refrigerant after exiting the condenser [1]. In each desuperheating stage, the temperature of the vapor tends to near the saturation value, through a heat transfer process, carried out either by injecting liquid into the discharge line of the low-pressure compressor or by bubbling the vapor into the liquid, as shown in Figure 1.
In the first scheme (Figure 1a) the desuperheating process is due to the liquid vaporization injected by the pump, supplied by the receiver. The second scheme exploits the bubbling of the superheated vapor in a low-temperature saturated liquid bath, through an open tube, at a certain depth. Here, the intense convective action, induced by the bubbling, makes the heat transfer effective, allowing the vapor to reach the saturation condition. This solution makes it possible to avoid an injection pump, with a considerable system simplification and reduction of maintenance costs. Due to its characteristics, the bubbling technique is particularly attractive, as it combines economic and energy benefits in a simple technical solution.
The main design parameter is the injection depth, it must guarantee the minimum residence time of the vapor, to allow complete desuperheating with the minimum backpressure at the exit of the low-pressure stage. The optimization of the device requires the formulation of a thermal model that considers the complexity of the convective and two-phase heat transfer phenomena occurring.
The evolution of a vapor bubble within liquid has been the topic of several studies, limited to the class of pool-type processes.
The Rayleigh model, reported by Farajisarir [2], proposes a mechanism for developing a vapor bubble that expands in a superheated, infinitely extended, inviscid and incompressible liquid bath, starting from an initial radius, neglecting the effects of surface tension and considers the growth phenomenon due to differences in pressure across the liquid-vapor interface (inertial model).
Van Stralen [3] described the Bosnjakovic model that analyzes the phenomenon by considering the thermal and mass exchanges with the liquid on the liquid—vapor frontier (thermal model) as significant for the development of the bubble and this model has been of interest for this work.
One more model is that proposed by Plesset et al. [4] that considers both the inertial and the thermal mechanisms. Solutions to the Plesset model, valid for the transient of the bubble collapse starting from the assigned initial dimension, are provided by Akiyama [5] in the hypothesis of inertial collapse and by Florschuetz and Chao, reported in [6] and [7], for the case of thermal collapse.
The experimental campaign on this topic is hard to carry out as shown by Bohdal [8], who investigated heat transfer and pressure drop during bubbly boiling in a refrigeration fluid, elaborating an analytical one-D model of heat transfer and pressure drop using experimental data, assuring accuracy up to ±20%.
Sujatha et al. [9], instead, carried out an experimental campaign on a bubble absorber to obtain heat and mass transfer and pressure drop data, then compared the results with the numerical correlation relating Sherwood number, Reynolds number, Schmidt number and length to diameter ratio developed by the same authors. Their work is a useful tool to compare experimental data to numerical correlations.
Recently, Wu et al. [10] experimentally investigated the effects of vibration amplitude and frequency on the bubble absorption characteristics of R134a-DMAC in a vertical tube. Their work was strictly linked to the application of refrigeration systems.
Merrill et al. [11] analytically studied the bubble behavior, from inception to collapse, in a subcooled binary liquid solution using a finite difference method to solve the governing equations, describing bubble diameter and mass over time.
Surtaev et al. [12] experimentally investigated the influence of sub-atmospheric pressure on multiscale heat transfer during liquid pool boiling. Experiments were carried out in the pressure range of 8.8–103 kPa at saturated water boiling, obtaining simultaneously, an extensive data set of the effect of reduced pressure on the main characteristics of boiling, including heat transfer coefficients, nucleation site density, growth rate and departure diameter of vapor bubbles. They demonstrated that the growth rate of dry spots is constant in time and has a non-monotonic dependence on pressure.
Mimouni et al. [13] developed a model and a numerical simulation of upward bubbly flow (in the same motion conditions of the present work), evaluating interfacial momentum transfer, polydispersion and turbulence.
Yan et al. [14] investigated the effect of liquid properties on fluid dynamic parameters in bubble columns. In particular, they used the correction of surface tension and viscosity to highlight the influence of different liquid properties on the hydrodynamic parameters of bubble columns. Computational fluid dynamics coupled with the population balance model were used to simulate the effects of liquid viscosity and liquid surface tension on the hydrodynamic parameters of the bubble column.
Lobanov et al. [15] studied the flow patterns and heat transfer of downstream bubbly flow in a sudden pipe expansion. They used the Eulerian approach for the numerical model. The set of RANS equations was used for modeling two-phase bubbly flows. The turbulence of the liquid phase was predicted using the Reynolds stress model.
Saha and Sandilya [16] developed a simplified model for quick evaluation of the storage performance of an injection cooling system for liquid subcooling, without involving the complex transport phenomena-based conservation equations. Simulations were carried out and the model was validated, considering the storage of liquid oxygen, and obtained a satisfactory match between the experimental data and the model predictions. The present paper is a step forward, considering the limitations of the cited work.
Xu et al. [17] proposed a bubble diameter model for the boiling flows. The model considered heat transfer growth, the breakup or coalescence of collision and the liquid impacting separation as factors affecting bubble diameter. They developed three bubble diameter sub-models to calculate overall bubble diameter, based on a departure diameter.
Kumar et al. [18] carried out an experimental and theoretical campaign, obtaining measurements of the local void fraction, rise velocity and bubble diameter for cocurrent, wall-heated, upward bubbly flows in a refrigerant. Bubble size was correlated in terms of liquid subcooling and bulk bubble size in terms of void fraction. The results were used to develop bubbly flow models, applicable to heated two-phase flows at high-pressure.
Zarate et al. [19] studied the modeling and numerical simulation of the turbulent subcooled boiling flow of a refrigerant, through the two-fluid model conservation equations. The turbulent viscosity was considered to be comprised of shear-induced and bubble-induced components. The results were compared with experimental measurements.
However, none of the models of the cited papers can be applied directly to the bubbling analysis since the vapor is injected in superheated conditions and is, therefore, far from saturation. A new model is needed that takes into account these new conditions, as well as the vertical motions not to be neglected as they modify the saturation conditions while convection occurs.
In this paper, a heat transfer model, based on the Fourier law, that includes the effects of sensible and latent heat contributions, the effects of the liquid surface tension and the vertical motions on the convection and on the saturation conditions of the vapor at real operating conditions, is proposed.
The model has been applied to water, in order to have a reliable benchmark, due to the well-known thermophysical properties of this commonly used heat transfer fluid. On the other hand, the model could be used to simulate all heat transfer fluids and in particular refrigerants, which is the application this study has been conceived for. Thus, the model developed here can be seen as a reliable tool for evaluating the heat transfer optimization of a separator/intercooler in a multi-stage refrigeration system. Further, the proposed model has other potential applicability in the study of two-phase heat and mass transfer occurring in many heat exchangers.
2. Mathematical Model and Hypotheses
The proposed mathematical model has been developed for a single vapor bubble. The heat transfer equations have been written for discrete time intervals Δτ, taking into account a semi-analytical approach, considering the sensible and latent heat in the operating conditions of the desuperheater.
The hypotheses that have been made for the formulation of the model are the following:
- Single spherical shape bubble of radius r_b, variable in time and space, starting from an assigned generation value r_b0;
- Liquid phase at uniform temperature T_l, equal to the saturation value at the intermediate pressure;
- Pressure in the liquid linearly variable with the depth (Stevino’s law);
- Non-negligible liquid surface tension effects (Laplace equation);
- Bubble in vertical motion under gravity force and hydrodynamic resistance;
- Flow regime with independent bubbles;
- Pure thermal conduction in vapor domain (Ra < 1000).
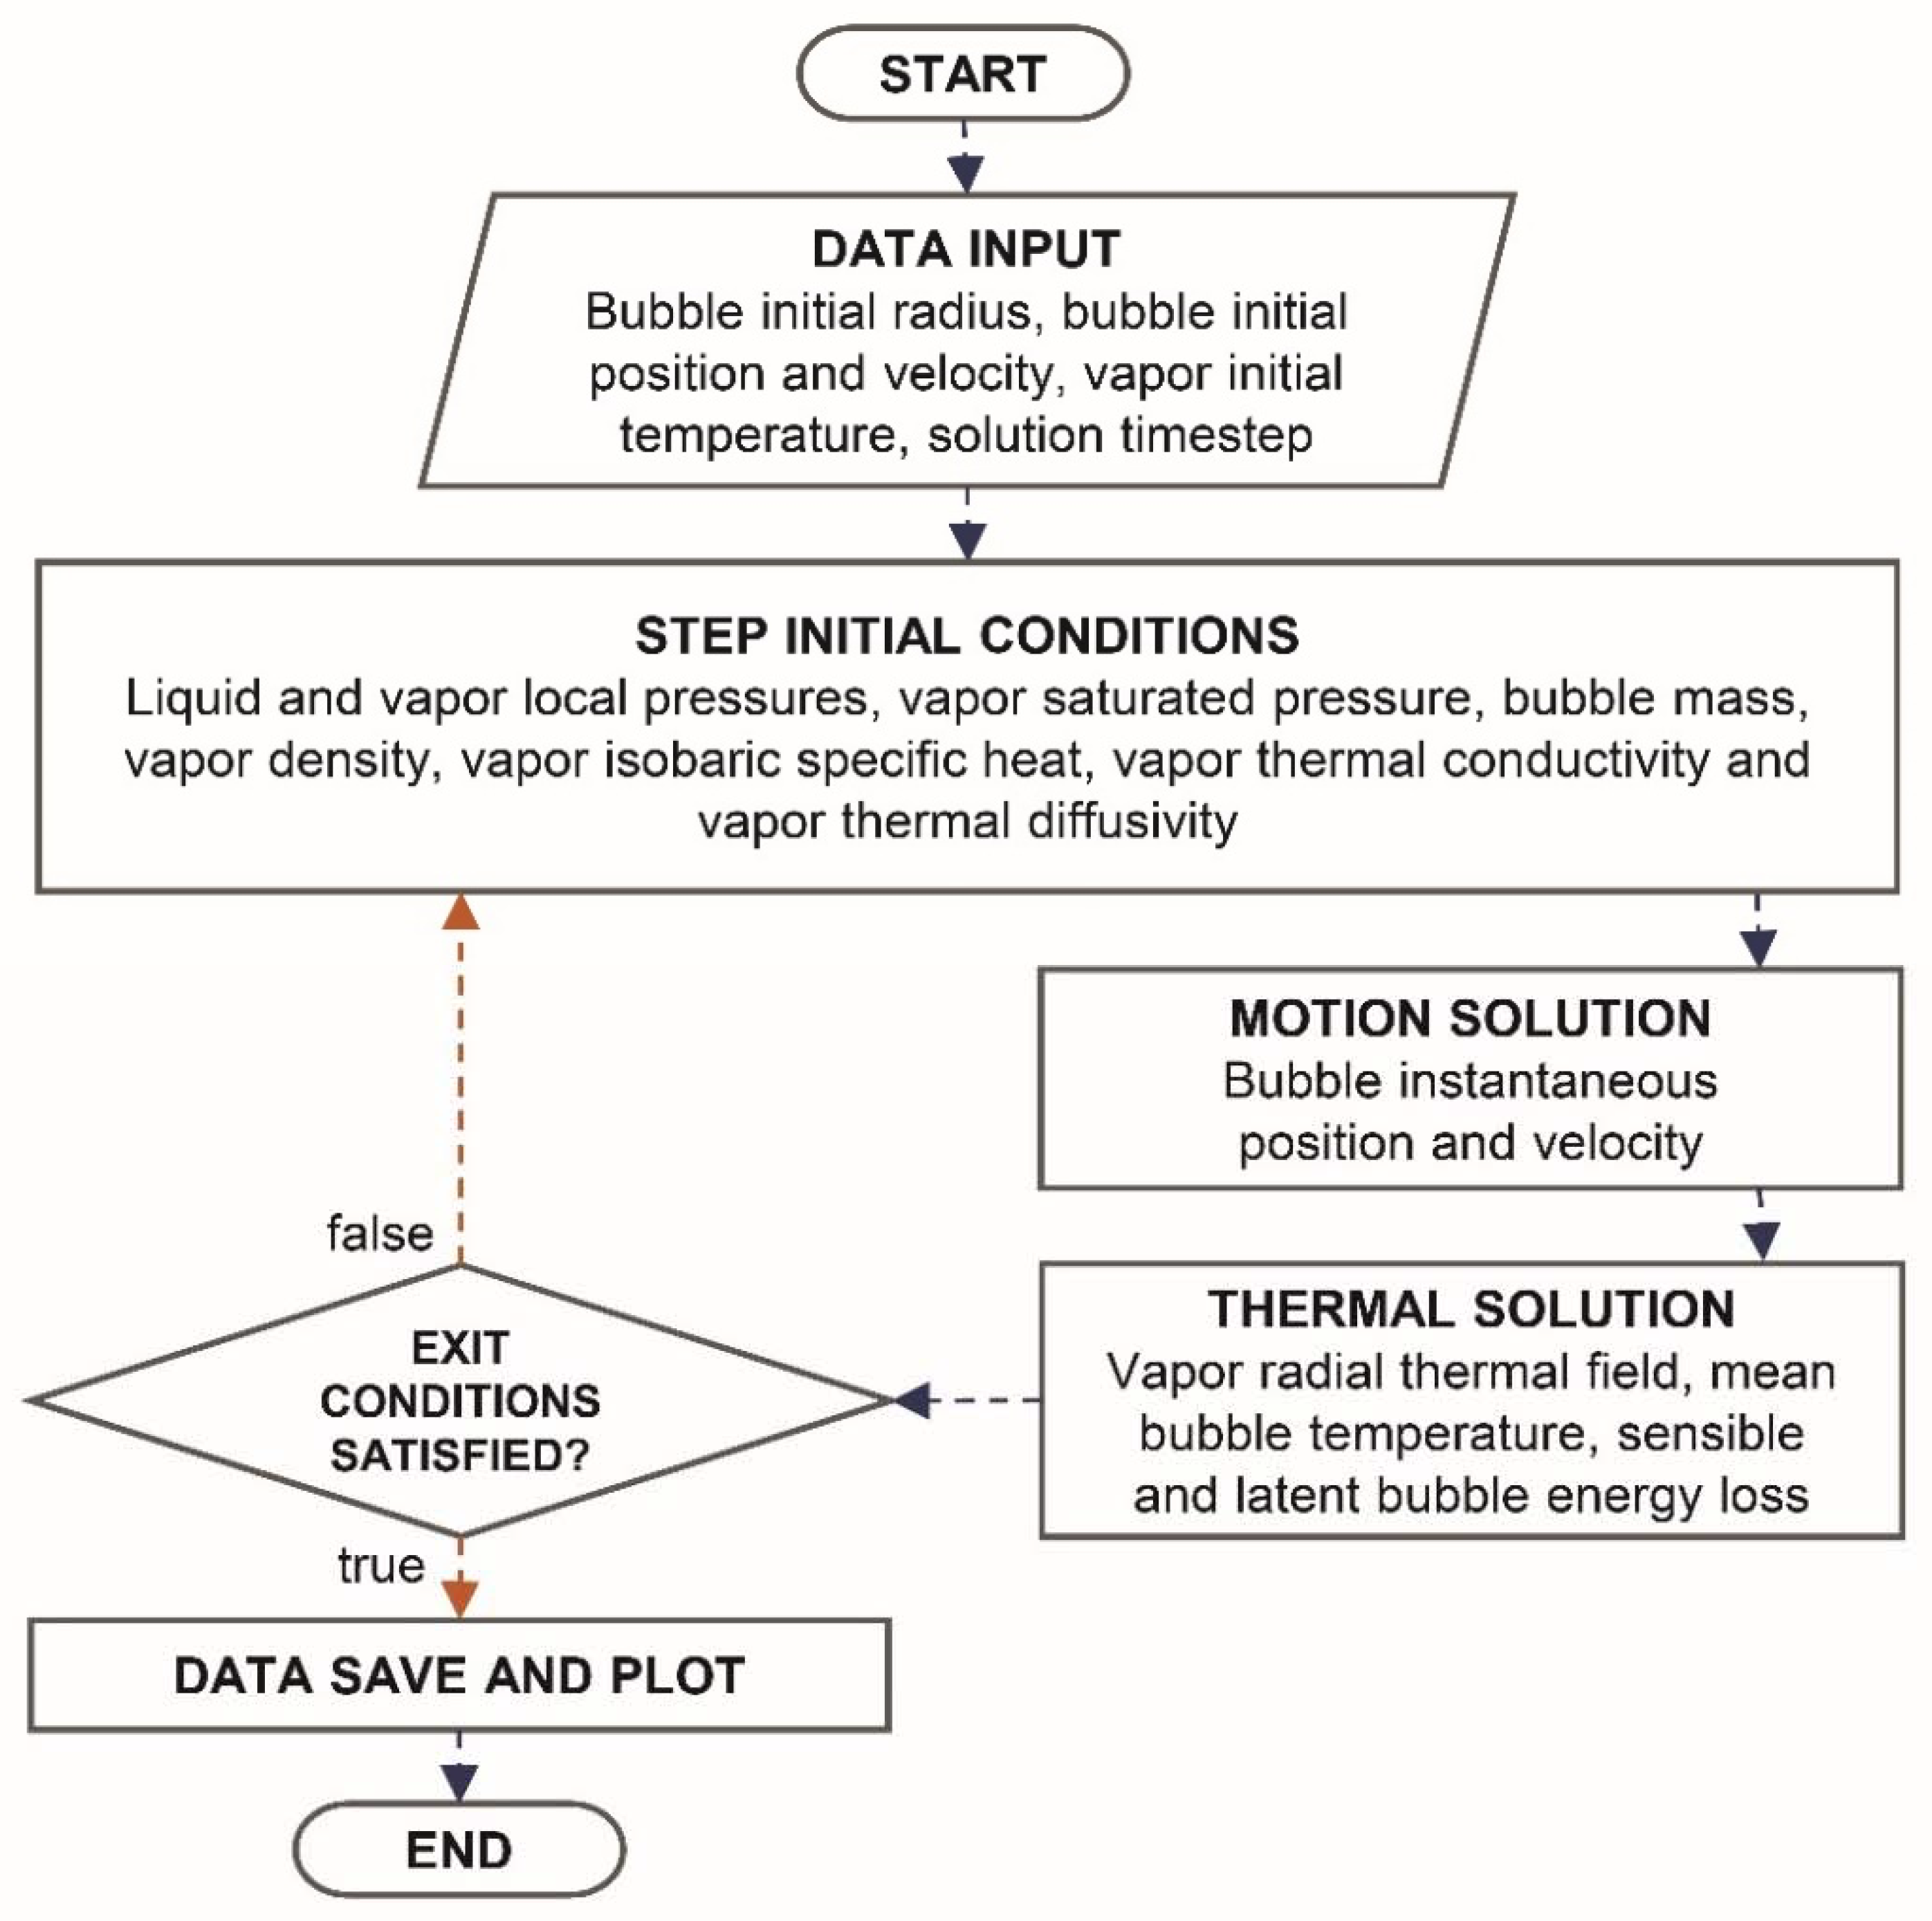
Mechanical and thermal models of the bubble inside the liquid are segregated. Their mutual interaction is set up according to the scheme proposed in Figure 2.
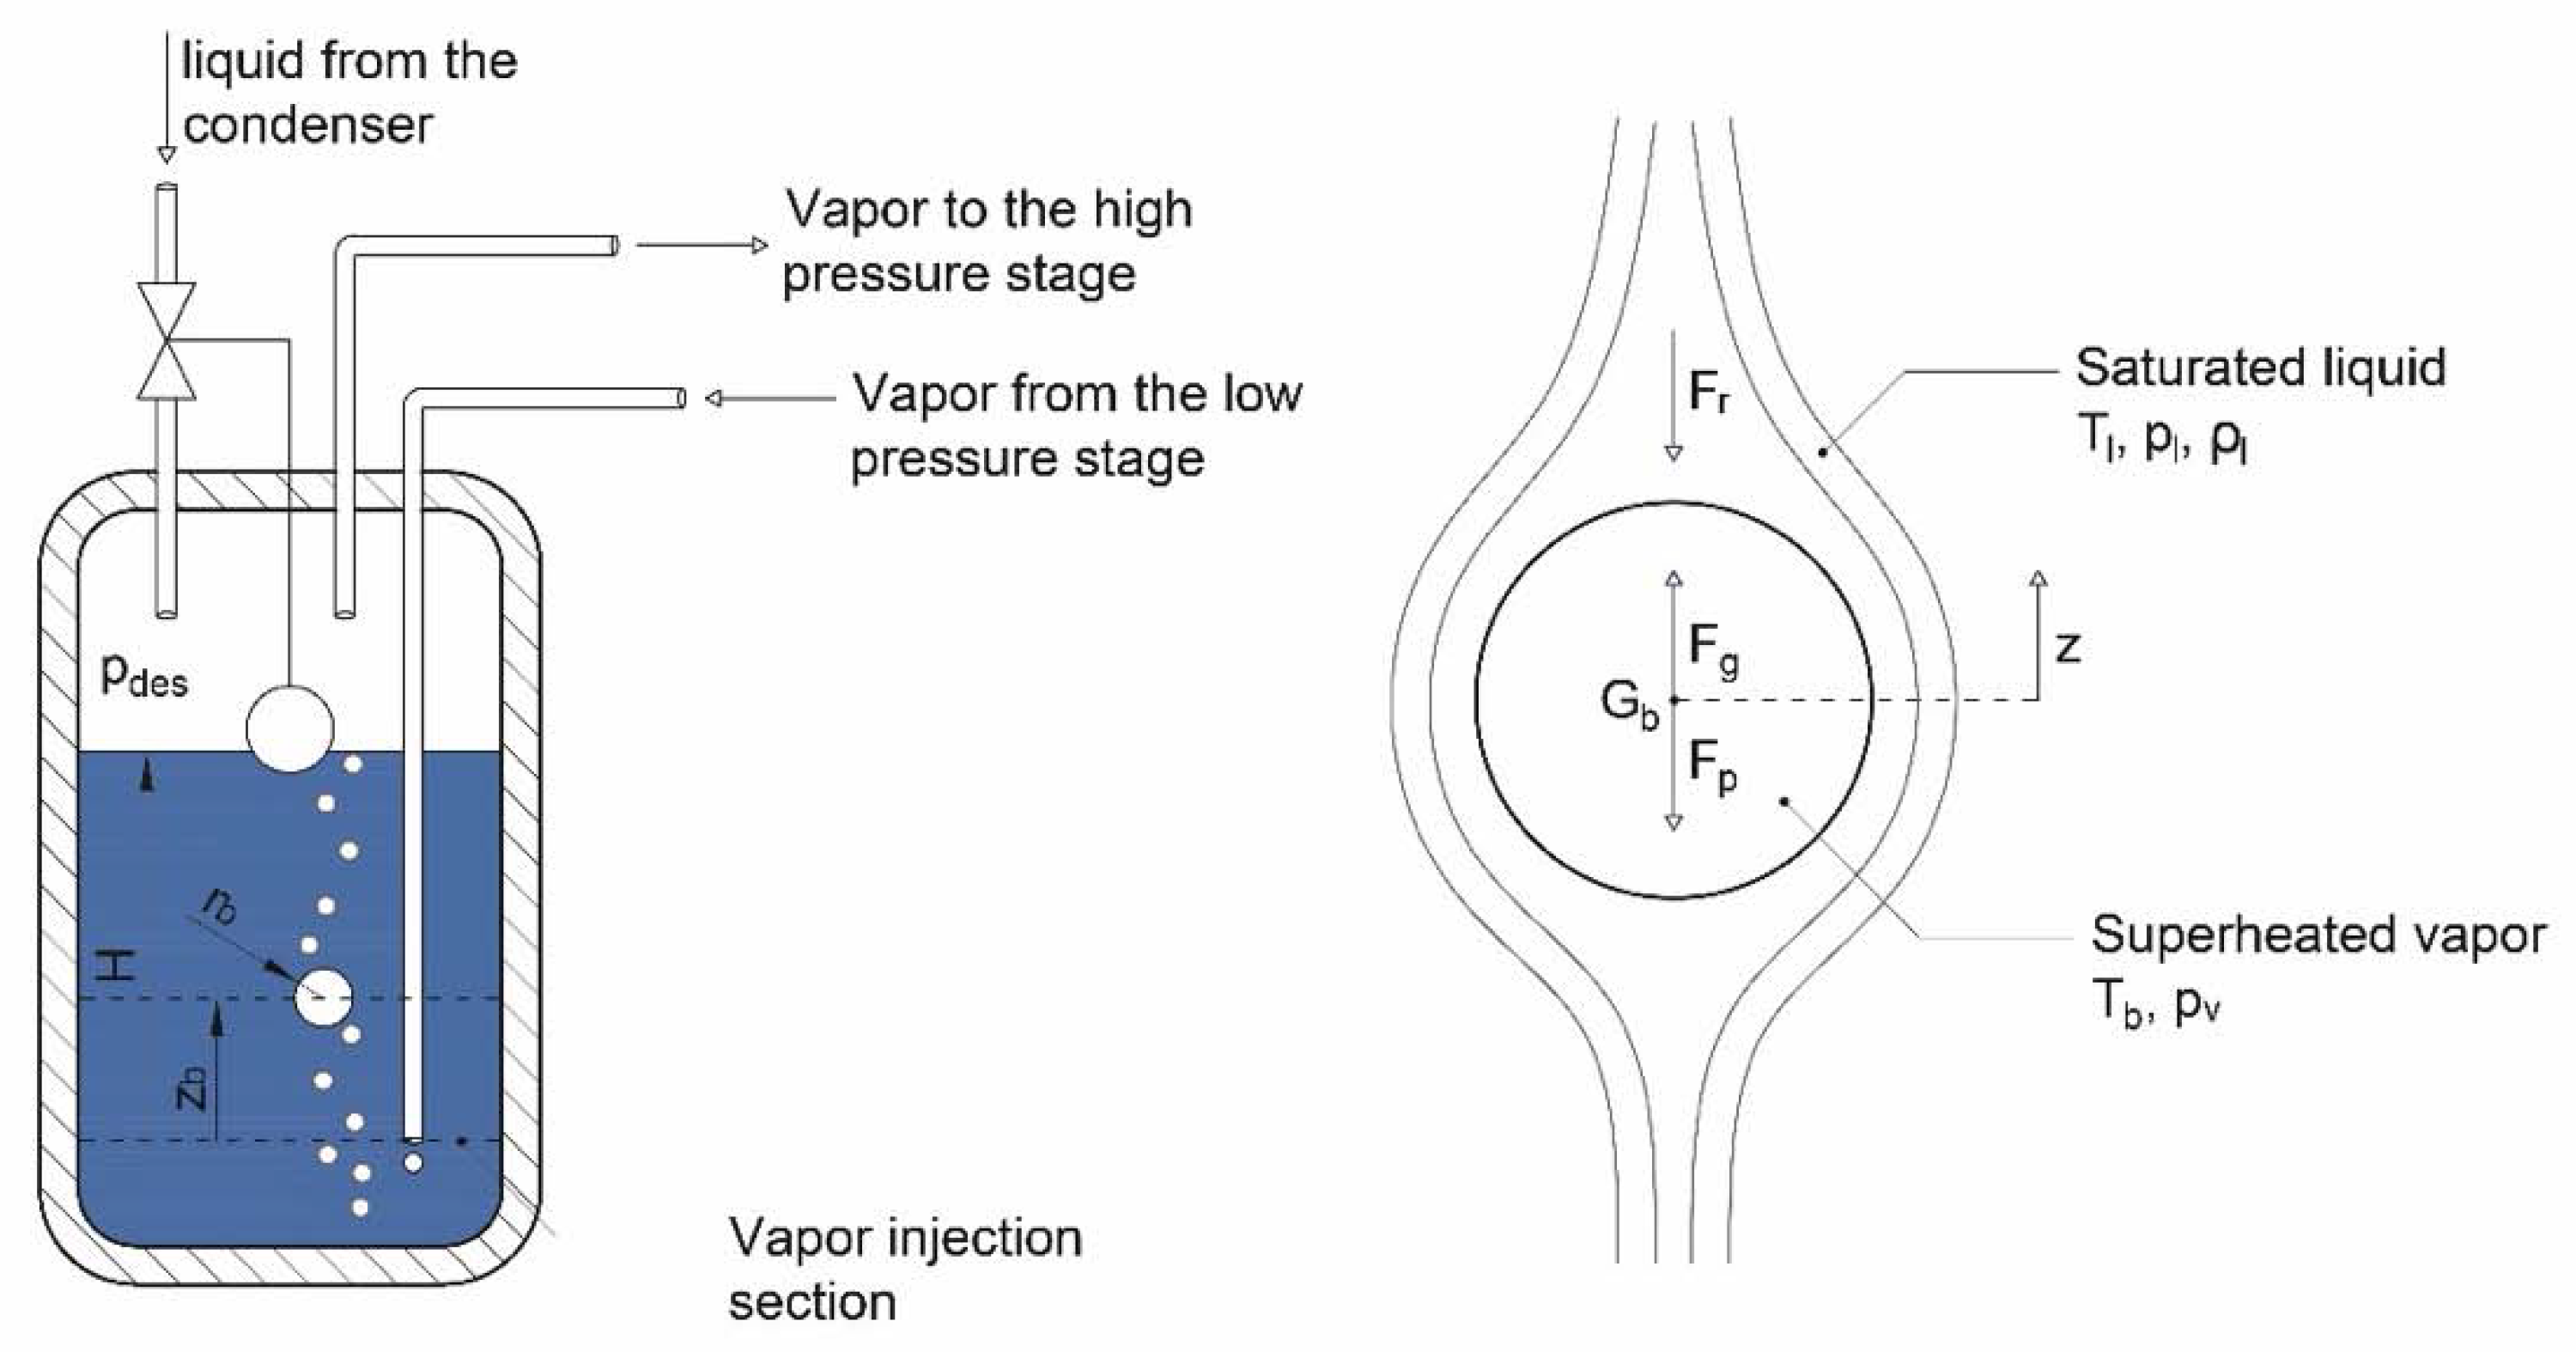
Bearing in mind the scheme reported in Figure 3, the modeling of the motion of the analyzed bubble was described by considering only the vertical component as significant. With the axis according to the direction of the gravity force and positive sign upwards, as in the scheme of Figure 3, the fundamental equation of motion has been expressed by Equation (1).
where Fg is the buoyancy force, Fp is the gravity force and Fr is the drag force.
Substituting each force with the relative analytical expression, Equation (2) is obtained:
Equation (3) is obtained simplifying and rearranging the terms of Equation (2):
Equation (3) is an ordinary non-linear differential equation with non-constant coefficients, as the thermodynamic properties of the bubble are generally dependent on time (by temperature and pressure) and the hydrodynamic drag coefficient is function of the bubble velocity. Searching for exact solutions in time intervals, small enough to neglect the temporal variation of the density and of the coefficient of resistance Equation (3), written for the generical time interval j, becomes:
Recognizing in Equation (4) a Riccati equation, the solutions are:
For the case of an ascending bubble, and:
for the case of a descending bubble, with:
The heat transfer was modeled through a series of isobaric heat transfer equations of duration , valid for bubbles considered to be of constant radius in that time interval. Considering a uniform thermal field around the bubble and a constant Nusselt number at the liquid-vapor interface, a distributed 1-D unsteady heat transfer model has been adopted. The Fourier equation in spherical coordinates in the vapor domain (Equation (8)) has been used [6,7,20,21,22]:
Equation (8) is a non-linear differential equation with second order partial derivatives in space () and first order in time (). The spatial and temporal non-linearities, introduced by the functions , and , dependent on the variable (and thus on and ) at a given pressure, can be relaxed by making a discretization in time and space. Assimilating the spherical domain to a system of concentric shells of thickness , each one characterized by average physical and thermodynamic properties, based on the volume and relevant to the average thermal level in the integration interval considered, Equation (8) can be rewritten as a set of linear differential equations to the partial derivatives:
The boundary conditions and initial conditions (valid with ) guarantee a unique solution. The 2M boundary conditions are related to the characteristics of the phenomenon. Two cases can be distinguished: sensible only, and both sensible and latent heat transfer.
Sensible heat only case:
Sensible and latent heat case (associated with the phase change):
In both cases:
where is the initial temperature field in the k-th shell in the time interval. Equation (10) and Equation (11) describe a non-homogeneous problem at the boundaries. By changing the type of variable, it can be changed to a homogeneous problem (as shown in Equation (13)), where is equal to for the case of sensible-only heat transfer and equal to in the case of a sensible-latent heat transfer one.
Separating the variables, the equations can be expressed by the unknown function , that is a Sturm—Liouville problem with general solutions of Equation (14) [23]:
Equation (14), considering average thermodynamic properties in the domain in the case of sensible-only heat transfer, can be simplified as in Equation (15):
and in the case of a sensible-latent one as in Equation (16):
The mass flow rate , released during the process of vapor condensation, can be estimated by the energy balance on the bubble shell under saturation conditions, under the hypothesis of . In particular, with reference to Figure 4, the following equation can be written:
where the first term in brackets is the portion of energy transferred by conduction from the inner layers of the bubble to the saturating shell, while the second term represents the portion transferred to the liquid by convection.
3. Results and Discussion
The proposed model has been implemented in a Matlab® environment, provided with an interactive graphic interface for the definition of the inputs and the analysis of the outputs. The simulation has been initialized by providing some initial values as: velocity, position, radius and temperature of the bubble, injection depth and the intermediate pressure as shown in Table 1. The simulated system was a two-stage refrigeration system, with water as refrigerant, operating between the evaporation and condensation temperatures (respectively of 273.15 and 318.15 K), varying the injection depth H, the vapor injection temperature and the bubble generation dimension , according to the values in Table 1.
The thermodynamic and transport properties of water were calculated through the correlations of the IAPWS (International Association for the Properties of Water and Steam) [24,25,26,27]. The average convective heat transfer coefficient at the liquid-vapor frontier surface was evaluated by the Whitaker correlation [28], while the interpolation proposed by Morrison [29] was used for the drag coefficient of the flow.
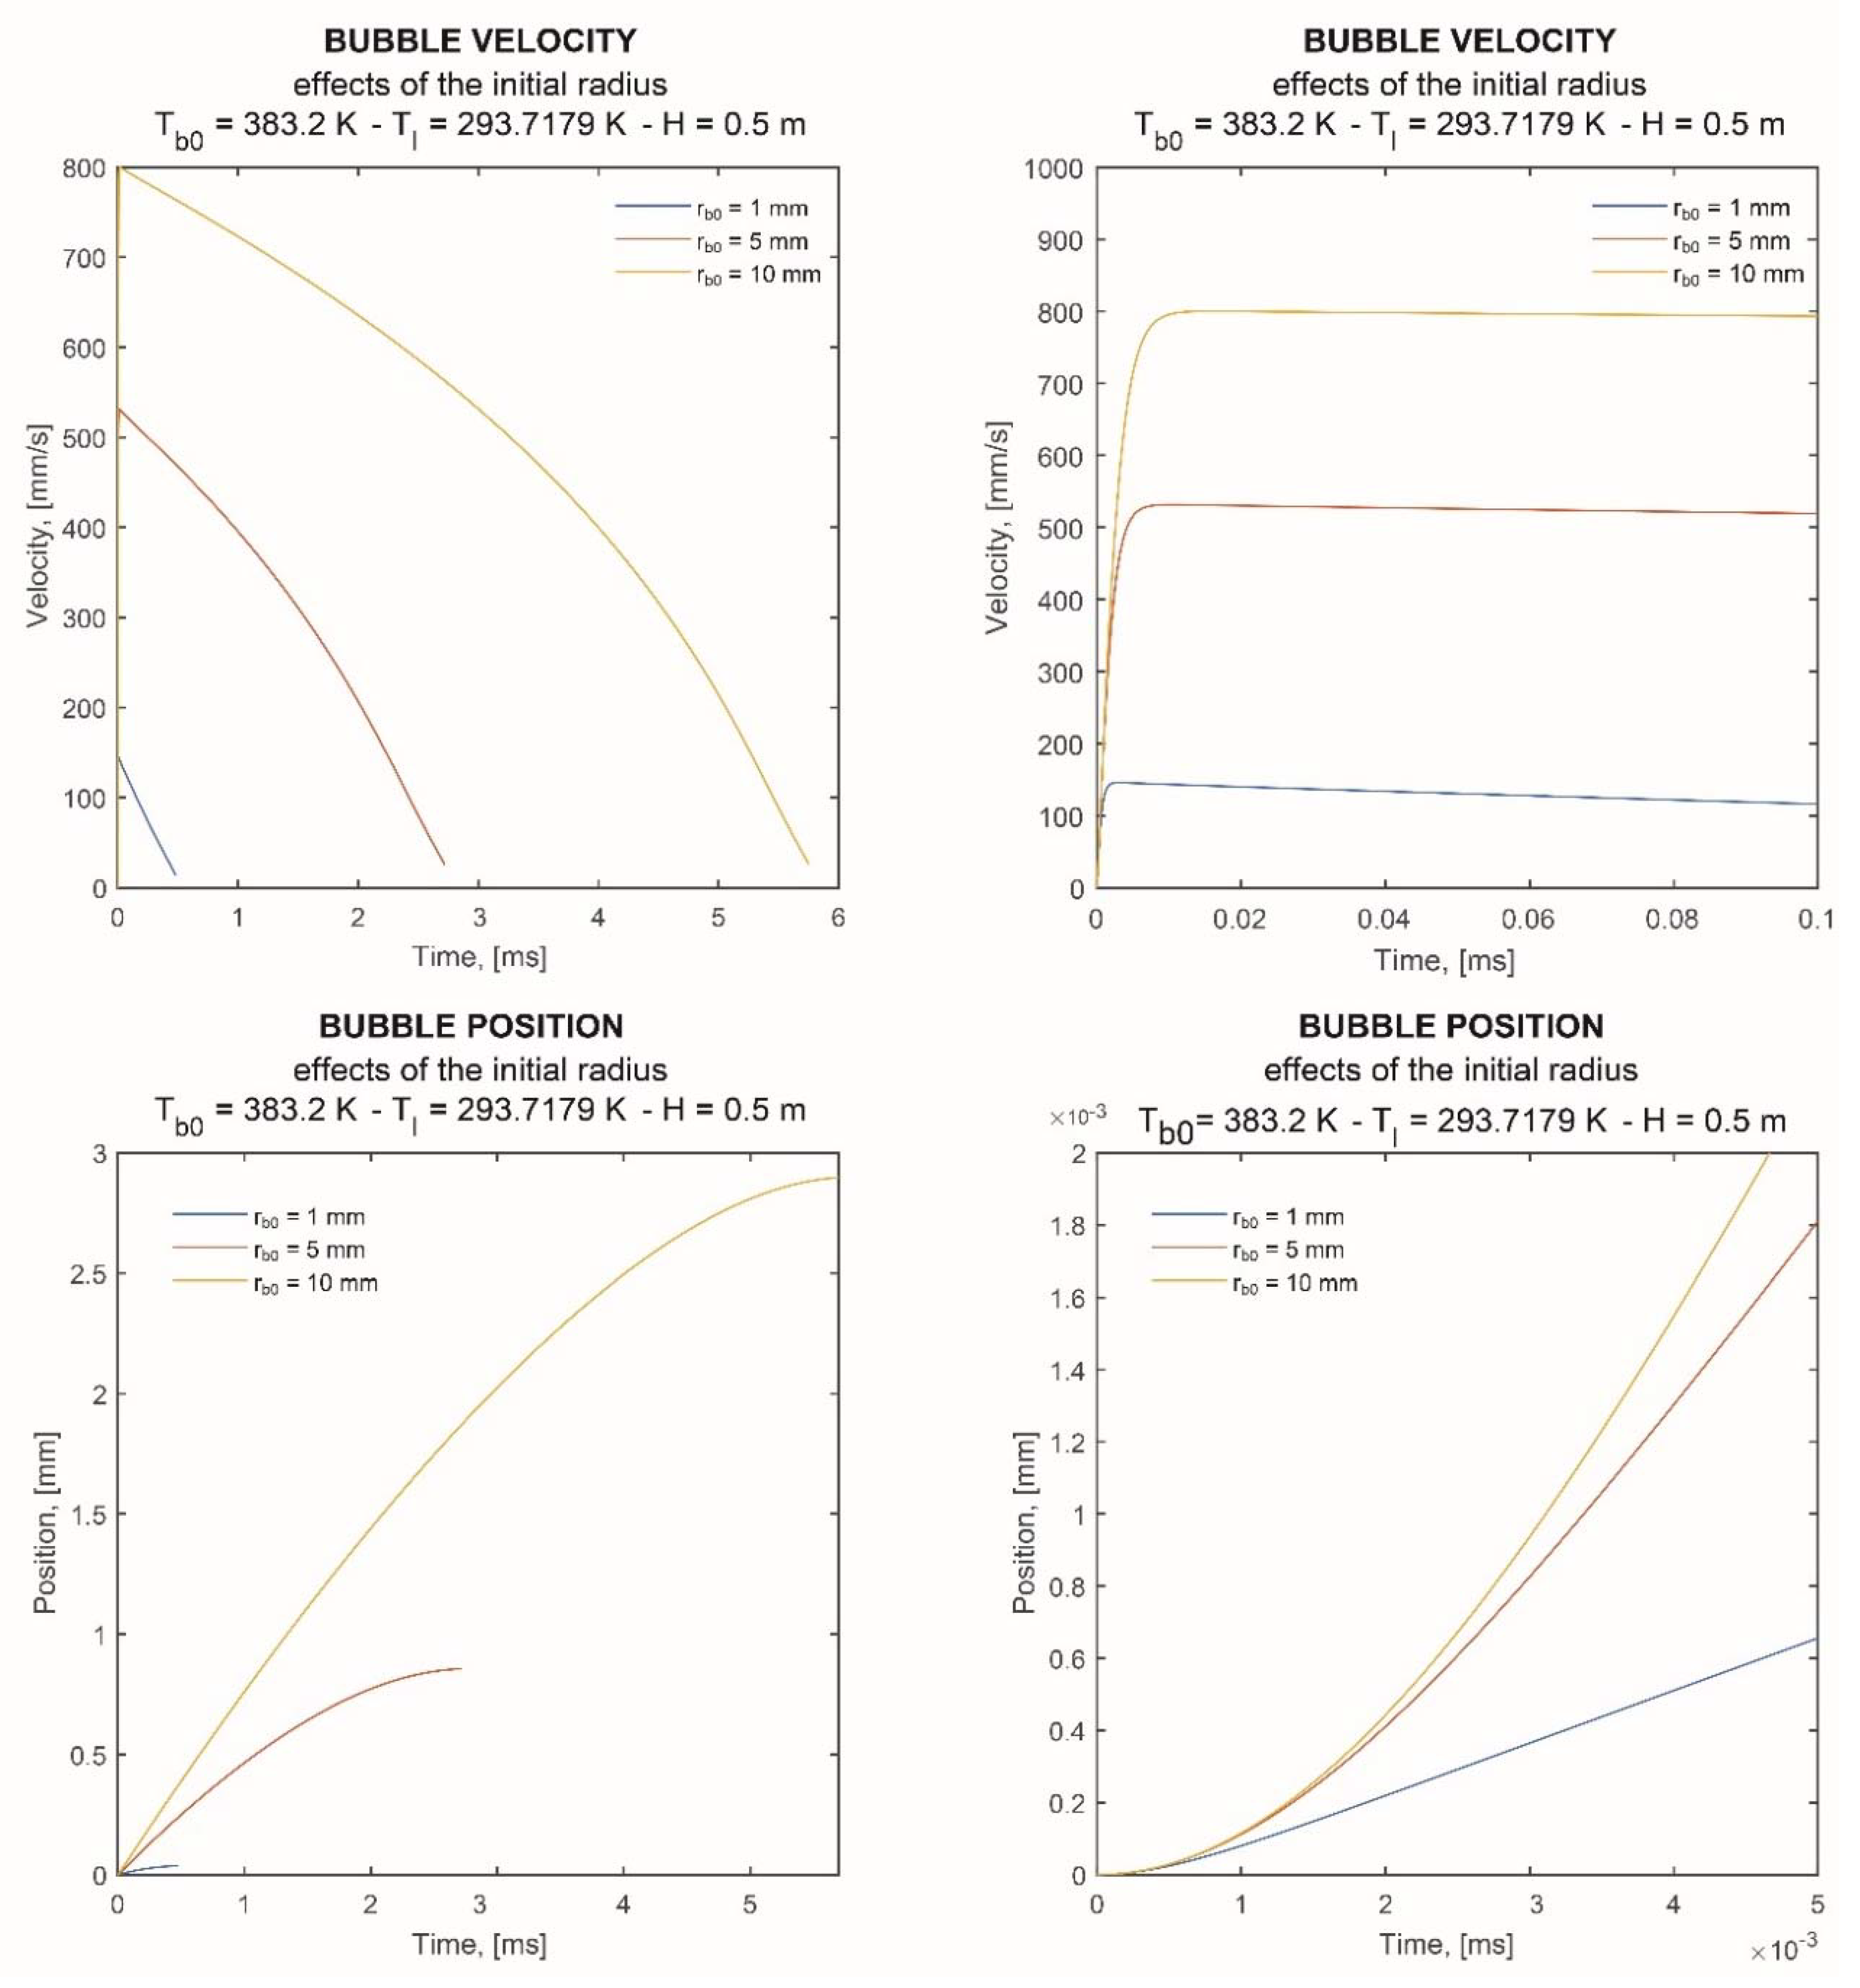
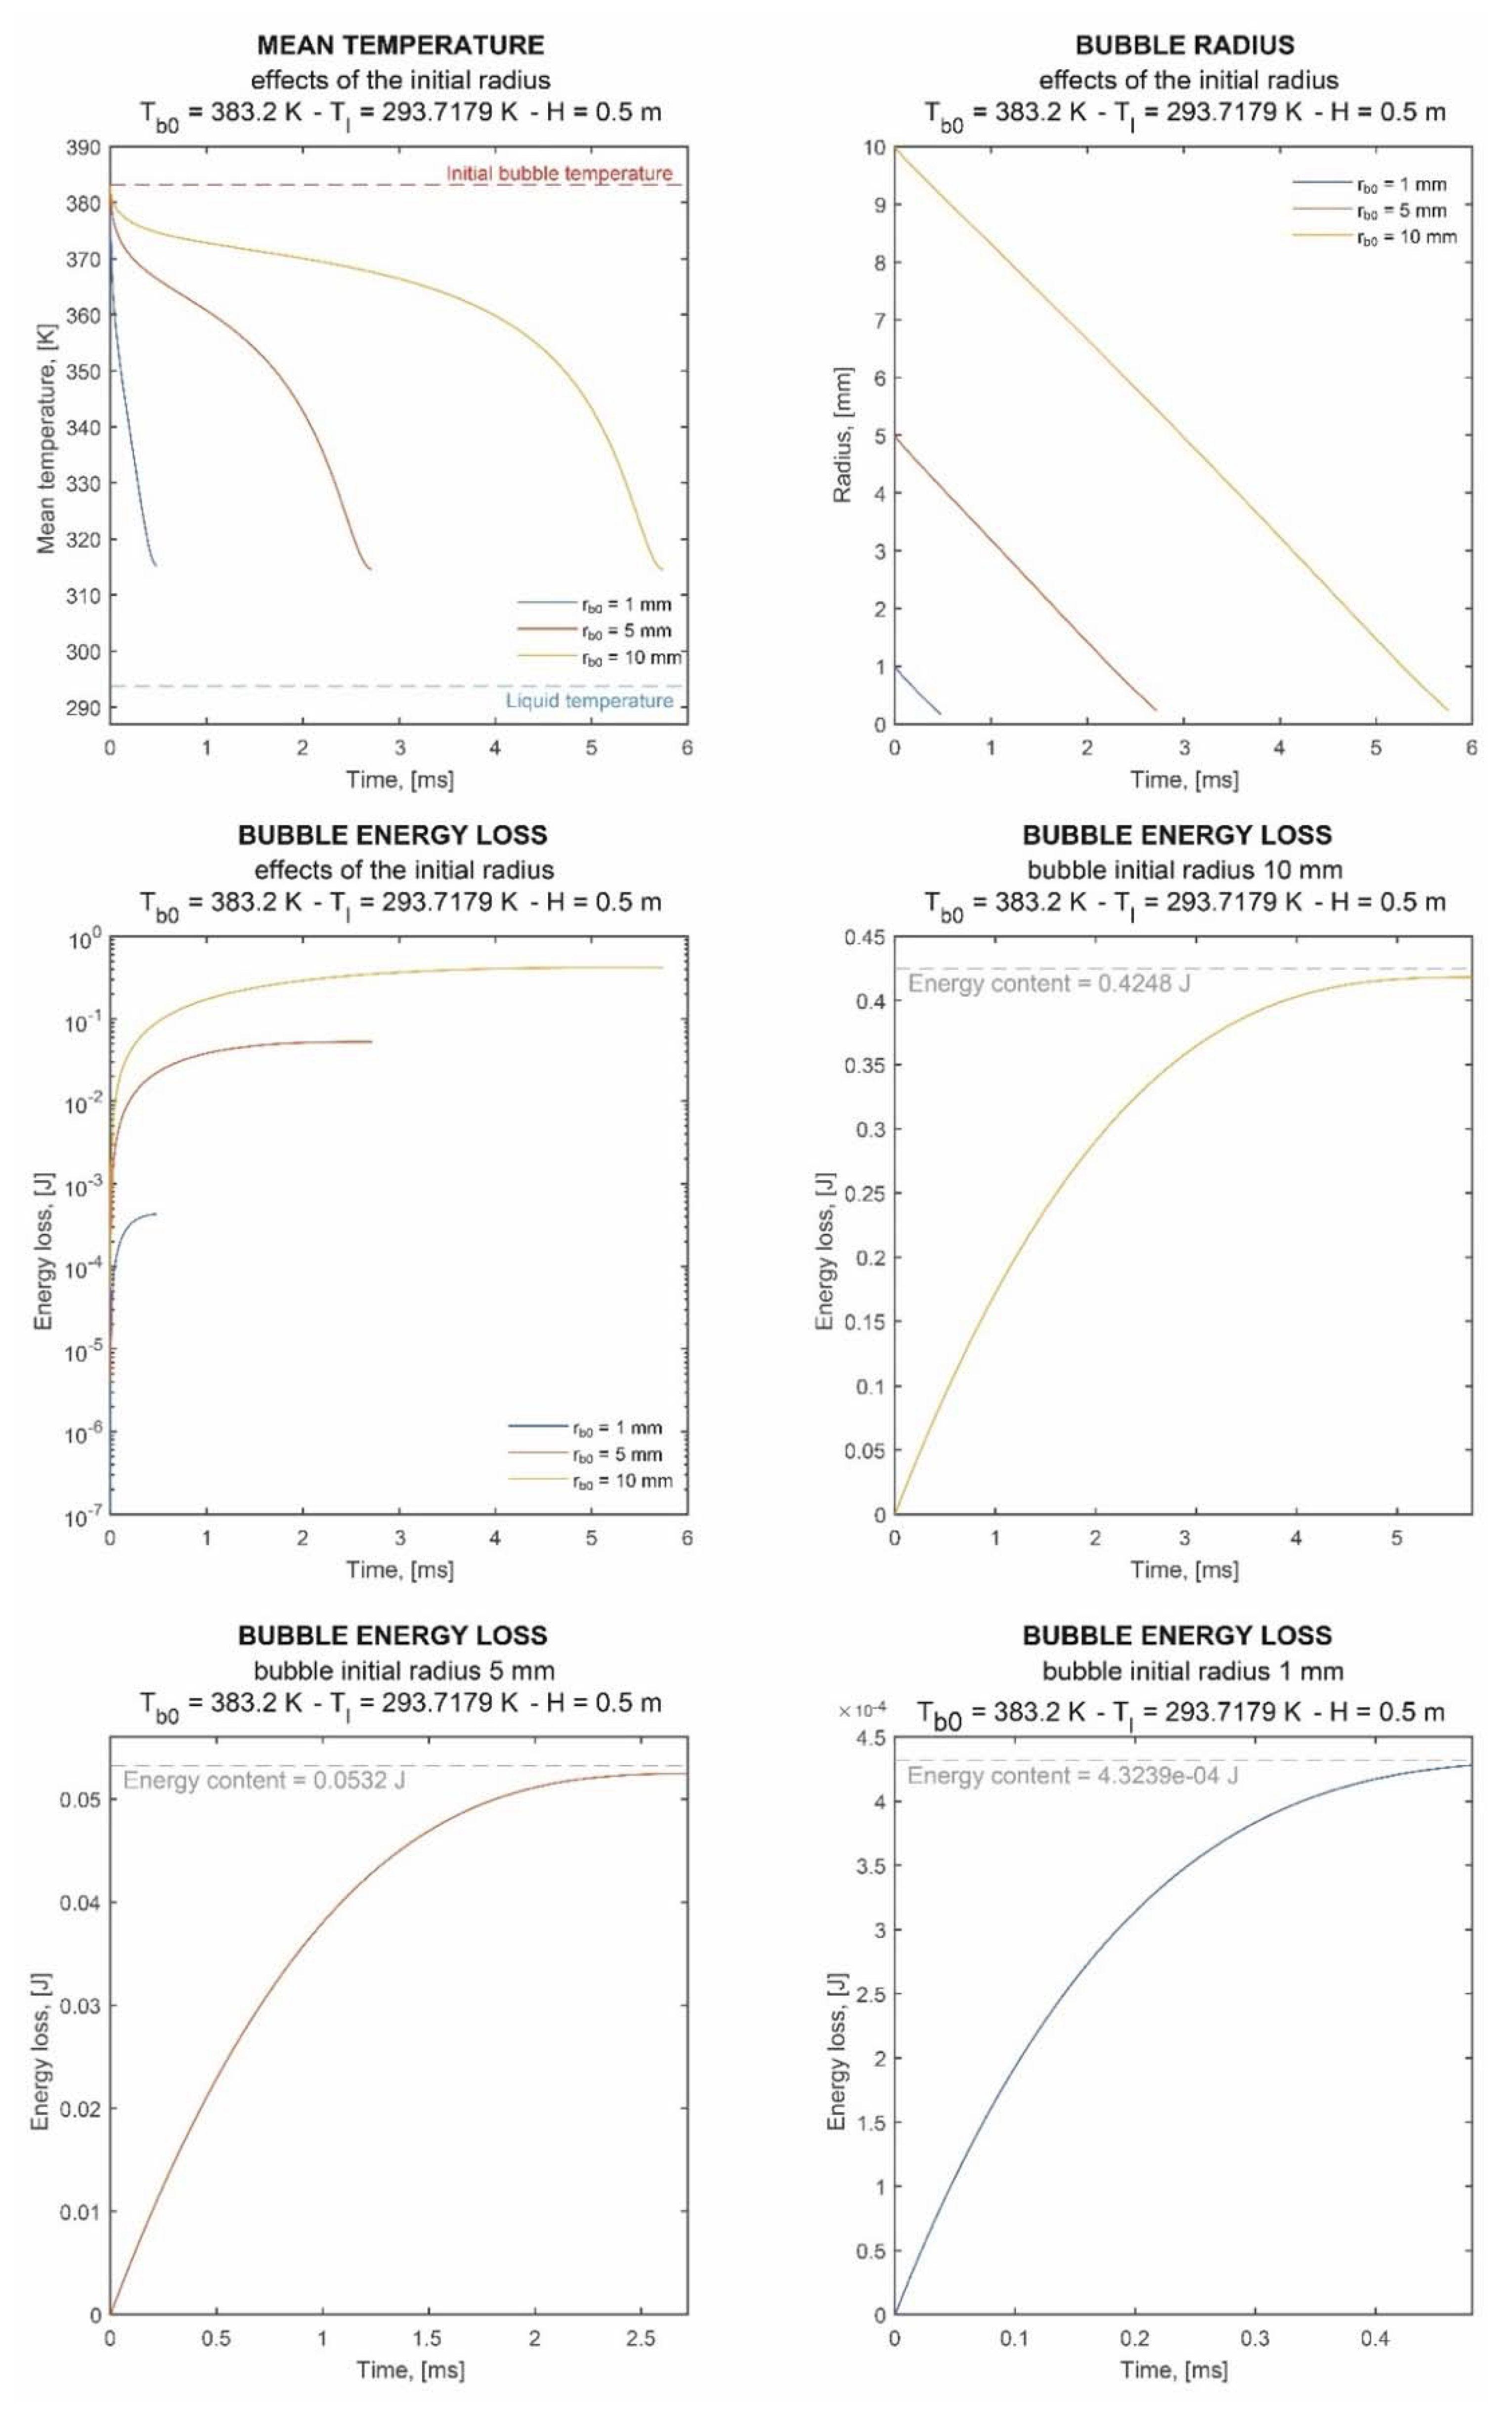
Variations of the thermodynamic injection conditions and the initial radius yielded similar trends as the results obtained by the simulations, as shown in Figure 5, where the comparison between velocity and position of the bubble is plotted as a function of the initial radius r_b0. During the cooling phase, velocity increases up to a maximum value and then decreases to zero. The buoyant force, generated by the difference in densities between liquid and vapor, that is the engine for the motion upward, tends to zero as the vapor cools down to reach the liquid condition.
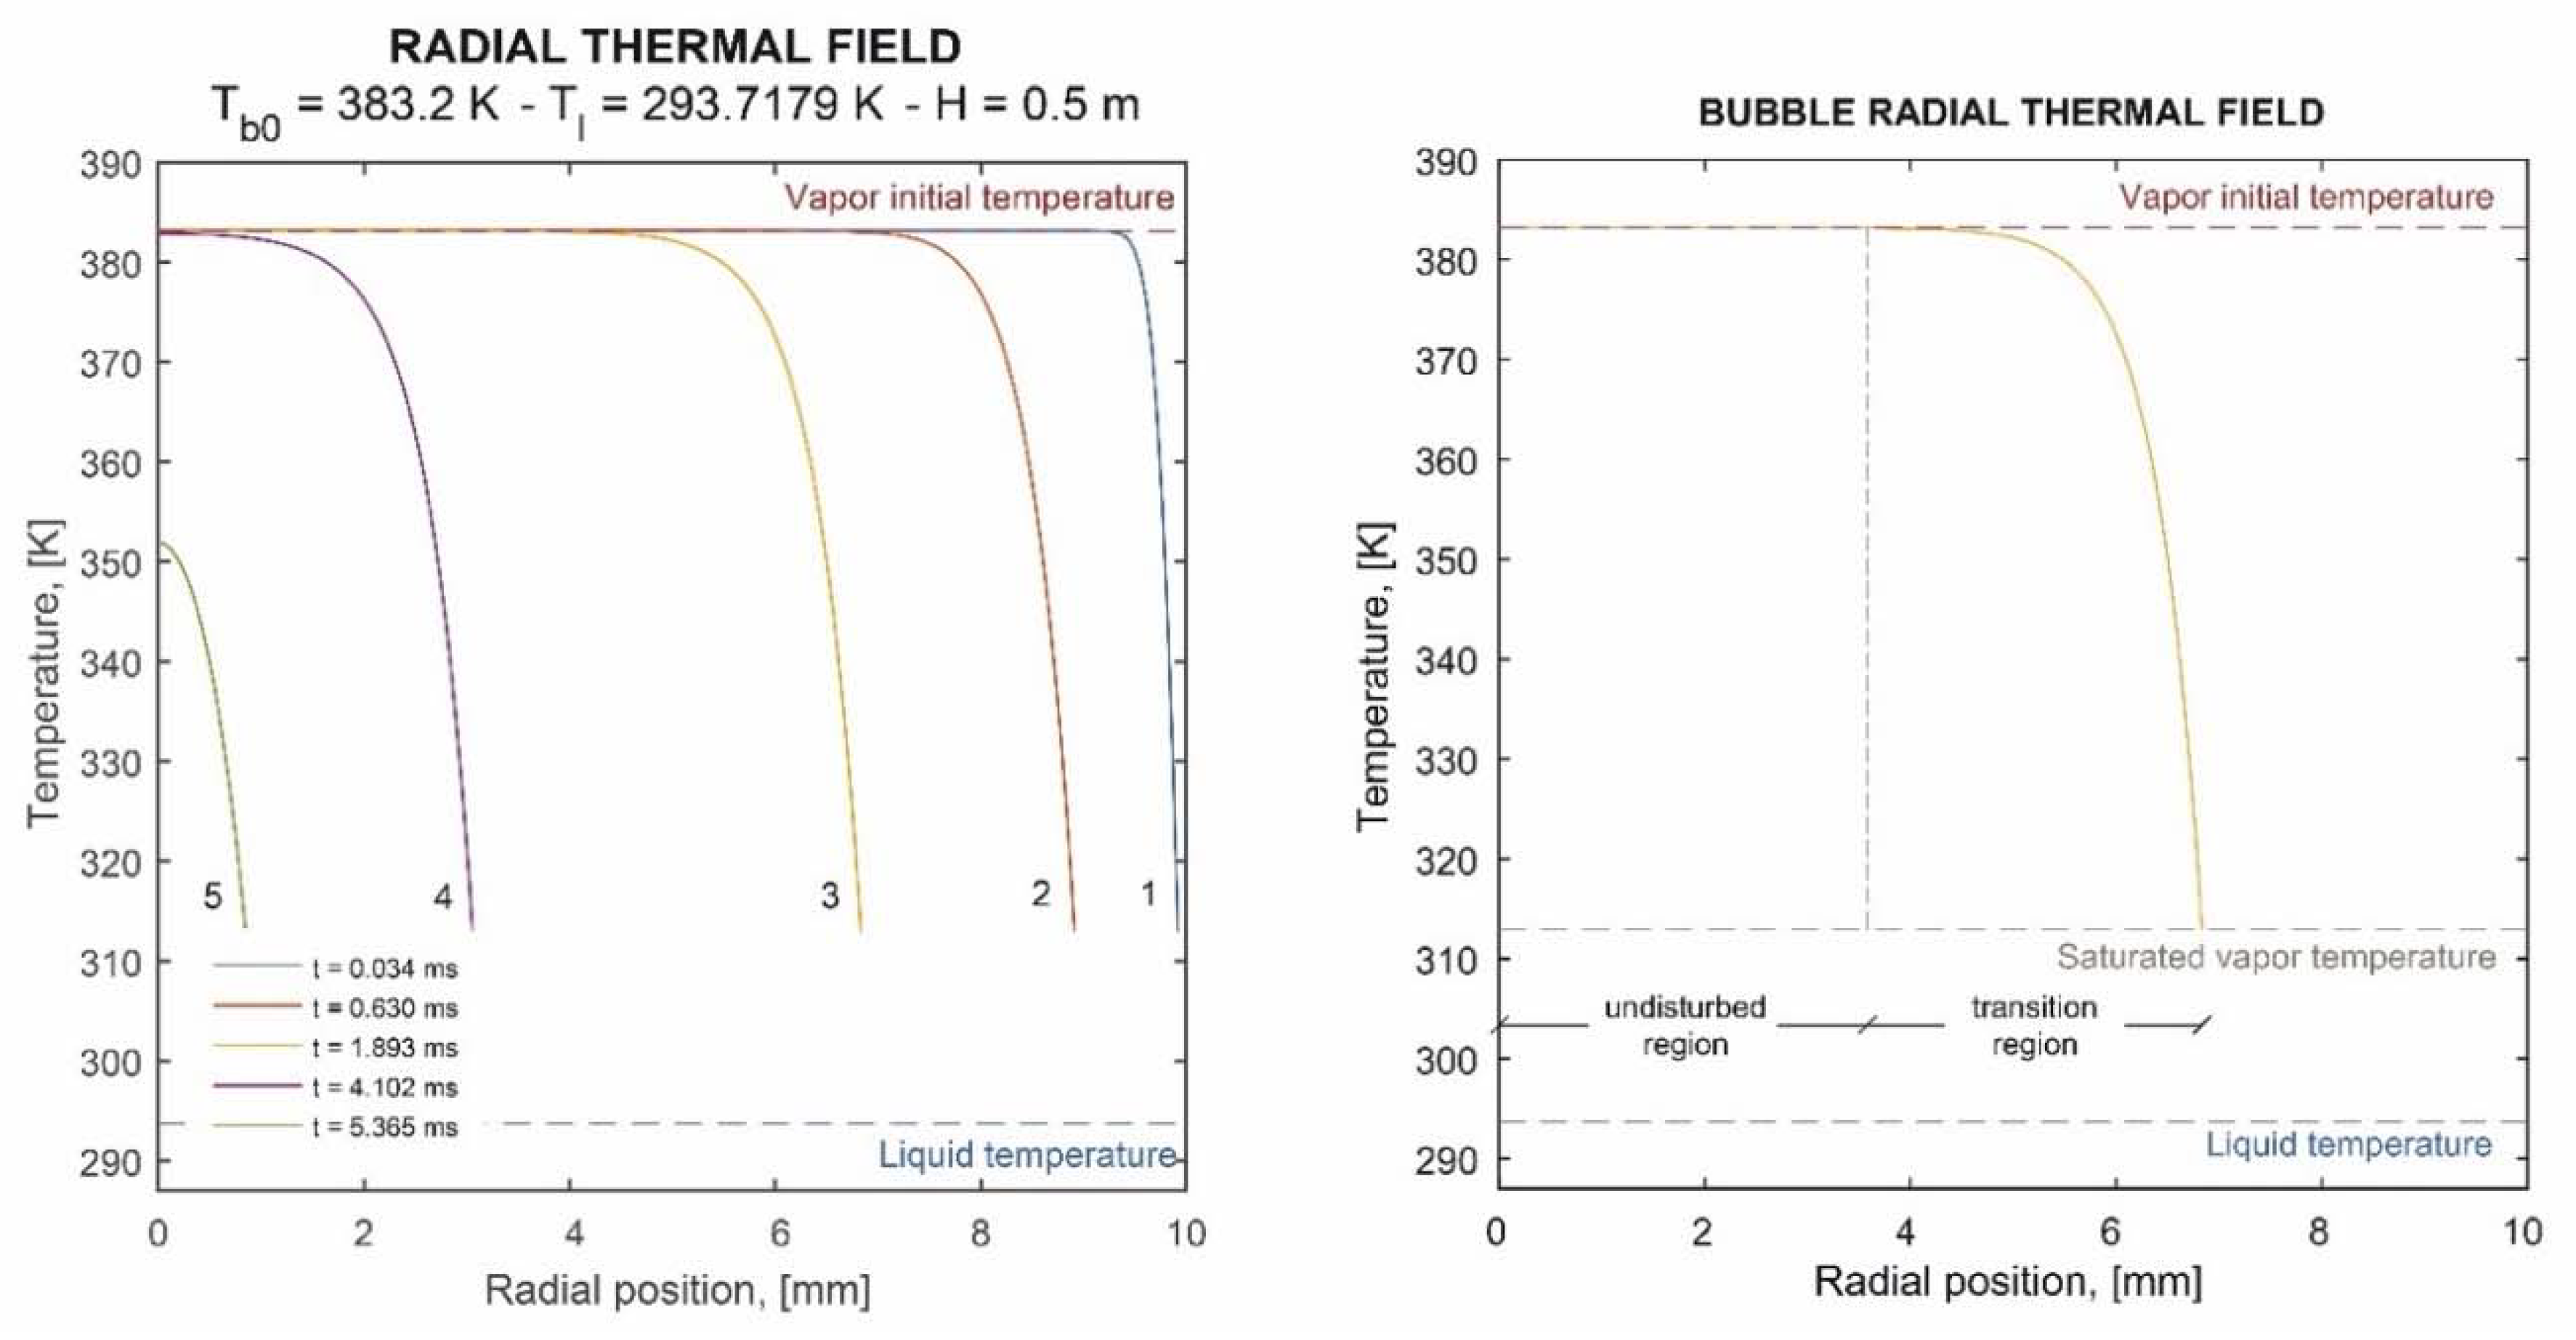
The average temperature curves, shown in Figure 6, are of particular interest. Compared to the classic exponentially decreasing cooling trend, three different regimes can be observed: an initial phase, an intermediate plateau and a thermal decay up to the bubble collapse. The behavior can be explained by observing the radial thermal profile curves of the vapor in Figure 7. At the beginning of curve 1, during transient cooling, the high thermal gradient at the liquid-vapor interface yields the quick set-up of a thermal gradient (portion of the volume of the bubble which shows a temperature variation of at least 1% higher than the injection temperature), where the vapor is affected by the presence of the liquid, by changing its temperature with respect to the initial value. In this phase the average bubble temperature decreases quickly, until the saturation conditions of the liquid-vapor frontier are reached.
Due to the phase change, the temperature difference between the vapor surface and the liquid remains constant, increasing the heat transfer and determining, in relation to the reduced thermal diffusivity of the vapor, the “rigid” translation of the thermal profile towards the center of the bubble (curves 2 and 3). This explains the nearly constant average temperature over time during the intermediate flat phase. When the amplitude of the transition region equals the instantaneous radius of the bubble (curve 4), even the core of the vapor, that behaves as a thermal reservoir up to that moment, is affected by the heat flow and a sudden decrease in average temperature (curve 5) up to the point when bubble collapse occurs (final thermal decay phase).
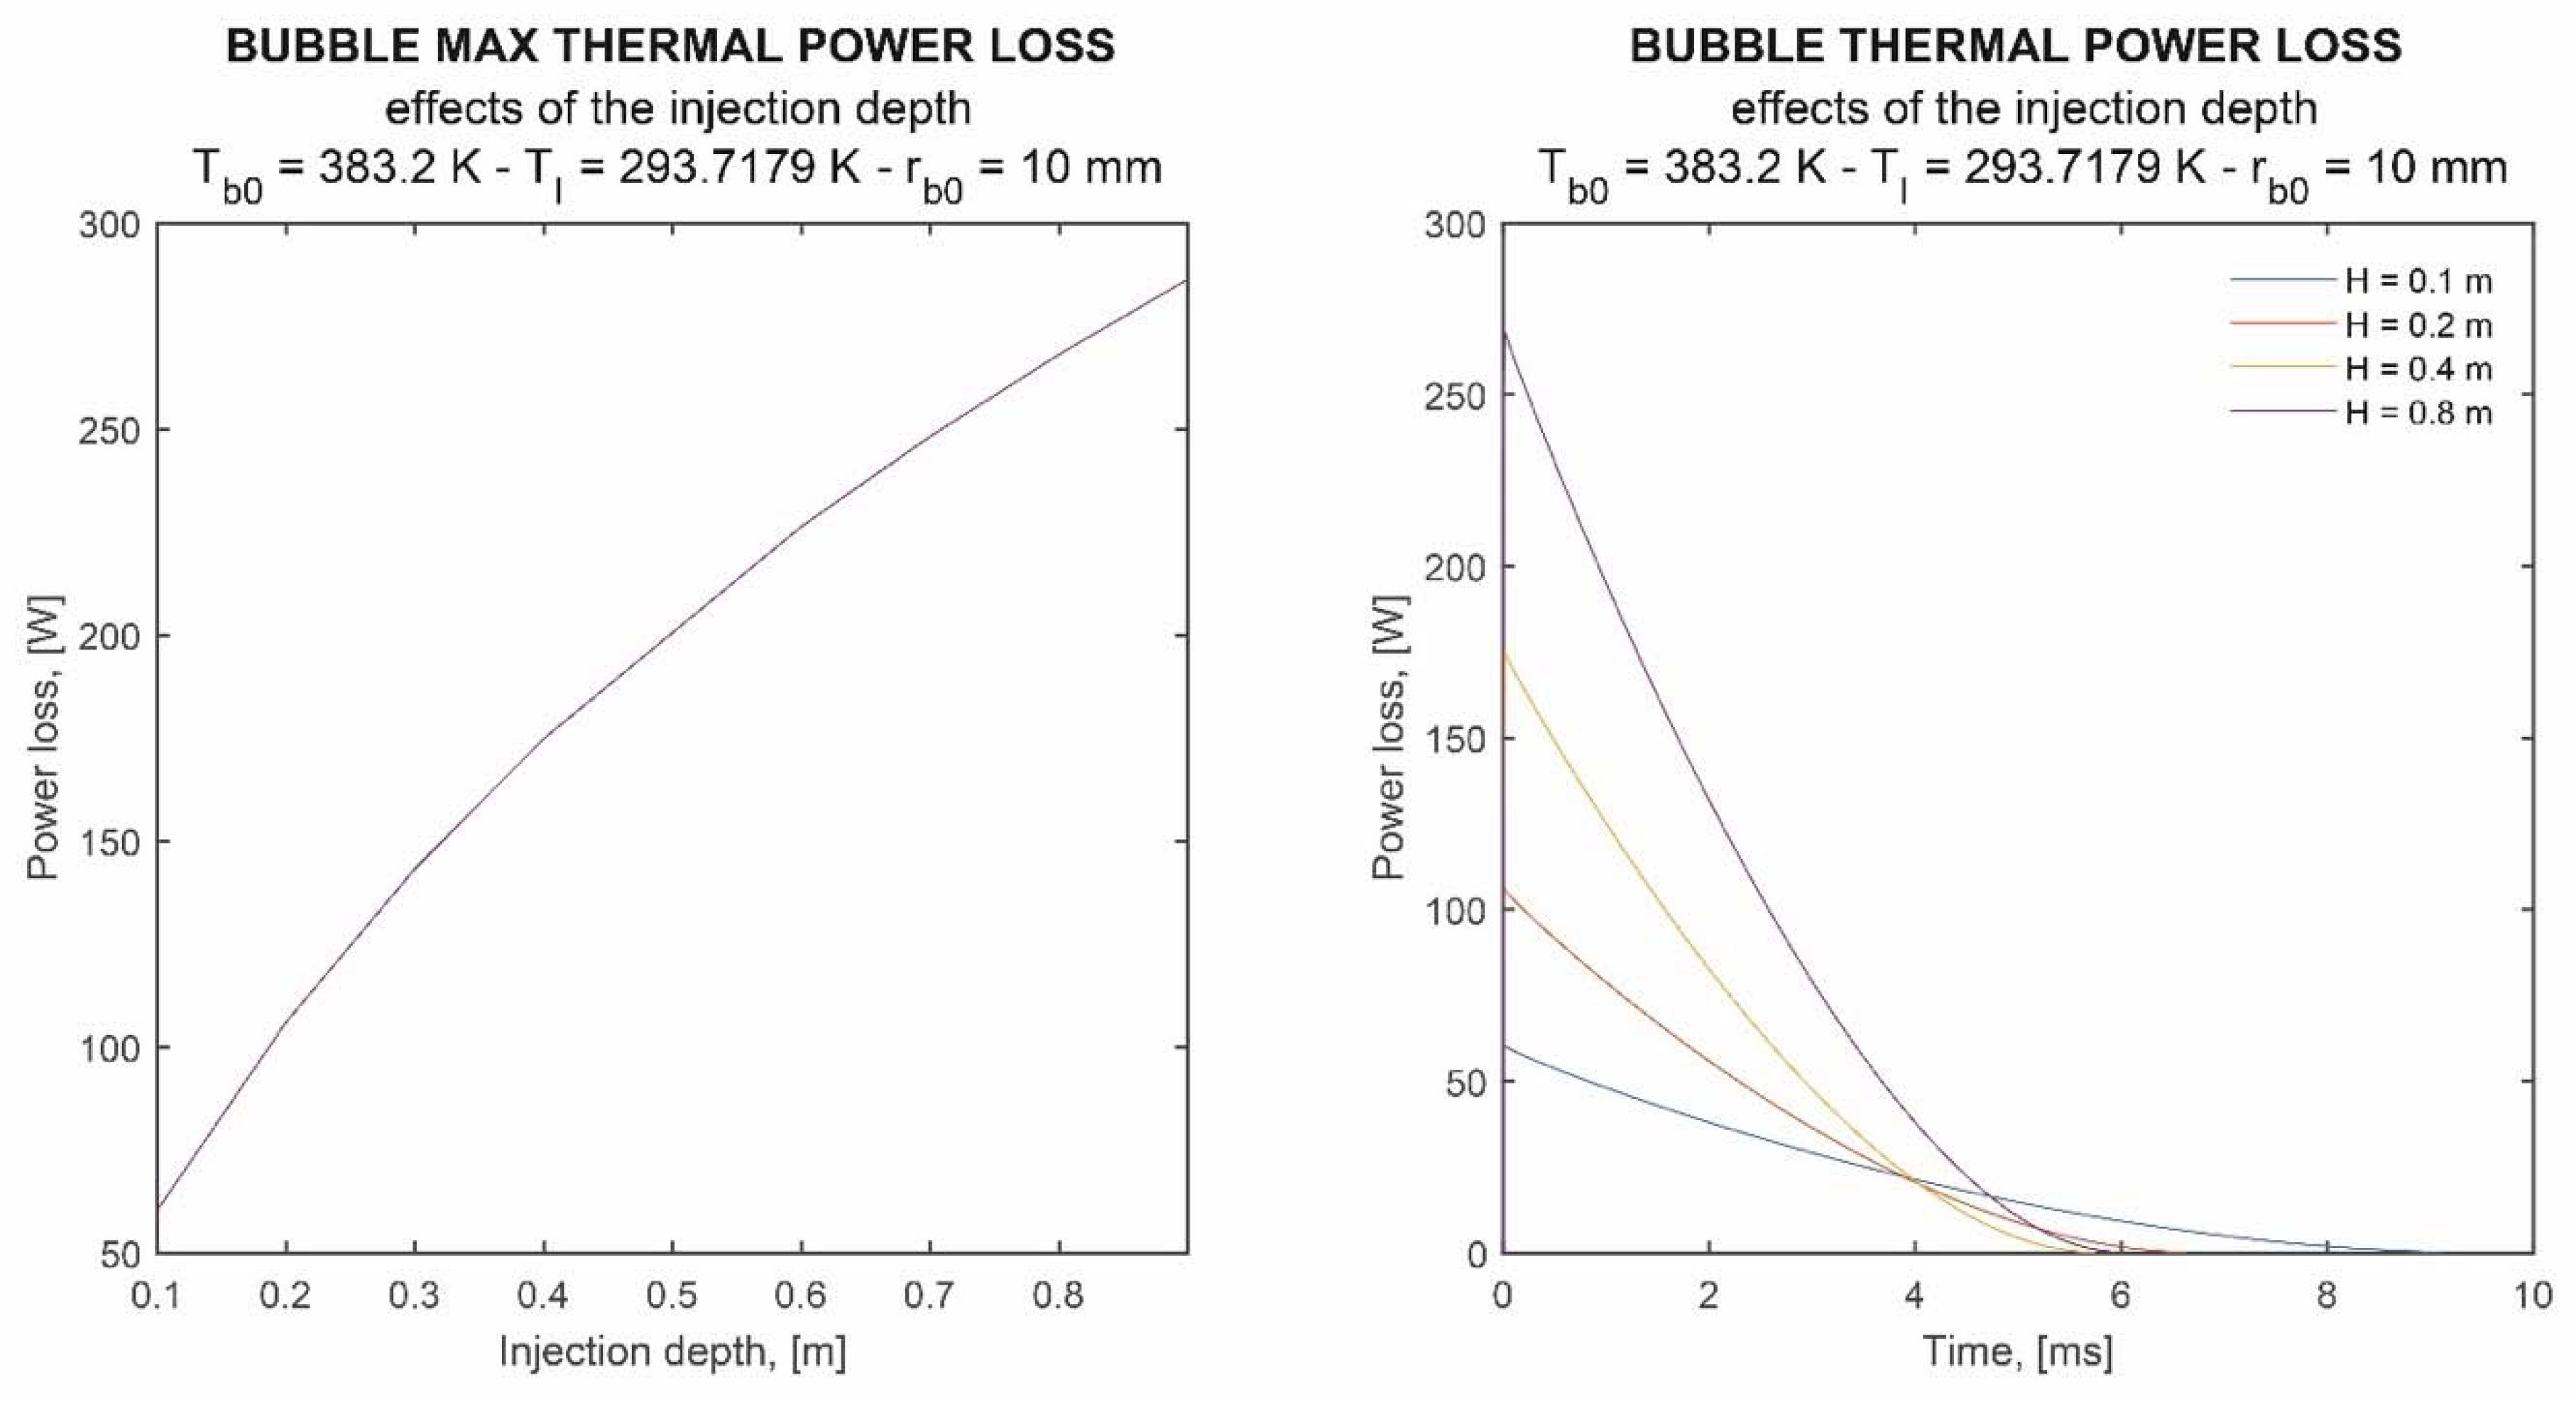
The liquid is considered at a uniform temperature and thus the saturation temperature of the vapor is always higher than the temperature of the surrounding liquid and ∆T increases with depth, due to the increase in local pressure and the effects of the surface tension of the liquid. In the Laplace equation the pressure difference between the inside and outside of the bubble (vapor—liquid) is given by and thus, depends on the surface tension . By increasing the injection depth (i.e., the ∆T with the liquid during the phase change), the heat transferred to the liquid increases even if it is less than proportional to the depth H and for H → ∞ it tends to near saturation (Figure 8).
This phenomenon is due to the fact that the heat transferred by the vapor during the condensation phase is proportional, through the latent condensation heat , to the condensed water flow rate. In this case, the vapor thermal diffusivity plays a fundamental role: as the injection depth increases, the freezing of the ∆T with the liquid at ever higher values increases the convective energy transfer to the bath, but the vapor, as a consequence of its thermal diffusivity, is not able to propagate the thermal front to the innermost layers of the bubble and the effect is an increase (in module) in the thermal gradient dT/dr calculated on the border surface of the bubble, Equation (17). The increase in the condensed water mass flow rate (and therefore of the heat transferred to the liquid), expected with the increase in convection, is diminished by the effects of thermal diffusivity, which acts by limiting the increase in the energy release rate.
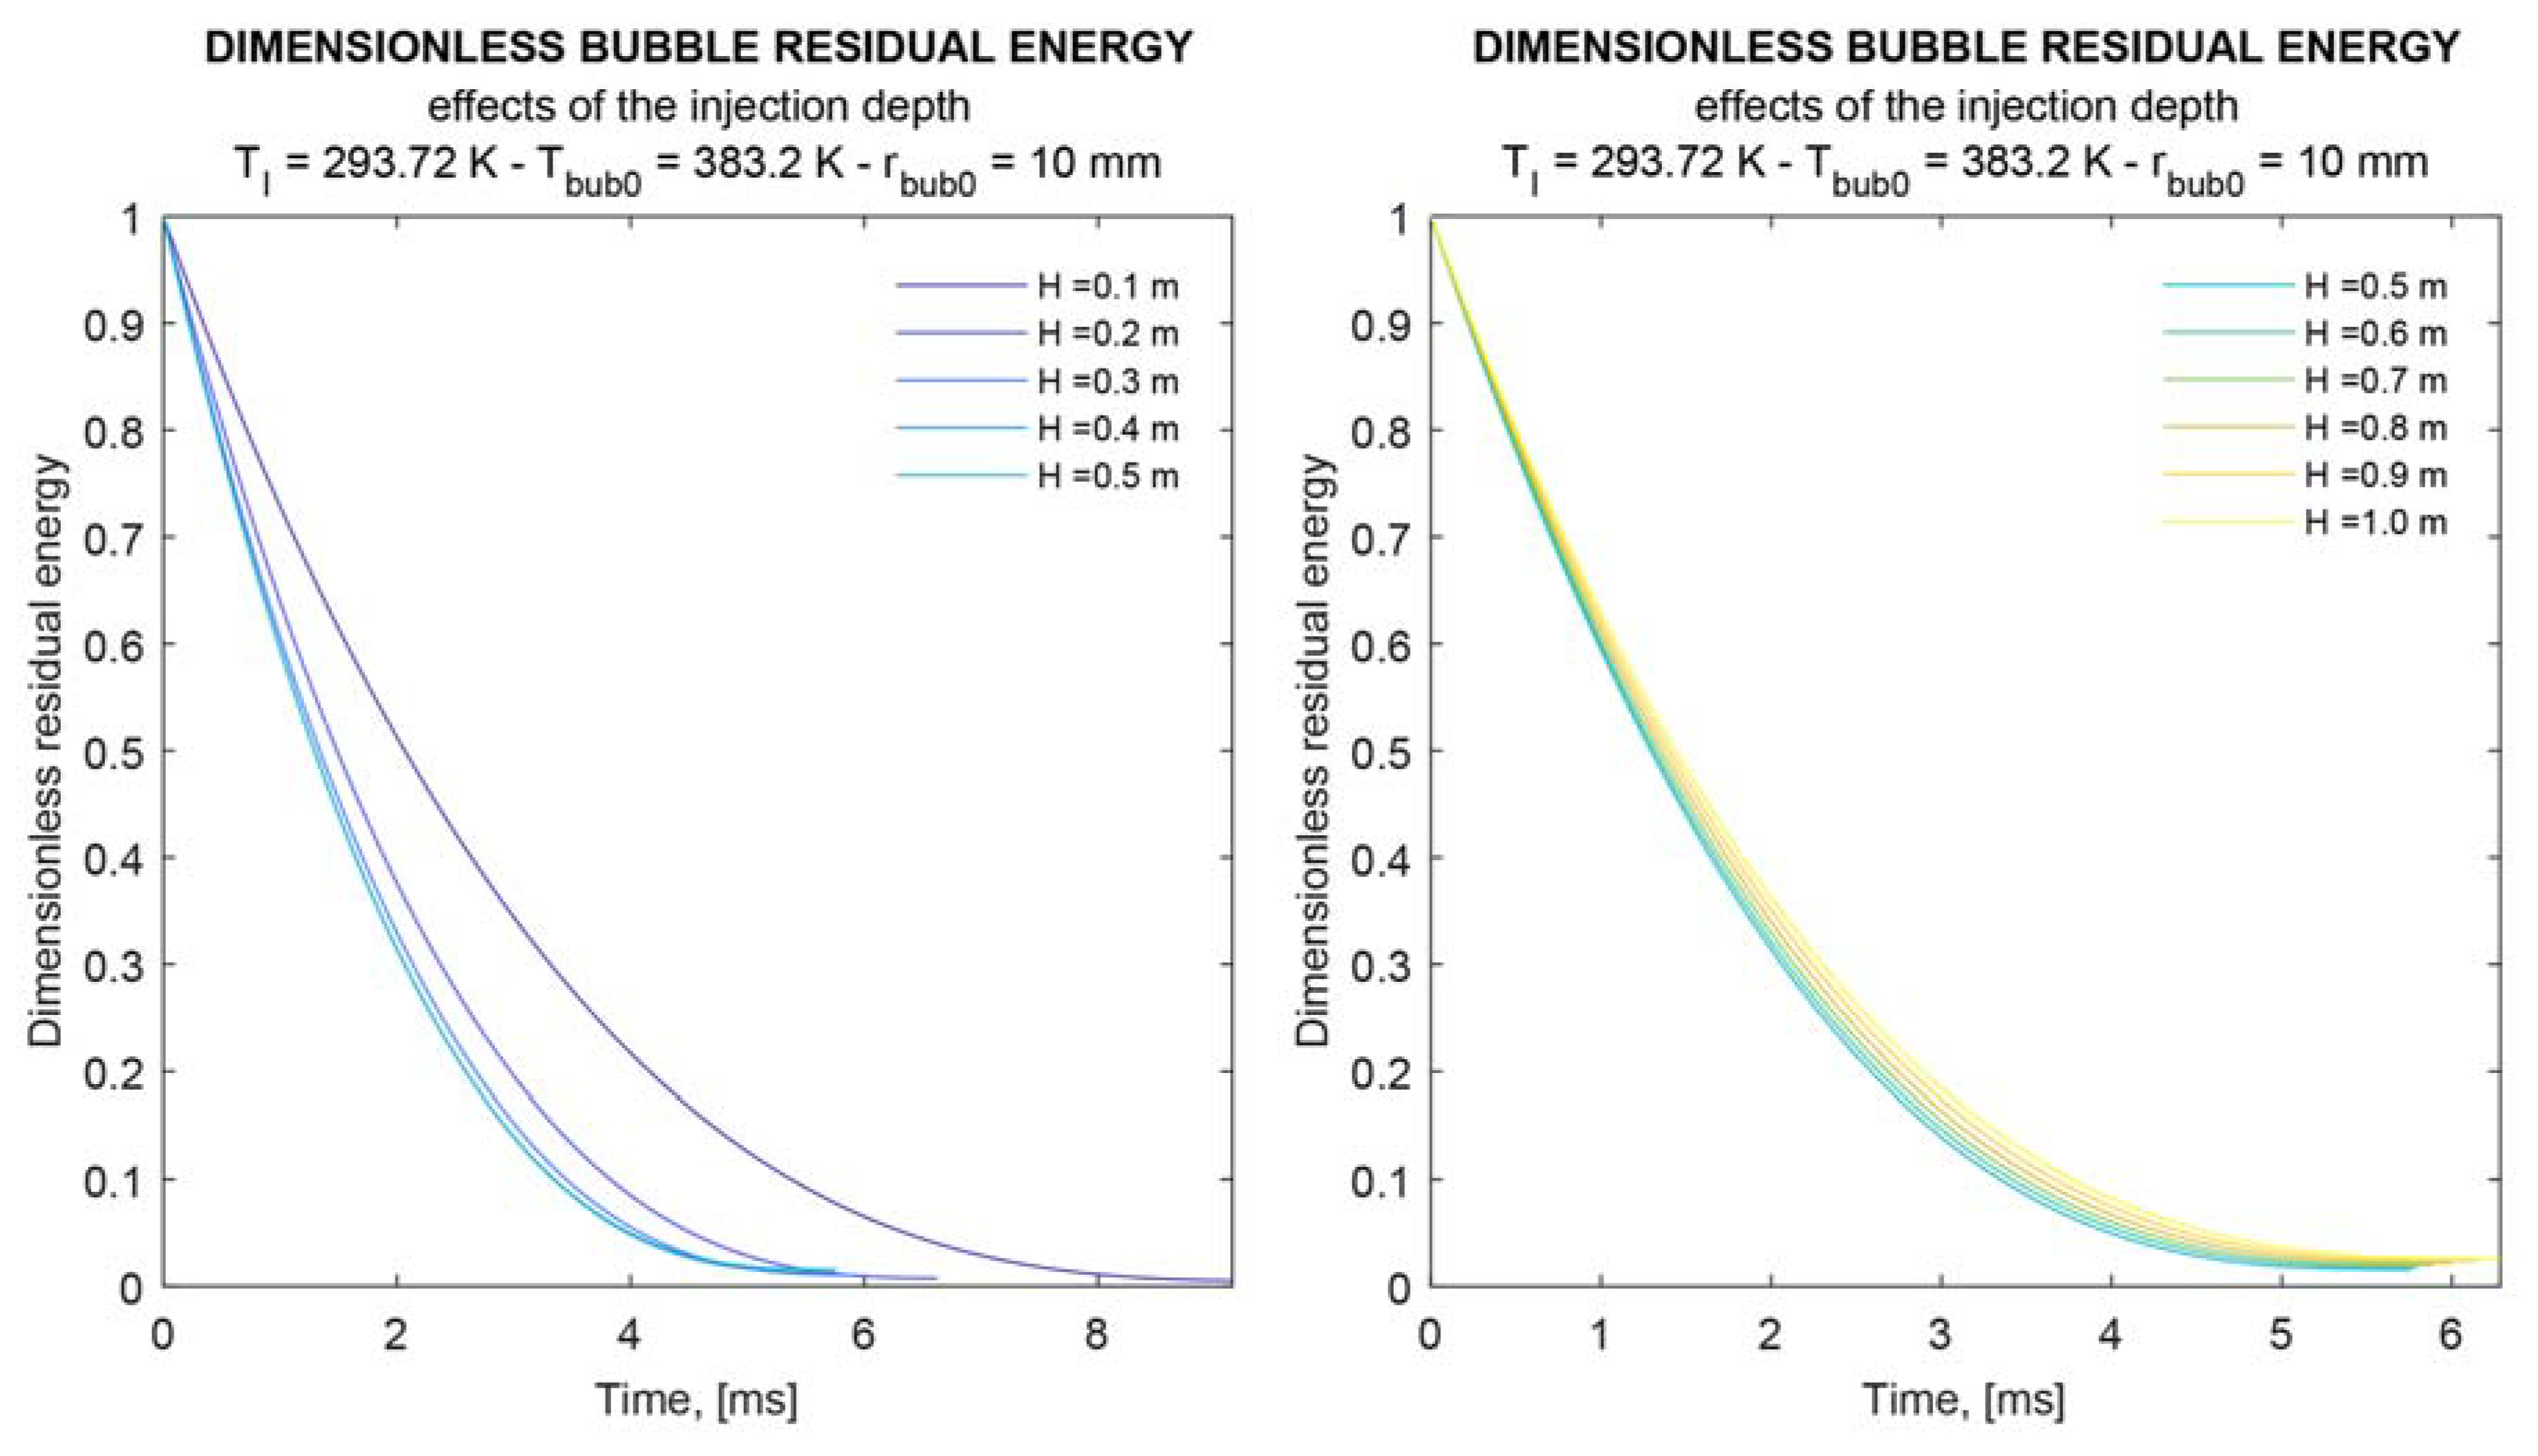
Once the injection conditions, and , have been fixed, the increase in depth H, on one hand governs the increase in heat transferred by the bubble, on the other hand it yields the increase in vapor density and thus, at a fixed volume, the increase in the total heat to be removed, is reliant to the saturation conditions. The increase both in heat transferred to the liquid and in the bubble energy as a consequence of the increase in its mass are competing and thus an optimal condition has to be found. The graphs in Figure 9 show the curves of the normalized residual energy (quantity of energy still kept by the vapor expressed as a fraction of the internal energy difference of the bubble between the injection conditions and the conditions of saturated vapor at the desuperheating temperature and pressure), for a bubble with = 10 mm. When injection depth increases, the thermal power transferred, with respect to the total transferable one, increases (curves with increasing slope) up to the maximum value, reached at an optimum depth = 0.4 m and then decreases again for (with progressively less-inclined curves).
When the injection conditions change, a similar behavior can be observed, even if with a different optimal depth. The bubble cooling rate depends on the balance between the energy to be removed (proportional to the mass) and the thermal power transferred to the liquid, both increasing with the injection depth H. Increasing the injection depth, starting from fixed and , the curves of the normalized bubble residual energy move towards the origin, showing an increase in the bubble cooling rate. In this condition, the increase in heat power transferred to the liquid is higher, with respect to the increase in the energy to be yielded due to the complete saturation of the vapor. The result is a reduction in cooling time. It can be observed that the same increases in depth always correspond to ever smaller displacements of the curves, which tend to overlap as . By increasing the depth , the curves tend to move away from the origin, thus demonstrating a reduction in the bubble cooling rate.
In this condition, the energy that the vapor must release to reach saturation increases with depth in a preponderant manner with respect to the increase of the thermal power transferred to the liquid, causing an increase in cooling time.
At assigned vapor injection conditions and bubble initial size, an optimal can be found that maximizes the energy release rate towards the bath or minimizes the vapor desuperheating time. The vapor injection at depth H above the optimal value is not convenient since the only effect would be the increase in discharge conditions of the low-pressure compressor, which results in a decrease in cycle efficiency.
The saturation of the energy release rate, analyzing the radial thermal profile curves in the bubble, has been attributed to the thermal diffusivity of the vapor which acts by limiting the propagation of the thermal perturbation to the inner layers of the bubble. In these hypotheses it is evident that to speed up the cooling process, and therefore to exploit the increase in liquid ΔT vapor associated with the increase in injection depth, it is necessary to act in such a way as to increase the thermal diffusivity of the vapor. Once the temperature and pressure conditions of the desuperheater have been set, the only possibility is to increase the injection temperature. Further investigations were carried out by varying the vapor injection temperature on two new temperatures, respectively at 343.20 and 423.20 K as shown in Figure 10 and Figure 11.
The direct comparison of the three curves of bubble residual energy at the same injection depth (the optimal H = 0.4 m) for the three analyzed temperatures (343.2, 383.2 and 423.2 K) is shown in Figure 12.
The analysis of Figure 9, Figure 10 and Figure 11 shows the independence of the optimal injection depth from the inlet temperature in the liquid bath even if this affects the cooling speed as shown in Figure 12, where it is evident that by increasing the temperature of the vapor, the slope of the cooling curve increases.
As a natural extension of the results discussed so far, the effects of the variation of the desuperheating pressure (temperature of the liquid bath) on the optimal depth (H) were investigated. A simulation campaign with variable injection depth was then carried out by setting the initial temperature and radius of the bubble to 383.20 K and 10 mm, respectively. The desuperheating pressure was finally set to 0.0073849 MPa, corresponding to a saturation temperature of the liquid 313.15 K. The expected behavior was a reduction in the available temperature difference between vapor and liquid against a decrease in the cooling speed. It is therefore reasonable to suppose that the optimal injection depth (H) increases compared to the previous case to favor an increase in the interfaced liquid-vapor ∆T. The results of these simulations, shown in Figure 13, confirmed this behavior. It is observable that in the simulated conditions the cooling speed continues to increase as the depth of injection of the vapor increased and the process exhibits saturation at a new optimal depth around 1.4 m.
4. Conclusions
A semi-analytical model of heat transfer between liquid and vapor has been proposed, using a single bubble approach, with the adaptation of the Fourier thermal equation to real cooling conditions and includes the effects of sensible and latent heat. The model appears to be physically consistent and interpretable trends have been obtained. The liquid surface tension, the injection depth and the thermal diffusivity of the vapor have been investigated, finding antagonistic behavior in the cooling process. Their effect results in the existence of an optimal injection depth that optimizes the heat transfer at given thermodynamic conditions of the vapor entering the desuperheater and at given bubble size.
The model can be proposed as a valid tool to help the design of multi-stage systems. Further theoretical and experimental investigations have been planned and will be performed in the future for a full validation of the model and for extension to the general area of multiple bubbles flow.
Author Contributions
Conceptualization, G.S.; data curation, L.C.; formal analysis, G.C.; investigation, G.S. and G.C.; methodology, G.S., L.C.; writing—original draft, G.C., L.C.; writing—review and editing, G.S. and G.C. All authors have read and agreed to the published version of the manuscript.
Funding
This research received no external funding.
Conflicts of Interest
The authors declare no conflict of interest.
Nomenclature
| bubble radius () | bubble initial radius () | ||
| bubble radial coordinate () | inner radius of the k-th bubble shell during the j-th time interval () | ||
| outer radius of the k-th bubble shell during the j-th time interval () | |||
| desuperheater saturated liquid temperature () | saturated vapor temperature during the j-th time interval () | ||
| vapor radial thermal field () | vapor radial thermal field during the j-th time interval () | ||
| initial temperature field across the k-th bubble shell during the j-th time interval () | vapor radial thermal field across the k-th bubble shell during the j-th time interval () | ||
| vapor injection temperature () | liquid–vapor temperature difference at the bubble boundary surface () | ||
| boundary value problem auxiliary variable () | |||
| mean vapor density () | mean vapor density during the j-th time interval () | ||
| bubble vertical acceleration () | bubble vertical acceleration during the j-th time interval () | ||
| bubble vertical velocity () | bubble vertical velocity during the j-th time interval () | ||
| liquid density () | |||
| flow drag coefficient (dimensionless) | flow drag coefficient during the j-th time interval (dimensionless) | ||
| gravity acceleration () | time () | ||
| initial bubble position during the j-th time interval () | |||
| time interval index | bubble shell index | ||
| vapor local density () | vapor density of the k-th bubble shell during the j-th time interval () | ||
| vapor isobaric specific heat () | vapor isobaric specific heat of the k-th bubble shell during the j-th time interval () | ||
| vapor thermal conductivity () | vapor thermal conductivity of the k-th bubble shell during the j-th time interval () | ||
| vapor thermal diffusivity () | vapor thermal diffusivity of the k-th bubble shell during the j-th time interval () | ||
| radial thickness of the k-th bubble shell () | radial thickness of the k-th bubble shell in saturated conditions () | ||
| volume of the k-th bubble shell () | |||
| characteristic temperature of the process during the j-th time interval () | eigenfunction of the thermal problem associated to the n-th thermal eigenvalue during the j-th time interval (dimensionless) | ||
| n-th eigenvalue of the thermal problem during the j-th time interval () | thermal solution combination constant associated to the n-th thermal eigenvalue during the j-th time interval () | ||
| eigenfunction of the thermal problem associated to the n-th thermal eigenvalue during the j-th time interval (dimensionless) | coefficient of the n-th eigenfunction (dimensionless) | ||
| coefficient of the n-th eigenfunction (dimensionless) | liquid—vapor convection heat transfer coefficient during the j-th time interval () | ||
| condensed mass flow rate during the j-th time interval () | optimal vapor depth of injection (m) | ||
| latente heat of condensation during the j-th time interval () | |||
| intermediate desuperheating pressure () | |||
| vapor depth of injection (m) |
References
- Stoecker, W.F. Industrial Refrigeration Handbook, 1st ed.; McGraw-Hill: New York, NY, USA, 1998; p. 800. [Google Scholar]
- Farajisarir, D. Growth and Collapse of Vapour Bubbles in Convective Subcooled Boiling of Water. Ph.D. Thesis, University of British Columbia, Vancouver, BC, Canada, 1993. [Google Scholar]
- Van Stralen, S.J.D. The growth rate of vapour bubbles in superheated pure liquids and binary mixtures: Part I: Theory. Int. J. Heat Mass Transf. 1968, 11, 1467–1489. [Google Scholar] [CrossRef]
- Plesset, M.S.; Zwick, S.A. The Growth of Vapor Bubbles in Superheated Liquids. J. Appl. Phys. 1954, 25, 493–500. [Google Scholar] [CrossRef] [Green Version]
- Akiyama, M. Bubble Collapse in Subcooled Boiling. Bull. JSME 1973, 16, 570–575. [Google Scholar] [CrossRef] [Green Version]
- Bergman, T.L.; Incropera, F.P.; DeWitt, D.P.; Lavine, A.S. Fundamentals of Heat and Mass Transfer; John Wiley & Sons: New York, NY, USA, 2011; p. 1048. [Google Scholar]
- Gumerov, N.A. The heat and mass transfer of a vapor bubble with translatory motion at high Nusselt numbers. Int. J. Multiph. Flow 1996, 22, 259–272. [Google Scholar] [CrossRef]
- Bohdal, T. Bubbly boiling of environment-friendly refrigerating media. Int. J. Heat Fluid Flow 2000, 21, 449–455. [Google Scholar] [CrossRef]
- Sujatha, K.; Mani, A.; Murthy, S.S. Experiments on a bubble absorber. Int. Commun. Heat Mass Transf. 1999, 26, 975–984. [Google Scholar] [CrossRef]
- Wu, X.; Liu, J.; Xu, S.; Wang, W. Effect of vibration parameters on the bubble absorption characteristics of working fluids R134a-DMAC in a vertical tube. Int. J. Refrig. 2019, 99, 234–242. [Google Scholar] [CrossRef]
- Merrill, T.L.; Perez-Blanco, H. Combined heat and mass transfer during bubble absorption in binary solutions. Int. J. Heat Mass Transf. 1997, 40, 589–603. [Google Scholar] [CrossRef]
- Surtaev, A.; Serdyukov, V.; Malakhov, I. Effect of subatmospheric pressures on heat transfer, vapor bubbles and dry spots evolution during water boiling. Exp. Therm. Fluid Sci. 2020, 112, 109974. [Google Scholar] [CrossRef]
- Mimouni, S.; Guingo, M.; Lavieville, J.; Mérigoux, N. Combined evaluation of bubble dynamics, polydispersion model and turbulence modeling for adiabatic two-phase flow. Nucl. Eng. Des. 2017, 321, 57–68. [Google Scholar] [CrossRef]
- Yan, P.; Jin, H.; He, G.; Guo, X.; Ma, L.; Yang, S.; Zhang, R. Numerical simulation of bubble characteristics in bubble columns with different liquid viscosities and surface tensions using a CFD-PBM coupled model. Chem. Eng. Res. Des. 2020, 154, 47–59. [Google Scholar] [CrossRef]
- Lobanov, P.; Pakhomov, M.; Terekhov, V. Experimental and numerical study of the flow and heat transfer in a bubbly turbulent flow in a pipe with sudden expansion. Energies 2019, 12, 2735. [Google Scholar] [CrossRef] [Green Version]
- Saha, P.; Sandilya, P. A dynamic lumped parameter model of injection cooling system for liquid subcooling. Int. J. Therm. Sci. 2018, 132, 552–557. [Google Scholar] [CrossRef]
- Xu, Z.; Zhang, J.; Lin, J.; Xu, T.; Wang, J.; Lin, Z. An overall bubble diameter model for the flow boiling and numerical analysis through global information searching. Energies 2018, 11, 1297. [Google Scholar] [CrossRef] [Green Version]
- Kumar, R.; Trabold, T.A.; Maneri, C.C. Experiments and modeling in bubbly flows at elevated pressures. Journal of Fluids Engineering. Trans. ASME 2003, 125, 469–478. [Google Scholar] [CrossRef]
- Zarate, J.A.; Roy, R.P.; Kang, S.; Laporta, A. Modeling and simulation of subcooled turbulent boiling flow. Am. Soc. Mech. Eng. Heat Transf. Div. 2000, 366, 263–271. [Google Scholar]
- Hahn, D.W.; Özisik, M.N. Heat Conduction, 2nd ed.; John Wiley & Sons: New York, NY, USA, 1993; p. 692. [Google Scholar]
- Jiji Latif, M. Heat Conduction, 3rd ed.; Springer: Berlin/Heidelberg, Germany; New York, NY, USA, 2009; p. 418. [Google Scholar]
- Florschuetz, W.; Chao, B. On the Mechanics of Vapor Bubble Collapse. J. Heat Transf. 1965, 87, 209–220. [Google Scholar] [CrossRef]
- Mikhailov, M.D.; Özisik, M.N. Unified Analysis and Solutions of Heat and Mass Diffusion, 1st ed.; John Wiley and Sons: New York, NY, USA, 1984; p. 524. [Google Scholar]
- IAPWS R12-08: Release on the IAPWS Formulation 2008 for the Viscosity of Ordinary Water Substance; IAPWS: Berlin, Germany, 2008.
- IAPWS R15-11: Release on the IAPWS Formulation 2011 for the Thermal Conductivity of Ordinary Water Substance; IAPWS: Plzen, Czech Republic, 2011.
- IAPWS R1-76: Revised Release on Surface Tension of Ordinary Water Substance; IAPWS: Moscow, Russia, 2014.
- IAPWS R7-97: Revised Release on the IAPWS Industrial Formulation 1997 for the Thermodynamic Properties of Water and Steam; IAPWS: Lucerne, Switzerland, 2012.
- Çengel, Y.A. Introduction to Thermodynamics and Heat Transfer; McGraw-Hill: New York, NY, USA, 2009; p. 960. ISBN 978-0071287739. [Google Scholar]
- Morrison, F.A. Data Correlation for Drag Coefficient for Sphere. Ph.D. Thesis, Department of Chemical Engineering, Michigan Technological University, Houghton, MI, USA, 2016. Available online: www.chem.mtu.edu/~fmorriso/DataCorrelationForSphereDrag2016.pdf (accessed on 3 January 2019).
Figure 1.
Desuperheating techniques: (a) liquid injection method and (b) the bubbling method. Legend: 1a and 1b—condenser; 2a and 2b—expansion valves; 3a and 3b—evaporator; 4a and 4b—low-pressure compressor; 5a—liquid vaporization section; 5b—superheated vapor injection section; 6a and 6b—receiver at intermediate pressure; 7a and 7b—high-pressure compressor; 8a and 8b—expansion valve driven by refrigerant level; 9a—liquid injection pump.

Figure 2.
Concept flow-chart of the model.

Figure 3.
Bubble equilibrium of forces in the direction.

Figure 4.
Energy flows in the shell under saturation conditions.

Figure 5.
Velocity and position of the bubble.

Figure 6.
Bubble average temperature, radius and energy losses.

Figure 7.
Vapor radial thermal field.

Figure 8.
Bubble power loss vs. injection depth.

Figure 9.
Bubble residual energy vs. time (Tbub0 = 383.2 K).

Figure 10.
Bubble residual energy vs. time for low injection temperature (Tbub0 = 343.2 K).

Figure 11.
Bubble residual energy vs. time for high injection temperature (Tbub0 = 423.2 K).

Figure 12.
Bubble residual energy vs. time, temperature dependence.

Figure 13.
Bubble residual energy vs. time, desuperheating pressure dependence.


Table 1.
Initialization values of the simulation.
| Variable | Value | Comments |
|---|---|---|
| [MPa] | 2.42 × 10⁻³ | Geometric mean of the characteristic cycle pressures (corresponding to a liquid temperature of 293.72 K) |
| [m/s] | 0.0 | With nozzle facing upwards |
| [m] | 0.0 | With reference to the injection section |
| [mm] | {1.0; 5.0; 10.0} | |
| [K] | {383.2; 423.2} | |
| [m] | {0.1; 0.2; 0.3; 0.4; 0.5; 0.6; 0.7} |
© 2020 by the authors. Licensee MDPI, Basel, Switzerland. This article is an open access article distributed under the terms and conditions of the Creative Commons Attribution (CC BY) license (http://creativecommons.org/licenses/by/4.0/).
Share and Cite
MDPI and ACS Style
Starace, G.; Carrieri, L.; Colangelo, G. Semi-Analytical Model for Heat and Mass Transfer Evaluation of Vapor Bubbling. Energies 2020, 13, 1104. https://0-doi-org.brum.beds.ac.uk/10.3390/en13051104
AMA Style
Starace G, Carrieri L, Colangelo G. Semi-Analytical Model for Heat and Mass Transfer Evaluation of Vapor Bubbling. Energies. 2020; 13(5):1104. https://0-doi-org.brum.beds.ac.uk/10.3390/en13051104
Chicago/Turabian StyleStarace, Giuseppe, Lorenzo Carrieri, and Gianpiero Colangelo. 2020. "Semi-Analytical Model for Heat and Mass Transfer Evaluation of Vapor Bubbling" Energies 13, no. 5: 1104. https://0-doi-org.brum.beds.ac.uk/10.3390/en13051104
Note that from the first issue of 2016, this journal uses article numbers instead of page numbers. See further details here.