Recipe of Lightweight Slurry with High Early Strength of the Resultant Cement Sheath


Oil and Gas Institute, National Research Institute, 25A Lubicz Str., 31-503 Krakow, Poland
Energies 2020, 13(7), 1583; https://0-doi-org.brum.beds.ac.uk/10.3390/en13071583
Submission received: 20 February 2020
/
Revised: 11 March 2020
/
Accepted: 20 March 2020
/
Published: 1 April 2020
(This article belongs to the Special Issue Developments in Oil and Gas Engineering)
Abstract
:Admixtures of mineral or waste filling materials are used to reduce slurry density. However, the sheath made of lightweight cement slurry has low mechanical performance at the initial bonding time. The required strength is achieved later. This is the main problem when evaluating the cement bond logging. The waiting time for geophysical measurements after injecting and bonding of cement is nowadays increasingly shortened. This is forced by economic factors. Too early geophysical measurements may result in obtaining a false indication of the cement bond logging. The lack of cement or partial bonding, despite the presence of slurry in the annular space is then found. The slurry developed by the author achieves high compressive strength after a short bonding time. Reducing the amount of water in the slurry resulted in a lowered filtration value. This is important in preventing gas migration after the cementing. The designed slurry also reaches the value of 3.5 MPa in a short time. This allows for an earlier commencement of a well drilling. The use of said slurry improves the effectiveness of the well sealing and makes it possible to obtain a reliable knowledge of the bond logging.
1. Introduction
To isolate permeable levels saturated with reservoir fluids, cementing of casing string columns is applied. The purpose of that procedure is to keep the string columns in the well and protect them against corrosion caused by reservoir fluids and gases [1,2,3,4]. The annular space is filled with cement slurry which displaces the drilling mud by being injected. Cement slurries are divided into the ones with a ‘normal density’, around 1750–1850 kg/m3, lightweight slurries (below 1750 kg/m3) and heavy slurries (above 1900 kg/m3). The slurry density is chosen based on the geological and technical conditions resulting from the geological structure and well depth [5,6,7,8,9,10].
This publication refers to lightweight slurries. Such recipes are used when sealing casing string columns in absorbent or weakly compacted rock profiles. They are occasionally used for sealing wells drilled in productive levels with low reservoir pressure, or for reconstruction works. The occurrence of low reservoir pressure is manifested by the disappearance of mud while drilling or the infiltration of cement slurry into the absorbent geological structure. This leads to a decrease in the hydrostatic pressure of the drilling mud in the well and a violation of the pressure balance condition [11,12,13,14,15,16,17,18]. A reduction or complete drop of the hydrostatic pressure of the drilling mud results in a collapse of a well wall and in further complications. If a low reservoir pressure zone and the drilling mud leak occur while drilling such condition can be controlled. To this end, the drilling mud density is reduced and blockers (ground nut shells, sawdust, powdered rubber, cellophane film, or sealing paste) are injected [19,20,21,22,23,24,25,26,27]. However, during the cementing procedure, it is not possible to intervene if the cement slurry disappears while being injected. This is related to both the designed time of bonding and thickening of the cement slurry, as well as to the properly selected time of the entire cementing procedure [28,29,30,31,32,33]. Therefore, a very important step in sealing the casing string columns embedded in loose layers is the use of a reduced density recipe. Such slurry is obtained by adding light mineral fillers into it. By reducing the density of cement slurry, the hydrostatic pressure during cementing is lowered. By so doing, the escape of cement into the low-pressure zones can be prevented. However, the sheath made of the lightweight cement slurry has a low early compressive strength and obtains the required property at a later bonding time [34,35,36,37,38,39,40,41,42].
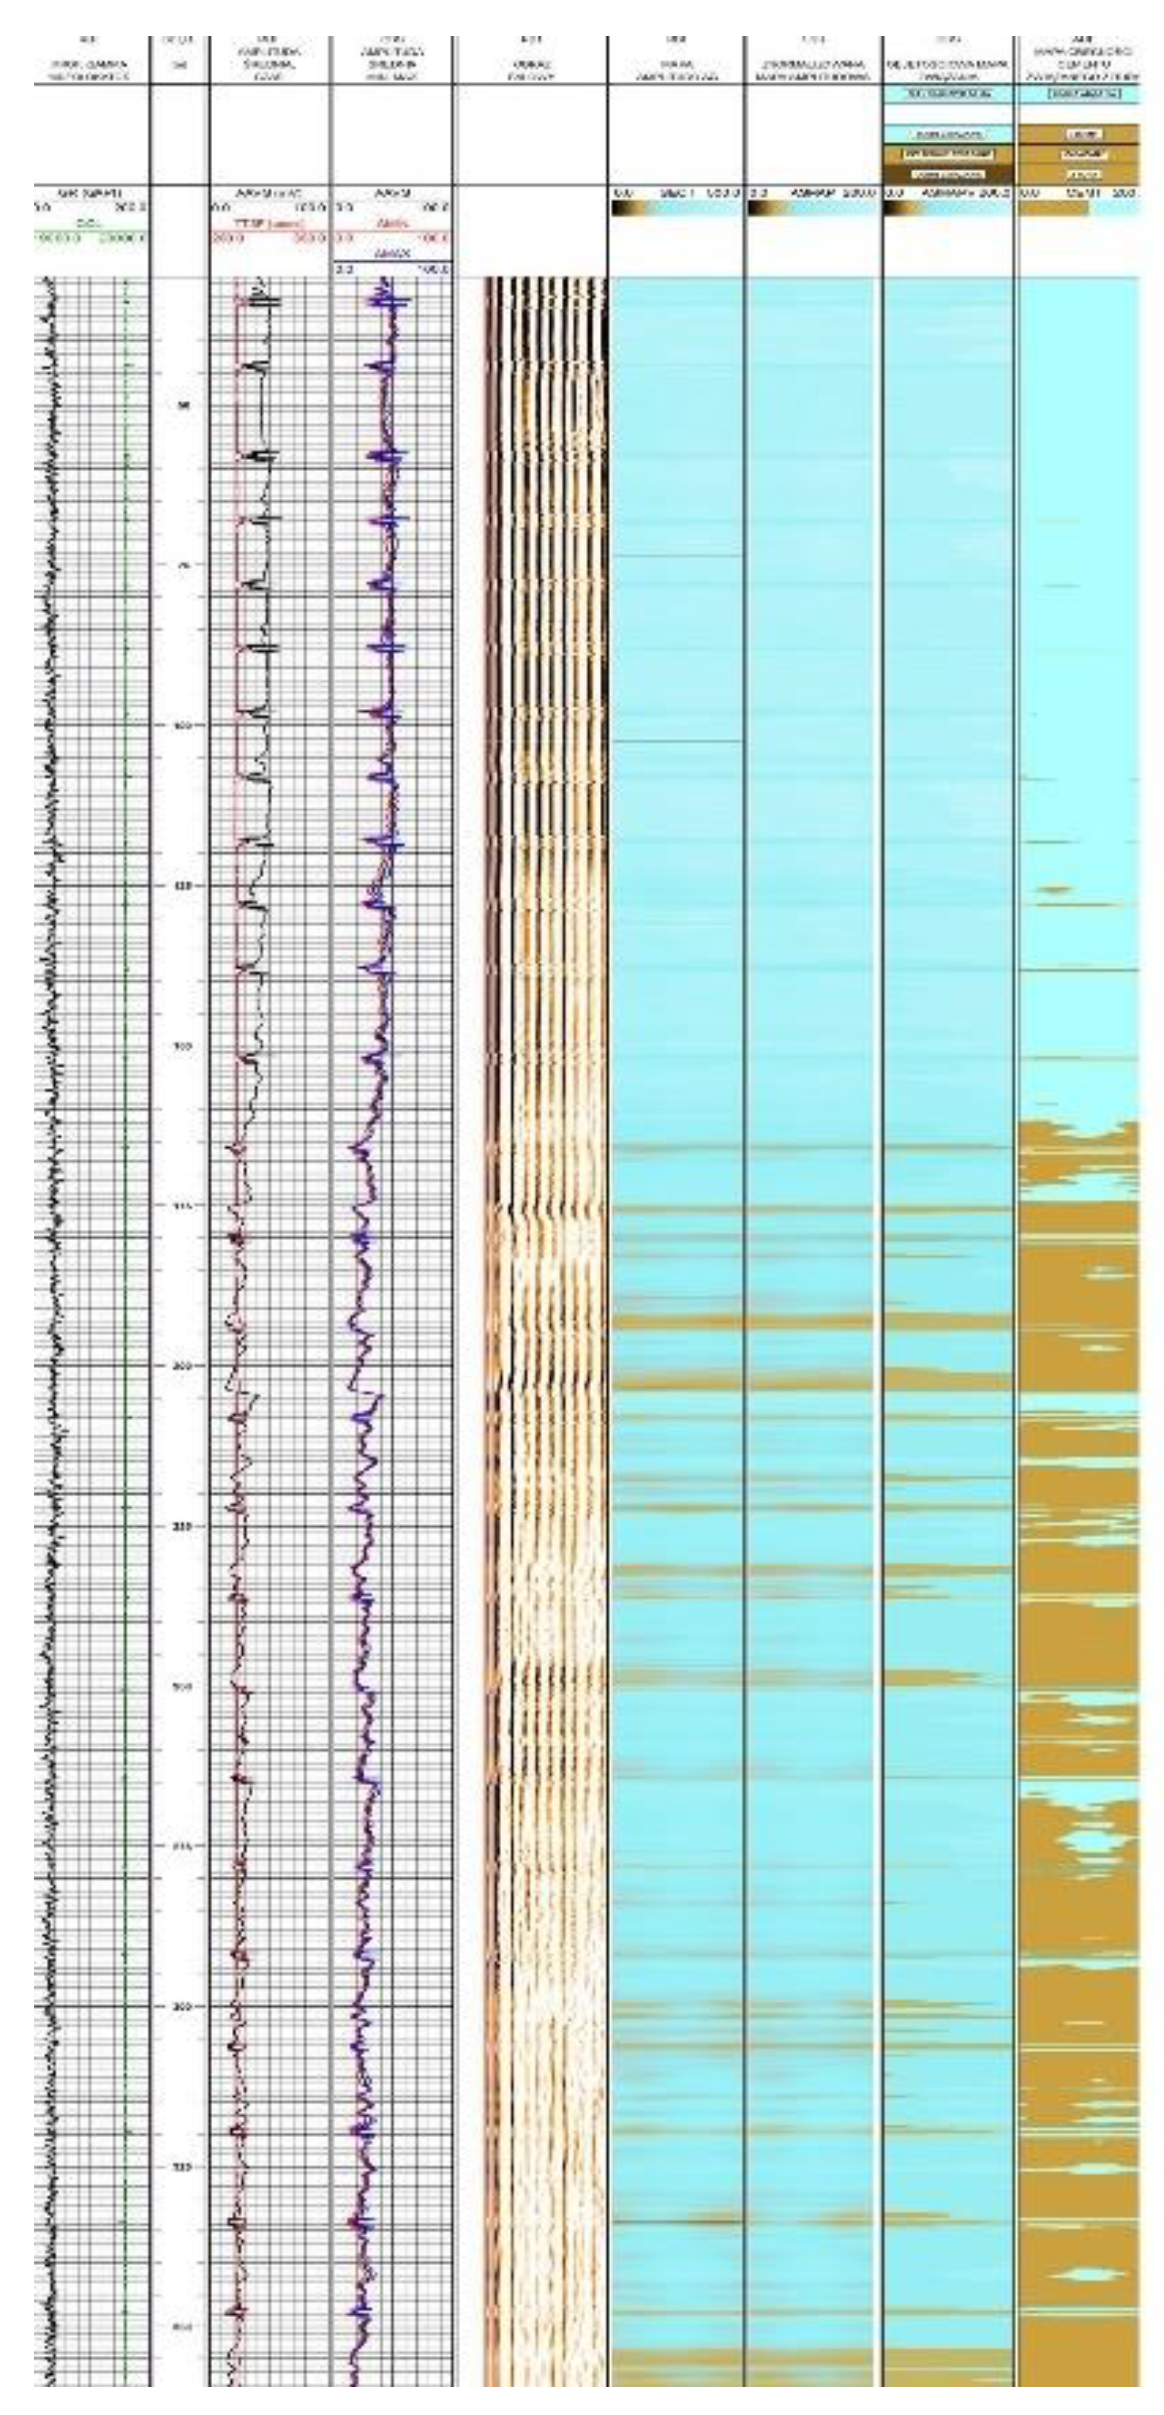
The waiting time for geophysical measurements after cement injection and bonding is nowadays reduced, and so is the time required to carry out further works after cementing. This is driven by economic aspects and striving to accelerate the completion of subsequent stages of well drilling. However, too early measurements of the cement bond logging lead to unreliable cement bond logging (CBL—an indication of the condition of the cement bond image). If this is the case, the cement sheath bonding (despite the presence of cement in the annular space) is found to be incomplete or poor (Figure 1). The measurement of the cement bond logging condition is made when the strength of the cement sheath achieves 14 MPa. However, the cement sheath made of the lightweight slurry has significantly lower compressive strength in the initial hydration period. Compressive strength of the cement sheath made from the slurries used previously, after 24 h of hydration, reaches values ranging from about 5 MPa to about 8 MPa (compressive strength values for slurries with a density of about 1500 kg/m3, deposited at a temperature of about 30 °C) [43,44,45,46,47,48]. The problem of interpretation of geophysical measurements is raised when CBL confirms the absence of cement despite its being injected up to the top. Furthermore, the microstructure of the cement sheath with low early compressive strength is damaged during the post-cementation works. This results in reduced stabilization of the upper part of the casing string columns [49,50,51,52,53,54,55]. This contributes to the occurrence of gas migration in the annular space.
Figure 1 shows the cement bond logging of the casing string columns installed in the interval from 0–350 m, where the lightweight slurry with a density of 1550 kg/m3 has been used. The cement sheath made of that slurry had a compressive strength of 4.2 MPa after 24 h and 7.6 MPa after 48 h. Analyzing the results from the records of a cement bond logging tool, poor cement bonding in the 30–160 m interval can be found. In the 160–350 m interval, however, the bonding was weak and only locally incomplete. The unbound cement locations are marked blue. Such a picture of cement bond logging gives an indication of the lack of cement in the annular space. However, the post-cementing report states that the space is cemented. However, Figure 2 shows the cement bond logging for the interval from 900 m to 1300 m, in which the slurry with a density of 1820 kg/m3 has been used. That cement sheath had a compressive strength of 9.7 MPa after 24 h and 15.6 MPa after 48 h. Figure 2 shows good and very good cement bonding (beige), according to the interpretation of geophysical measurements.
The author found that the cement bond logging depends on the strength of the cement sheath. The problem of interpretation of the cement bond logging occurs mainly when using lightweight slurries. Therefore, a new type of lightweight slurry was designed with increased mechanical strength at the initial bonding time. After application of such lightweight slurry, the measurement results are reliable and reflect the real cement bond logging.
2. Materials and Methods
2.1. Materials
CEM I 42.5R Portland cement was used to make the slurries. The cement contained 2.66% SO3 and 0.065% Cl–. Slurry conditioning agents were added. IF755 cement plasticizer was delivered by CemexPolska. It is a liquefying agent based on a polycarboxylic ether with a density of 1.07 g/cm3 ± 0.02 g/cm3 and a pH of 6.0 ± 1.0. The content of Cl– is below 0.1%, while that of Na2O does not exceed 1.5%. In order to eliminate aeration, a defoamer was used, which is a mixture of unsaturated fatty acid esters and refined hydrocarbons. The product was supplied by Polski Serwis Płynów Wiertniczych Sp. z o.o., Poland. The slurry contained also an antifiltrating agent and setting accelerator. The products were supplied by Polski Serwis Płynów Wiertniczych Sp. z o.o., Poland. To eliminate gas microflows, latex was used, which is a water dispersion of styrene butadiene copolymer and latex stabilizer, which is a mixture water dispersion unsaturated ethoxylated alcohols. The latex was supplied by Polski Serwis Płynów Wiertniczych Sp. z o.o., Poland. The inter-grain space was sealed with a 10% addition of micro-cement supplied by Halliburton Micro Matrix. This product contains grains of less than or equal to 10 m and a surface area of approximately 1400 m2/kg. Furthermore, bentonite was used to increase the viscosity of the mixing water, so that the microspheres used to reduce the slurry density did not fractionate. Bentonite was supplied by Certech, Poland.
Loose silica dust (amorphous silica) was used to improve the mechanical performance of the cement sheath made of the slurry. Specific surface area: 18,000 m2/kg [BET], average grain size: approximately 0.15 μm. The silica dust was supplied by HutaŁaziska, Poland. Sodium hydroxide supplied by PCC Polska was added to the slurry recipe. An admixture of IKC 45, increasing concrete strength, supplied by CemexPolska, was also used. That product was formulated based on calcium nitrate. It is a colorless liquid with a pH of 5.5 ± 1.0 and a density of 1.43 g/cm3 ± 0.03 g/cm3. The content of Cl– is below 0.1%, while that of Na2O does not exceed 1%. The percentage of additives is summarized in (Table 1).
2.2. Slurry Preparation
Three recipes were prepared to develop the lightweight slurry with high early strength of the cement sheath being formed. The first slurry is the test sample. Samples no. 2 and 3 are lightweight slurries with the addition of microspheres. Compositions no. 2 and 3 were modified to obtain higher mechanical strength values. When preparing the slurry, a certain amount of water is proportioned using a measuring cylinder. The water is poured into the mixer. The mixing speed is then set to 1600 rpm. Bentonite is added to the mixing water and mixed for 30 min. Then, the conditioning agents are added to the slurry and mixed again for 10 min. After that time, loose additives (microcement, microspheres, microsilica, cement) are poured into the mixture with water and mixed for another 20 min. Mixing at low speeds corresponds to preparation of the slurry in well conditions.
The slurry recipe designated with no. 1 in Table 1 was prepared first. The water–cement ratio of the slurry was 0.85, and the amounts of agents are listed in Table 1. Modifications were made to the following recipes which contributed to the increased mechanical strength of the resulting cement sheath.
2.3. Experimental Procedures
The technological properties of fresh and solidified slurries were tested in accordance with the following standards:
- PN–EN ISO 10426-2. Petroleum and natural gas industries. Cements and materials for well cementing. Part 2: Testing of well cements. The tests include the following measurements: slurry density, filtration, and thickening time.
- PN–EN 196-1: 2006 Methods of testing cement. Determination of Strength. Compressive strength was tested according to this standard.
Slurries were prepared at ambient temperature. The increase in compressive strength and thickening time was studied in conditions similar to those prevailing in the wells: temperature 45 °C, pressure 10 MPa.
2.3.1. Slurry Density
Density was tested using a Baroid mud balance. The balance consists of an arm with a dish for the slurry on one end, and a calibrated counterweight on the other. The balance arm is provided with a sliding weight and is scaled in the range of 0.8–2.75 g/cm3. The weight is read from the position of the sliding weight when the balance is levelled by appropriate positioning of a level on the balance arm [56].
2.3.2. Slurry Filtration
The filtration test was performed in conditions similar to those present in the wells, namely at high temperature and high pressure. The measurement was carried out using a dynamic filter press. The device allows for testing in well-like conditions at temperatures up to 232 °C and pressures up to 14 MPa [56].
2.3.3. Rheological Properties
The rheological properties were tested based on the determination of shear curves in the velocity range from 1.7 s−1 to 1022 s−1. The test was carried out at a temperature of 20 °C ± 2 °C. For testing the rheological properties, an OFITE viscometer model 900 with coaxial cylinders was used. To determine the rheological model of cement slurries, the Rheosolution 3.02 software was used, which is the property of the AGH University of Science and Technology Faculty of Drilling, Oil and Gas [57,58,59,60,61].
2.3.4. Thickening Time
The slurry thickening time was determined using a pressure consistometer. The device enables recording the progress of thickening (maturing) of cement slurry and determining the beginning of the thickening time (30 Bc (Bearden unit) value—conventional value when determining the cement slurry thickening time) and at its end, with a value of 100 Bc [56].
2.3.5. Non-Destructive Compressive Strength Test
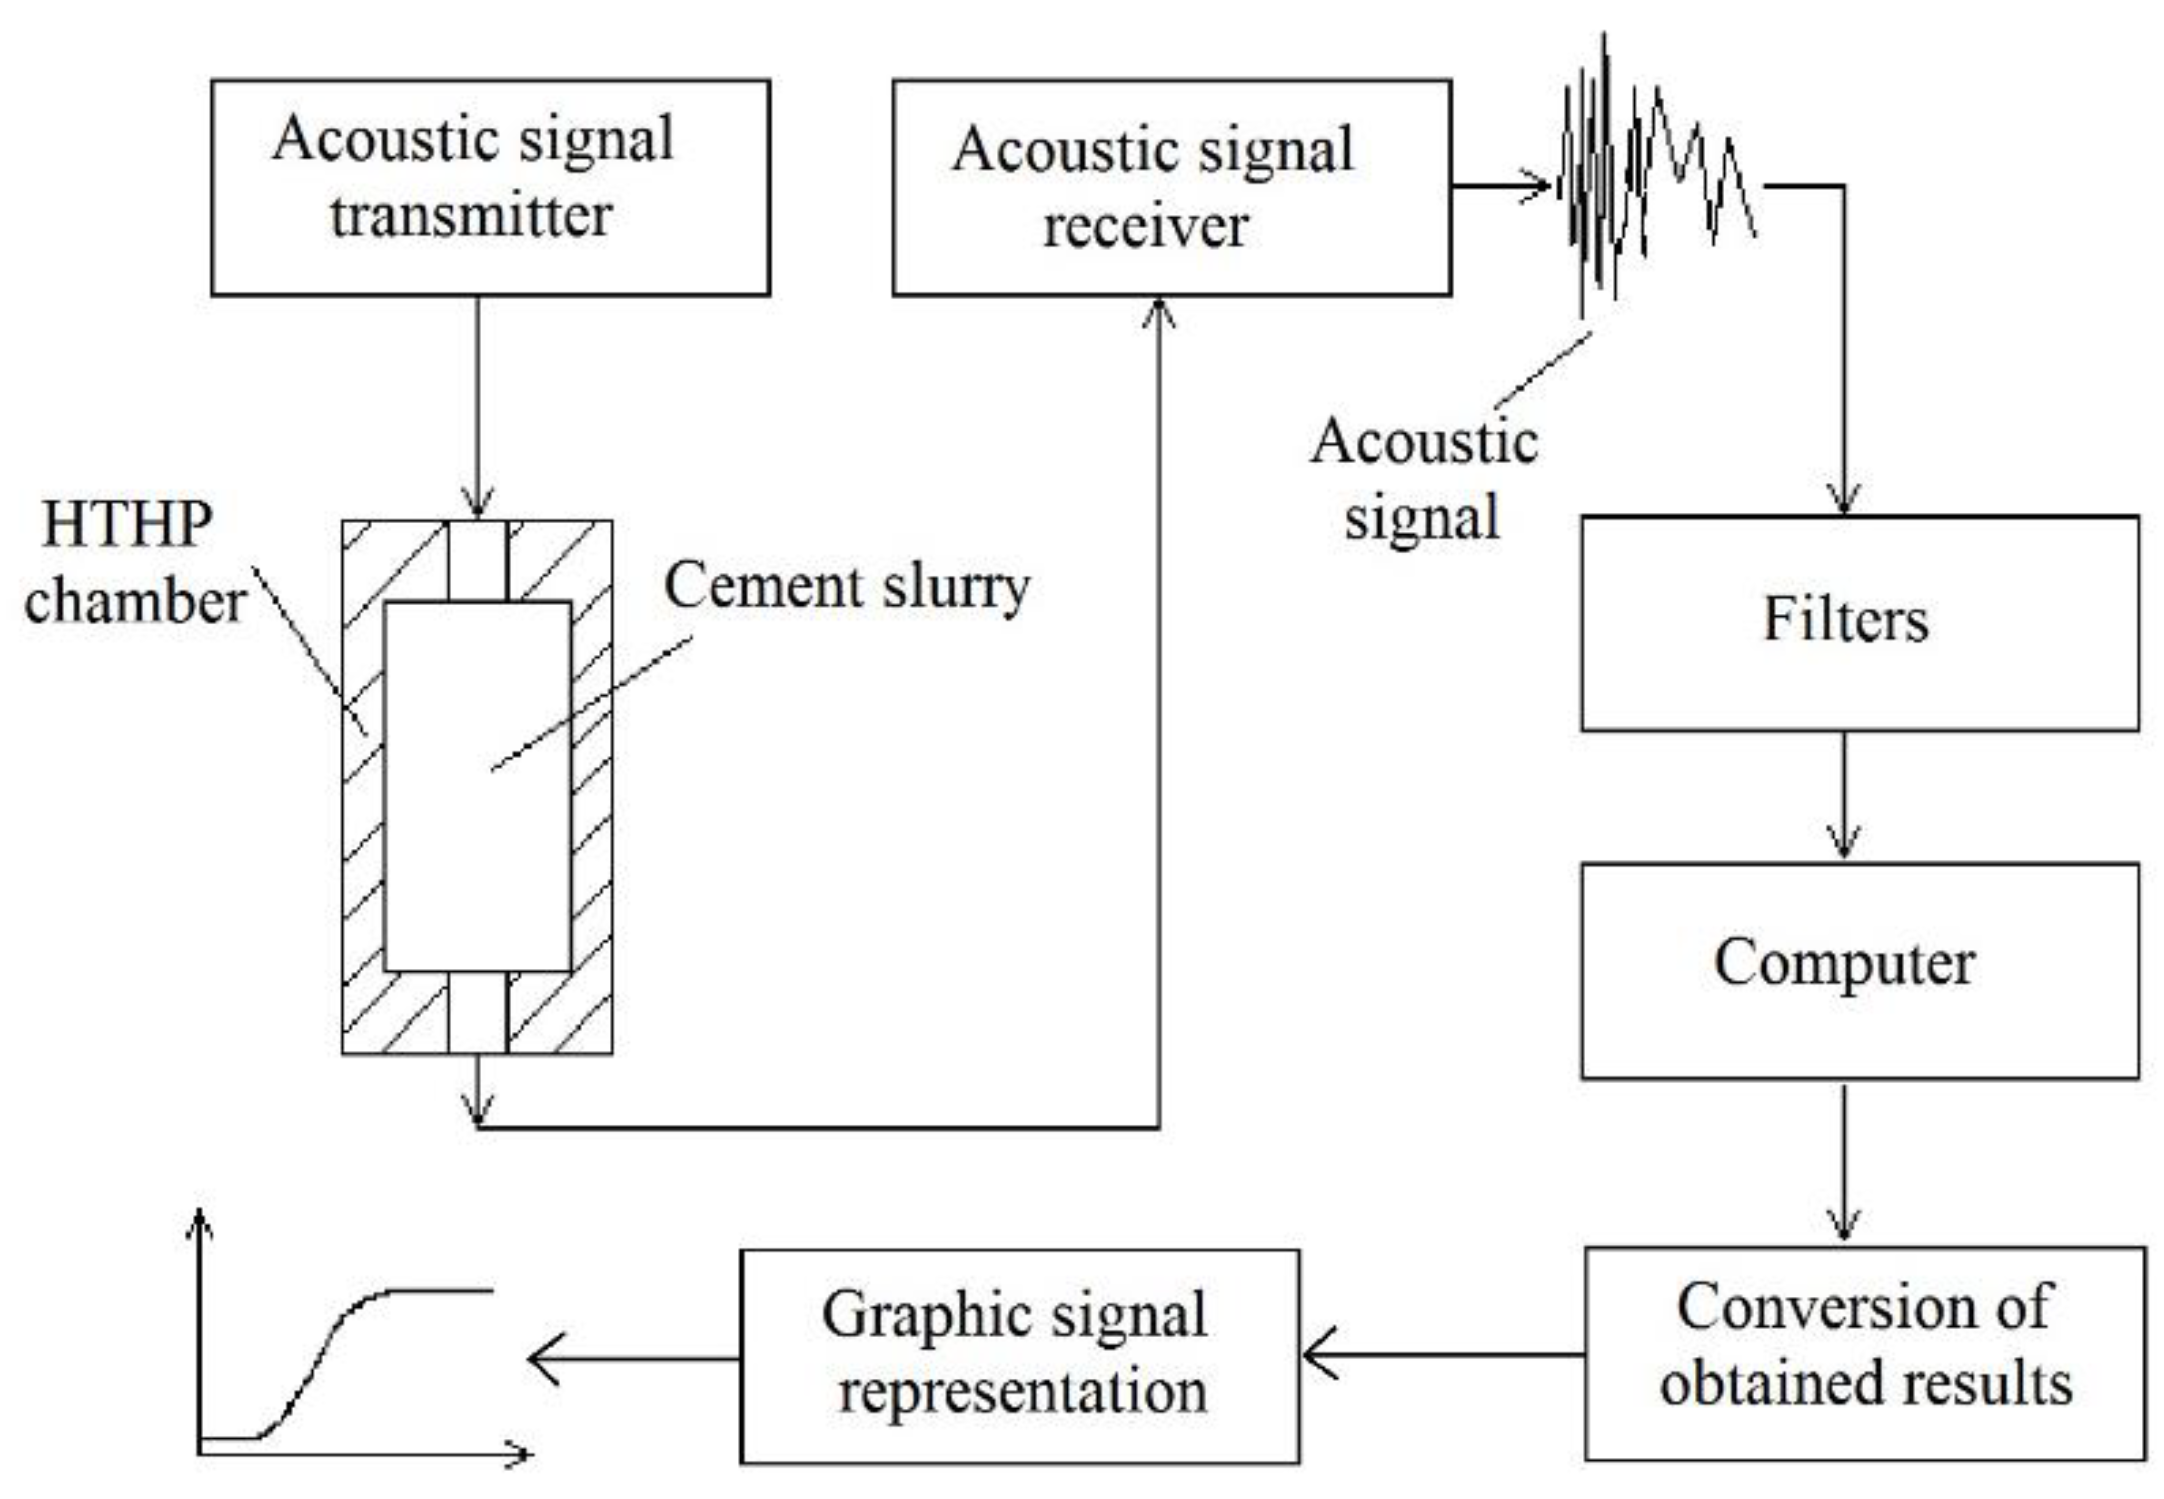
The non-destructive testing of the increase in compressive strength of cement slurries was carried out using a model 120–51 Twin Cell UCA (ultrasonic cement analyzer). During the measurement, the ultrasonic wave passes from the transmitter to the receiver. The cement slurry, which is being bound in HTHP conditions, is placed between the transmitter and receiver. A correlation exists between the ultrasonic wave passage time and the increasing compressive strength. The instruments measure the compressive strength while the cement slurry is being bound in conditions similar to those of a well [62]. The diagram of the device is shown in Figure 3.
3. Results and Discussion
3.1. Slurry Density
The research focused on lightweight slurries, since it is in these slurries that the greatest issue is the low mechanical strength of the stone. Such cement slurries are described in the literature [63]. As shown in Table 2, the slurries have a density in a range from 1.54 g/cm3 (slurry no. 2) to 1.58 g/cm3 (slurry no. 1). The base slurry no. 1 has the highest density but contains the greatest amount of mixing water (water/cement = 0.85). As shown in Table 1, the following slurries contain 15% addition of aluminosilicate microspheres and smaller amounts of water. The result of reducing the water content is an increase of the slurry rheological parameters. Therefore, slurries 2 and 3 contain more liquifying agent. This effect makes the density of slurries no. 2 and 3 comparable to the slurry no. 1. In standard slurries, the introduction of aluminosilicate microspheres reduces the mechanical strength of cement stone being formed due to the increasing porosity [2,14]. For example, in [63], slurry no. 12 has a compressive strength of only 2.9 MPa after 48 h. Therefore, slurry no. 2 contains 15% of microcement which provides extra sealing to the cement matrix and the water/cement (w/c) ratio is reduced to 0.6. Slurry no. 3, however, contains no microcement but less water; w/c = 0.55 (Table 1).
The thickening time (consistency change) was tested in HTHP consistometer (temperature 40 °C and pressure 10 MPa), dynamic conditions, time to reach temperature and pressure 20 min).
3.2. Slurry Filtration
The filtration tests were performed at 40 °C under dynamic conditions. The slurry filtration tests were carried out for 30 min. As shown in Table 2, the base slurry no. 1 has the greatest filtration of 733 cm3. Such a high filtration value is the result of the highest w/c ratio, which is 0.85 for that slurry. Slurry no. 2 has a filtration rate of 85 cm3. In that slurry, the filtration rate is lower due to the presence of 15% microcement and a lower water–cement ratio (0.6) (Table 1). In slurry no. 3, the filtration is 174 cm3, and it has the lowest water–cement ratio. The lack of microcement in said recipe results in an increase of the filtration value compared to slurry no. 2.
3.3. Rheological Properties
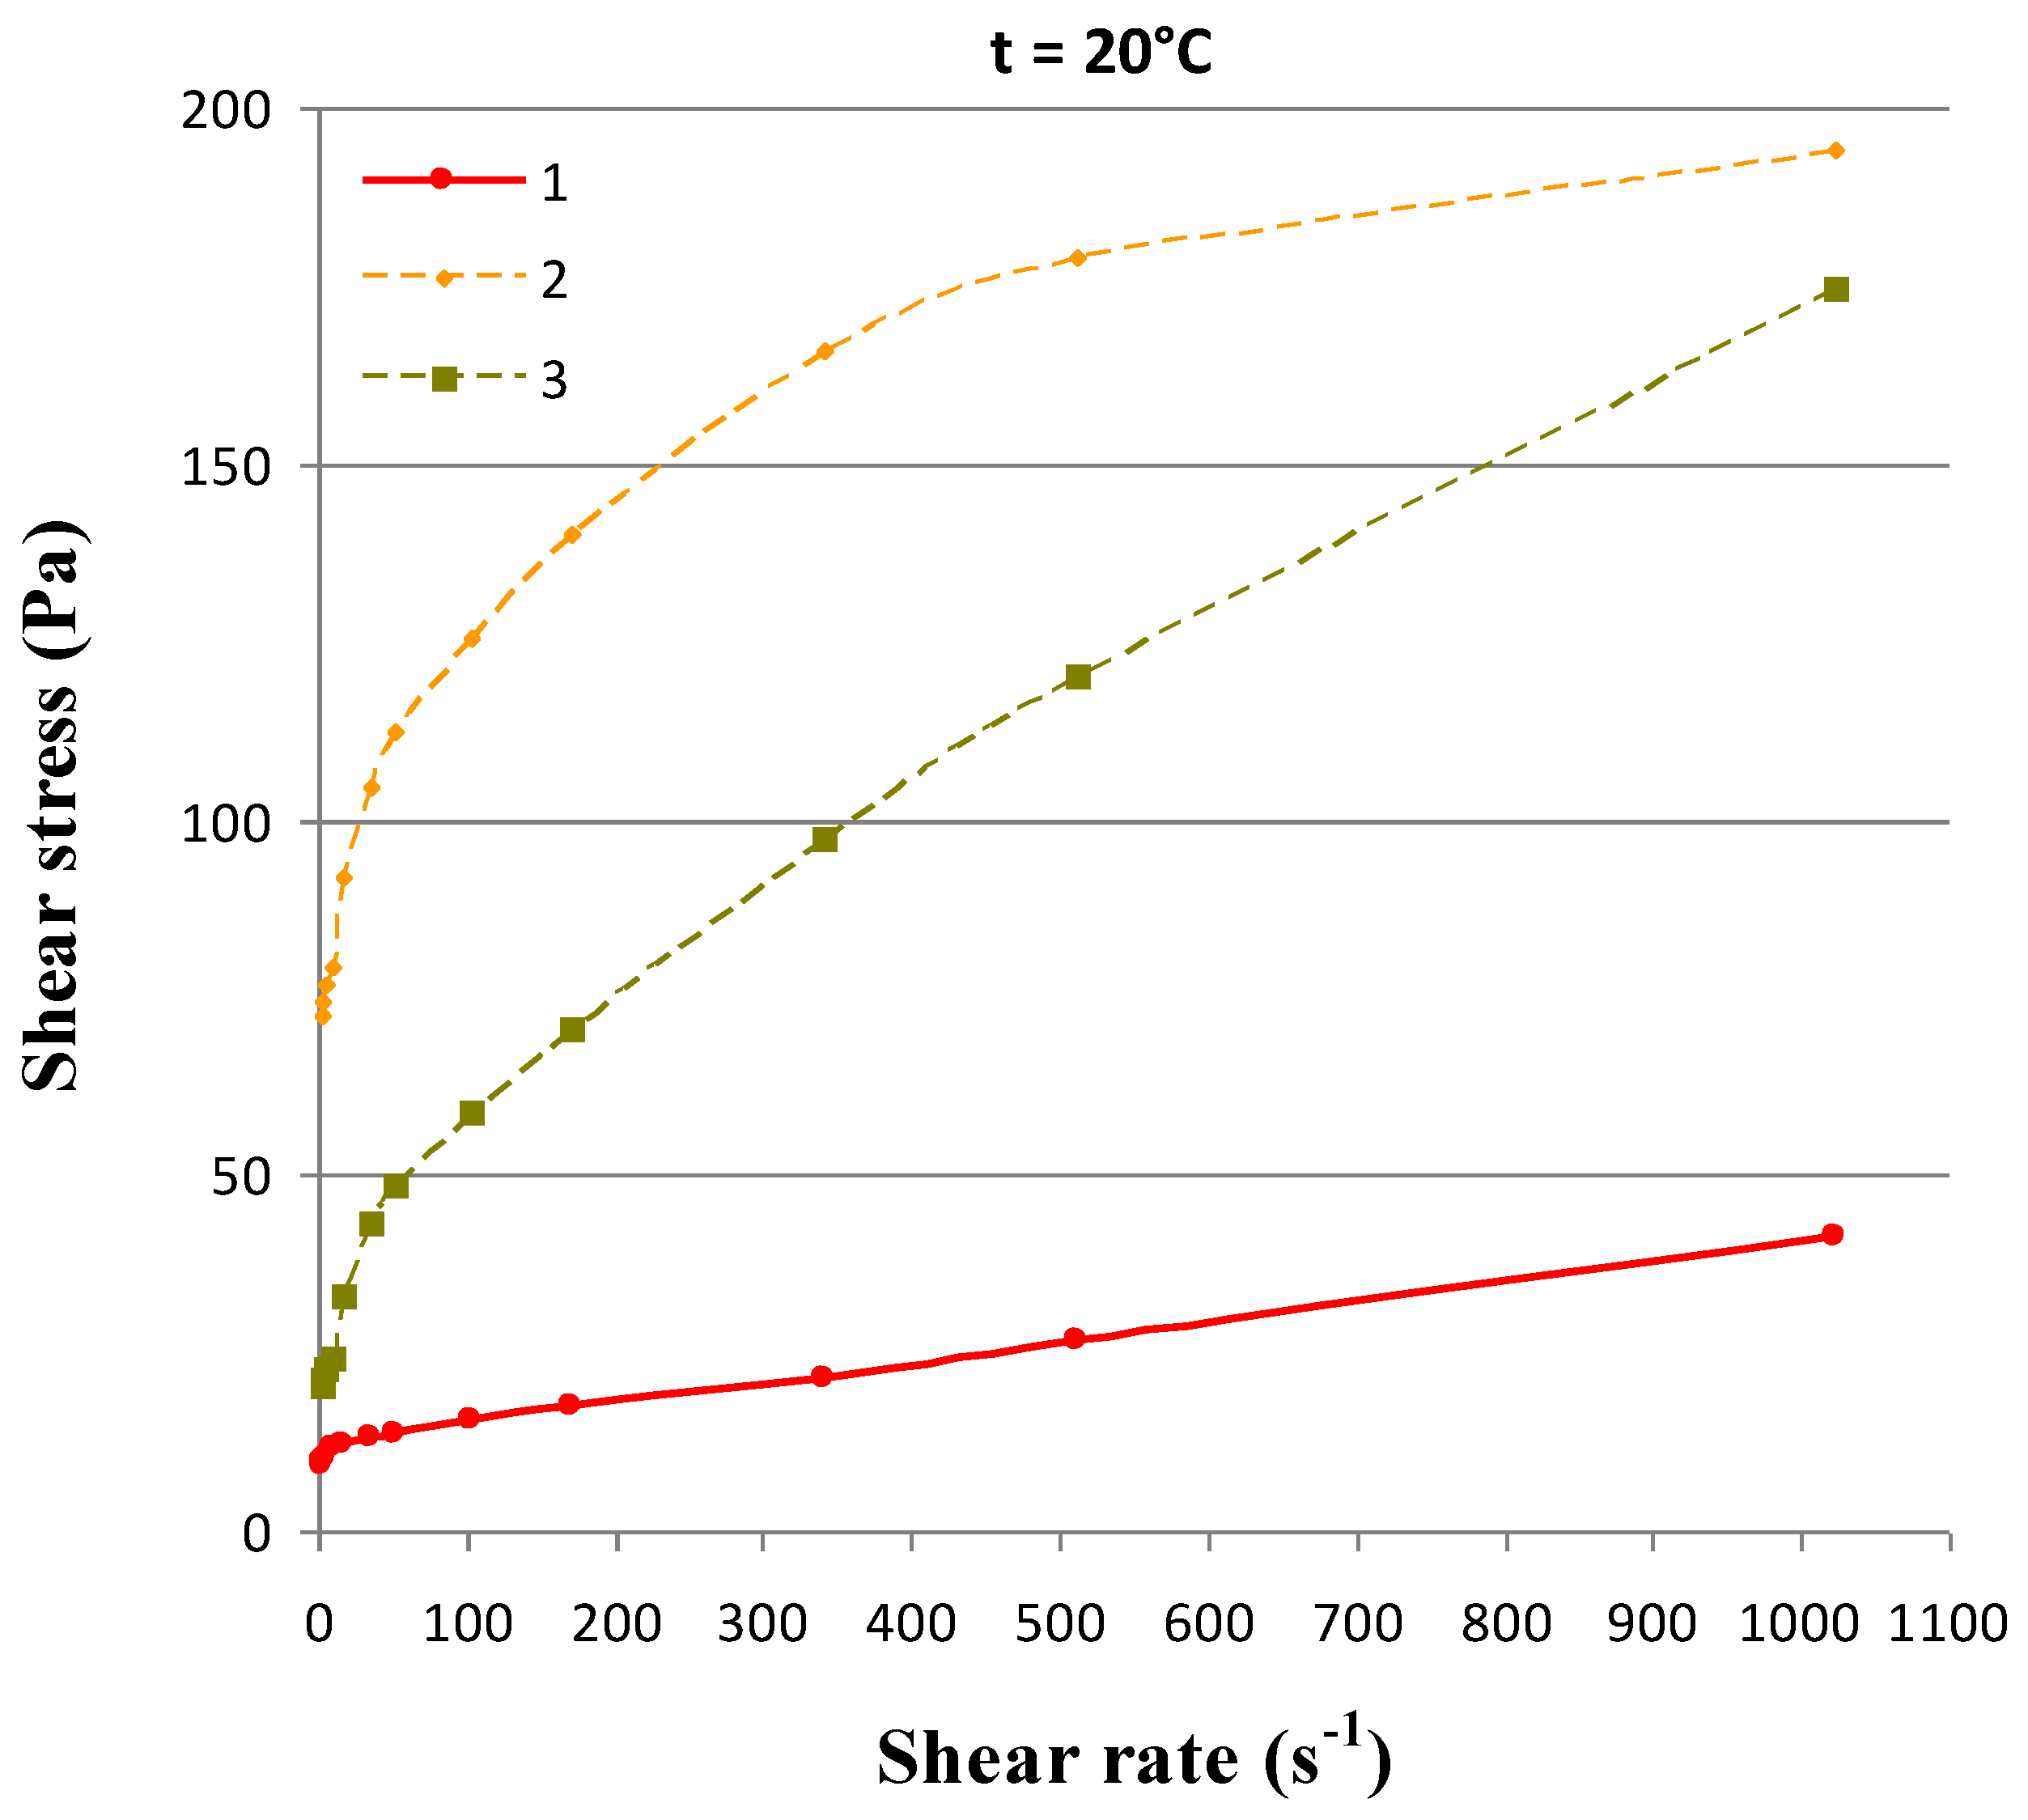
In order to determine the rheological properties of the slurry, a measurement was made as for the greatest shear rate range (up to 1022 s−1). Based on the results obtained, the rheological parameters corresponding to a specific rheological model were calculated. Furthermore, the slurry flow curve was drawn (Figure 4). As shown in Table 3, the slurries tested can be classified as non-Newtonian fluids and are described by the Casson and Herschel–Bulkley models. Base slurry no. 1 has a flow limit of Css 8.77 Pa. The HB consistency coefficient of that slurry is 0.086 Pa·sn, and the apparent viscosity amounted to 40.50 mPa·s. As shown in Figure 4, the flow curve for that slurry has the lowest rise profile. Correspondingly low values of the rheological parameters analyzed are caused by the large amount of water in the slurry (Table 1). The addition of microspheres and microcement to slurry no. 2 (Table 1) and a reduction of the w/c ratio leads to an increase in rheological parameters despite the content of 0.7% dispersant. Figure 4 shows the highest flow curve for slurry no. 2. The presence of loose fractions in slurry no. 2 causes an 8-fold increase in the Css flow limit compared to the base slurry [45]. The HB consistency coefficient of that slurry was 29.9 Pa·sn, while its apparent viscosity amounts to 190 mPa·s (Table 3). To slurry no. 3, without the microcement, the strengthening agent and NaOH were added. Such a modification leads to decreased values of the rheological parameters compared to slurry no. 2. This is confirmed by the lower flow curve of slurry no. 2 compared to that of the slurry no. 3, as shown in Figure 4. As can be seen in Table 3, the flow limit Css of slurry no. 3 was 19.80 Pa, and the consistency factor HB was 2.86 Pa·sn. The apparent viscosity of that slurry was 170 mPa·s. Increased values of rheological parameters are favorable in the lightweight slurry as the microspheres do not fractionate. However, it is necessary to use higher injection pressures during the cementing procedure.
3.4. Thickening Time
The slurry thickening time test is carried out with an HTHP consistometer. The measurements were made at a temperature of 40 °C and a pressure of 10 MPa. The time to reach the indicated test temperature and pressure is 20 min. It is the time required to inject the slurry during cementing. The test was carried out in dynamic conditions and the slurry was in constant motion, which corresponds to its being injected into the well [14,16]. According to the data in Table 2, the base slurry begins to thicken (30 Bc) after 5:55 h and the thickening ends at (100 Bc) 7:10 h. As can be seen in Table 2, the second slurry takes longer to thicken than the base slurry, despite having a 15% microcement content in its composition. The value of 30 Bc was obtained 35 min later than of the test sample no. 1, and the value of 100 Bc was recorded 10 min later than in the slurry no. 1. The longer thickening time was caused by the presence of 0.7% liquefier. Slurry no. 3, in which a calcium nitrate-based agent and NaOH were used, had the shortest thickening time. The thickening time reduction is due to the presence of NaOH and Ca(NO3)2.
3.5. Compressive Strength (Ultrasonic Cement Analyzer—UCA)
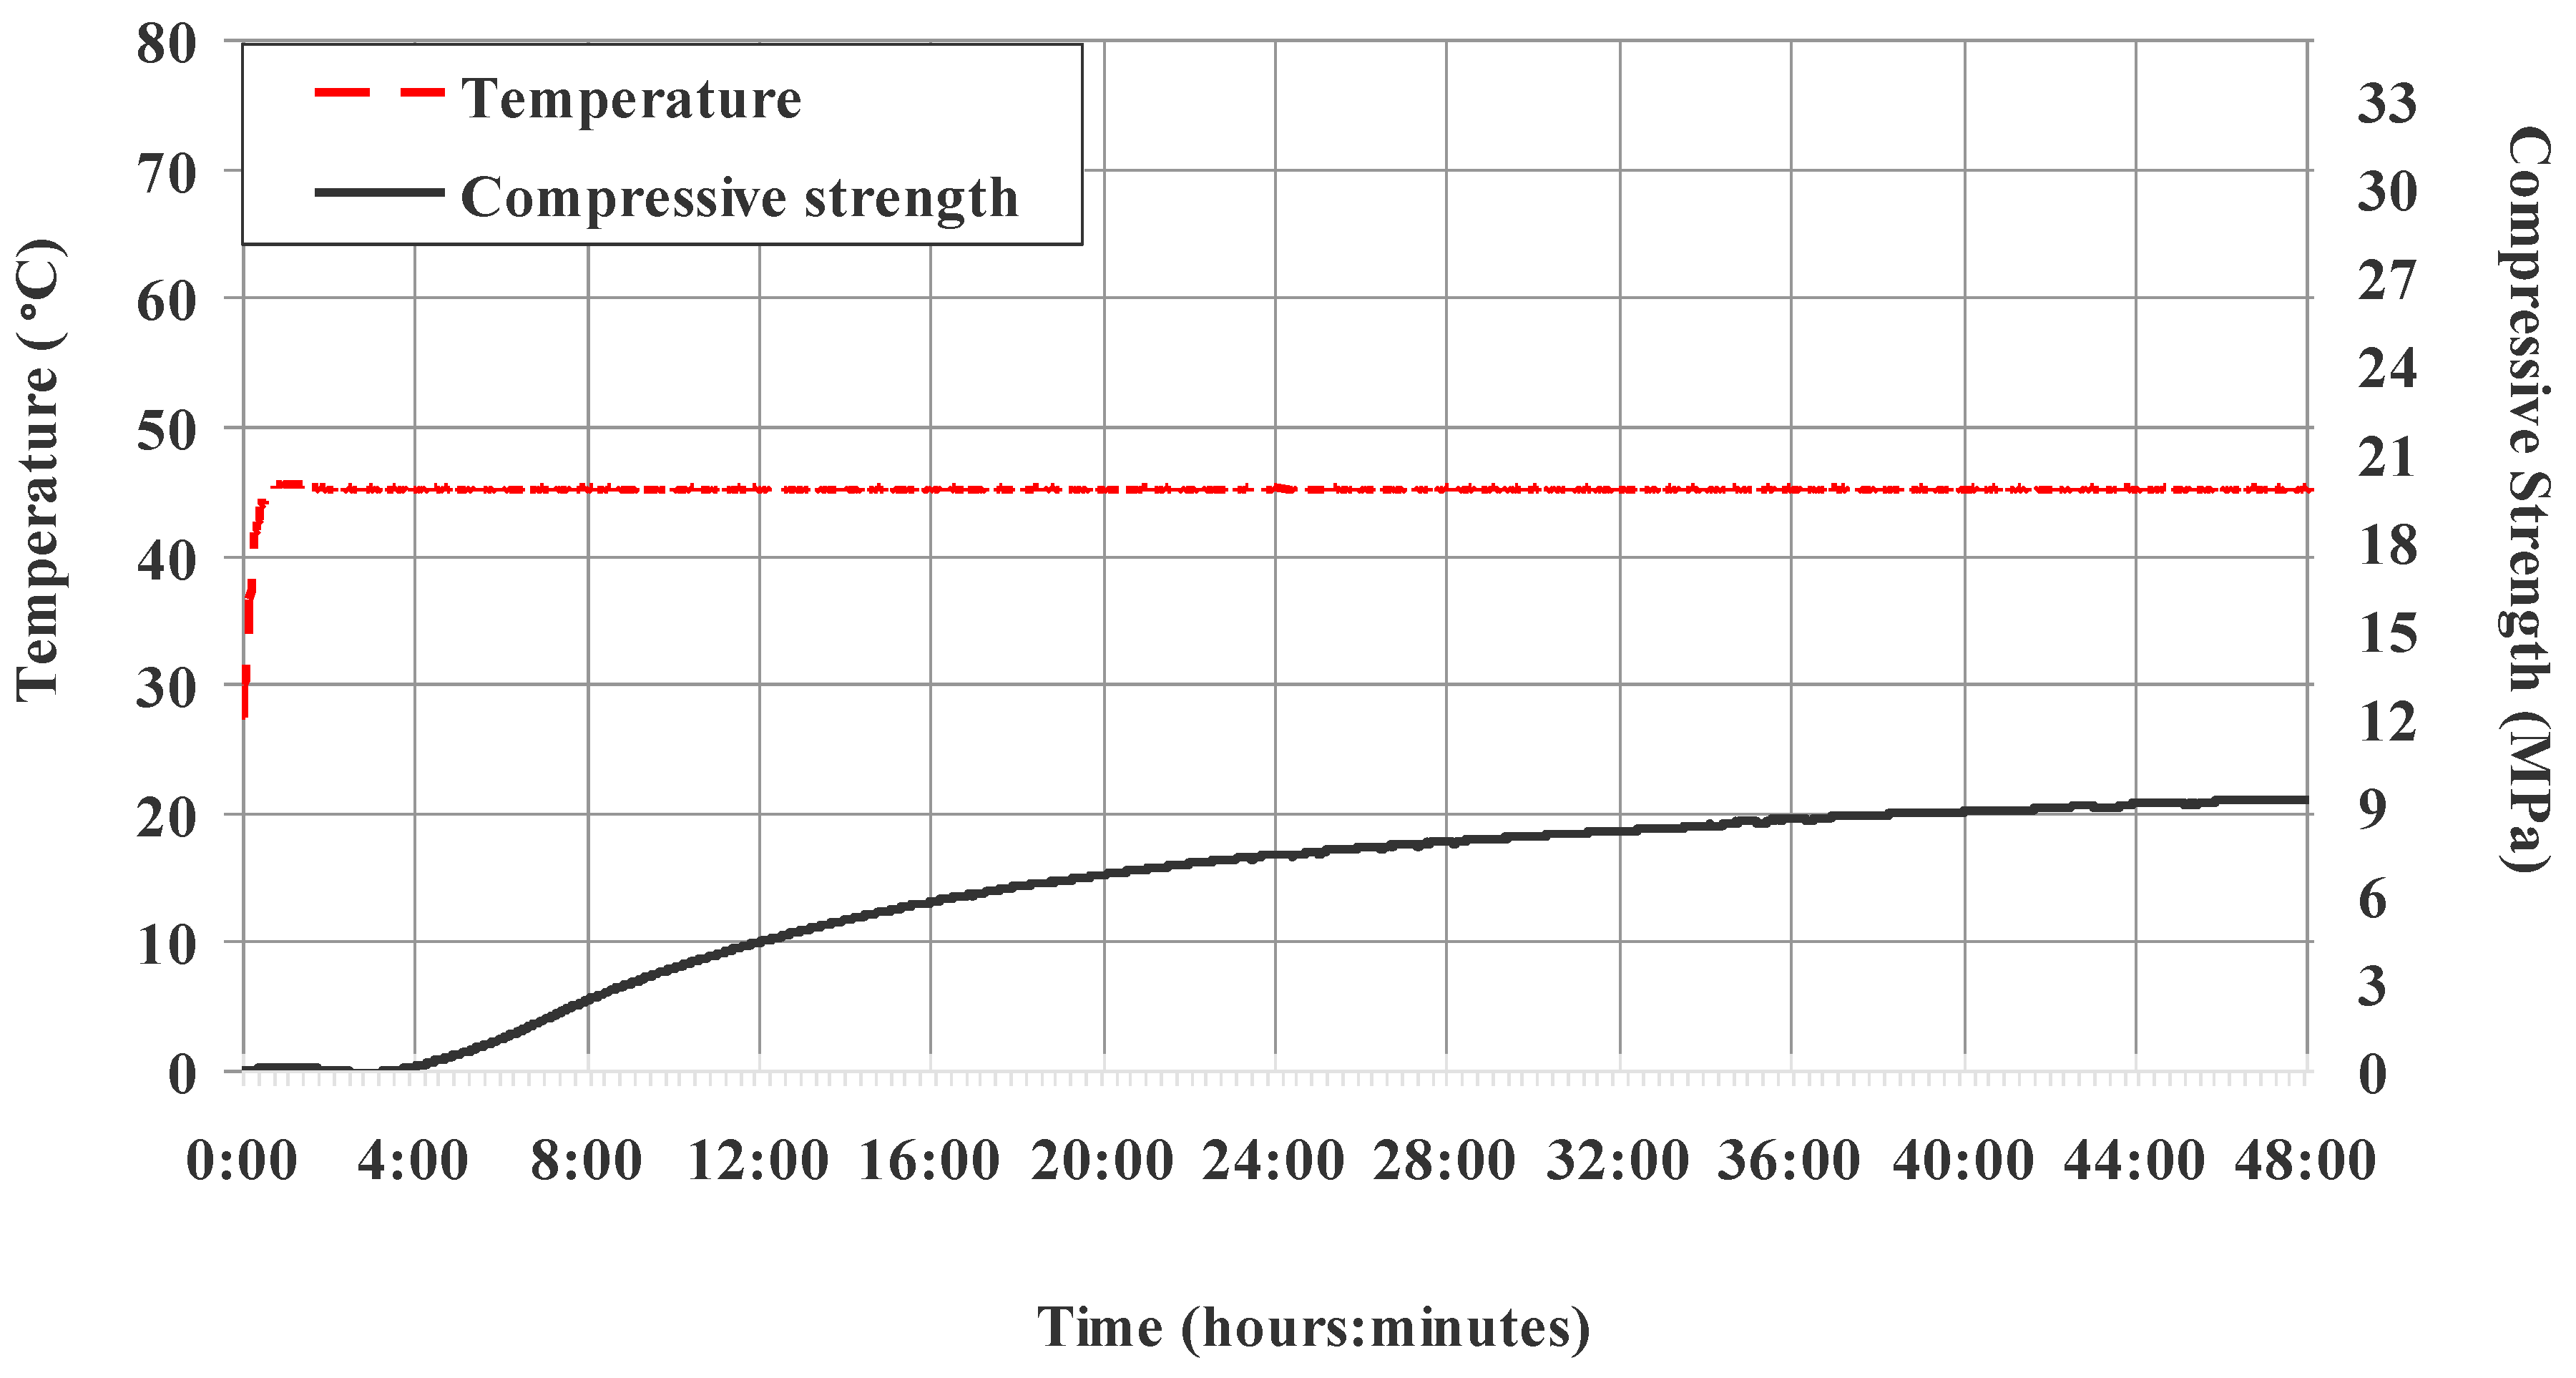
As opposed to tests with a consistometer, UCA tests are conducted in static conditions. At this stage, the slurry was not mixed, which corresponds to building up mechanical strength after being placed in the well. The slurry was placed in an autoclave chamber and heated to 40 °C for 20 min. At the same time (20 min), the pressure in the autoclave increased to 10 MPa. As the cement slurry set, the damping force of acoustic wave that passes through the binding cement was measured. Based on that, the development of mechanical strength during the slurry hydration was determined. The UCA was also used to establish the time after which the cement sheath reaches the strength of 3.5 MPa. It is the minimum value at which drilling can be continued in the well [45]. In the UCA test, the early strength increases faster than the consistency measured with a pressure consistometer. This is due to the fact that the slurry tested with the UCA was in static condition.
Table 2 demonstrates that the base slurry, which contains no microspheres, has the lowest compressive strength. After 6 h, a strength of 1.04 MPa was obtained, which increased to 9.18 MPa after 48 h, as shown in Figure 5. The time to reach the strength of 3.5 MPa was 10:04 h.
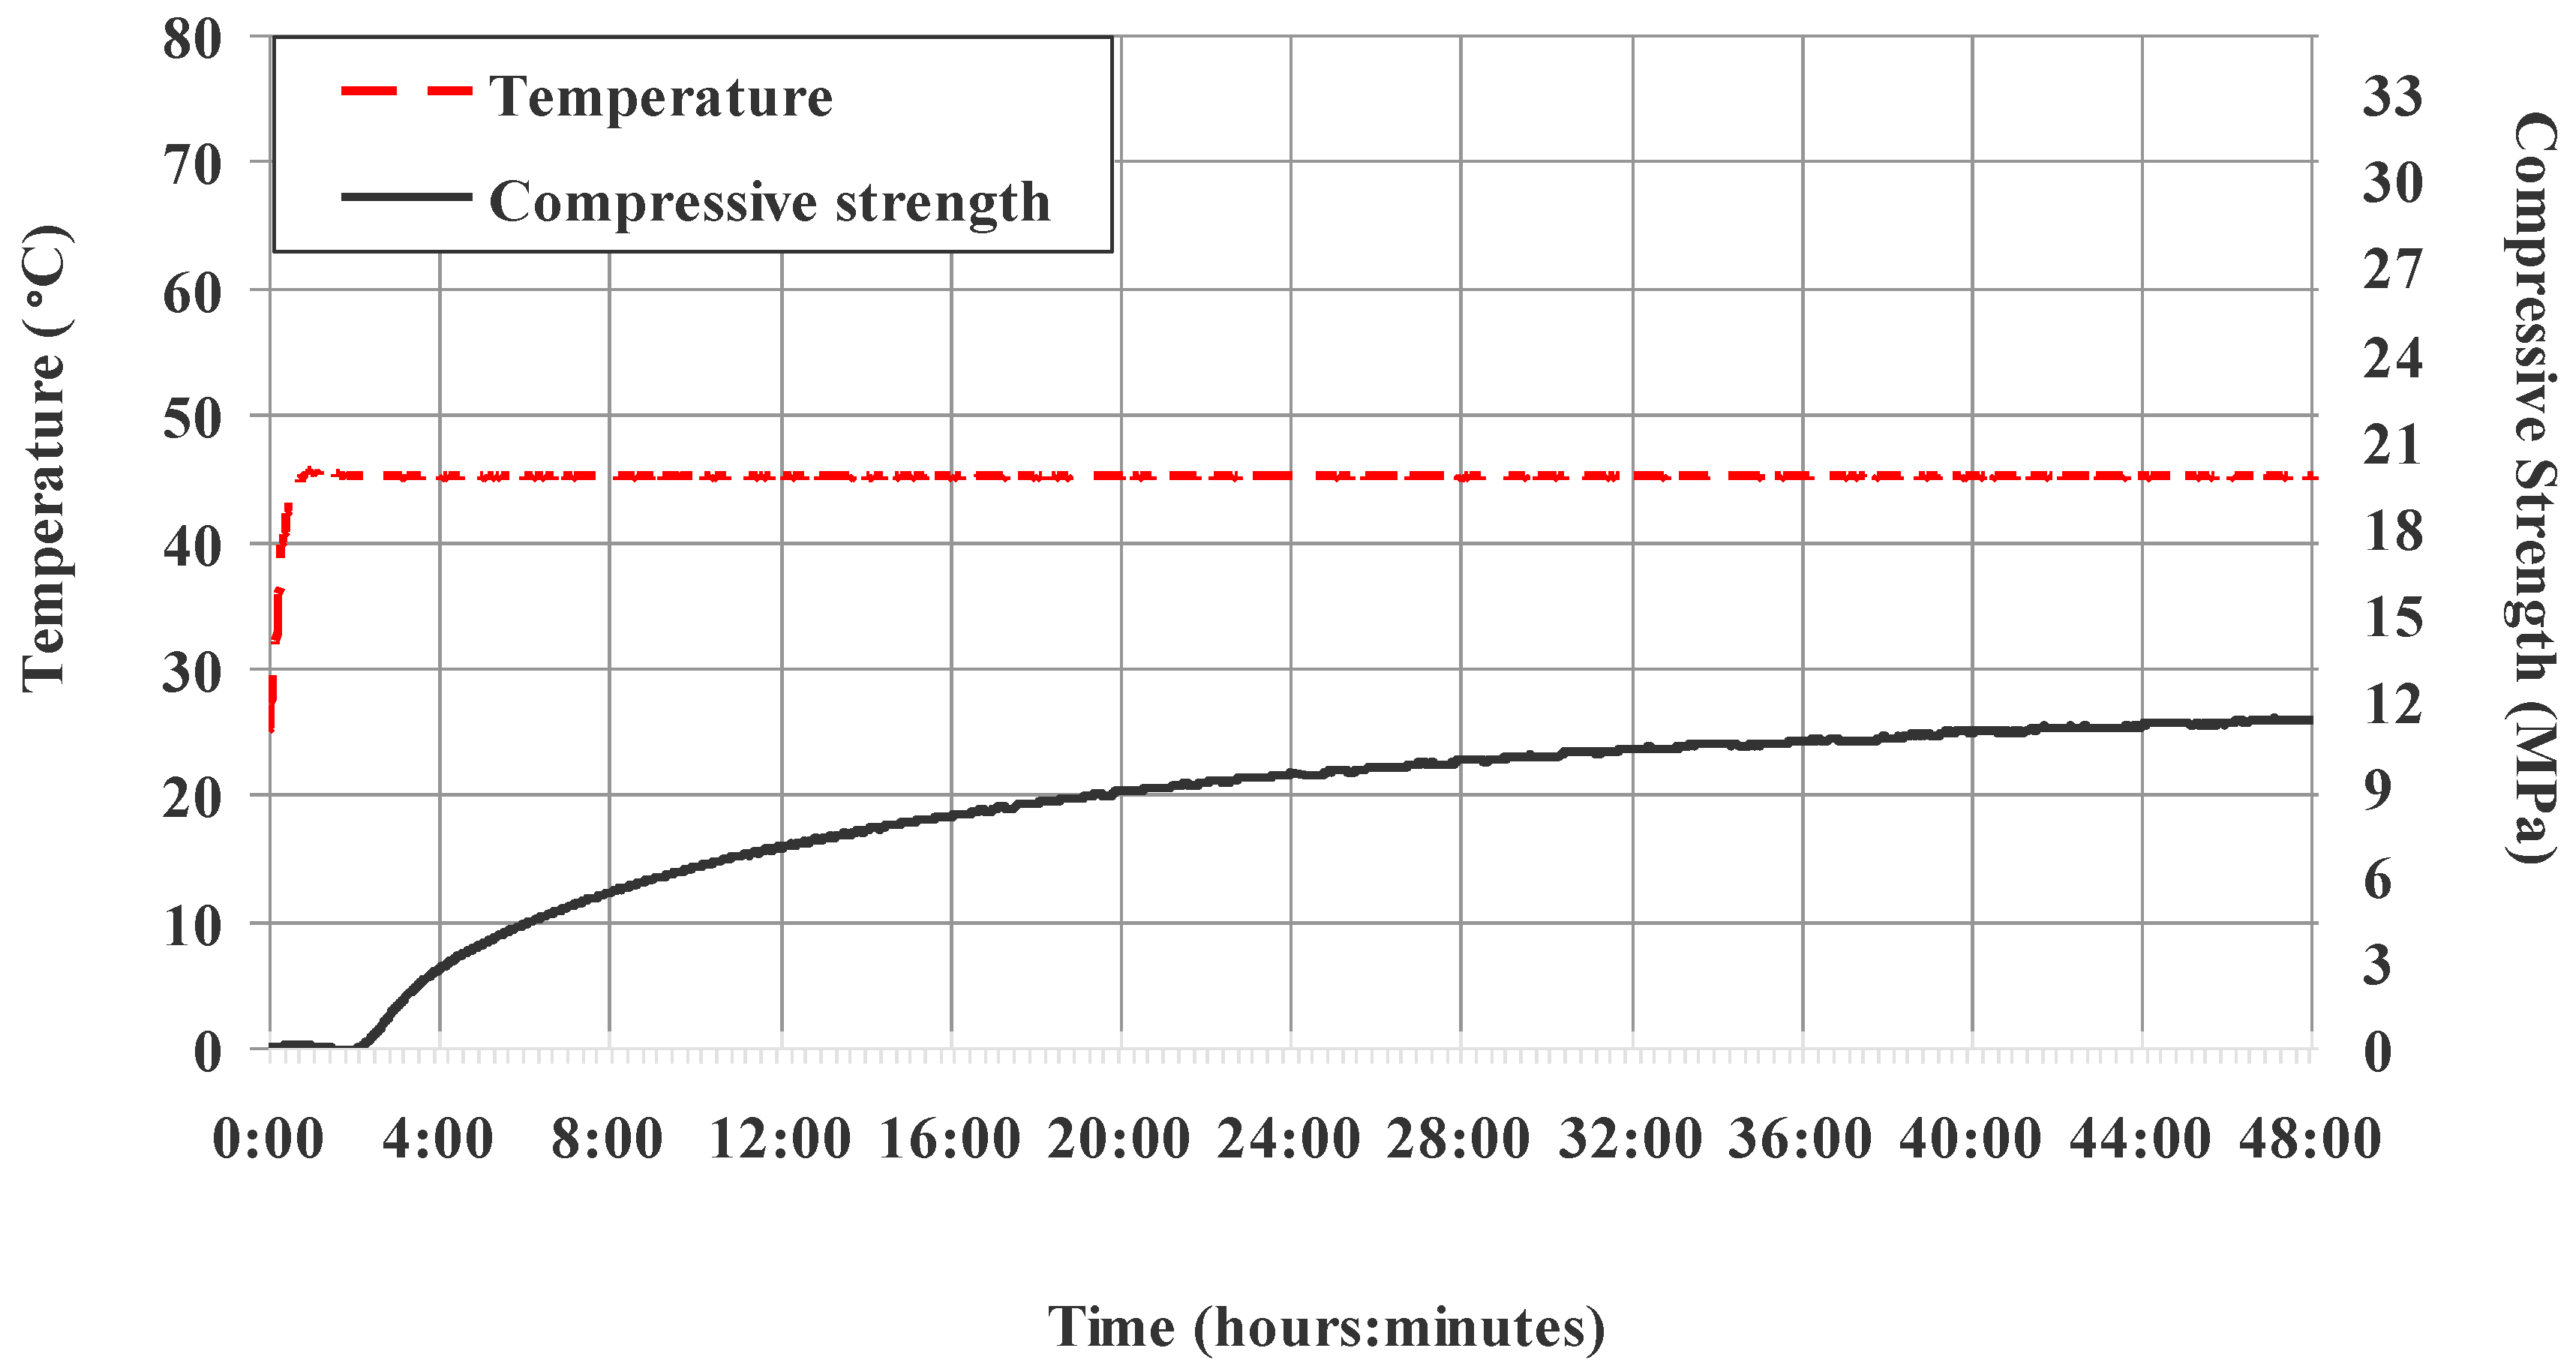
The following slurry no. 2 contains 15% microspheres which usually reduce mechanical strength. To improve the strength of that slurry, 15% microsilica was used and the amount of water was reduced. 0.7% dispersant was added to increase pumpability of the slurry. Table 2 demonstrates that after 4:54 h, the solidified slurry had a strength of 3.5 MPa. Sample no. 2 had a higher compressive strength than the test sample no. 1. After 6 h, the strength was 6.24 MPa, and then it increased to 11.32 MPa after 48 h, as shown in Figure 6.
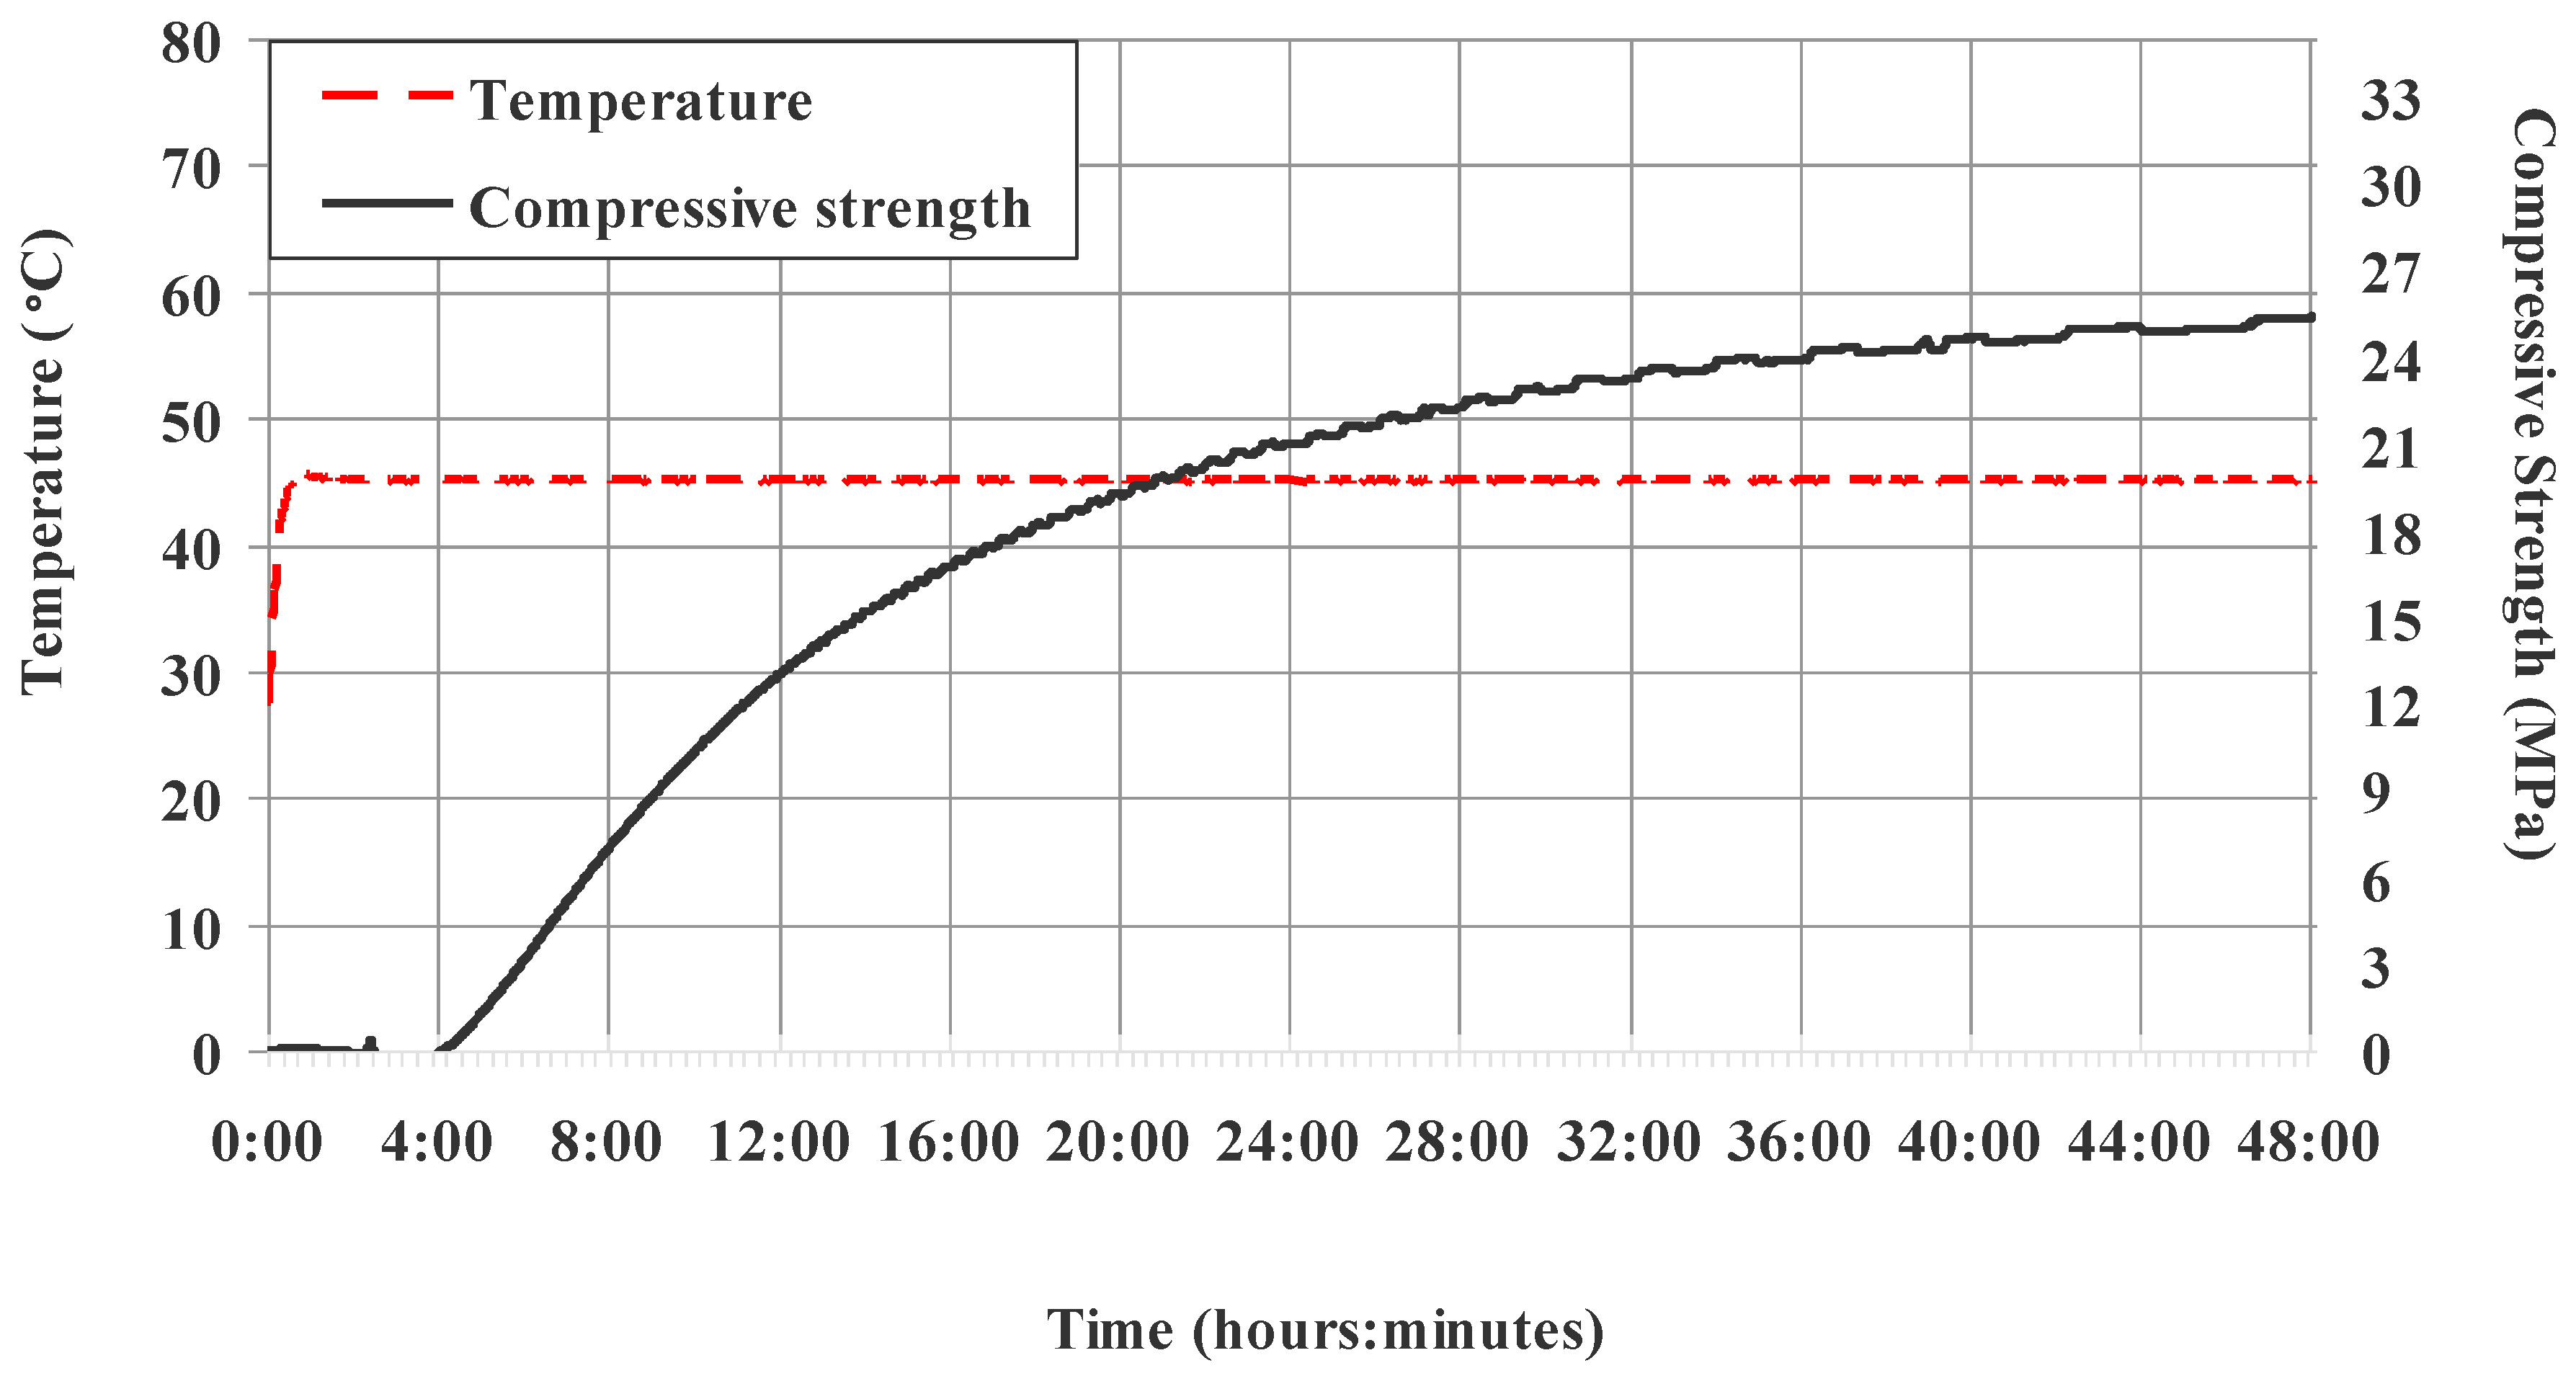
However, slurry no. 3 had the highest strength values. It is also a lightweight slurry, but without the addition of microsilica. The presence of 1.5% Ca(NO3)2 and 1.5% NaOH caused a considerable increase in strength after 12 h of hydration. As shown in Table 2, after 6:13 h, the slurry had a strength of 3.5 MPa, and 13.04 MPa after 12 h. It is a higher value than that for slurry no. 2 after 48 h. As shown in Figure 7, in the following hours, the strength of slurry no. 3 continued to increase. After 48 h of hydration, it had a strength of 25.36 MPa. The mixture of sodium hydroxide and a calcium nitrate-based agent caused a very significant increase in the mechanical strength at the initial hydration time. This is due to the shortening of hydration time, which is proven by the shortest thickening time (Table 2). Slurry 3 demonstrates application properties. The recipe no. 3 is simple and has very good mechanical performance. That slurry constitutes a valuable solution for use in industrial conditions and is suitable for sealing loose layers.
4. Conclusions
1. A new recipe was designed to address the demand for high-strength and lightweight slurry, striving to improve the cement bond logging. Recipe no. 3 is a lightweight slurry with high early strength of the resultant cement sheath. When designing such slurry, more water is used or light filling additives are added to its composition. Such solutions, however, reduce the mechanical strength. The lightweight slurries used currently do not achieve such high strength. The new lightweight slurry recipes presented herein contain less water. Lightweight slurries, the recipes of which are presented here, have comparable thickening time, which is important during injection into a well.
2. The filtration of the designed lightweight slurries is four to eight times lower than that of the test lightweight slurry sample. This was achieved by reducing the amount of water in the slurry and by adding microspheres. Filling and strengthening agents are added to reduce the decrease of compressive strength. Reduction of filtration is necessary to counteract gas migration after cementing.
3. The new formula of the lightweight slurry designed by the author reduced the hydration time needed to achieve 3.5 MPa by half. This is very beneficial from an energetic and economic point of view, as it makes it possible to continue the drilling works earlier.
4. An addition of microsilica and reduction of the amount of water in the slurry no. 2 leads to the most considerable increase of strength in the first hours of hydration. The increase in strength ranges from 407% (after 6 h) to 123% (after 48 h), compared to the test slurry no. 1, while for slurry no. 3, an addition of 1.5% sodium hydroxide and 1.5% calcium nitrate results in a comparable increase in strength. The improvement in strength in the latter case ranges from 295% (after 6 h) to 276% (after 48 h) compared to test slurry no. 1. The designed lightweight slurries with a high strength of cement sheath can improve the cement bond logging reading. The use of those slurries (no. 2 and 3) reduces the possibility of damage to the structure of the cement sheath during further drilling for the next section of casing strings.
Funding
The work was financially supported by Ministry of Science and Higher Education Warsaw (Internal order Oil and Gas Institute—National Research Institute Project No. 0044/KW/19).
Acknowledgments
The author thanks the anonymous reviewers for their constructive comments and the editor for handling the paper.
Conflicts of Interest
The author declares no conflict of interest.
Nomenclature
| CBL | the cement bond logging documents the evaluation of the integrity of cement work performed on an oil well |
| pH | in chemistry, it is a scale used to specify how acidic or basic a water-based solution is |
| BET | the specific surface area is a property of solids defined as the total surface area of a material per unit of mass (with units of m2/kg or m2/g) or solid or bulk volume (units of m2/m3 or m−1). It is determined by adsorption isotherm analysis. The test is carried out using a BET isotherm (isothermal Brunauer–Emmett–Teller), which is a particular form of a linear equation |
| Bc | the pumpability or consistency of cement slurry, measured in Bearden units of consistency (Bc), a dimensionless quantity with no direct conversion factor to more common units of viscosity |
| UCA | Ultrasonic Cement Analyzer. |
| HTHP | High Temperature High Pressure |
| w/c | water–cement ratio—expresses the amount of water per cement unit |
| Css | the liquid is described by Casson’s rheological model |
| HB | the liquid is described by the Herschel–Bulkley rheological model |
References
- Dohnalik, M.; Zalewska, J. Korelacja wyników laboratoryjnych uzyskanych metodą rentgenowskiej mikrotomografii, jądrowego rezonansu magnetycznego i porozymetrii rtęciowej. Nafta-Gaz 2013, 69, 735–743. [Google Scholar]
- Kremieniewski, M.; Stryczek, S.; Wiśniowski, R.; Gonet, A. Zmniejszanie porowatości stwardniałych zaczynów wiertniczych poprzez wprowadzenie dodatków drobnoziarnistych. Cem. Lime. Concr. 2016, 21, 325–335. [Google Scholar]
- Alber, M.; Ehringhausen, N. Petrophysical properties of casing cement while curing. Int. Soc. Rock Mech. Rock Eng. 2017, 191, 164–171. [Google Scholar] [CrossRef]
- Ramezanianpour, A.A.; Malhotra, V.M. Effect of curing on the compressive strength, resistance to chloride-ion penetration and porosity of concretes incorporating slag, fly ash or silica fume. Cem. Concr. Compos. 1995, 17, 125–133. [Google Scholar] [CrossRef]
- Ahdaya, M.; Imqam, A. Fly ash Class C based geopolymer for oil well cementing. J. Pet. Sci. Eng. 2019, 179, 750–757. [Google Scholar] [CrossRef]
- Boukhelifa, L.; Moroni, N.; James, S.; Le Roy-Delage, S.; Thiercelin, M.J.; Lemaire, G. Evaluation of Cement Systems for Oil and Gas Well Zonal Isolation in a Full-Scale Annular Geometry. SPE Drill. Complet. 2005, 20. [Google Scholar] [CrossRef]
- Kulakofsky, D.S.; Paredes, J.L.; Rivera, J.A. Ultralightweight Cementing Technology Sets World’s Record for Liner Cementing With a 5.4 lb/gal Slurry Density. Presented at IADC/SPE Drilling Conference, Miami, FL, USA, 21–23 February 2006. [Google Scholar] [CrossRef]
- Chung, S.-Y.; Abd Elrahman, M.; Stephan, D.; Kamm, P.H. The influence of different concrete additions on the properties of lightweight concrete evaluated using experimental and numerical approaches. Constr. Build. Mater. 2018, 189, 314–322. [Google Scholar] [CrossRef] [Green Version]
- Garbalinska, H.; Strzałkowski, J. Thermal and strength properties of lightweight concretes with variable porosity structures. J. Mater. Civ. Eng. 2018, 28, 567–575. [Google Scholar] [CrossRef] [Green Version]
- Sadowski, Ł.; Popek, M.; Czarnecki, S.; Mathia, T.G. Morphogenesis in solidification phases of lightweight concrete surface at early ages. Constr. Build. Mater. 2017, 148, 96–103. [Google Scholar] [CrossRef]
- Formica, J.J.; Davis, R.J. Lightweight Cement, Ultrasonic Cement Evaluation, and Cased-Hole Dynamics Formation Pressure Tester Combine to Enhance Infill-Drilling Opportunities in Shallow Marine Shelf Deposits, Kern County, California. Presented at the SPE Western Regional Meeting, Irvine, CA, USA, 30 March–1 April 2005. [Google Scholar] [CrossRef]
- Crook, R.; Heathman, J. Predicting potential gas-flow rates to help determine the best cementing practices. Drill. Contr. 1998, 11, 40–43. [Google Scholar]
- Brown, D.L.; Ferg, T.E. The Use of Lightweight Cement Slurries and Downhole Chokes on Air-Drilled Wells. SPE Drill. Complet. 2005, 20, 123–132. [Google Scholar] [CrossRef]
- Kremieniewski, M. Receptury zaczynów do uszczelniania kolumn rur posadowionych w otworach wierconych w skałach chłonnych. Nafta-Gaz 2019, 75, 451–457. [Google Scholar] [CrossRef]
- Liu, X.; Nair, S.; Aughenbaugh, K.; Van Oort, E. Mud-to-cement conversion of nonaqueous drilling fluids using alkali-activated fly ash. J. Pet. Sci. Eng. 2019, 182, 106242. [Google Scholar] [CrossRef]
- Shabbar, R.; Nedwell, P.; Wu, Z. Mechanical properties of lightweight aerated concrete with different aluminum powder content. MATEC Web Conf. 2017, 120, 02010. [Google Scholar] [CrossRef] [Green Version]
- Chung, S.-Y.; Han, T.-S.; Yun, T.S.; Yeom, K.S. Evaluation of the anisotropy of the void distribution and the stiffness of lightweight aggregates using CT imaging. Constr. Build. Mater. 2013, 48, 998–1008. [Google Scholar] [CrossRef]
- Abd Elrahman, M.; Chung, S.Y.; Sikora, P.; Rucinska, T.; Stephan, D. Influence of nanosilica on mechanical properties, sorptivity, and microstructure of lightweight concrete. Materials 2019, 12, 3078. [Google Scholar] [CrossRef] [PubMed] [Green Version]
- Al-Yami, A.S.; Nasr-El-Din, H.A.; Al-Humaidi, A.S.; Al-Saleh, S.H.; Al-Arfaj, M.K. Evaluation and Optimization of Low-Density Cement: Laboratory Studies and Field Application. SPE Drill. Complet. 2010, 25, 70–89. [Google Scholar] [CrossRef]
- Curtis, J.A.; Dajani, M.R. Guidelines for Appropriate Application of Non-Foamed Ultralightweight Cement Slurries. Presented at the SPE/IADC Drilling Conference and Exhibition, Amsterdam, The Netherlands, 17–19 March 2009. [Google Scholar] [CrossRef]
- Nehdi, M.; Rahman, M.A. Estimating rheological properties of cement pastes using various rheological models for different test geometry, gas, and surface friction. Cem. Concr. Res. 2004, 34, 1993–2007. [Google Scholar] [CrossRef]
- Kremieniewski, M. Poprawa wczesnej wytrzymałości mechanicznej płaszcza cementowego powstałego z zaczynu lekkiego. Nafta-Gaz 2018, 74, 599–605. [Google Scholar] [CrossRef]
- Ramamurthy, K.; Narayanan, N. Factors influencing the density and compressive strength of aerated concrete. Mag. Concr. Res. 2000, 52, 163–168. [Google Scholar] [CrossRef]
- Aguilar, A.S.; Melo, J.P.; Olivares, F.H. Microstructural analysis of aerated cement pastes with fly ash, metakaolin and Sepiolite additions. Constr. Build. Mater. 2013, 47, 282–292. [Google Scholar] [CrossRef]
- Bonett, A.; Pafitis, D. Getting to the root of gas migration. Oilfield Rev. 1996, 8, 36–49. [Google Scholar]
- Vlachou, P.-V.; Piau, J.-M. Physicochemical study of the hydration process of an oil well cement slurry before setting. Cem. Concr. Res. 1999, 29, 27–36. [Google Scholar] [CrossRef]
- Abbas, G.; Irawan, S.; Kumar, S.; Memon, R.K.; Khalwar, S.A. Characteristics of Oil Well Cement Slurry using Hydroxypropylmethylcellulose. J. Appl. Sci. 2014, 14, 1154–1160. [Google Scholar] [CrossRef]
- Berger, R.L.; Arnon, B.; Milestone, N.B.; Kung, J.H. Structural Properties of Calcium Silicate Pastes Pt. 2: Effect of Curing Temperature. J. Am. Ceram. Soc. 1979, 62, 362–366. [Google Scholar] [CrossRef]
- Carathers, K.; Crook, R. Surface Pipe Cement Gives High Early Strength With New Cement Additive; South-wester Petroleum Short Course: Lubbock, TX, USA, 1987; pp. 12–19. [Google Scholar]
- Khalil, M.; Jan, B.M.; Raman, A.A.A. Rheological and statistical evaluation of nontraditional lightweight completion fluid and its dependence on temperature. J. Pet. Sci. Eng. 2011, 77, 27–33. [Google Scholar] [CrossRef]
- Kremieniewski, M.; Stryczek, S. Zastosowanie cementu wysokoglinowego do sporządzania zaczynów uszczelniających w technologiach wiertniczych. Cem. Lime Concr. 2019, 22/84, 215–226. [Google Scholar] [CrossRef]
- Bellotto, M. Cement paste prior to setting: A rheological approach. Cem. Concr. Res. 2013, 52, 161–168. [Google Scholar] [CrossRef]
- Chougnet, A.; Palermo, T.; Audibert, A.; Moan, M. Rheological behaviour of cement and silica suspensions: Particle aggregation modelling. Cem. Concr. Res. 2008, 38, 1297–1301. [Google Scholar] [CrossRef]
- Thiercelin, M.J.; Dargaud, B.; Baret, J.F.; Rodriquez, W.J. Cement Design Based on Cement Mechanical Response. SPE Drill. Complet. 1998, 13. [Google Scholar] [CrossRef]
- Medley, G.H.; Maurer, W.C.; Garkasi, A.Y. Use of Hollow Glass Spheres for Underbalanced Drilling Fluids. Presented at SPE Annual Technical Conference and Exhibition, Dallas, TX, USA, 22–25 October 1995. [Google Scholar] [CrossRef]
- Pang, X.; Boul, P.J.; Cuello Jimenez, W. Nanosilicas as Accelerators in Oilwell Cementing at Low Temperatures. In Proceedings of the IADC/SPE Drilling Conference and Exhibition, Fort Worth, TX, USA, 4–6 March 2014. [Google Scholar] [CrossRef]
- Wang, G.; Cao, C.; Pu, X.; Zhao, Z. Experimental investigation on plugging behavior of granular lost circulation materials in fractured thief zone. Part. Sci. Technol. 2016, 34, 392–396. [Google Scholar] [CrossRef]
- Bogas, J.A.; Brito, J.; Figueiredo, J.M. Mechanical characterization of concrete produced with recycled lightweight expanded clay aggregate concrete. J. Clean. Prod. 2015, 89, 187–195. [Google Scholar] [CrossRef]
- Yu, R.; van Onna, D.V.; Spiesz, P.; Yu, Q.L.; Brouwers, H.J.H. Development of Ultra-Lightweight Fibre Reinforced Concrete applying expanded waste glass. J. Clean. Prod. 2016, 112, 690–701. [Google Scholar] [CrossRef]
- Blanco, F.; García, P.; Mateos, P.; Ayala, J. Characteristics and properties of lightweight concrete manufactured with cenospheres. Cem. Concr. Res. 2000, 30, 1715–1722. [Google Scholar] [CrossRef]
- Huang, Z.; Padmaja, K.; Li, S.; Richard Liew, J.Y. Mechanical properties and microstructure of ultra-lightweight cement composites with fly ash cenospheres after exposure to high temperatures. Constr. Build. Mater. 2018, 164, 760–774. [Google Scholar] [CrossRef]
- Du, H. Properties of ultra-lightweight cement composites with nano-silica. Constr. Build. Mater. 2019, 199, 696–704. [Google Scholar] [CrossRef]
- Daou, F.; Piot, B.M. Cement-Slurry Performance and Set-Cement Properties vs. Microsilica Densification. Presented at the IADC/SPE Drilling Conference, Orlando, FL, USA, 4–6 March 2008. [Google Scholar] [CrossRef]
- Jordan, A.; Pernites, R.; Albrighton, L.; Services, B.J. Low-density, lightweight cement tested as alternative to reduce lost circulation, achieve desired top of cement in long horizontal wells. Drill. Contract. 2018, 62–64. Available online: https://www.drillingcontractor.org/low-density-lightweight-cement-tested-as-alternative-to-reduce-lost-circulation-achieve-desired-top-of-cement-in-long-horizontal-wells-48355 (accessed on 1 March 2020).
- Kremieniewski, M. Wpływ drobnoziarnistej krzemionki na parametr czasu oczekiwania na cement – WOC. Nafta-Gaz 2019, 75, 683–690. [Google Scholar] [CrossRef]
- Colombo, A.; Geiker, M.; Justnes, H. The effect of calcium lignosulfonate on ettringite formation in cement paste. Cem. Concr. Res. 2018, 107, 188–205. [Google Scholar] [CrossRef]
- Zhao, S.; Sun, W. Nano-mechanical behavior of a green ultra-high performance concrete. Constr. Build. Mater. 2014, 63, 150–160. [Google Scholar] [CrossRef]
- Mbessa, M.; Péra, J. Durability of high-strength concrete in ammonium sulfate solution. Cem. Concr. Res. 2001, 31, 1227–1231. [Google Scholar] [CrossRef]
- Barvinok, M.S.; Komokhov, P.S.; Bondareva, N.F. Effect of Temperature and Additives on the Early Stage of Hardening. In Proceedings of the 6th International Congress on the Chemistry of Cement, Moscow, Russia, 1976; section II, (II-7, II-8). pp. 1–12. [Google Scholar]
- Collepardi, M.; Marchese, B. Morphology and Surface Properties of Hydrated Tricalcium Silicate Pastes. Cem. Concr. Res. 1972, 2, 57–65. [Google Scholar] [CrossRef]
- Robertson, R.E.; Stiff, H.A. An Improved Mathematical Model for Relating Shear Stress to Shear Rate in Drilling Fluids and Cement Slurries. Soc. Pet. Eng. J. 1976, 16. [Google Scholar] [CrossRef]
- Banfill, P.F.G.; Kitching, D.R. 14 Use of a Controlled Stress Rheometer to Study the Yield Stress of Oilwell Cement Slurries. In Rheology of Fresh Cement and Concrete: Proceedings of an International Conference, Liverpool, 1990; CRC Press: Boca Raton, FL, USA, 1990; p. 125. [Google Scholar]
- Velayati, A.; Tokhmechi, B.; Soltanian, H.; Kazemzadeh, E. Cement slurry optimization and assessment of additives according to a proposed plan. J. Nat. Gas Sci. Eng. 2015, 23, 165–170. [Google Scholar] [CrossRef]
- Tao, C.; Kutchko, B.G.; Rosenbaum, E.; Wu, W.-T.; Massoudi, M. Steady Flow of a Cement Slurry. Energies 2019, 12, 2604. [Google Scholar] [CrossRef] [Green Version]
- Yuan, B.; Yang, Y.; Tang, X.; Xie, Y. A starting pressure prediction of thixotropic cement slurry: Theory, model and example. J. Pet. Sci. Eng. 2015, 133, 108–113. [Google Scholar] [CrossRef]
- PN–EN ISO 10426-2. Petroleum and Natural Gas Industries. Cements and Materials for Well Cementing. Part 2: Testing of Well Cements; ISO: Geneva, Switzerland, 2003. [Google Scholar]
- Stryczek, S.; Wiśniowski, R.; Gonet, A.; Ferens, W. Parametry reologiczne świeżych zaczynów uszczelniających w zależności od czasu ich sporządzania. Wiertnictwo Nafta Gaz 2009, 26, 369–382. [Google Scholar]
- Wiśniowski, R.; Skrzypaszek, K. Komputerowe wspomaganie wyznaczania modelu reologicznego cieczy - program Flow-fluid Coef. Nowocz. Tech. i Technol. Bezwykopowe 2001, 2–3, 72–77. [Google Scholar]
- Wiśniowski, R.; Stryczek, S.; Skrzypaszek, K. Kierunki rozwoju badań nad reologią płynów wiertniczych. Wiertnictwo Nafta Gaz 2007, 24, 595–607. [Google Scholar]
- Struble, L.; Sun, G.-K. Viscosity of Portland cement paste as a function of concentration. Adv. Cem. Based Mater. 1995, 2, 62–69. [Google Scholar] [CrossRef]
- Liu, L.; Fang, Z.; Qi, C.; Zhang, B.; Guo, L.; Song, K.I.-I.L. Numerical study on the pipe flow characteristics of the cemented paste backfill slurry considering hydration effects. Powder Technol. 2019, 343, 454–464. [Google Scholar] [CrossRef]
- British Standards Institution. BS EN 196-1:2016 Methods of testing cement. Determination of strength. Available online: https://www.thenbs.com/PublicationIndex/documents/details?Pub=BSI&DocID=314246 (accessed on 1 March 2020).
- Kremieniewski, M. Lekkie zaczyny cementowe do uszczelniania technicznych kolumn rur okładzinowych. Nafta-Gaz 2010, 6, 477–480. [Google Scholar]
Figure 1.
Cement bond logging test at an interval of 0–350 m. Cement slurry with a density of 1550 kg/m3.
Figure 1.
Cement bond logging test at an interval of 0–350 m. Cement slurry with a density of 1550 kg/m3.

Figure 2.
Cement bond logging test at an interval of 900–1300 m. Cement slurry with a density of 1810 kg/m3.
Figure 2.
Cement bond logging test at an interval of 900–1300 m. Cement slurry with a density of 1810 kg/m3.

Figure 3.
Simplified diagram of the ultrasonic cement analyzer.

Figure 4.
Flow curves of cement slurries at the temperature of 20 °C.

Figure 5.
The compressive strength increase curve of sample no. 1.

Figure 6.
The compressive strength increase curve of sample no. 2.

Figure 7.
The compressive strength increase curve of sample no. 3.


Table 1.
Selected compositions of cement slurries cured at a temperature of 40 °C and under the pressure of 10 MPa.
Table 1.
Selected compositions of cement slurries cured at a temperature of 40 °C and under the pressure of 10 MPa.
| Composition | Action | 1 | 2 | 3 |
|---|---|---|---|---|
| Water–cement ratio | - | 0.85 | 0.60 | 0.55 |
| Plasticizer | Cement slurry liquefies | 0.2 | 0.7 | 0.3 |
| Latex | Lowers filtration, prevents gas migration through hardened cement slurry | 5.0 | 5.0 | 5.0 |
| Stabilizer | Provides good, even and durable latex dispersion | 0.5 | 0.5 | 0.5 |
| Bentonite | Is used to increase the viscosity of mixing water | 1.5 | 1.5 | 1.5 |
| Defoaming agent | Prevents foam formation | 0.5 | 0.5 | 0.5 |
| Antifiltrating agent | Reduces cement slurry filtration | 0.3 | 0.3 | 0.3 |
| Setting accelerator | Accelerates the cement hydration process in cement slurry | 1.0 | 1.0 | 1.0 |
| Microcement | Seals the matrix of hardened cement slurry | 10.0 | 10.0 | 10.0 |
| Cenospheres | Reduces cement slurry density | 0.0 | 15.0 | 15.0 |
| Nanosilica | Supplements the pore microstructure of hardened cement slurry | 2.0 | 0.0 | 0.0 |
| Microsilica | Seals the matrix of hardened cement slurry and has pozzolanic properties | 13.0 | 15.0 | 0.0 |
| Strengthening agent | Increases mechanical strength | 0.0 | 0.0 | 1.5 |
| Sodium hydrooxide | Accelerates cement hydration and increases the value of mechanical parameters | 0.0 | 0.0 | 1.5 |
| Cement CEM I 42.5R | It sets the cement slurry | 100.0 | 100.0 | 100.0 |
All components in % by mass of cement. Bentonite in % by weight of water.
Table 2.
Properties of cement slurries with additives and admixtures.
| Composition no. | w/c | Density (g/cm3) | Filtration, (cm3) After 30 min of Measurement | Thickening Time (h:min) | Time in which Strength Was Achieved 3.5 MPa (h:min) | Compressive Strength Tested with the Ultrasonic Cement Analyzer, (MPa) | ||||
|---|---|---|---|---|---|---|---|---|---|---|
| 6 h | 12 h | 24 h | 48 h | |||||||
| 30Bc * | 100Bc * | |||||||||
| 1 | 0.85 | 1.58 | 733.0 | 5:55 | 7:10 | 10:04 | 1.04 | 4.35 | 7.29 | 9.18 |
| 2 | 0.60 | 1.54 | 85.0 | 6:30 | 7:20 | 4:54 | 4.24 | 6.93 | 9.45 | 11.32 |
| 3 | 0.55 | 1.57 | 174.0 | 5:10 | 6:00 | 6:13 | 3.07 | 13.04 | 20.98 | 25.36 |
* Bc—The Bearden unit is used when determining the change in consistency of cement slurry during setting.
Table 3.
Rheological properties of cement slurries with additives and admixtures.
| Rheological Properties | Temperature of Measurement (°C) | Composition of Cement Slurry | ||
|---|---|---|---|---|
| 1 | 2 | 3 | ||
| Yield stress value Css (Pa) | 22 | 8.7696 | 76.5356 | 19.7906 |
| Consistency index HB (Pa·sn) | 22 | 0.0861 | 29.8990 | 2.8613 |
| Flow index HB [n](-) | 22 | 0.8464 | 0.2484 | 0.5771 |
| Apparent viscosity at 1022 s−1 (mPa·s) | 22 | 4.4984 | 189.9930 | 170.9930 |
Css - value described by Casson’s rheological model. HB - value described by the Herschel–Bulkley rheological model.
© 2020 by the author. Licensee MDPI, Basel, Switzerland. This article is an open access article distributed under the terms and conditions of the Creative Commons Attribution (CC BY) license (http://creativecommons.org/licenses/by/4.0/).
Share and Cite
MDPI and ACS Style
Kremieniewski, M. Recipe of Lightweight Slurry with High Early Strength of the Resultant Cement Sheath. Energies 2020, 13, 1583. https://0-doi-org.brum.beds.ac.uk/10.3390/en13071583
AMA Style
Kremieniewski M. Recipe of Lightweight Slurry with High Early Strength of the Resultant Cement Sheath. Energies. 2020; 13(7):1583. https://0-doi-org.brum.beds.ac.uk/10.3390/en13071583
Chicago/Turabian StyleKremieniewski, Marcin. 2020. "Recipe of Lightweight Slurry with High Early Strength of the Resultant Cement Sheath" Energies 13, no. 7: 1583. https://0-doi-org.brum.beds.ac.uk/10.3390/en13071583
Note that from the first issue of 2016, this journal uses article numbers instead of page numbers. See further details here.