1. Introduction
Urban systems are dynamic spaces of cohabitation and development of human and industrial activities that have experienced a great evolution during the last decades. The consolidation of human well-being and the generation of opportunities for its inhabitants in many different fields have encouraged cities’ growth, so much so that since 2007, according to United Nations [
1], more than half the world’s population is living in urban areas, consuming over 60% of total resource and generating around 70% of global carbon emissions. It means that cities are one of the most significant contributors to climate change [
2], but it also makes cities one of the key actors having an influence and the ability to fight for the sustainable development [
3,
4], by implementing low carbon development plans [
5,
6]. In Europe, where more than 70% of the population live in cities, the role of these human settlements is particularly important. In this sense, some experts [
7,
8] consider that it is essential to evoke the interests of the business sector, since they can be a key actor alongside public authorities and citizens [
9]. World Commission on Environment and Development [
10] stated that multinational companies, within the private sector, have the power to contribute to sustainable development and to bring far-reaching changes and improvements needed in the face of climate change and unsustainable practices.
Aware of that, city mayors are highly interested in attracting multinational enterprises (MNEs), especially those working on the green energy field. This is because the multitude of positive impact of the inherent innovations and the social benefits of the given services provided by the new companies have already been verified [
11,
12,
13]. Local governments need to identify what key variables companies consider in their strategic decision-making processes, when entering new markets. If, and only if public authorities know what MNE’s companies are looking for, will they be capable of being attraction poles to these organizations. The decision-making process is far from being homogenous. Each sector demands different features, although it is possible to find common requirements and behavioral patterns. Considering how important the energy sector is for the sustainable development, this study focuses on understanding which variables are most significant for the green energy European multinational enterprises, when making the choice for new locations to offer their services.
This complex phenomenon of location decision, involving many interrelated and conflicting criteria that can vary over time and over industry type, has been widely studied in specific industries: the business service industry [
14], retail industry and stores [
15,
16,
17], industrial plants and facilities for supply chain management [
18,
19,
20,
21,
22,
23,
24], hospitals and medical facilities [
25,
26], agro-industrial firms [
27], logistics companies [
28,
29], bank industry and financial service providers [
30], entrepreneurship [
31,
32], and even, the aerospace industry [
33]. However, to the best of the authors’ knowledge, there is no study, and despite the growing interest in the issue, that incorporates a comprehensive and complete set of variables specific for the green energy services. Precisely, there is no model gathering all the variables that might be significant for the energy industry offering services, such as district heating or retrofitting, to cities. Besides, most of the location frameworks used in other fields do not deal with the fuzzy linguistic logic intrinsic to human thinking.
Considering this important gap in the literature, this paper aims to contribute on location theories by providing a novel and original linguistic framework based on structuring the problem as a hierarchy and using supporting tools from the multi-criteria decision aiding field [
34]. The methodology used is part of a broader project that aims to help city political leaders, in a comprehensive manner, to prioritize investments based on a defined problem or need.
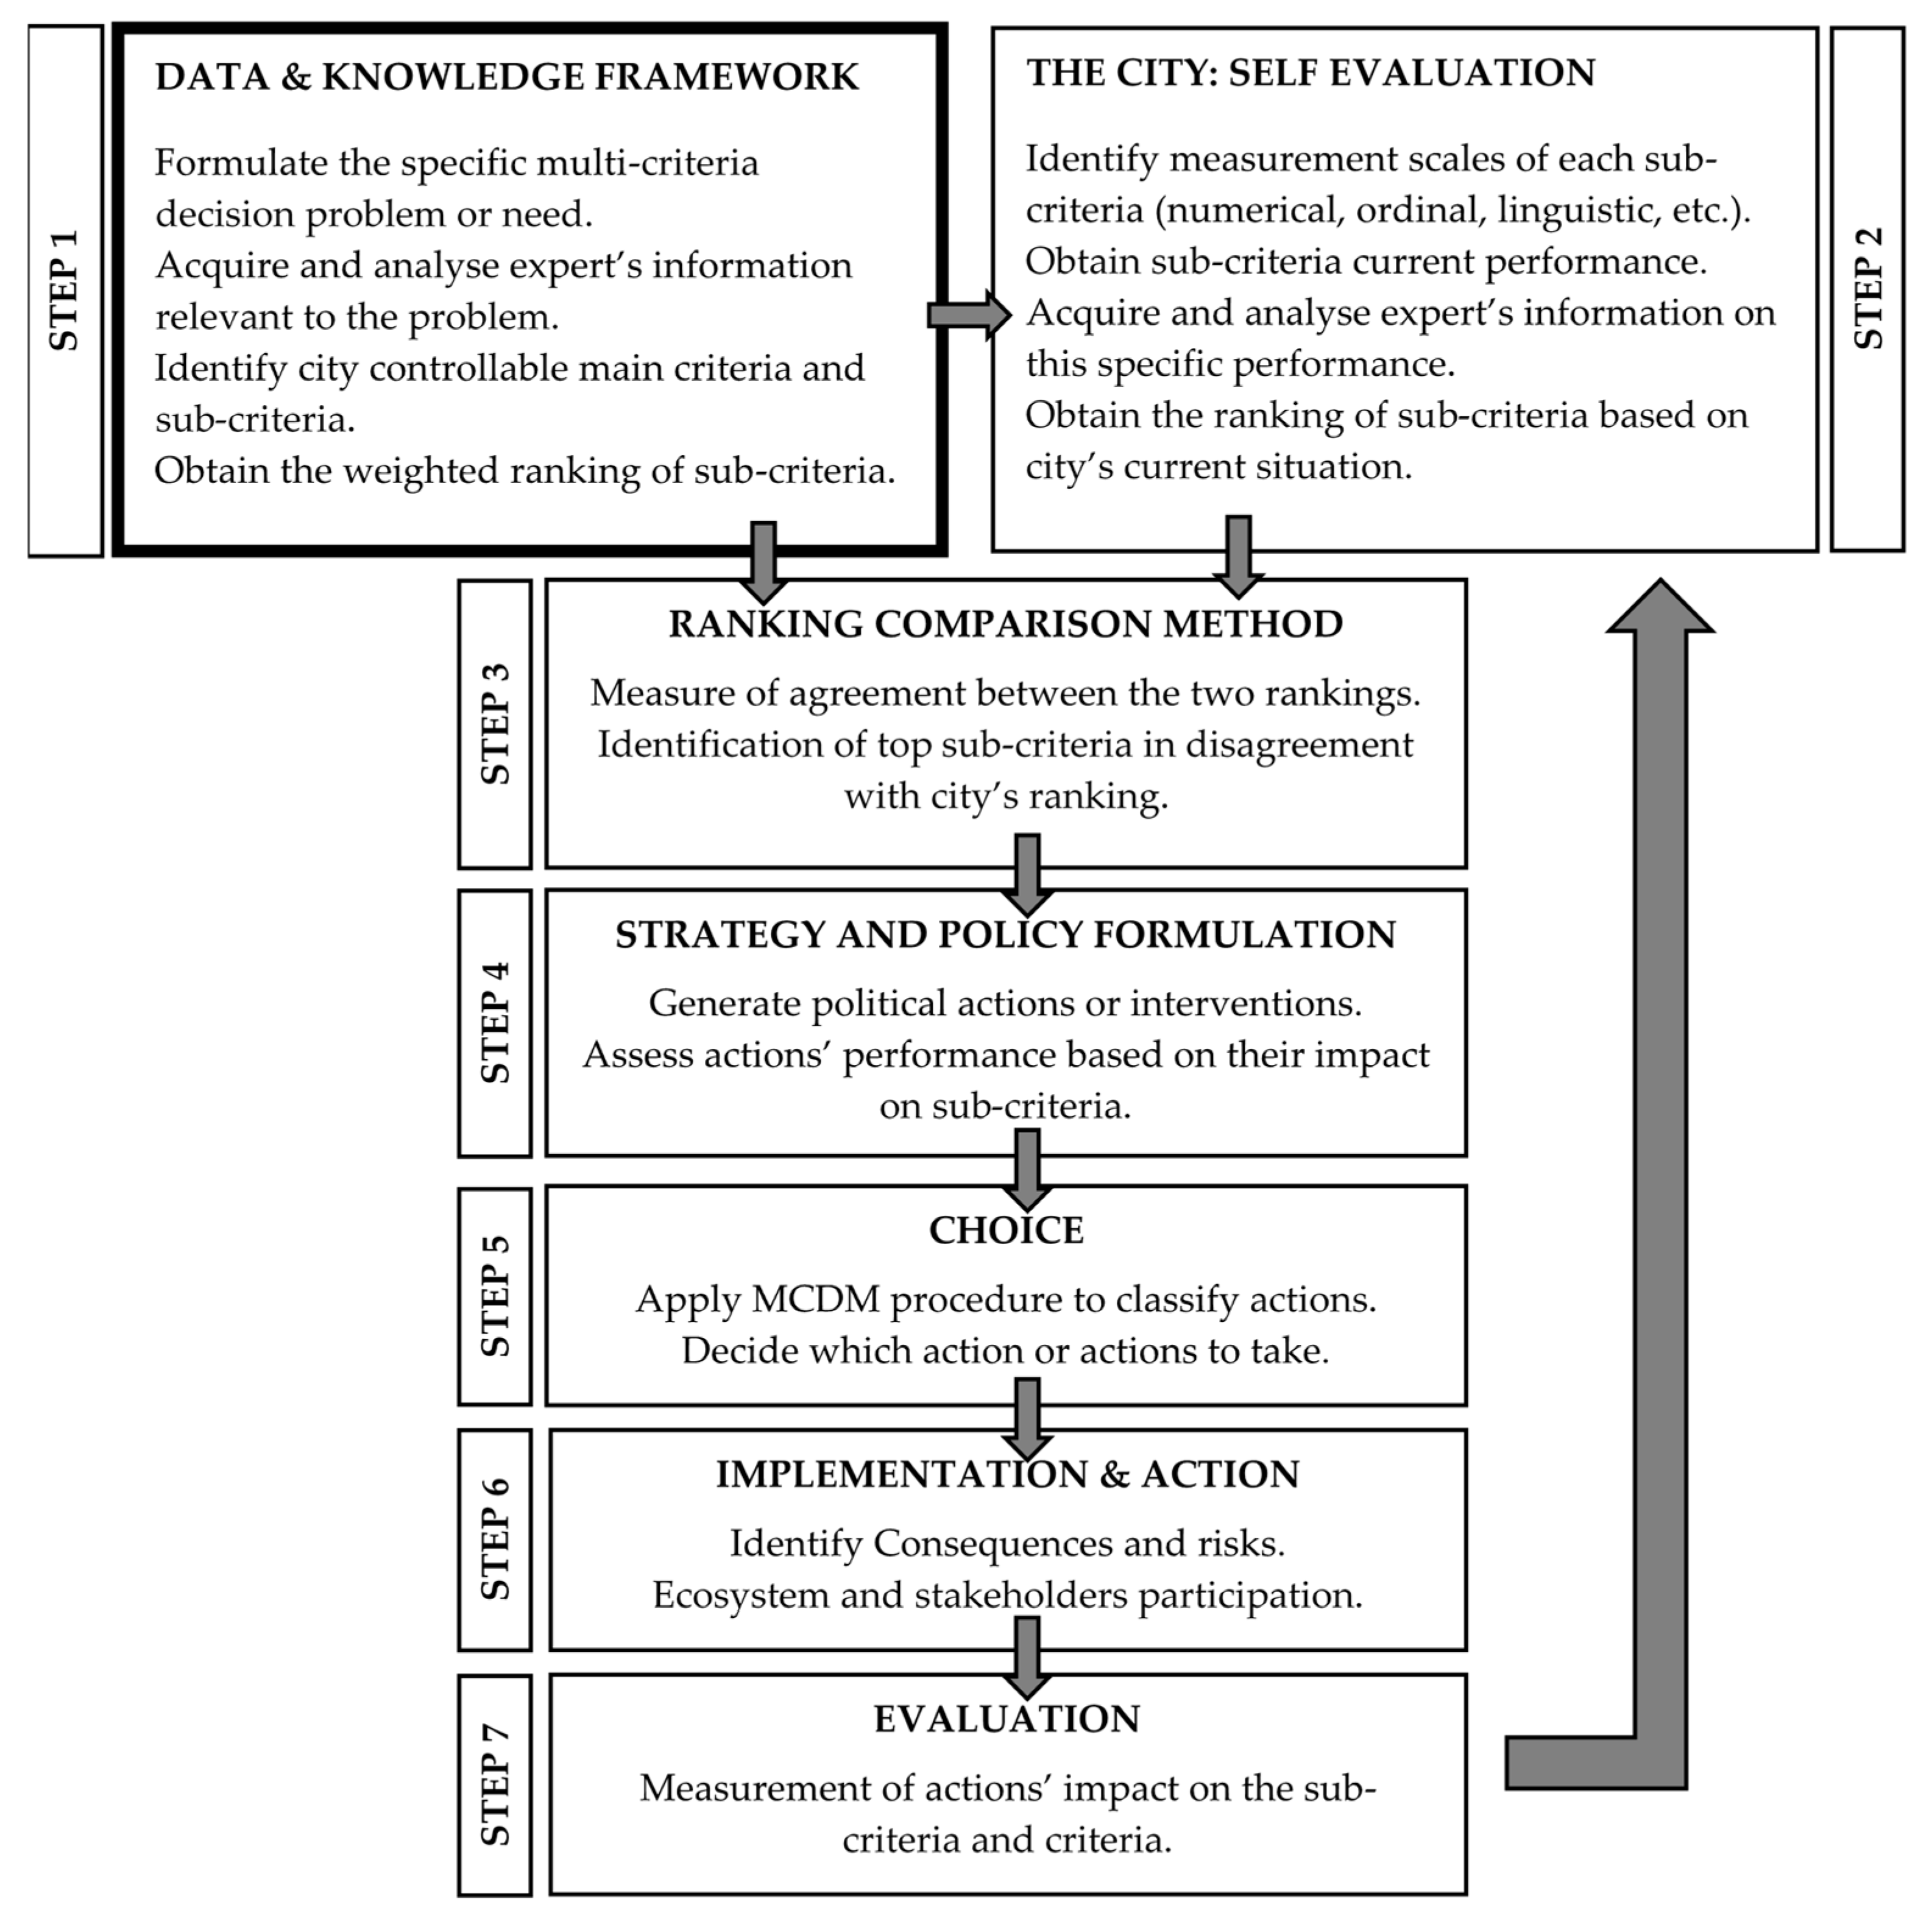
Figure 1 is a schematic illustration of the proposed cyclical procedure to move from a specific set of ordered criteria to policy development. This is a tool intended for city political leaders use. This framework can be used for different needs or multi-criteria problems faced by the cities. As can be seen in
Figure 1, multi-criteria decision-making tools as well as linguistic modelling are of great use thorough the entire procedure that a city should follow in order to go from the theoretical framework to impactful actions.
In this manuscript, we develop and present the methodology used in the initial phase of the knowledge framework development (step 1). In this case, the specific problem is to help European smart cities better attract energy MNSs and hence, the need is to assess the importance of main criteria and sub-criteria governing the strategic location decision made by these enterprises. Therefore, the acquisition of data and the proposed ranking framework is obviously generated from opinions and judgements given by experts of this sector. The proposed procedure could be applied to different multi-criteria problems, such as how cities can attract tech start-ups, resulting in a different set of controllable criteria. The rest of the process stages could essentially follow the same methodology.
The remainder of this study is structured as follows:
Section 2 provides a theoretical framework to review some aspects of multi-criteria decision making, specifically AHP and TOPSIS and introduces fuzzy linguistic modeling as utilized in multi-criteria decision-making processes. This section also introduces a novel methodology for solving the presented location decision making problem. Following the proposed framework,
Section 3 presents the results. Finally, discussion and some conclusions are derived in
Section 4 and
Section 5.
2. Materials and Methods
In this section, we describe the theoretical framework to clarify all aspects that will be needed for the proposed methodology, which is framed within a group decision making situation under linguistic assessments. On the one hand, a review on multi-criteria decision making or aiding (MCDM/MCDA) and group decision making (GDM) is provided. Following this contextual explanation, the basic notions and characteristics of two widely used MCDM methods, i.e., AHP and TOPSIS, are given. On the other hand, a detailed explanation of some fuzzy linguistic models based on hesitant fuzzy linguistic term sets (HFLTSs) to represent human’s opinions is presented. Finally, our proposed methodology is illustrated step by steps, thus facilitating the potential replication of this method to other sectors or geographical areas.
2.1. Multi-Criteria Decision Making (MCDM) and Group Decision Making (GDM)
The field of operations research (OR) develops models and optimization procedures to help the business sector analyze and solve complex problems in the presence of multiple and conflicting criteria or objectives. Depending on perspective, MCDM techniques are considered to be both, past and modern part of OR [
35]. One of the first known recorded work on MCDM was done by Benjamin Franklin [
36]. Nonetheless, foundations of modern MCDM were developed in 1950s and 1960s and since then, several authors have attempted to review the multi-criteria techniques and give an overview of the existing situation of MCDM methods [
37,
38,
39]. The scope of MCDM methods is enormous, being applied to a wide range of different sectors such as: economics, health care, logistics, industrial engineering, environmental sciences, bio economy, urban studies or public policy [
40,
41,
42,
43].
Some contexts of the MCDM field are sometimes referred as multi-criteria decision aiding (MCDA) situations [
34]. This is a constructivist or, also known as, “European” approach of a multi-criteria decision situation. Two main actors are involved in an MCDM process: the analyst, who is responsible for designing the method and the decision maker (DM), for whom this aiding method is offered. This decision aiding process reflects better the co-construction process followed in this research study. MCDA tools have to be seen as keys to doors giving access to elements of knowledge contributing to acceptance of a final recommendation [
44].
There are various mathematical tools for developing MCDM models. Possibly the most well-recognized are Elimination and Choice Expressing the Reality (ELECTRE) [
45], Analytical Hierarchy Process (AHP) [
46], Technique for Order of Preference by Similarity to Ideal Solution (TOPSIS) [
47], PROMETHEE [
48] or VIKOR [
49]. In our methodology, we combine AHP and an extended version of TOPSIS to deal with linguistic information in a group decision situation. The basics of AHP and TOPSIS are explained in the following Sections.
Despite the increasingly number of recently new developed methods, the structure of any decision-aiding context or process is founded on the following pillars:
where each is a distinct alternative (action, object, etc.) to be evaluated. MCDM/MCDA methods can solve problems of three type: choice, classification or ranking of these alternatives.
It is the coherent set of n criteria.
. This is the relative importance coefficient of each criterion.
. It refers to the performances (consequences, characteristics or attributes of each alternative with respect to each criterion which allow to compare one with another.
There is a decision maker (DM) or a group of DM who provides preference information and a process that models this preference system.
When more than one decision maker is involved, the situation is commonly referred as to group decision-making (GDM) or group decision-aiding (GDA) environment. The building of the family of criteria and the relative importance assigned to it, which is elicited from of DM preferences are important steps in a GDM context. This study will focus on analyzing these aspects of the decision aiding process as a fundamental phase prior to evaluating alternatives in a second stage research project.
Group decision making based on linguistic assessments or preference relations provided by the DMs is a research topic that has been widely studied among researchers [
50,
51] and received a great deal of interest over the last years [
52,
53]. In some studies, we see that experts feel more comfortable providing linguistic information rather than exact numerical values and this allows to better capture the ambiguity and impreciseness inherent in human’s reasoning [
54]. A detailed explanation of the use of a fuzzy approach to deal with linguistic information is provided further below in
Section 2.3.
2.2. Analytic Hierarchy Process and TOPSIS
2.2.1. Analytic Hierarchy Process
Analytic hierarchy process (AHP) is one of the common methods used in multi-criteria decision-making tools developed by [
46]. AHP is a theory of measurement through pairwise comparisons and relies on the judgements of experts to derive priority scales. It is therefore a theory of relative measurement [
55]. AHP has been extensively adopted in many practical decision-making applications [
56]. For example, in the business or corporate sector, the more traditional AHP procedure has been used to select a logistics or software provider [
57,
58] to solve a variety of marketing problems [
59] to deal with corporate social responsibility programs [
60], planning renewable energy projects [
61] or rating sovereign debt [
62]. The AHP represents the most commonly used mathematical method in MCDM [
63] and it is usually decomposed in the same steps, explained in [
64].
In the AHP method, the comparisons are made using a scale of absolute judgements that represents, how much more, one element dominates another with respect to a given attribute [
64]. In the classical AHP, the pairwise comparisons are done by using the crisp numbers within the 1–9 scale and from simple judgments on two elements, priority vectors are computed [
65]. In this paper, the eigenvalue method, which is the one proposed by Saaty himself and the most popular method to estimate the priority vector [
55], is used to derive the priorities from the comparison matrix. As explained in the following paragraph, the pairwise comparisons of this matrix are built to be rational and consistent and hence, the concern of irrational comparisons is not a concern here.
The judgments are usually inconsistent, and there is a mathematical way to measure inconsistency. However, a perfectly consistent matrix is obtained following the method proposed for constructing consistent fuzzy preference relations from a set of
preference data [
66]. This method allows us to ask less questions to the experts and obtain the linguistic judgements for the main criteria assessments. To construct a consistent multiplicative preference relation
on
, with
, from
preference values; for instance
, the authors propose these steps:
- (1)
Compute the following preference values
as:
- (2)
Set
- (3)
- (4)
The consistent multiplicative preference relation is obtained as such that:
- (a)
,
- (b)
An example of how to apply this procedure is shown in
Appendix A. Moreover, many new versions and extensions of the traditional AHP have been developed. For example, the fuzzy AHP (FAHP) is a popular methodology to account for uncertainty and is extracted from the theory of fuzzy sets. A state-of-the-art of FAHP can be found in [
67]. In our proposed methodology, we will apply the traditional AHP from a set of minimum preference relations and fuzziness will be incorporated throughout the TOPSIS phase.
2.2.2. TOPSIS
TOPSIS stands for Technique for Order Preference by Similarity to Ideal Solution. It was initially proposed and developed by Hwang and Yoon [
47], Lai et al. [
68] and Yoon and Hwang [
69]. The fundamental idea behind this method is to simultaneously compute distances, for each alternative, to both the positive-ideal solution (PIS), which presents the extreme performance on each criterion, and the negative-ideal solution (NIS), which represents the reverse extreme performance on each criterion [
70]. The ranking of alternatives of the method is based on the relative closeness coefficient (
) which is based on “the shortest distance from the positive ideal solution and the farthest form the negative ideal solution” [
71].
As AHP, TOPSIS is also a very well-known MCDM technique and it has been applied in a wide range of real-world applications. An identification and analysis of the current level of development of issues related to TOPSIS methodology is performed in [
72]. More recently, for instance, TOPSIS method has been recently used to evaluate the multidimensional concept of sustainable development in European countries [
73], to assess the food and nutrition security in Iran [
74], as a non-parametric classifier method to predict bankruptcy [
75] as well as to assess the consequences of Great Britain leaving the European Union in its electricity market from different stakeholders’ perspectives [
76].
TOPSIS was also extended to the fuzzy environment and, in the business sector, has been proposed for selecting top management positions [
77], selecting suppliers [
78] or solving group decision making [
79]. Besides, the integration of (fuzzy) AHP with (fuzzy) TOPSIS to solve multi-criteria problems have been widely used in the literature [
80,
81,
82,
83,
84]. In a business setting, TOPSIS and AHP are combined to determine a cost-benefit decision-making tool applicable for the shipping operators [
83] as well as used conjointly to select the best supplier providing the highest satisfaction for the criteria determined [
82,
84].
Specifically, the use of TOPSIS in multiple attribute group decision-making (MAGDM) problems where the opinion of the experts is represented by hesitant fuzzy linguistic term sets was first proposed by Beg and Rashid [
85]. New approaches of fuzzy linguistic TOPSIS method for group multi-criteria linguistic decision-making were latter developed [
71,
86,
87]. For instance, Ren et al. [
71] used their new concept of pseudo-distance between two HFLTSs to compute distances between the individual HFLTS and the corresponding ideal solutions and Wu et al. [
87]. developed a new linguistic operator (HFLWA) to aggregate individual preferences.
In the application of a TOPSIS technique for group decision-making, it should be noted that the ranking of alternatives depends on mainly three aspects, which have to be decided by the experts and DMs participating in the decision process: (a) the aggregation operator for individual assessments, (b) the choice of the positive and negative ideal solutions and (c) the choice of the distance measure used to compute the relative closeness coefficient. In our proposed TOPSIS, the aggregated linguistic assessments are modeled by proportional hesitant fuzzy linguistic term sets (PHFLTSs). Secondly, albeit taking into account the issue of rank reversal, the relative ideal solutions are identified as the most adequate and appropriate by the experts who participated in the systematic decision process. As in [
87], results of different combinations, using the absolute ideal solutions were also computed and shown to the experts. Thirdly, with respect to the distance measure, our proposed framework is based on the cosine distance function [
88,
89]. We apply this distance to PHFLTSs, which are vectors of dimensionality equal to the cardinality of the linguistic term set. A numerical example to illustrate the operationality and practicality of this new linguistic version of TOPSIS is provided in
Appendix B.
2.3. Fuzzy Linguistic Approach
This section is devoted to provide some preliminary explanation on the fuzzy linguistic approach used in this research to model experts’ assessments. Firstly, we review the concept of hesitant fuzzy linguistic term sets (HFLTSs) and some operators to aggregate individual preferences into group preferences. Secondly, the concepts the extended hesitant fuzzy linguistic term sets (EHFLTSs) and the proportional hesitant fuzzy linguistic term sets (PHFLTSs) are provided since they are crucial for improving the linguistic elicitation in a group decision-making approach.
2.3.1. Hesitant Fuzzy Linguistic Term Sets (HFLTSs)
Rodríguez et al. [
90] introduced the concept of hesitant fuzzy linguistic term sets (HFLTSs) to allow experts to hesitate among several linguistic terms and use richer and more complex linguistic expressions to asses an indicator, alternative, variable, etc. The use of HFLTSs provides a linguistic and computational frame to model MCDA situations with a high degree of uncertainty and where the group of experts provide their judgements and opinions by means of linguistic expressions, based on the fuzzy linguistic approach and the use of context-free grammars [
91,
92].
Definition 1. [
90]:
Let , be a Linguistic term set (LTS). A HFLTS, , is an ordered finite subset of the consecutive linguistic term of .
Based on Definition 1, in a real case situation we could find a linguistic term set, S, defined by terms such as “not important”, “low importance” or “very important”. The use of a HFLTS will be appropriate for modeling expressions such as “none or low importance”. This is further explained in the next example 1.
Definition 2. [
90]:
Let , be a Linguistic term set and be a HFLTS. The upper bound and the lower bound of the HFLTS, ,
are defined as:and;
and.
Definition 3. [
90]:
The envelope of the HFLTS, env(), is a linguistic interval whose limits are obtained by means of the upper bound (max) and lower bound (min). Hence .
A state of the art survey on HFLTSs and its applications in decision-making can be found in [
93]. For computational purposes, it is also necessary to introduce the concept of the possibility distribution for HFLTS developed in [
94].
Definition 4. [
94]:
Let be a predefined linguistic term set. Let be an HFLTS given by an expert. The possibility distribution for on is represented by where is given by:
And denotes the possibility that the alternative has an assessment value provided by the expert such that and The authors assume that each linguistic term set in the HFLTS is supposed to have an equal possibility to be the expert’s assessment value and hence, it is uniformly distributed. For comprehensiveness purposes, let us introduce the following example.
Example 1. Given a set of five linguistic terms,, being,,,and, four experts are asked to give their opinion about a given attribute. The linguistic assessments provided by each expert (), their corresponding HFLTSs () based onand the possibility distributions are shown in Table 1.
In this work, we will use the possibility distributions to operate with HFLTSs. An aggregation operator developed by Wu and Xu [
94] will be used to integrate the HFLTSs based on their possibility distributions.
Definition 5. [
94]:
Let be a set of HFLTSs, where each is a HFLTSs from the set and are their associated weights such that and . Each is transformed to a possibility distribution . The hesitant fuzzy linguistic weighted average (HFLWA) operator is also defined as a possibility distribution .
where is computed by: Example 2. Given the possibility distributions of the four experts from Example 1, let
= (0.30, 0.30, 0.20, 0.20) be the associated weights in a given situation. In contrast, let = (0.10, 0.10, 0.40, 0.40) be the vector of weights of a situation B. Then, applying the HFLWA operator we get the following aggregated possibility distributions,and, respectively: 2.3.2. Extended Hesitant Fuzzy Linguistic Term Sets (EHFLTS) and Proportional Hesitant Fuzzy Linguistic Term Sets (PHFLTSs)
However, the use of only HFLTSs, i.e., a set of consecutive linguistic terms, is not appropriate in group decision-making contexts. When evaluating an indicator, variable or alternative, the resulting aggregated linguistic labels from a group of experts might not always result in consecutive terms [
95]. Then, the concept of extended hesitant fuzzy linguistic term sets (EHFLTSs) and proportional hesitant fuzzy linguistic term sets (PHFLTSs) are needed to develop a more complex decision framework. As compared to HFLTSs, in an EHFLTS or a PHFLTS the linguistic terms do not need to be consecutive.
EHFLTS where introduced by Wang [
95] and can be constructed by the union of HFLTSs given by individual experts, representing evaluations with uncertainties. Extended hesitant fuzzy linguistic term sets (EHFLTSs) are a powerful tool for modeling uncertain linguistic information in group decision-making. Inspired by [
95], we propose a re-definition of EHFTLS as follows:
Definition 6. Let
be a linguistic term set, then any ordered subset , that is:is called an extended hesitant fuzzy linguistic term set (EHFLTS). Example 3. Suppose that expert
andfrom Example 1 are part of group A of a group decision situation, whereas expertsandare assigned to group B. Due to their different experiences, expert one of group A provided “low importance”, while expert two argued “at least very important”. The set of different linguistic terms emerged from group A are not consecutive subsets of. The evaluation of Group A can be represented by an EHFLTS and not a HFLTSs, i.e.,.
For this study, we model the aggregation of group linguistic assessments with EHFLTS. Hence, we take into account all possible linguistic terms provided by experts without a pre-aggregation process and less information is lost. In comparison, if we had chosen the connected union of two HFLTSs [
96] as an aggregation procedure, the resulting aggregation of Group A in Example 3 would have resulted in
.
On the other hand, with the aim to include proportional information to deal with EHFLTSs, the idea of Wu and Xu, is extended by Chen et al. [
97] to develop the concept of proportional hesitant fuzzy linguistic term sets (PHFLTSs). In this paper’s methodology, group-decision making linguistic representations are modelled considering both, the individual hesitancy of individual assessments and the proportional information of its aggregation.
Definition 7. [
97]:
Let be a linguistic term set. Let be HFLTSs given by a group of experts. A PHFLTS for a linguistic variable formed by the union of , namely , is a set of ordered finite proportional linguistic pairs:where is a proportional vector and denotes the degree of possibility that the alternative carries an assessment value provided by a group of experts with the condition that and , ().
Example 4. Letbe the four HFLTSs introduced in Example 1, representing the opinion of 4 experts over an alternative . We assume all four have equal voting power. The PHFLTS formed by the union of these four HFLTSs is:Similarly, if we want to represent only the union ofand, corresponding to the two experts of group A, as in example 3, then the resulting PHFLTS would be: 2.4. The Proposed Method
In this study, we develop a decision support framework combining AHP with an extended version of fuzzy linguistic TOPSIS with EHFLTSs with the aim to assess the influential factors governing the strategic location decision made by European multinational enterprises from the energy sector, in
Section 3. In the proposed method, firstly, a classic AHP is performed to obtain the relative importance of the identified first-level criteria and secondly, an extended version of TOPSIS with fuzzy linguistic information is used to obtain a rank of the sub-criteria. Hence, in this context, sub-criteria are treated as the alternatives of the MCDM context presented in
Section 2.1.
Let be a group of experts, be a coherent set of criteria and let represent the set of all sub-criteria. Also, let , with , be the aggregated relative importance coefficient of each criterion and , with , denote the relative importance of each sub-criterion with respect to its corresponding main criteria group. A linguistic term set (LTS), , with cardinality is used by experts to express their judgements, such that . Then, the proposed method can be divided in the following five steps:
Step 1. Analyzing the criteria and sub-criteria and forming a hierarchical structure: The first step is to clearly define the group decision-aiding situation, the main goal and gather the criteria and sub-criteria needed for the problem throughout a systematic literature review process. Then, following the AHP steps, the goal is situated at the top and the main criteria on the subsequent level. The lowest level is composed by the set of all sub-criteria.
Step 2. Getting the criteria weights by means of AHP method: From the judgements group , pairwise comparison matrices are built. Each expert makes comparisons between two criteria to determine the dominance of one over another, using the fundamental scale of absolute numbers 1–9. Experts are asked questions. Individual pairwise comparisons are used to obtain the individual relative importance of the main criteria, using the proposed eigenvalue method. Individual results are aggregated to obtain the corresponding weights, .
Step 3. Elicitation of the individual and aggregated sub-criteria opinion: The group of experts is asked to assess the set of sub-criteria, , identified in step 1 with respect to the relative influence or power the sub-criteria has in the decision problem. The survey is designed so they can express hesitancy in their answers. The individual judgements are modelled using HFLTSs on the linguistic term set . The group evaluation is formed by the union of these HFLTSs, where all experts carry the same weight and the overall evaluation is represented by EHFLTSs. The proportional information is simultaneously calculated, by means of PHFLTSs.
Step 4. Computing the relative weight of each sub-criteria by means of TOPSIS: first, along with the experts, we need to identify the relative positive and negative ideal solutions and then, we calculate the distances of each sub criteria normalized vector to the positive and negative ideal solutions, respectively. Following TOPSIS traditional procedure, based on these distances the closeness coefficient is obtained for each and the resulting is computed. The are ranked within each criteria group, , according to
Step 5. Integration of AHP and TOPSIS results: Combining the criteria weight, , with the relative importance of each sub-criteria, , a final ranking is obtained.
The proposed steps are illustrated in
Figure 2.
3. Results
In this section, we apply the steps of the proposed research methodology and present the results obtained at each phase.
3.1. Analyzing the Criteria and Sub-Criteria and Forming a Hierarchical Structure
A set of relevant eligible literature on strategic decisions related to site location decision problems faced by business with similar characteristics to the MNEs of the energy sector or with related products or services was performed with a systematic literature review process. Firstly, we selected the articles published only by academic peer-reviewed journals, written solely in English, containing the keywords such as “location”, “decision(s)”, “factor(s)” and “business” and not older than 5 years. Filters were used in Web of Science and Scopus. Secondly, we read all the titles and abstract papers to reject the ones, whose objectives and topics were not related to the purpose of this particular research. Thirdly, we read the resulting papers in detail and tried to identify and distinguish the key explanatory factors for site location. Furthermore, a more detailed literature review on specific journals using additional more precise keywords such as “municipalities” or “energy business locations” or “renewable energy decision-making” was performed. Finally, the authors organized a workshop with academics and practitioners to share the results of the literature process and performed some final adjustments in the criteria’ classification or description in order to better adapt the results to the particularities of the location-decision problems of energy multinational enterprises. In the following paragraphs we give a brief explanation of the main criteria extracted from the previous procedures.
3.1.1. Characteristics of the City’s Host Country or Region
This category refers to the main geographic, economic, social and political factors that characterize the city’s host country or region. The sub-criteria corresponding to this group is described as follows:
Home-Host Country Distance: The geographic distance between the MNE headquarters or its main area of operations and the city (new location)
Host country GDP per capita: The country’s economic output per person.
Host country level of welfare state: The degree to which the city’s host country (or region) protects and promotes the well-being of its citizens in terms of as health, equal opportunities, equitable distribution, etc.
Host country political stability perception: The perception of a country’s political order and system (e.g., safe, predictable, uncertain, with several political coups, etc.).
Host country’s corruption perception: The perceived level of public sector corruption, i.e., the misuse of public power for private benefits.
3.1.2. City Structural Factors
These are the predominant characteristics that distinguish one city from another in terms of long-term stablished or structural factors. The set of sub-criteria corresponding to this criterion is the following:
The city size: The city size in terms of inhabitants living in the full municipal area or urban system.
City’s cultural and language distance perception: The perceived differences between the values, communication styles and language of the city and the MNE’s own organizational culture.
City’s climate characteristics: The main features of the predominant climate of the city (temperature, rain, wind, etc.).
City’s connectivity—infrastructural features: Transport infrastructure, in terms of service quality, rail and road networks, public transport level, airport connections, etc., both within the city and with other cities.
City’s reputation, image and prestige: The business sector’s long-term impression regarding the city and its “positioning” efforts in comparison with other cities.
3.1.3. The City’s Government and its Policies
The conditions and environment offered by the city government in terms of doing business. The identified sub-criteria are:
City government degree of transparency: Transparency of the city government in terms of holding public officials accountable, fighting corruption, opening decisions and law to discussion and government meetings with the press and public.
City government bureaucracy level: The friendliness and ease (or the opposite) of the city’s regulatory framework for setting up new businesses. For instance, are administrative procedures for starting a new enterprise in the city highly complicated?
Access to financial support provided by city government: The financial support and aid (e.g., tax incentives) given by the city government for the creation or development of new ventures or projects.
City government support to public-private partnerships (PPP): The extent to which the city government promotes PPPs, creating a good regulatory environment for collaborations.
3.1.4. Socioeconomic Context of the City
This refers to the quantitative economic features and subjective aspects of the city’s economic and social environment. The identified sub-criteria are:
City GDP per capita: The city’s economic output per person.
Municipal economic budget: The capacity of the city’s annual budget revenues to cover expenditures and finance all type of necessities for the city.
City R&D expenditure: The relative importance of research and development expenditure in the city’s annual budget.
The service economy of the city: The city’s provision of services such as financial services, information technology, retail services or education.
Stakeholders’ pressure in the city: The perception of the presence of stakeholders in the city and their influence on the way businesses operate in the city.
3.1.5. Environmental Conditions of the City
It reflects the progress of the city towards a greener and more environmentally sustainable model. The sub-criteria corresponding to the environmental criteria are:
Citizens’ environmental awareness: The awareness and understanding of the city’s citizens regarding the environment and environmental problems.
City’s air quality: The air quality of the city and levels of urban air pollution.
Degree of city transition to renewables: The extent to which the city relies on renewable energy sources for electricity generation or heat supply.
3.1.6. Market Conditions for Energy Firms in the City
The specific market conditions and agglomeration effects related to the services and products offered by the energy MNE. The sub-criteria corresponding to this group is described as follows:
Competition intensity in the city: The concentration of competitors in the city, who offer similar services to those of the MNE.
Pool of skilled labor in the city: The availability of specific human resources needed by the MNE to implement its services in the city.
Access to needed suppliers: The accessibility of the inputs and materials needed to implement or construct the services offered by the MNE.
City’s potential customers: The number of potential clients, living in the city, willing to buy the MNE green services or products.
City’s degree of know-how, innovation and technological exchanges: The innovative environment of the city in terms of know-how and technological best practices transfer between economic agents such as universities, clusters, R&D departments, etc.
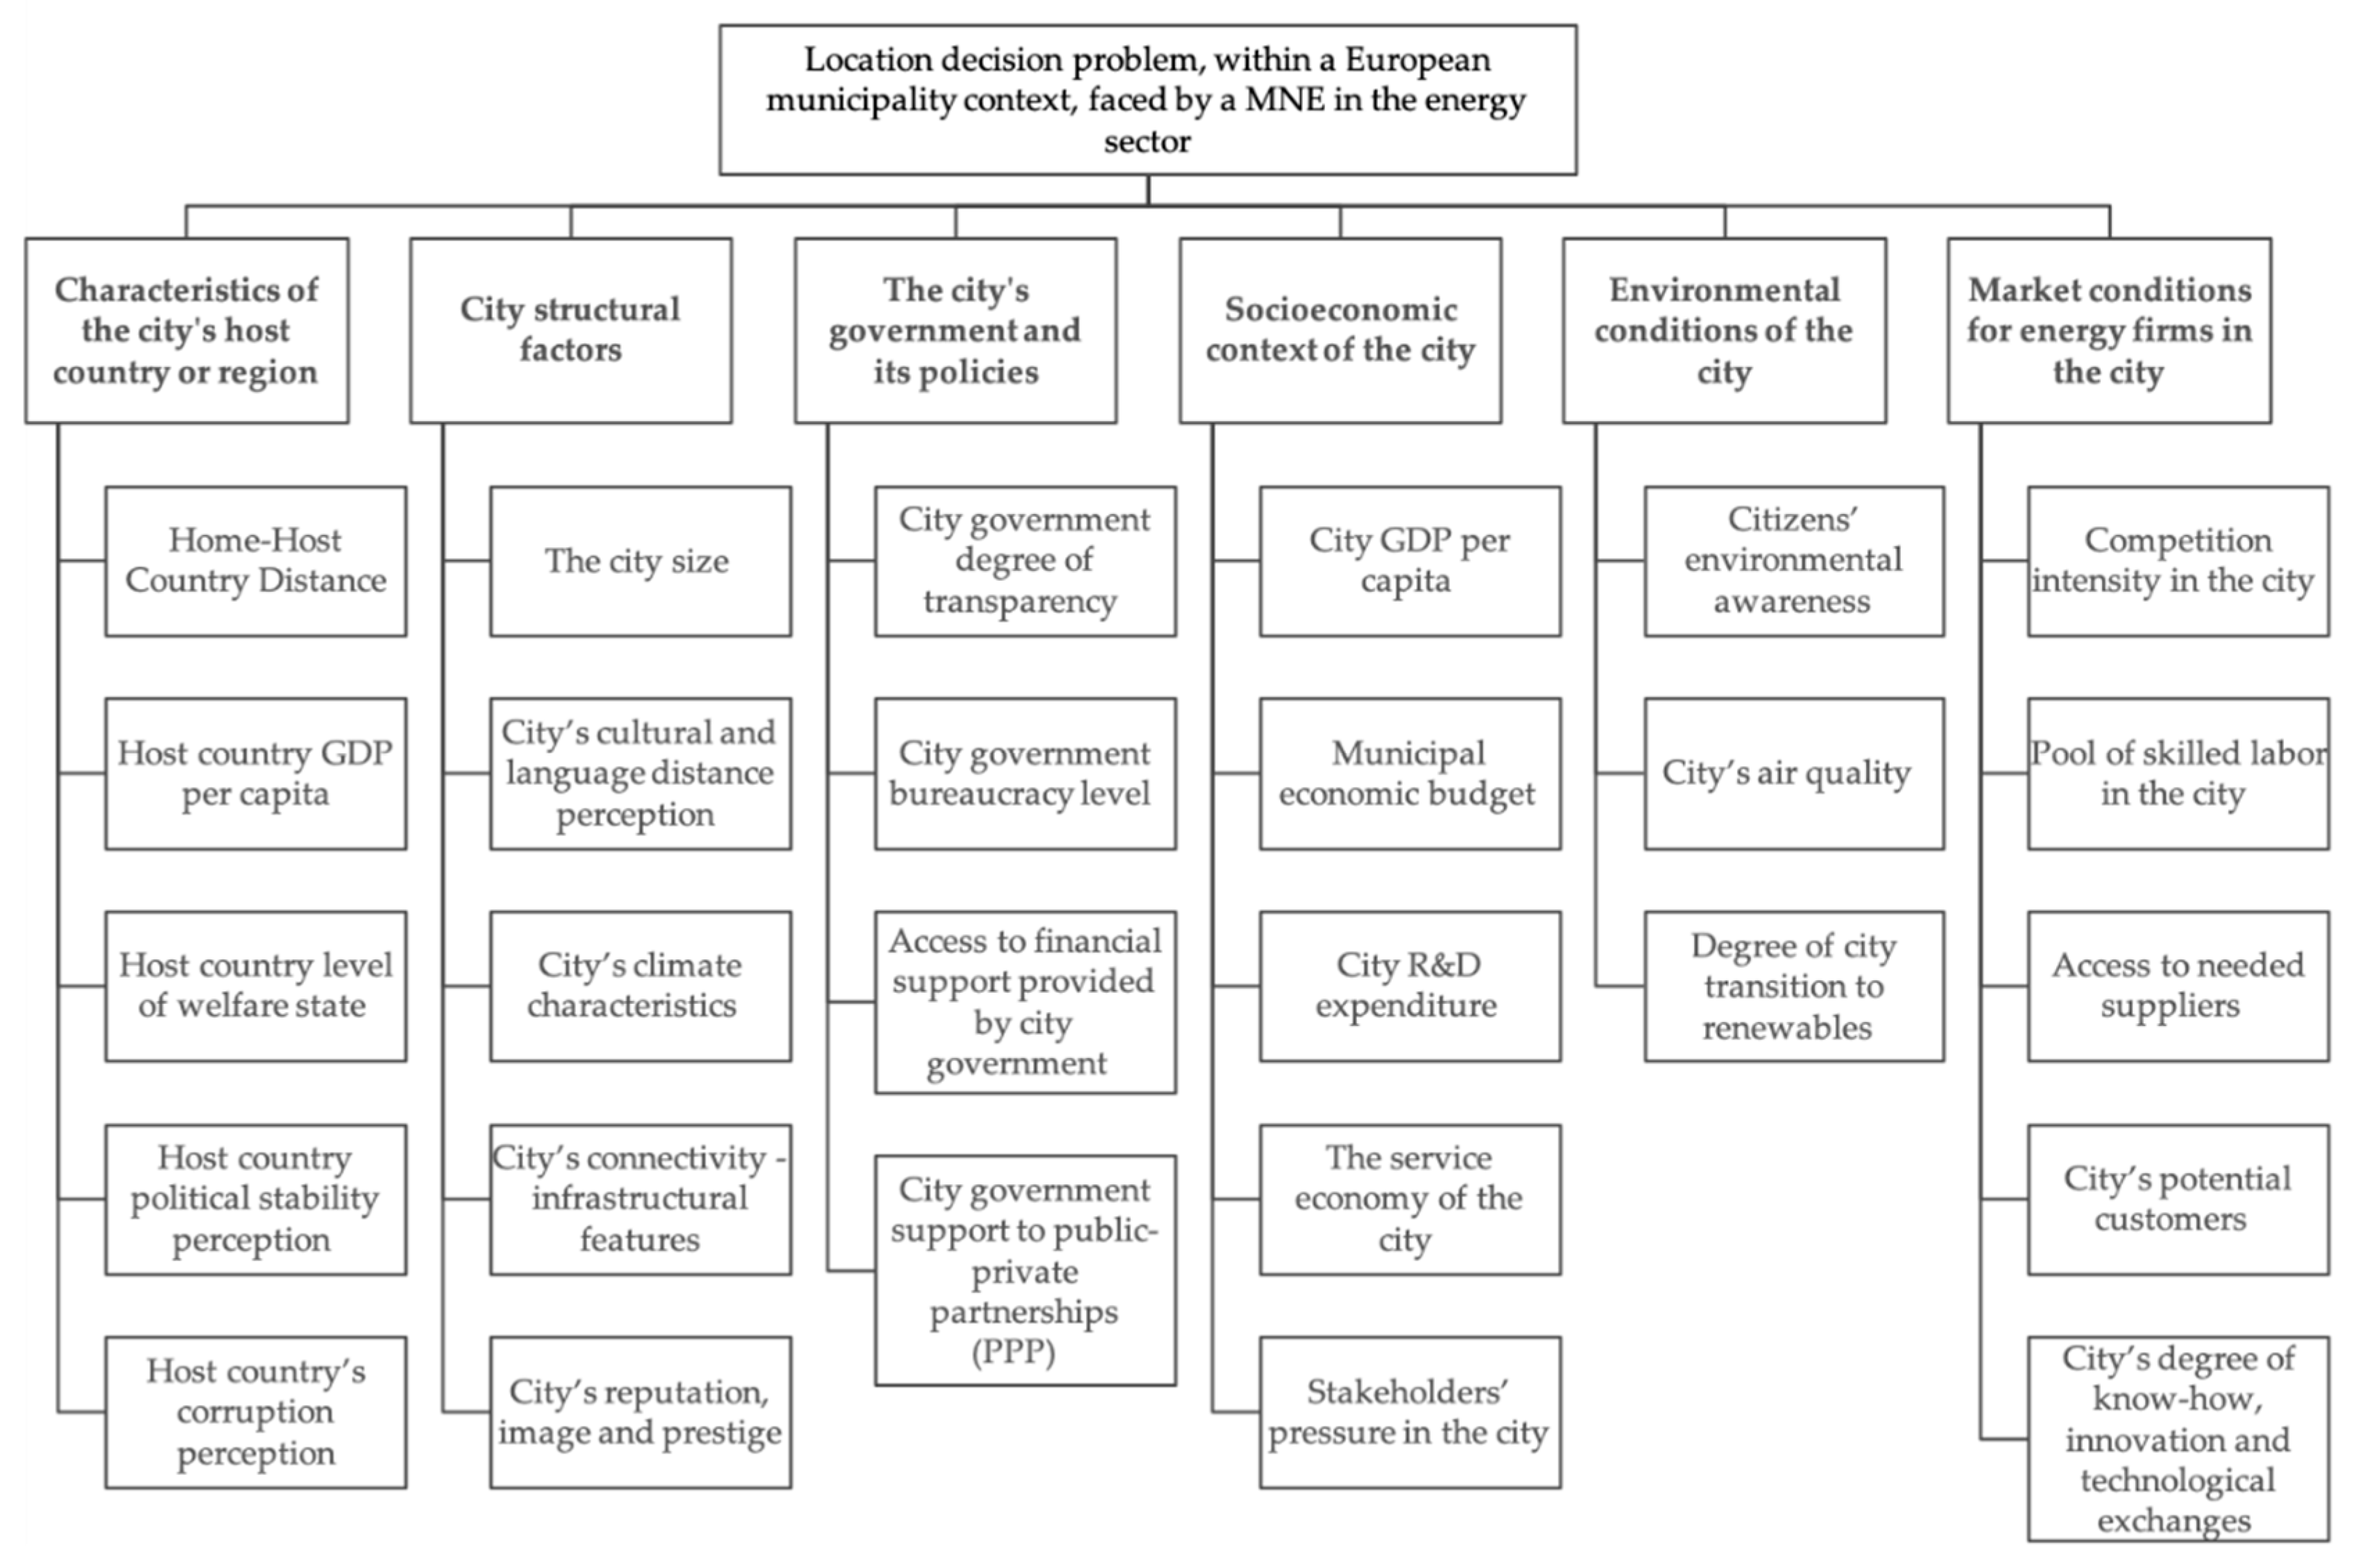
Table 2 summarizes the resulting list of six criteria and its corresponding sub-criteria, resulting from literature review and experts and practitioners’ feedback. In
Figure 3, following the first steps of AHP, a decision framework is structured as a hierarchy from the top with the goal of the decision.
In the first (or top) level, we specify the overall goal of the decision-makers, which are the MNE of the energy sector, i.e., choosing a new European municipality to implement its services. The MNE selects the best possible city (or municipality) among a given set of alternatives considering multiple criteria. In the second level of the hierarchical structure, we find the six main criteria governing the complex location decision, which have been obtained after a systematic literature review process and validated by two working sessions with practitioners and academics from the field. In the third level, the sub-criteria are included. Each criterion is explained by several sub-criteria (ranging from three to five sub-criteria per criterion) and the framework is composed by a total of 27 sub-criteria. It is relevant to highlight that the fact that some sub-criteria are intangible attributes (such as, city government bureaucracy level), while others are quantitative in their nature (for instance, city size).
3.2. Getting the Criteria Weights by Means of AHP Method
Once the research framework is constructed, ten experts with abundance professional services in the energy sector and having more than ten years’ experience and company managers were chosen to participate in the AHP survey. They were contacted by telephone, and in some cases, the authors could personally meet the respondents in person. The purpose of the study was clearly explained to all of them. The interviews were designed and facilitated in such a way that respondents naturally used simple or complex linguistic expressions of a given linguistic term set to express their opinions. With a half a dozen or eight responses from experts gathered, the methodologies proposed in the following paragraphs are consistent and stable [
57]. The number of experts considered for this study is enough as accumulated knowledge in top strategic positions in multinational enterprises in the energy sector is concentrated in few people.
The target companies have the following particular characteristics: they are all well-stablished companies founded before the nineties; headquarters are not necessary placed in big cities or European capitals, their growth is a result of first, organic growth and then, mergers and acquisitions, a vast majority were initially owned by the state. Some still have a public shareholder, their current revenues are usually thousands of millions of Euros, they all operate in the international market, beyond Europe.
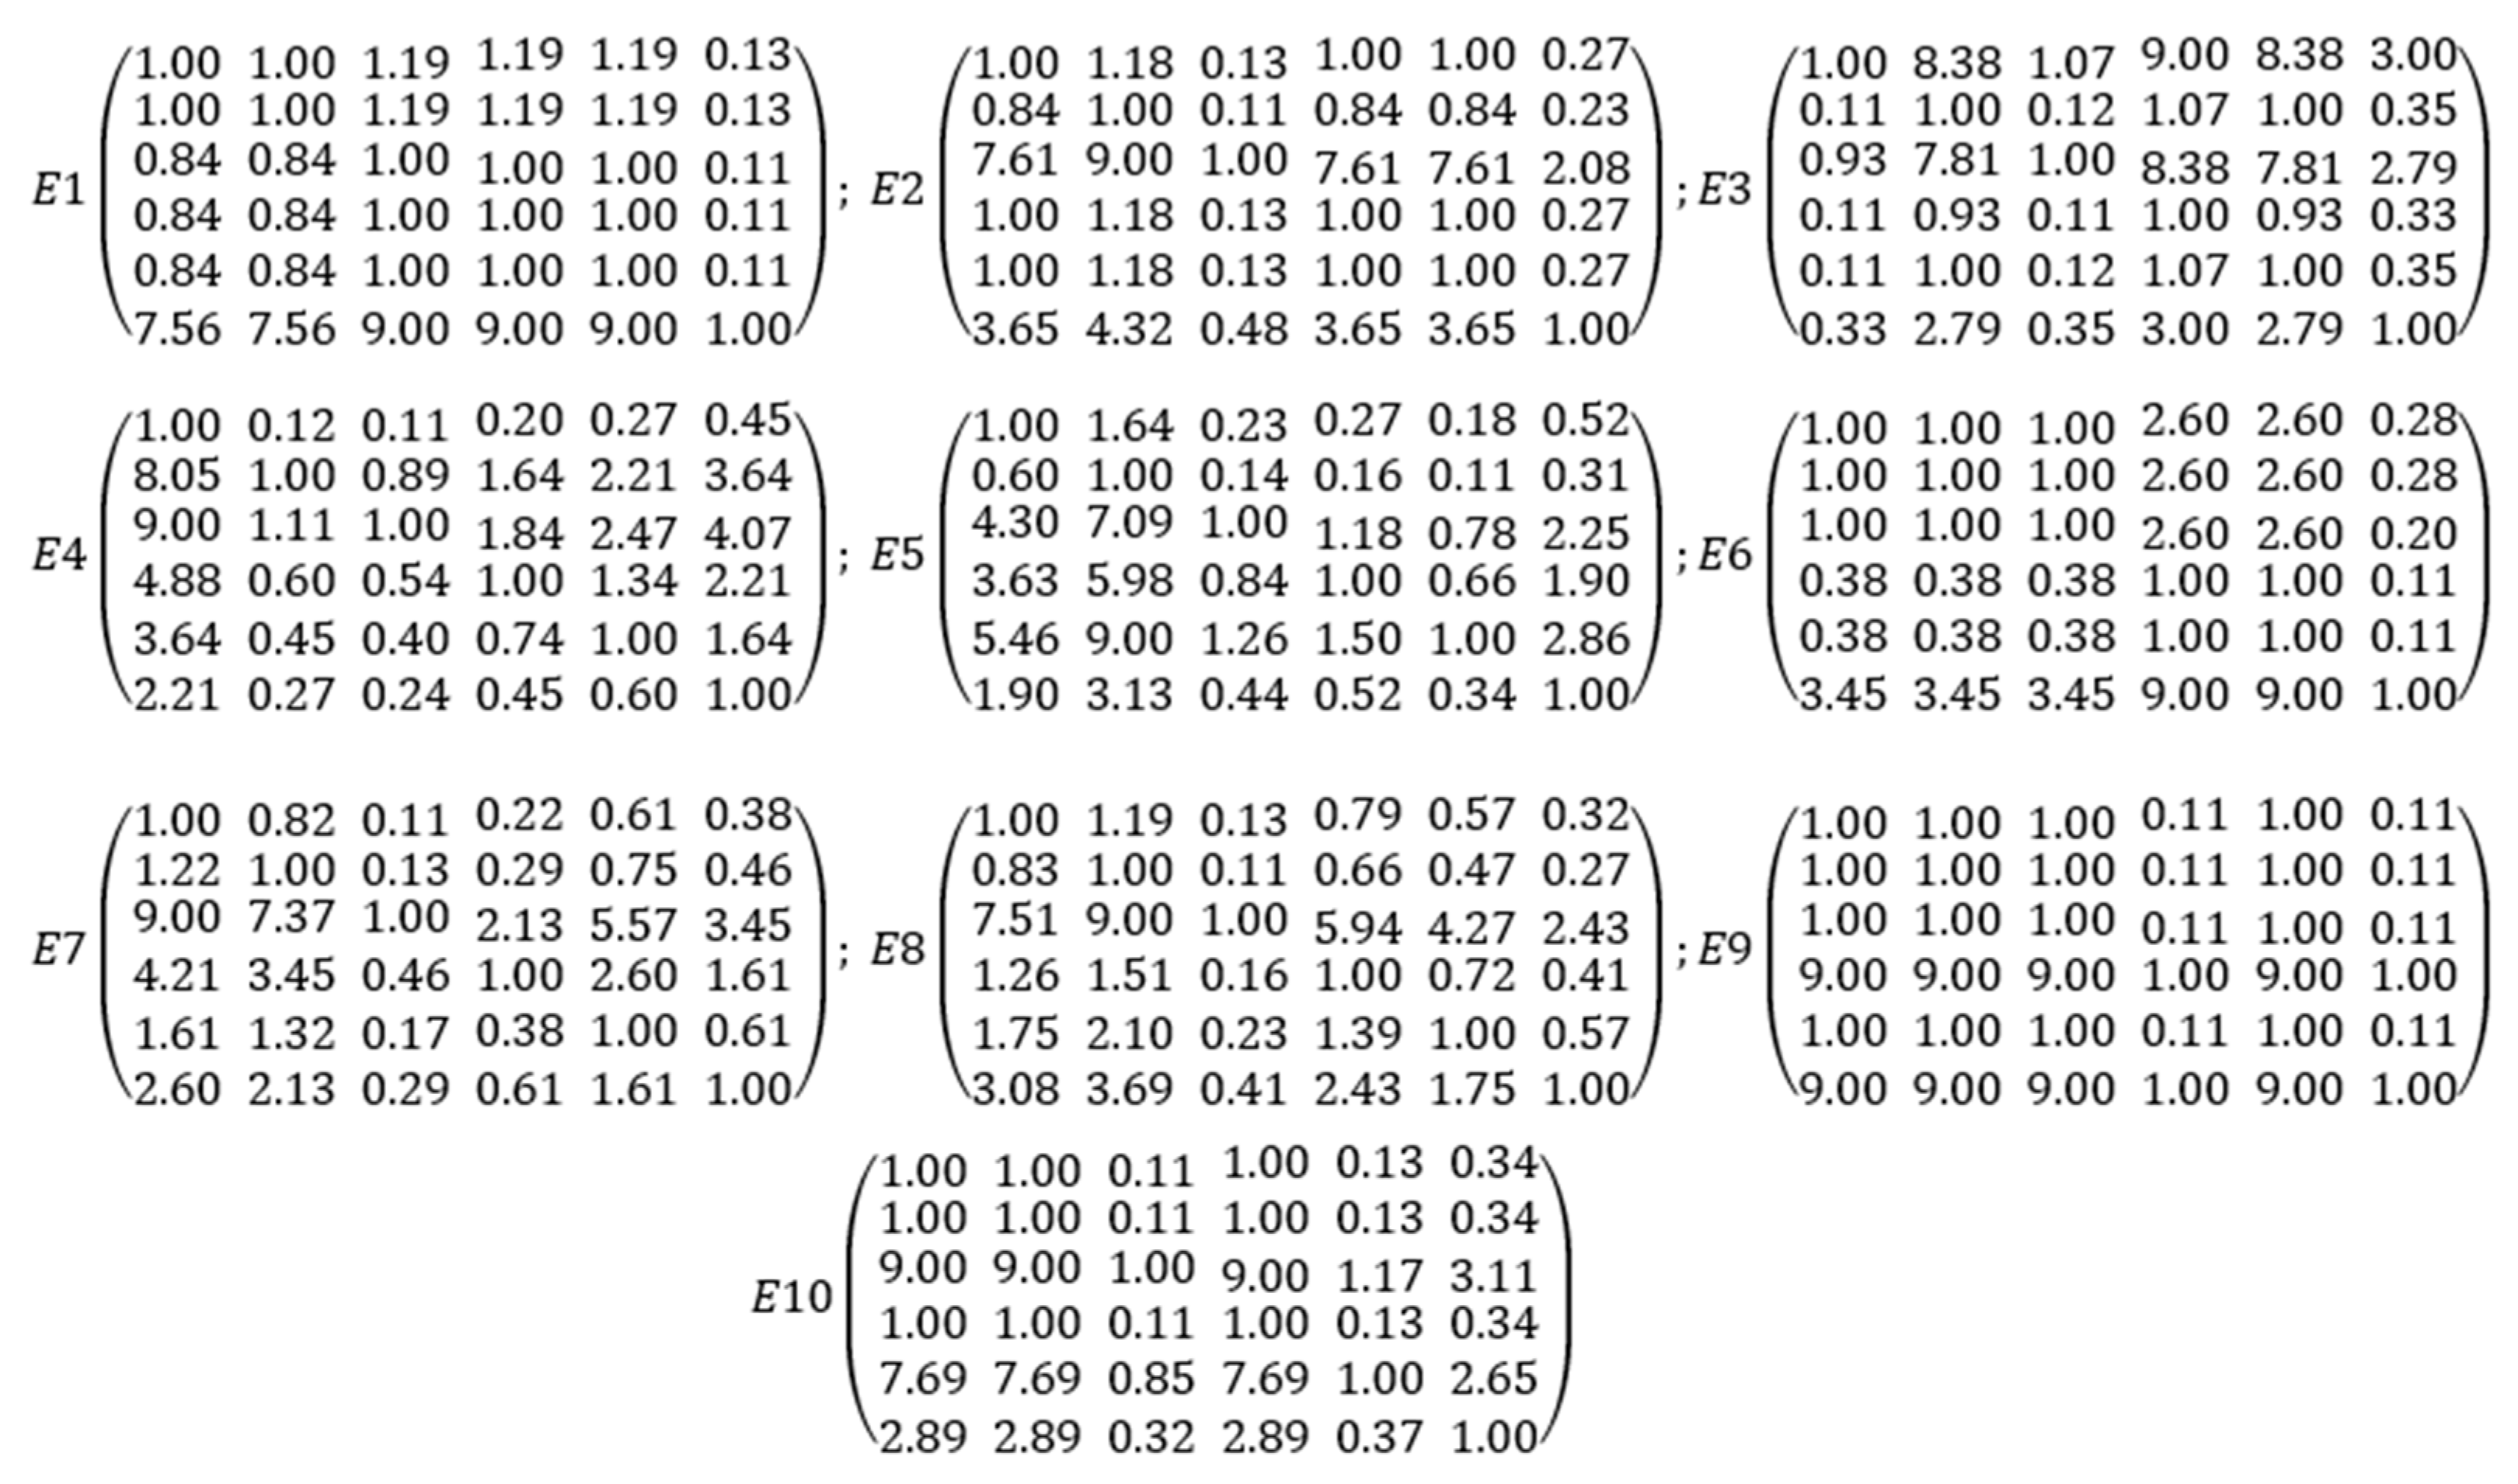
These experts were asked five pairwise comparison questions of the type: “Which of the two criteria being compared (e.g., market conditions in the city or socioeconomic context of the city), is considered more important by your organization when looking for a new European city to expand your green and renewable services?”. We took the sixth criteria of market conditions for the energy firms as the basis to build the five questions. For each question, we specifically asked respondents to decide a numerical value for assessing the importance of their preference judgement in each of the compared pairs. We used the Saaty’s pairwise comparison scale of 9 numerical values. Hence, if an expert considered that market conditions in the city is very strongly more important than city host country characteristics, the intersection row “market conditions” and column “city host country characteristics”, in the pairwise comparison matrix, will contain a value of 7. The reciprocal of this value (1/7) will be placed in the city host country characteristics—market conditions cell. Following the procedure in [
66], explained in
Appendix A, the resulting ten consistent multiplicative matrices in a ratio 1/9–9 of the pairwise comparisons of the criteria given by the each of the ten respondents are shown in
Figure 4.
Following the AHP procedure, a priority vector is obtained for each of the 10 matrices and the resulting individual criteria weights are computed. A crisp or classical AHP is performed since we do not expect to find uncertainty or vagueness in the comparison judgements of the main criteria. This is in line with the obtained results, i.e., individual criteria weights are similarly distributed. Moreover, since all ten experts have equal voting power, we calculate the average to obtain the resulting weights. In the
Table 3, the resulting average weights for this group of experts are illustrated.
3.3. Elicitation of the Individual and Aggregated Subcriteria Opinion
Once the weight of main criteria is obtained, the experts are asked to assess the degree of importance of the 27 sub-criteria. This linguistic information is first modelled with HFLTSs.
Table 4 shows the linguistic expressions given by the 10 experts based on the linguistic term set S
and ? denotes total hesitancy, i.e., ? = {N, L, S, V, E}.
The individual assessments are aggregated, for each sub-criterion, by means of EHFLTSs, as indicated in the last column of
Table 4. As explained in the proposed method, the proportional information is simultaneously calculated, by means of PHFLTSs for each sub-criteria, as shown in
Table 5. Each row denotes the five-dimensional proportional vector corresponding to the EHFLTSs of each sub-criterion.
3.4. Computing the Relative Weight of Each Sub-Criteria by Means of TOPSIS
Based on TOPSIS methodology, we first need to identify which are the positive ideal solution (PHFLTS-PIS) and the negative ideal solutions (PHFLTS-NIS). Although authors are aware of the rank reversal problem, due to the systematic literature review process carried out and the fact that the strategic location decision problem does not deal with highly dynamic or rapidly changing city variables, the relative positive and negative ideal solutions are considered the best choice by the experts. Following the procedure explained in
Appendix B and based on
Table 5, the PHFLTS-NIS is set to be the host country GDP per capita, which is modelled by (0.10, 0.55, 0.35, 0.00, 0.00) and the PHFLTS-PIS corresponds to the city’s potential customers, which is modelled by (0.00, 0.00, 0.30, 0.35, 0.35).
Secondly, for each sub-criteria PHFLTS we compute its cosine distance function to the defined PHFLTS-NIS and PHFLTS-PIS, respectively. The set of distances, for each sub-criteria, are detailed in
Table 6. Both distances are used simultaneously to compute the closeness coefficient, shown in the last column of
Table 6. A sub-criterion is closer to the PHFLTS-PIS and farther from PHFLTS-NIS as this coefficient approaches 1. Since PHFLTS-NIS corresponds to the host country GDP per capita vector and the PHFLTS-PIS corresponds to the city’s potential customer vector, it is straight forward that sub-criteria city’s potential customers has a coefficient of 1 while the value for the sub-criteria host country GDP per capita is 0. Among the rest of the sub-criteria, according to cosine similarity function, the lowest distance to PHFLTS-PIS is 0.10421017, which corresponds to access to financial support provided by city government, and the highest distance to PHFLTS-NIS is 0.78504609, which corresponds to city government support to public-private partnerships.
Based on the relative closeness coefficient, we distribute the partial weight of sub-criteria within each group. This means that the percentages corresponding to each criteria group sum up to 100%. The sub criteria are then ranked within each criteria group in column 2 of
Table 7,
Table 8,
Table 9,
Table 10,
Table 11 and
Table 12.
3.5. Integration of AHP and TOPSIS Results
Combining the average weights of the main criteria with the relative importance of each sub-criteria within each group, a final ranking is obtained. The ranking in descending order is illustrated in
Table 13.
According to the results of
Table 13, sub-criteria related to the city’s government and its policies, which represent an aggregated importance percentage of 30%, are all placed in the TOP 5 positions; 2nd, 3rd, 4th and 5th respectively in the ranking. This is in contrast to the 10% of relative importance of sub-criteria related to characteristics of the city’s host country or region, which are inherent to the municipality. Each one has an effect of less than 4%, being host country level of welfare state and host country GDP per capita factors of practically no impact on the decision-making process. Host country political stability perception is the highest importance factor of this group, with a 3.88% of influence.
This fact suggests the vital importance and influence of city’s governance policies and decisions over multinational firms behavior. Policies directed to provide some type of financial incentives, offer mentorship/accelerator programs or reduce the administrative procedures could have a great impact on the location decision of an energy multinational firm. These actions have a higher influence on the location decision of these companies than the economic power of the host country or the perceived distance in terms of cultural or languages issues.
As can also be seen in
Table 13, city’s potential customers has resulted in the highest influential sub-criteria in the location-decision. The rest of the sub-criteria related to market conditions for energy firms, which are access to needed suppliers, pool of skilled labor, city’s degree of know-how and competition intensity in the city are placed in the 8th, 9th, 11th, 19th positions of the rank, respectively. It is important to highlight that customers and suppliers’ environments are more relevant than competition in the city.
In addition,
Table 13 illustrates the fact that the three sub-criteria included in environmental conditions of the city are also placed relatively high in the ranking. Decision makers have expressed their preference for cities which are in a process of transitioning to renewables. This sub-criterion has an influence of 4.10%, resulting higher than municipal economic budget, city GDP per capita or infrastructural features. Furthermore, they prefer cities where citizens show an environmental awareness attitude. Actually, this fact has a slightly higher voting power than city’s degree of knowhow, innovation and technological exchanges. Experts also did not express a preference for cities with high R&D expenditure, which is placed in the last top 3 sub-criteria. This might suggest that they do prefer a municipality which offers specific financial support for their sector or related to their products/services or agility in the bureaucratic processes rather than an innovative city with plenty of R&D hubs.
4. Discussion
When business managers of energy multinational enterprises have to decide which European city is best to go and sell its green services and products, they are clearly facing a decision which involve multiple criteria and usually do not find a unique optimal solution. The relevant factors guiding this decision-making process is usually unknown by the city leaders. Knowing the determinants of this process, would allow policy makers to better take actions, in advance, aimed at improving their attractiveness to energy enterprises.
In the existing literature, many techniques for assessing the determinants of location decisions are based on the use of quantitative variables measured in numbers [
17,
30] or qualitative variables modelled and categorized by crisp numbers [
32]. These traditional methods of gathering information cannot capture the hesitancy or imprecise nature of some linguistic variables. Besides, statistical methods such as multiple regressions [
14] are usually the predominant type of techniques found in location theories. In contrast, our novel approach to the location problem is based on a combination of AHP with a fuzzy linguistic TOPSIS, two multiple-criteria decision-making techniques, which have been proven to work well to solve similar business challenges [
80,
81,
82,
83,
84]. In general, MCDA approaches for criteria ranking or selection that apply an integration of AHP [
118,
119] and TOPSIS [
120,
121] methods consider either crisp or fuzzy attitudes, however, the methodology presented in this paper takes a hybrid position since we have combined both approaches. This makes the presented approach more realistic and better adapted to the specific problem considered. Considering the background and expertise of energy experts, the main five criteria should not be subject of ambiguity, whereas the uncertainty and vagueness inherent in the respondents’ evaluations with respect to the sub-criteria and has been incorporated through the use of PHFLTSs in the modified TOPSIS.
Our results indicate that multinationals in the energy sector consider city aspects related to government and market conditions key when they make a location decision in the European municipalities context. These two criteria represent, according to this study, fifty percent (50%) of the decision. Specifically, the top five sub-criteria which are considered the most valuable for location strategic decisions in multinational enterprises in the energy sector are the potential customers of the city (8.07%), access to financial support provided by city government (7.96%), city government support to public-private partnerships (7.93%), city government degree of transparency (7.27%) and city government bureaucracy level (6.84%). In contrast, only a maximum of ten percent (10%) of the decision’ weight is due to the city’s host country characteristics and city structural factors, which are decision factors over which city governments have less influential power.
As compared to the conclusions reached by Rubalcaba and Gago in their study applied to the business services sector [
98], the importance of traditional location factors (demand, supply and market factors) are, in general, less relevant factors in the energy sector. It is true that the potential customers of a city is the top sub-criterion. Another interesting point is that skilled labour is considered less important than the impact of a city’s government and policies, and this a novelty if it is compared with other studies [
19,
20], where this was a very important variable for location decisions. Moreover, the authors have also incorporated all factors related to the triple bottom line assumption of sustainability and these are gaining importance in the final rank compared with other recent decision support frameworks [
21,
114,
122] as well. Actually, the degree of city transition to renewables is above access to needed suppliers and pool of skilled labour in the city. Besides, according to our results, citizen’s environmental awareness is also a preferred sub-criterion for multinationals, surprisingly, much more than city R&D expenditure, host country GDP per capita, a city’s reputation and prestige or competitive intensity in the city. This contrasts with other specific research results aimed at understanding manufacturing plan location selection [
19] which indicates a minor impact of environmental issues on plant location decision.
A priori, it would seem like a city’s government has little to say about its potential customers as compared to the rest of sub-criteria directly related to government policies. However, municipalities are potential customers themselves and part of the demand of sustainable energy solutions for their public buildings and facilities. According to the results, PPP would seem an appropriate organizational tool to encourage these first public early-adopters. Public administrations should lead by example and show citizens and private companies the technical feasibility, economic viability and environmental impact of their interventions. Nowadays, with respect to local authorities developing specific financial supporting tools for businesses and citizens willing to become part of the demand, it seems that a major setback might cause the postponement of these initiatives to a longer term. Due to the unexpected outbreak of the Covid-19 crisis, public administrations financial priorities will probably dramatically change in the short term and their limited resources will be allocated to avoid the breakdown of SMEs and maintain the employment rate. Nonetheless, meanwhile, in the short or medium term, local governments could offer tax incentives to both individuals and businesses to stimulate the demand of green and sustainable services.
With respect to the limitations of the method, the authors identify some aspects related to the techniques used. From a technical point of view, the limitations of the proposed method are basically concerned with the main issues that frequently emerge from the TOPSIS method. The use of TOPSIS for sub-criteria linguistic assessments is based on a pre-defined set of sub-criteria. It is well known that one of the main limitations of the fuzzy TOPSIS method can be the rank reversal problem when the positive and negative ideal solutions are set to be the best and the worst choices considered by the experts and not the absolute ones. Nevertheless, the relative ideal solutions were identified as the most adequate and appropriate by the experts who participated in this study. As future research, we will compare different options for the positive and negative ideal solutions to analyse differences and the reliability of the results. Another direction of research will be the study of aggregation functions and distance measures on PHFLTSs within the area of consensus reaching methods in GDM.
Moreover, the proposed framework is based on expert knowledge gathering. This means that it works well when the information related to the location decision processes is centralized and deployed mainly by a group of experts or managers. Hence, the techniques used for the data gathering process and the analysis should be modified and adapted if the knowledge and expertise needed for a specific multi-criteria problem was held by a large amount of people and required Big Data.
From a practical point of view, the obtained results are framed within the context of location decision-making in European municipalities. If the tool was used by political leaders from other continents, we should first review if the set of criteria and sub-criteria would be the same in another geographical context. Location determinants vary to a great extent depending on the geographical area considered and we might find differences in the results if the study was done, for example, in underdeveloped countries. Similarly, the obtained results meet the needs and priorities of the multinationals of the energy sector. If other researchers, for instance, were interested in analysing the preferences of IT companies which seek to expand their services to new European cities, they might need to adapt, modify or add the questions posed to the experts in the context of IT. Moreover, the proposed method would need to be adapted to this high dynamic sector before replication. Special attention should be given to the choice of the ideal solutions in the TOPSIS phase since the use of the absolute ideal PHFLTSs would seem more appropriate a priori. Comparing location results of different sectors within the European context is an interesting direction for future work as well.
5. Conclusions
The present paper presents a dual contribution, one from an academic perspective and one from a managerial point of view. First of all, it contributes to the existing literature, filling a theoretical gap on location theories, by providing a new MCDM framework specifically for the energy sector, combining AHP and fuzzy TOPSIS; secondly, it offers local public managers the possibility of understanding what exists behind energy company location decisions, more precisely, it explains what variables are more relevant for European energy firms looking for new sites to operate.
Due to the critical role that the reformulation of the policy strategy [
123] related to the energy sector can play at a municipality level [
124], the paper provides European city leaders with a framework that could help them make more data-driven investment decisions with regard to the attraction of MNE energy firms, which could create economic, social and environmental positive effects. The results, which were obtained from the perspective of multiple companies, highlight the value of certain city government policies, such as the financial facilities, the support for public-private partnerships, the level of transparency or the degree of bureaucracy on location decisions for energy multinational enterprises. Whereas, less controllable factors such as the economic situation of the city’s host country or city climate characteristics have little weight on the decision. Consequently, this paper shows the importance and the possible impacts of local government decisions and contributes to the development of more data-driven urban-policy making in Europe in the sustainable energy ecosystem.


