Regional Factors Driving the Deployment of Wind Energy in Spain


Faculty of Law and Social Sciences, University of Castilla-La Mancha, 13300 Ciudad Real, Spain
*
Author to whom correspondence should be addressed.
Energies 2020, 13(14), 3590; https://0-doi-org.brum.beds.ac.uk/10.3390/en13143590
Submission received: 25 May 2020
/
Revised: 9 July 2020
/
Accepted: 10 July 2020
/
Published: 12 July 2020
(This article belongs to the Special Issue Economic Analysis of Wind Power in the EU)
Abstract
:There is significant regional heterogeneity in terms of relative positioning in relation to the issue of sustainability and, in particular, in relation to the implementation of renewable energy. For this reason, the aim of this work is to analyze whether these differences in attributes for each region are likely to condition the expansion of renewable energy production. In this paper, we focus on wind energy. Therefore, the evolution of the installed capacity of wind energy is studied for a set of Spanish regions over the period between 2004 and 2017. The results obtained confirm that, in effect, there are factors linked to investment and environmental knowledge capable of conditioning the deployment of wind energy at the regional level.

1. Introduction
The importance of achieving sustainable economic development and growth is a widely recognized issue today. In the European framework, objectives related to climate change and sustainability have long been part of European Union (EU) political priorities [1], with the specific purpose of achieving the total decarbonization of the European economy by 2050. Thus, the Lisbon 2020 Strategy included among its objectives a reduction in greenhouse gases (GHG) emissions by 20% compared to 1990 levels, an increase in the importance of renewable energy in the energy mix to reach the figure of 20%, and an improvement, also by 20%, in energy efficiency. More recently, the European policy framework for climate and energy in the period from 2020 to 2030 set a target of 32% for energy generated in the EU from renewable sources [2].
The above framework emphasizes the relevance of applying public policy strategies and instruments that support investment in renewable energy generation capacity [3,4,5,6,7]. The effectiveness and efficiency of these measures depend on the structure of relations among the productive, economic and political agents operating in the energy sector. Therefore, identifying the set of technical, market, economic and political drivers that characterize the deployment of renewable energy is both an academic and a policy relevant objective [8,9].
However, the planning and management of this subject has generally adopted a national dimension. Only recently has the importance of the role played by regions in the process of energy transition become relevant and also, in general, achieved the objective of sustainability [10]. Thus, the draft of the National Integrated Energy and Climate Plan 2021–2030 for Spain [11] claims greater involvement by regions to achieve the binding objectives for the EU following the signing of the Paris Agreement [12]. This official document expressly recognizes that policy coordination must reach not only the sectoral dimension but also the territorial dimension, guaranteeing the adequate participation and involvement of actors in all levels of administration (national, regional and local). Furthermore, this document indicates that regions play a fundamental role in this respect for their knowledge about the resources and strengths, competitiveness challenges and regional scientific and industrial potential. To this we must add the fact that, as recognized by the European Environment Agency, not all European regions are threatened with the same intensity by the effects of climate change [13].
Several academic papers have highlighted the importance of regions and cities in the fight against climate change [14,15]. Among the possible strategies to achieve this objective is the progressive elimination of the use of fossil fuels, and the parallel expansion of clean energy. In this regard, however, it should be noted that the realization of political objectives related to the presence of renewable energy in the energy mix is carried out on a national level, without extrapolation to a regional level in most cases. This implies that we can find very different situations in terms of regional energy balances, depending on the contribution made by each of these regions to the total production of electricity from renewable energy, compared to their own energy demand. Precisely, these different energy surplus and deficit scenarios are interesting to identify which regions require a greater investment in renewable energy production facilities and technologies according to their current and future energy needs, especially if the objective sought is to satisfy, as far as possible, the energy demand of a territory with local sources [16]. In line with that, the need for adopting a regional or local scope in the planning of renewable energy development is also justified because, thereby, it is possible to maximize efficiency in the use of the territory dedicated to renewable energy production facilities, minimizing, at the same time, the negative effects both in terms of landscape and preservation of ecosystems [17]. In this sense, it should be remembered that not all regions of a country share the same characteristics in order to implement different types of renewable energy. This means there are some more favorable regions for the implementation of wind farms, while others have more suitable conditions for the installation of solar power plants or biomass production [18].
Aside from the more technical issues related to climatology and orography, the development of renewable energy production in a given territory is the result of a complex process that also involves socioeconomic factors [19,20]. The environmental commitment that a community has and its particular vision about the relevance of tackling the process of energy transition towards less polluting energy sources can be a stimulus or, on the contrary, an obstacle, for the installation of renewable energy production facilities in the territory.
Similarly, territorial level planning for the implementation of renewable energy can be a powerful instrument in regional strategy carried out to boost the economic development of depressed areas, avoiding depopulation. In other words, renewable energy not only contributes to environmental sustainability, but can also be an important tool to achieve local social and economic sustainability by creating direct jobs, as well as stimulating the proliferation of auxiliary economic, industrial and service activities [21,22,23]. Related to this, investment in renewables also contributes very favorably to increasing the level of technological development of the territory in which it is located. In general, the data confirm that the innovative investment made by the renewable energy production industry far exceeds the average for the economy. For example, according to a report carried out recently by the Association of Renewable Energy Companies (APPA) for the Spanish case, the investment in R&D of the renewable energy sector represented in 2018 approximately 3.07% of the contribution to the GDP of this sector, when the Spanish average for the same year was 1.2% [24]. This greater technological effort in the renewable energy sector not only has a positive impact on the performance of its companies, but the knowledge generated through it is capable of moving to companies in other sectors thanks to the emergence of knowledge spillovers [25,26].
In the academic field, some studies defend the importance of descending to an infra-national level when assessing the design or planning of public policies to promote renewable energy. Most of them focus on the crucial role that cities play in the process of energy transition and its potential and effective contribution to the implementation of renewable energy [27,28,29]. From the methodological point of view, most of these studies use the case study technique [30,31,32,33], which makes it difficult to draw general conclusions on which factors condition the expansion of renewable energy from the regional perspective. On the other hand, there are hardly any papers that investigate this issue by performing econometric analysis applied to larger samples. The study in reference [34] estimates a spatial panel model on a sample of 19 Italian regions at nomenclature of territorial units for statistics (NUTS) 2 for the 2007–2013 period, with which they attempt to research which regional factors have conditioned the expansion of renewable energy, making special reference to the role played by public incentives. In addition, the authors in reference [35] use Greek regional units (the former prefectures, which correspond to a NUTS 3 level) to perform a cluster analysis, from which they identify five categories based on regional characteristics related to energy issue, and more specifically, to the number of plants and type of renewable energy and their respective power. The authors in reference [36] study the location of photovoltaic installations in the United Kingdom in the 134 existing regions in that country at NUTS 3 level. Their results indicate that demand for electricity, population density, pollution levels, household education level and housing types are some of the factors that condition the regional location of photovoltaic energy. Similarly, these authors also detect the existence of spillover effects between adjacent regions in this aspect. The authors in reference [37] detect this same neighborhood effect in photovoltaic installations for a sample of 400 German counties. In particular, these authors verify that variables such as housing density, ownership regime, and level of per capita income in the local environment are other determinants for the implementation of the renewable energy source.
In short, there are few works that have adopted a regional dimension in the study of the factors determining the process of renewable energy territorial expansion. Due to the incipient role played by the regions in this process, the truth is that a good part of these factors of regional attractiveness are not originally the result of a deliberate policy of promoting renewable energy in the territory, but the fruit of horizontal policies implemented to generically favor the productivity of the business sector and social welfare. However, once identified, these features may, in the future, be an important element of regional differentiation for the location of the renewable energy sector and may become the object of deliberate political decisions.
With the intention of contributing to the modeling of the deployment of renewable energies from a regional approach, which complements modeling on a national dimension, this study proposes the estimation of an econometric model to determine the installed wind power capacity based on a set of variables on a regional level. In order to do this, we will take as a reference the Spanish case, taking as a sample the 17 Autonomous Communities, in the period 2004–2017. The description of the model and the data used in the analysis are set out in the following section. Section 3 provides the main results of the modeling. Finally, Section 4 concludes.
2. Methodology and Data
Taking as a starting premise the importance of the regional approach in the planning process and dissemination of renewable energy, the objective of this work is to research the determinants for the installation of renewable energy plants in Spanish regions over the period 2004–2017 (See Supplementary Materials).
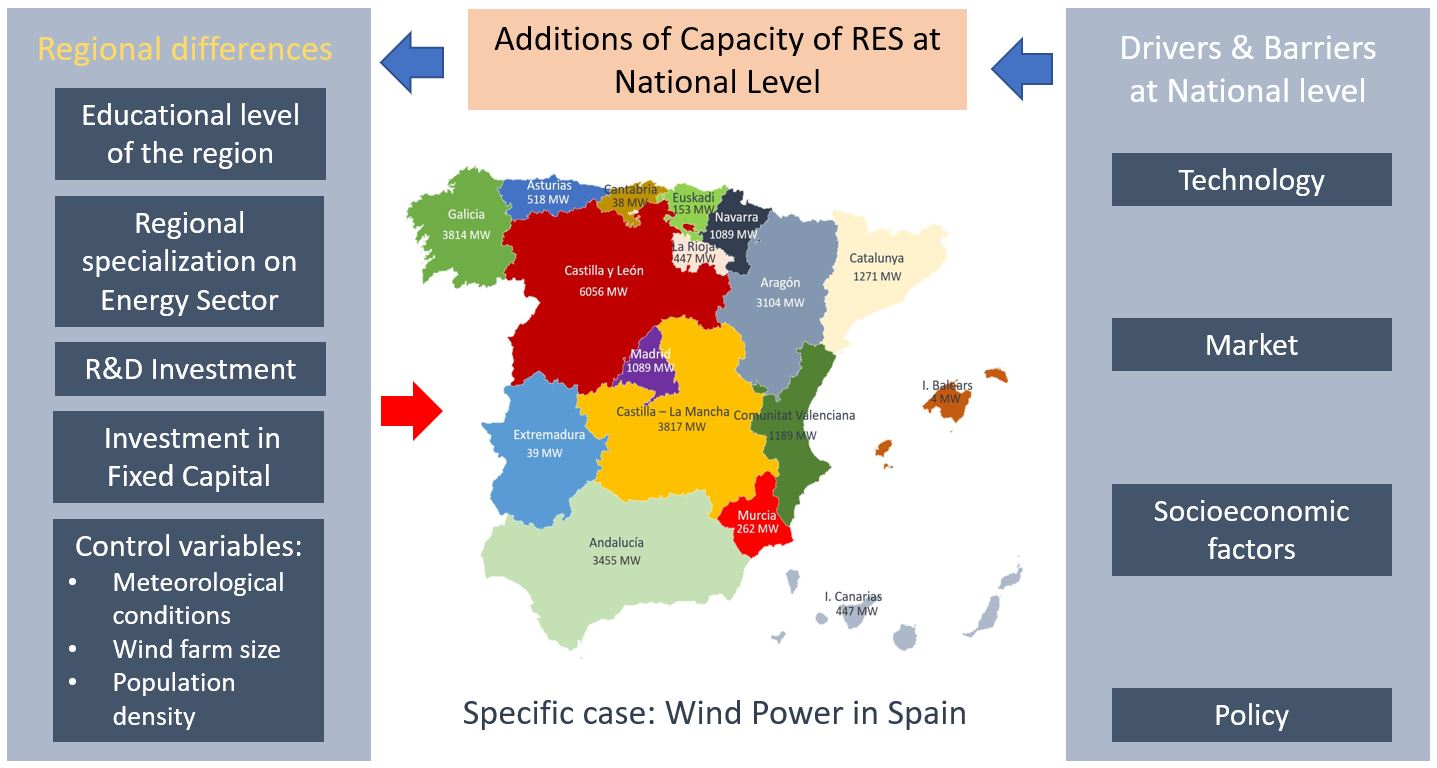
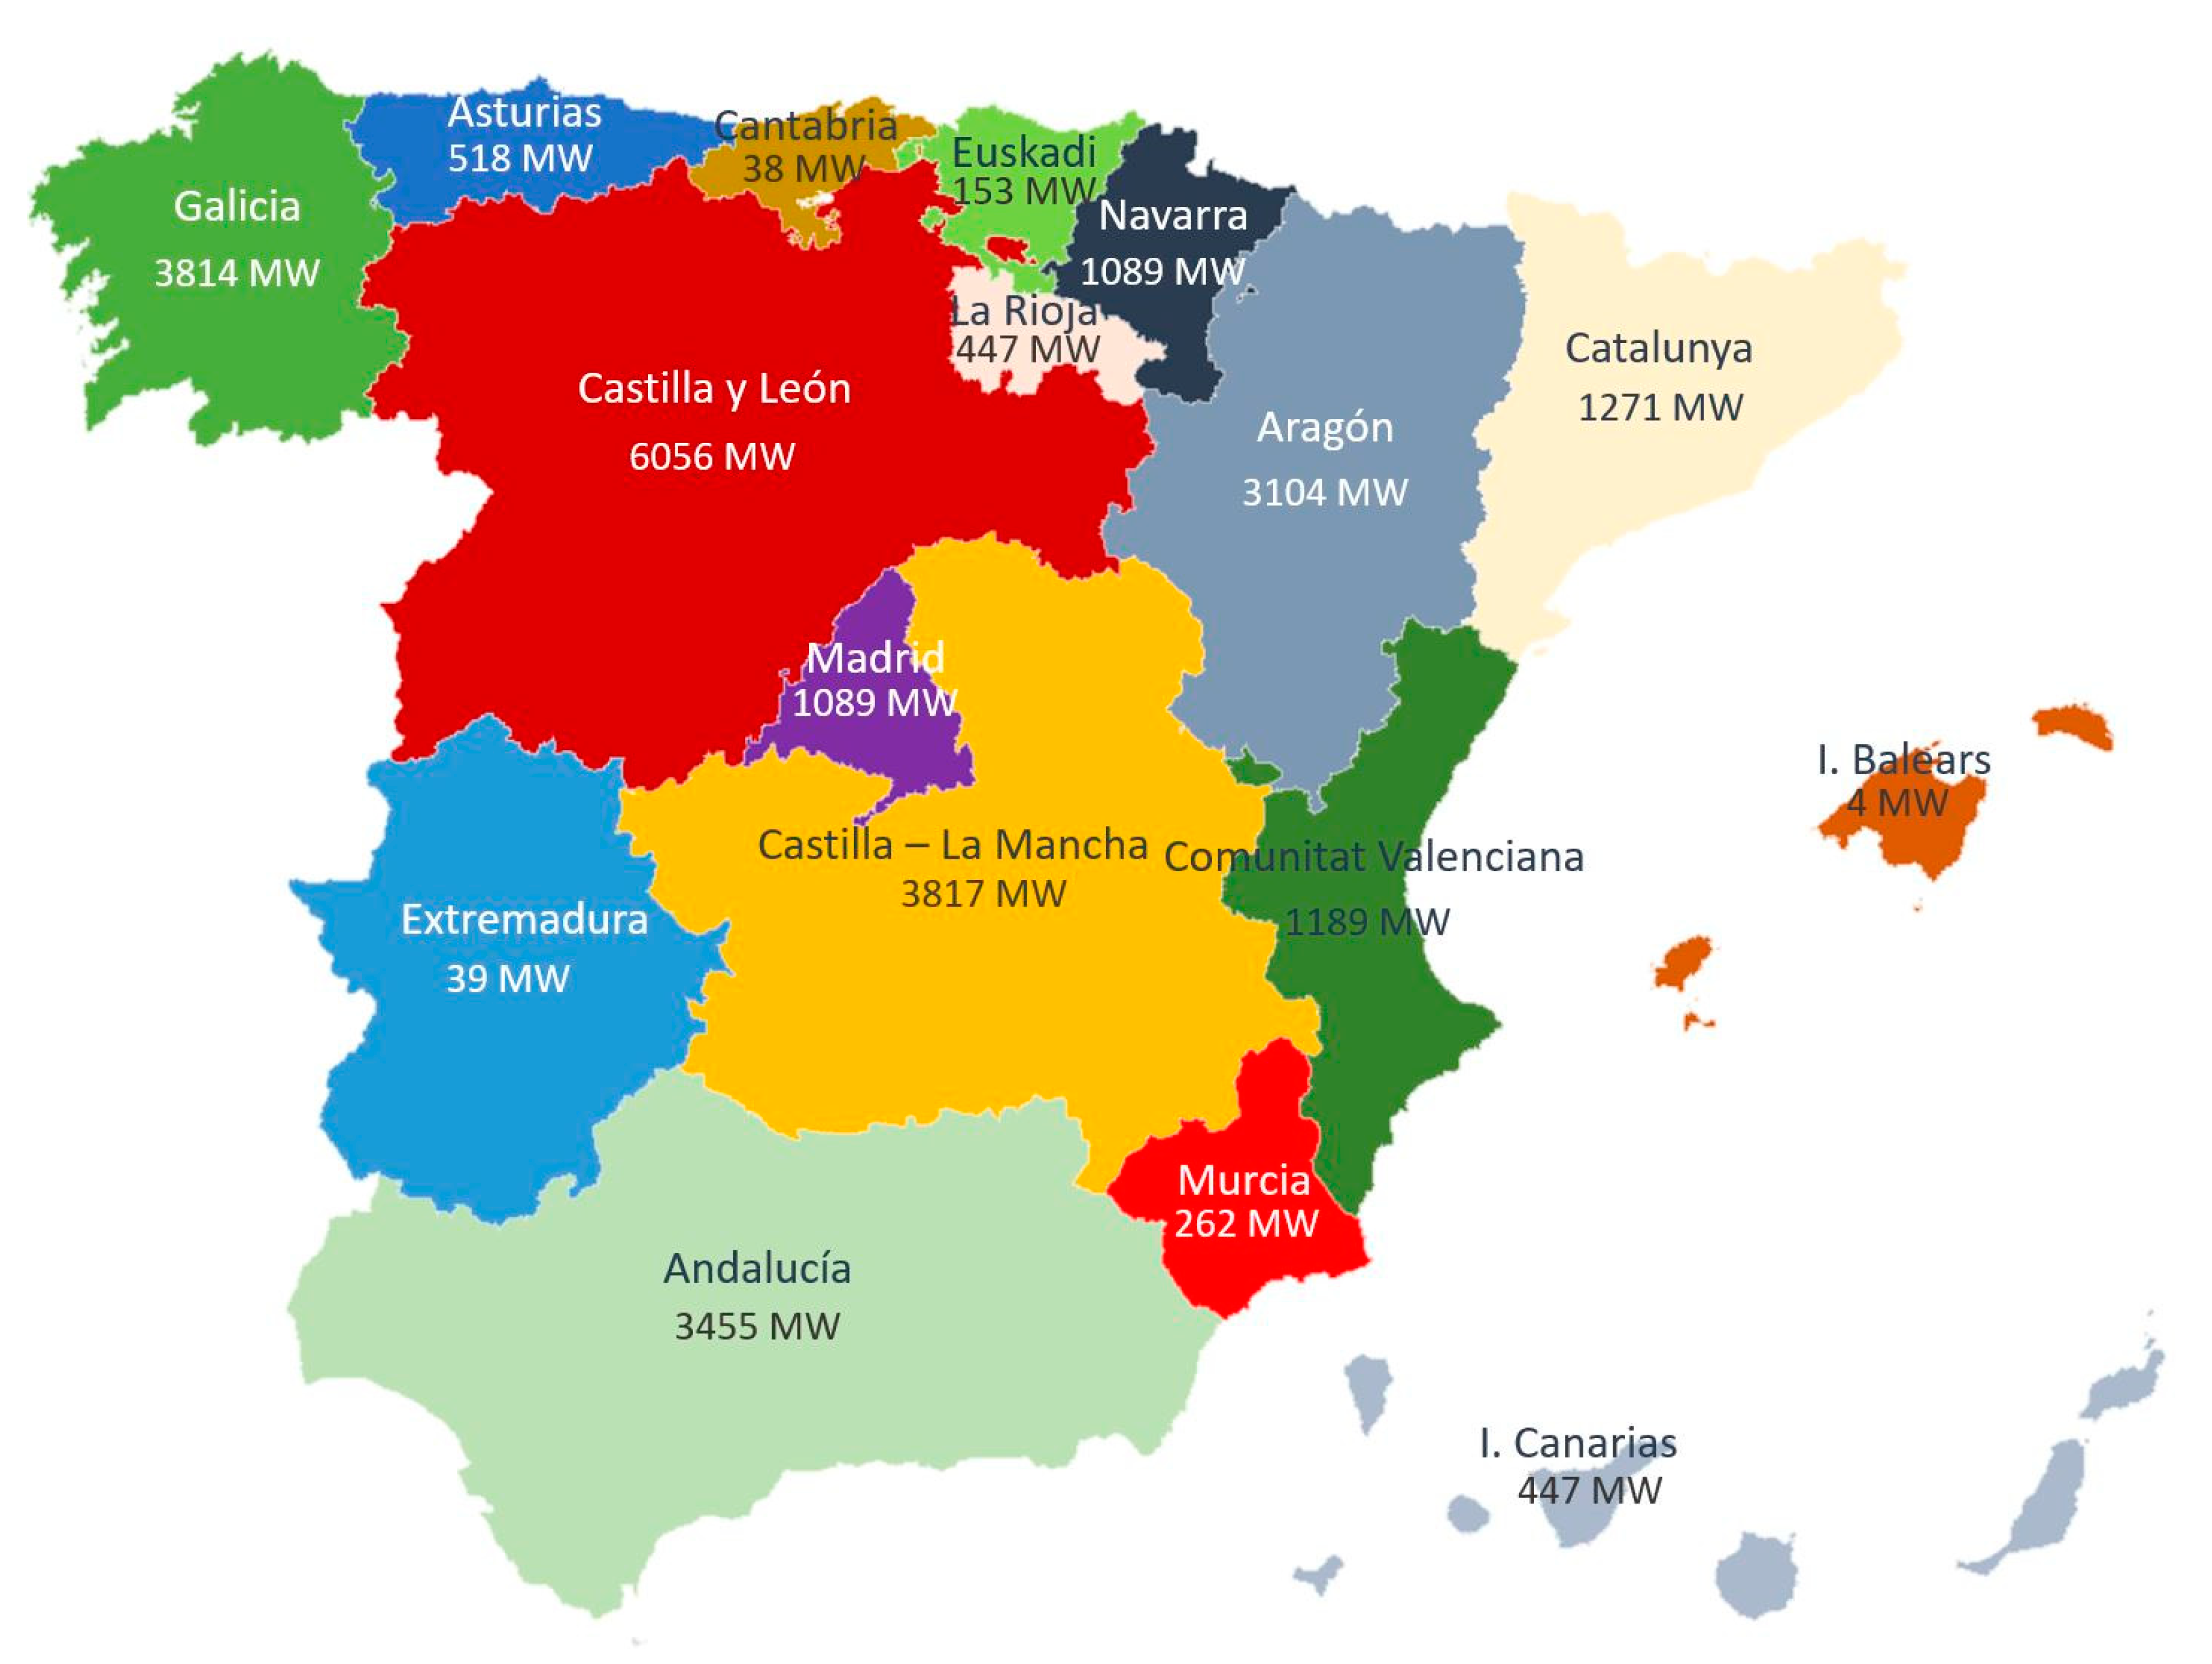
More specifically, in this study, we are going to focus on wind energy. Wind is one of the most important renewable sources in terms of its contribution to the total renewable energy produced in Europe, especially in the power generation sector. For instance, according to the data published by the European Commission, wind technology provided 4.28% of the energy produced and 11.53% of the total electricity generated in the European Union in 2018 [38]. Furthermore, its deployment across Europe has been greater and more homogeneous than other technologies based on renewable energy sources, such as geothermal or tidal energy. In the case of Spain, the importance of wind technology makes it even more relevant to study the factors that determine investment in the new installed capacity. Wind covered 12.63% of the energy produced and 18.55% of the gross electricity generation in 2018, being the first renewable technology ahead of hydro (13.41%), solar (4.64%) or solid biofuels and renewable wastes (1.82%). In relation to installed capacity, wind energy accounted for 22.56% of total installed electricity generation capacity in 2018, being the first renewable technology and the second technology in global terms, only below fossil fuel-based technologies [38]. Figure 1 shows the distribution of installed wind power capacity in 2019 among the 17 Spanish autonomous communities (regions) [39].
There is abundant literature on the empirical modeling of the drivers and barriers that determine the investment in installed capacity of wind power. Most of them study the effects of the various public policy instruments on investment in wind capacity [40,41,42,43,44], although they also include other technical and socioeconomic variables. For instance, the authors in reference [45] take into account policy factors, such as the level of policy support, the type of support scheme and changes in it, but they also include variables such as wind resource potential, electricity generation costs, administrative barriers, social acceptance, general investment climate, electricity demand, share of hydro and nuclear in electricity generation or the country area. Similarly, the authors in works [9,46] specify technical and economic factors such as the price of iron, the sovereign risk premium, or the long-term interest rates; electricity market factors such as the price of the crude oil, the final consumption of electricity or the price of electricity for final domestic consumption, the price of natural gas, the proportion of electricity generated in the country using wind technology, the wind capacity factor or the cost of the electricity transmission grid; economic factors such as the gross domestic product; political factors such as the amount of support for renewables and the taxes applied to the electricity.
The above contributions assume a national dimension when modeling investment in new wind capacity. However, as noted in the introduction, it is appropriate to complement this national approach with a regional perspective, since the distribution of capacity investments and, therefore, of installations within countries is very different from one region to another.
Regional factors likely to condition the introduction of wind farms in the territory are very varied. In this study, we will focus especially on analyzing the effect of those aspects related to technological conditions and with the investment made in each region, simultaneously controlling the influence of other relevant characteristics whose omission in the model can affect the estimation results. The selection of the explanatory variables has been made from an exhaustive literature review. Their description and sources are shown in Table 1.
Specifically, the first three represent factors associated with the technological and knowledge context of the region (TERTIARY, HIGHTECHEMPLOY and PRIVATE R&D), while INVESTMENT represents fixed capital investment per capita. This last variable approximates the infrastructure provision of the territory. The variable TERTIARY aims to represent the education level of the region. For example, Huang et al. [47] found that higher education levels positively influence the adoption of renewable portfolio standards by individual states in the United States, while other studies have demonstrated the existence of a relationship between this education level and wind farm development [48,49]. On the other hand, it is a fact that green-tech companies tend to aggregate spatially to benefit from knowledge spillovers, which in many cases, leads to the emergence of regional green innovation systems (RISs) [50,51]. These RISs, whose formation also depends on the specific capabilities of each region, can, in turn, become a pull factor for the location of new companies in the regional energy sector. For this reason, we have included in the model the variable HIGHTECHEMPLOY, which represents the regional specialization in the energy sector within the high-tech industry. Ultimately, with this variable, we are trying to test the presence of agglomeration (localization) economies in the wind sector at the regional level [52,53]. By the same token, the diffusion of wind technology also depends on the lowering of its investment costs [54,55]. In this sense, various studies have shown that, at least in part, this price reduction is driven by learning-by-searching, or what is the same, by the accumulated knowledge, which in empirical research is usually represented through the R&D investment [56]. We have only considered private investment in R&D (PRIVATE R&D), and not public investment, for two reasons: first, because public R&D and private R&D have different identities and purposes and, as a result, can have very different impacts on the deployment of wind technology [57]. Therefore, combining the two in a single measure can lead to misleading inferences [58]. Moreover, companies carry out a more applied research, which can have an impact on practice in a shorter time-lag [59]. Second, because there is a risk of double-counting since, in fact, public support in R&D is used on numerous occasions to stimulate private applied research that involves demonstration projects [60].
The other variables, as indicated, act as control parameters for the estimates. All of them represent circumstances that, according to the literature, can condition the installation of wind energy in a territory. Logically, the first of these variables (METEO) is the region’s wind resources which, to a large extent, are conditioned by aspects related to geography and climatology. To control this issue, we have used the information provided by the EMHIRES database [61], which contains data on European wind power generation derived from meteorological sources that are available up to NUTS-2 level. We have also considered it relevant to include population density (DENSITY). For example, attempts to locate a wind farm near residential areas or in territories with a higher population density may be hampered by rejection by the local community for reasons of noise and visual impact [62,63]. Furthermore, the social opposition to the implementation of new wind energy projects can be influenced by the size of the wind farm (FARM SIZE). Although the evidence in this regard is mixed, most of the studies show a greater preference for smaller wind farms [64].
Finally, the variable CRISIS has been incorporated into the model to correct the possible effects on the investment in wind energy derived from the poor economic situation during the recession [65]. Prior to its inclusion, the possible existence of temporary fixed effects was contrasted. However, according to the tests performed, for this sample, its presence has not been detected. Even so, we wanted to control for the possible influence of the economic cycle by including this dummy variable. In Spain, the economic crisis heavily and negatively influenced the renewable energy (RES) sector. This detrimental impact was a direct and an indirect one and covered economic as well as political aspects which, in turn, are interrelated. It should also be taken into account that this happened in the context of an electricity system with very specific features (overcapacity in electricity generation, an electricity island and relatively high retail prices). On the one hand, the economic crisis led to a reduction in electricity demand which aggravated the overcapacity problem. On the other hand, it made further payments to RES less politically viable. In addition, the reduction in electricity demand increased the feasibility to comply with the 2020 RES Directive targets. All this led to a critical political decision—the moratorium on support for new RES investments in 2012 [66].
Therefore, the model for estimation has the following structure:
where WINDCAP represents the power of wind energy installed; i and t are two sub-indices that symbolize, respectively, the region and year; μi captures the factors not specifically observed for each region and susceptible to affecting the dependent variable. Finally, νit is the random error term.
The data sources used for the construction of the explanatory variables are described in Table 1. Furthermore, the information corresponding to the dependent variable has been obtained from regional statistics published by Red Eléctrica de España and its value has been expressed in logarithms.
3. Results
The first step prior to the estimate is to decide between the application of a fixed effects or random effects model, which depends on the correlation between the individual effects and the explanatory variables (in the random effects model, the underlying assumption is the exogeneity of unobservable effects). For this purpose, the specification test proposed by Hausman [67] has been carried out, which yields a value of 26.51 (p = 0.000) for a Chi-square with 8 degrees of freedom. Therefore, we must reject the null hypothesis of an absence of correlation between individual regional effects and explanatory variables. This result leads us to select a fixed effects model because it is a consistent estimator for the proposed model specification.
Furthermore, the presence of heteroscedasticity has been detected in the data, so we have used the Huber–White variance estimator to obtain heteroscedasticity-robust standard errors [68,69].
We have also considered the possibility of endogeneity in some of the explanatory variables of the model and, more specifically, in the level of education and highly qualified jobs, since there may be feedback between them and the installed capacity of wind energy in a given region. To test this, we have investigated the causality relationship between these variables by means of a Granger causality analysis that takes the estimation of a panel vector autoregressive model with four lags (PVAR) as a starting point [70,71]. In Table 2, we present the Wald Chi-square test for the null hypothesis that WINDCAP does not Granger-cause TERTIARY and HIGHTECHEMPLOY and vice versa. As can be seen from the results of this test, there is no endogeneity in the data that may affect the results of our model.
The results obtained when estimating the model described in the previous section are presented in Table 3. For each model, the estimated standardized coefficients, their standard errors, the t-statistics for the individual significance test of these coefficients, and the associated p-values are reported. Additionally, for both models, several measures of goodness of fit are displayed.
As can be seen in Model 1, of the variables included to approximate the influence of the technological environment on wind capacity investment, only the weight of energy activities within the total regional employment in high-tech sectors (HIGHTECHEMPLOY) and the weight of private investment in R&D with respect to the region’s GDP (PRIVATE R&D) are significant. In addition, the effects displayed by both variables are opposite. While, as expected, the intensity of the innovative effort made by companies located in the region is a factor that stimulates the increase in installed capacity, regional specialization in energy issues within the set of activities with higher technological content discourages the arrival of new investment flows. This last result may indicate the appearance of a certain “saturation” effect linked to aspects related to the depletion of local physical resources, and possibly also to a NIMBY (“Not In My Back Yard”) effect associated with the opposition of the local community against the expansion of new wind farms in their territory due, for example, to negative effects on the landscape [72,73]. Yet, also, it can point out to other congestion problems, such as those related to the rising of land prices and/or to power curtailment and market risks [52].
As a matter of fact, none of the control variables incorporated in the equation turned out to be significant.
Based on this initial estimate, we have estimated a second model that incorporates time lags of the variables measuring regional investment, both in fixed capital and in R&D (INVESTMENT and PRIVATE R&D). For this, we rely on the premise that it is very likely that investment flows made in a given year do not have an immediate influence as a pull factor of new wind capacity or for the expansion of the existing capacity. In fact, there may be a certain time period since the aforementioned investment was made until it is perceived as a location advantage by companies in the wind energy sector. The estimation results of this second model are presented in the last columns of Table 3 under the name Model 2, and the difference with respect to Model 1 lies in the inclusion of two time lags for each of these variables. The determination of a two year lag has been made, considering previous works. For example, the authors in reference [74] found a time lag of about two years of energy R&D to commercialization for Japanese companies producing solar PV cells. The authors in reference [60] used the same lag structure for the addition of R&D expenditures to the knowledge stock to evaluate the diffusion of wind power in some European countries, including Spain. Moreover, the authors in reference [75] consider that a time lag of two years is enough according to the fact that energy technologies can absorb additional R&D investments with limited delays.
The first outstanding fact is that the inclusion of these time lags greatly improves the accuracy of the model, as can be seen from the comparison of values for the Akaike information criterion (AIC) and the Bayesian information criterion (BIC). For the variable measuring fixed capital investment per capita, it is observed that its positive influence on the variation of the installed wind energy capacity is deployed with a two year lag. This means that this investment, which includes the amount earmarked for the formation of infrastructures, is not immediately perceived as an opportunity by the sector companies, but it requires a certain passage of time. On the other hand, investment in R&D has a more immediate impact, so that resources invested in R&D by the regional private sector have a favorable impact on the creation of an attractive environment for wind companies in the same year it is carried out and the following year. However, the magnitude of the effect is diluted, as reflected in the value of the estimated coefficients.
In this second model, the representative variable of the training level in the region, inferred from the percentage of resident population with higher education (TERTIARY), acquires significance and, in addition, as expected, its influence is positive. Therefore, as expected, a higher educational level in a region can be associated not only with the existence of a more qualified workforce, which represents a competitive advantage for the location of wind companies and auxiliary firms, but also with a better knowledge of the benefits of renewable energy, and thus, a greater receptivity of the local community towards the installation of wind energy projects.
In this model, the significance and the sign of the variable HIGHTECHEMPLOY do not undergo any change.
Finally, regarding the control variables, it should be mentioned that only the one that reflects population density in the region (DENSITY) turned out to be significant. In this case, its effect is negative, so that the greater the volume of population in the region in relation to its territorial extension, the lower its installed wind power capacity is. As anticipated, one of the reasons may be again that in the regions with greater pressures in terms of population, the aforementioned NIMBY effect of social rejection could manifest itself with greater intensity. On the other hand, the average size of the wind farm (FARM SIZE) is not a relevant factor in the regional deployment of wind energy, which is somewhat consistent with the fact that studies that have previously analyzed the influence of this aspect have not obtained conclusive evidence.
Finally, it is interesting to note that the non-significance of the variable METEO indicates that although geographic factors are a necessary condition for the location of a wind farm, the truth is that wind resources are not enough to explain regional differences in the implementation of wind energy, which comes to reinforce the interest of this analysis [62,76].
4. Conclusions
Although regions have so far occupied a second level in the political process aimed at achieving the necessary energy transition, the truth is that there are several arguments that indicate that the most conducive arena in which to implement strategies aimed at the abandonment of fossil fuel energy in favor of the adoption of clean energy sources, such as renewables, is to be found at the regional level. In this study, we wanted to make a first foray into the determinants that condition the installation of wind capacity at the regional level, focusing, in particular, on those related to technological and environmental knowledge in the region. Our results confirm the outcomes obtained by previous papers at a national scale, showing that, in effect, in the regional context, there is a significant positive relationship between wind energy installed capacity and the education level of the population, the intensity of R&D investment made by companies and the level of fixed capital investment. For this last factor, it has also been observed that its influence on the expansion of wind farms in the region does not manifest itself immediately, but that at least two years have to elapse before the improvement in regional capital stock becomes a location factor. On the contrary, the influence of R&D investment is more immediate. What is relevant in this case is that the effects of such investment spread for more than one economic period. This result may have significance in the design of investment programs at the firm level, but also of public support policies for private R&D. However, it must be kept in mind that the best public stimulus for private R&D does not consist of establishing a subsidy program, but rather in defining clear and long-term energy policy objectives that allow companies to adequately plan their R&D investment strategy [77]. In this task, coordination between the different administrations—national, regional and even local—is very important [78].
This coordination is also very necessary to overcome social rejection, which is another obstacle that may be hindering the diffusion of wind energy. In particular, the national energy authority must pay more attention to the considerations of the regional and municipal administrations, since it is at these levels that the social resistance to the implementation of wind farms is perceived with the greatest intensity. At this point, educational tools and communication campaigns about the benefits of wind energy can become the most effective strategies to overcome this rejection, along with the greater involvement of all the social, business and institutional groups affected in the implementation of a wind project [62,78].
There are still many questions to be asked and further analysis is called for, but with these results, evidence of a relevant issue has already been obtained; beyond climate issues, there are other types of determinants that explain regional differences with regard to the implementation of wind farms in different areas. The main limitation of this work is that it only refers to the Spanish case, and therefore, it has not been possible to carry out an international comparison about the influence of national factors in conjunction with regional aspects. This will be the next step in our research. Going into more detail on this issue may contribute to the achievement of a decarbonized economy if policies carried out on a regional level can be suitably redirected by adopting a horizontal perspective.
Supplementary Materials
The following are available online at https://0-www-mdpi-com.brum.beds.ac.uk/1996-1073/13/14/3590/s1, Data S1: Model Database in Spreadsheet format. This file provides the database used in the estimation of the models discussed in this article.
Author Contributions
Conceptualization, M.J.R.-F., M.-J.G.-P. and M.-Á.T.; Data curation, M.J.R.-F., M.-J.G.-P. and M.-Á.T.; Formal analysis, M.J.R.-F., M.-J.G.-P. and M.-Á.T.; Funding acquisition, M.J.R.-F., M.-J.G.-P. and M.-Á.T.; Investigation, M.J.R.-F., M.-J.G.-P. and M.-Á.T.; Methodology, M.J.R.-F., M.-J.G.-P. and M.-Á.T.; Project administration, M.J.R.-F., M.-J.G.-P. and M.-Á.T.; Resources, M.J.R.-F., M.-J.G.-P. and M.-Á.T.; Software, M.J.R.-F., M.-J.G.-P. and M.-Á.T.; Supervision, M.J.R.-F., M.-J.G.-P. and M.-Á.T.; Validation, M.J.R.-F., M.-J.G.-P. and M.-Á.T.; Visualization, M.J.R.-F., M.-J.G.-P. and M.-Á.T.; Writing—original draft, M.J.R.-F., M.-J.G.-P. and M.-Á.T.; Writing—review & editing, M.J.R.-F., M.-J.G.-P. and M.-Á.T. All authors have read and agreed to the published version of the manuscript.
Funding
This research has not received specific funding from any institution.
Acknowledgments
We thank the three anonymous reviewers for their valuable comments which have contributed to the improvement of this paper.
Conflicts of Interest
The authors declare no conflict of interest.
References
- European Commission. Communication from the Commission to the European Parliament, the Council, the European Economic and Social Committee and the Committee of the Regions: A Framework Strategy for a Resilient Energy Union with a Forward-Looking Climate Change Policy; European Commission: Brussels, Belgium, 2015. [Google Scholar]
- European Commission. Communication from the Commission to the European Parliament, the Council, the European Economic and Social Committee and the Committee of the Regions: A Policy Framework for Climate and Energy in the Period from 2020 to 2030; European Commission: Brussels, Belgium, 2014. [Google Scholar]
- Del Río, P.; Resch, G.; Ortner, A.; Liebmann, L.; Busch, S.; Panzer, C. A techno-economic analysis of EU renewable electricity policy pathways in 2030. Energy Policy 2017, 104, 484–493. [Google Scholar] [CrossRef]
- Carley, S.; Baldwin, E.; MacLean, L.M.; Brass, J.N. Global expansion of renewable energy generation: An analysis of policy instruments. Environ. Resour. Econ. 2016, 68, 397–440. [Google Scholar] [CrossRef]
- Kilinc-Ata, N. The evaluation of renewable energy policies across EU countries and US states: An econometric approach. Energy Sustain. Dev. 2016, 31, 83–90. [Google Scholar] [CrossRef]
- Polzin, F.; Migendt, M.; Täube, F.A.; Von Flotow, P. Public policy influence on renewable energy investments—A panel data study across OECD countries. Energy Policy 2015, 80, 98–111. [Google Scholar] [CrossRef] [Green Version]
- Marques, A.C.; Fuinhas, J.A.; Manso, J.R.P. Motivations driving renewable energy in European countries: A panel data approach. Energy Policy 2010, 38, 6877–6885. [Google Scholar] [CrossRef]
- Aguirre, M.; Ibikunle, G. Determinants of renewable energy growth: A global sample analysis. Energy Policy 2014, 69, 374–384. [Google Scholar] [CrossRef] [Green Version]
- Quintana-Rojo, C.; Callejas-Albiñana, F.E.; Tarancón, M.A.; Del Río, P. Assessing the feasibility of deployment policies in wind energy systems. A sensitivity analysis on a multiequational econometric framework. Energy Econ. 2020, 86, 104688. [Google Scholar] [CrossRef]
- Dalmazzone, S.; Corsatea, T.D. A regional analysis of renewable energy patenting in Italy. SSRN Electron. J. 2012. [Google Scholar] [CrossRef]
- Ministry for the Ecological Transition. Plan Nacional Integrado de Energía y Clima PNIEC; Spanish Goverment: Madrid, Spain, 2020.
- United Nations. United Nations Framework Convention on Climate Change, Paris Agreement; United Nations: Paris, France, 2015. [Google Scholar]
- European Environment Agency. Unequal Exposure and Unequal Impacts: Social Vulnerability to Air Pollution, Noise and Extreme Temperatures in Europe, EEA Report 22/2018; Publications Office of the European Union: Luxembourg, 2018. [Google Scholar]
- Ivanova, D.; Vita, G.; Steen-Olsen, K.; Stadler, K.; Melo, P.C.; Wood, R.; Hertwich, E. Mapping the carbon footprint of EU regions. Environ. Res. Lett. 2017, 12, 054013. [Google Scholar] [CrossRef]
- Mattes, J.; Huber, A.; Koehrsen, J. Energy transitions in small-scale regions – What we can learn from a regional innovation systems perspective. Energy Policy 2015, 78, 255–264. [Google Scholar] [CrossRef]
- Ghilardi, A.; Guerrero, G.; Masera, O. A GIS-based methodology for highlighting fuelwood supply/demand imbalances at the local level: A case study for Central Mexico. Biomass Bioenergy 2009, 33, 957–972. [Google Scholar] [CrossRef]
- Calvert, K.; Pearce, J.M.; Mabee, W. Toward renewable energy geo-information infrastructures: Applications of GIScience and remote sensing that build institutional capacity. Renew. Sustain. Energy Rev. 2013, 18, 416–429. [Google Scholar] [CrossRef] [Green Version]
- Palmas, C.; Siewert, A.; Von Haaren, C. Exploring the decision-space for renewable energy generation to enhance spatial efficiency. Environ. Impact Assess. Rev. 2015, 52, 9–17. [Google Scholar] [CrossRef]
- Faulin, J.; Lera, F.; Pintor, J.M.; García, J.; Lera-López, F. The outlook for renewable energy in Navarre: An economic profile. Energy Policy 2006, 34, 2201–2216. [Google Scholar] [CrossRef]
- Jenniches, S. Assessing the regional economic impacts of renewable energy sources—A literature review. Renew. Sustain. Energy Rev. 2018, 93, 35–51. [Google Scholar] [CrossRef]
- Ejdemo, T.; Söderholm, P. Wind power, regional development and benefit-sharing: The case of Northern Sweden. Renew. Sustain. Energy Rev. 2015, 47, 476–485. [Google Scholar] [CrossRef]
- Del Río, P.; Burguillo, M. An empirical analysis of the impact of renewable energy deployment on local sustainability. Renew. Sustain. Energy Rev. 2009, 13, 1314–1325. [Google Scholar] [CrossRef]
- Cuartas, B.M.; López-Menéndez, A. The effect of renewable energy on employment. The case of Asturias (Spain). Renew. Sustain. Energy Rev. 2008, 12, 732–751. [Google Scholar] [CrossRef]
- Asociación de Empresas de Energías Renovables APPA. Estudio del Impacto Macroeconómico de las Energías Renovables en España: 2018; APPA: Madrid, Spain, 2019; Available online: https://www.appa.es/wp-content/uploads/2019/10/Estudio_del_impacto_Macroeconomico_de_las_energias_renovables_en_Espa%C3%B1a_2018_vff.pdf (accessed on 6 January 2020).
- Horbach, J.; Rammer, C. Energy transition in Germany and regional spill-overs: The diffusion of renewable energy in firms. Energy Policy 2018, 121, 404–414. [Google Scholar] [CrossRef]
- Noailly, J.; Shestalova, V. Knowledge spillovers from renewable energy technologies: Lessons from patent citations. Environ. Innov. Soc. Transitions 2017, 22, 1–14. [Google Scholar] [CrossRef] [Green Version]
- Bulkeley, H. Reconfiguring environmental governance: Towards a politics of scales and networks. Political Geogr. 2005, 24, 875–902. [Google Scholar] [CrossRef] [Green Version]
- Coelho, S.; Russo, M.A.; Oliveira, R.; Monteiro, A.; Lopes, M.; Borrego, C. Sustainable energy action plans at city level: A Portuguese experience and perception. J. Clean. Prod. 2018, 176, 1223–1230. [Google Scholar] [CrossRef] [Green Version]
- Coutard, O.; Rutherford, J. Energy transition and city-region planning: Understanding the spatial politics of systemic change. Technol. Anal. Strat. Manag. 2010, 22, 711–727. [Google Scholar] [CrossRef]
- Dehghan, A.A. Status and potentials of renewable energies in Yazd Province-Iran. Renew. Sustain. Energy Rev. 2011, 15, 1491–1496. [Google Scholar] [CrossRef]
- Monstadt, J. Urban governance and the transition of energy systems: Institutional change and shifting energy and climate policies in Berlin. Int. J. Urban Reg. Res. 2007, 31, 326–343. [Google Scholar] [CrossRef]
- Yu, L.; Li, Y.; Huang, G. Planning municipal-scale mixed energy system for stimulating renewable energy under multiple uncertainties—The city of Qingdao in Shandong Province, China. Energy 2019, 166, 1120–1133. [Google Scholar] [CrossRef]
- Zoellner, J.; Schweizer-Ries, P.; Wemheuer, C. Public acceptance of renewable energies: Results from case studies in Germany. Energy Policy 2008, 36, 4136–4141. [Google Scholar] [CrossRef]
- Carfora, A.; Romano, A.A.; Ronghi, M.; Scandurra, G. Renewable generation across Italian regions: Spillover effects and effectiveness of European Regional Fund. Energy Policy 2017, 102, 132–141. [Google Scholar] [CrossRef]
- Arabatzis, G.; Kyriakopoulos, G.L.; Tsialis, P. Typology of regional units based on RES plants: The case of Greece. Renew. Sustain. Energy Rev. 2017, 78, 1424–1434. [Google Scholar] [CrossRef]
- Balta-Ozkan, N.; Watson, T.; Mocca, E. Spatially uneven development and low carbon transitions: Insights from urban and regional planning. Energy Policy 2015, 85, 500–510. [Google Scholar] [CrossRef] [Green Version]
- Schaffer, A.J.; Brun, S. Beyond the sun—Socioeconomic drivers of the adoption of small-scale photovoltaic installations in Germany. Energy Res. Soc. Sci. 2015, 10, 220–227. [Google Scholar] [CrossRef]
- Directorate-General for Energy. EU Energy in Figures: Statistical Pocketbook 2019; European Commission: Luxembourg, 2019. [Google Scholar]
- Matti, C.; Consoli, D. The emergence of wind energy in Spain: A review of the policy mix. In The Economics of Knowledge, Innovation and Systemic Technology Policy; Crespi, F., Quatraro, F., Eds.; Routledge: New York, NY, USA, 2015. [Google Scholar]
- Adelaja, A.; Hailu, Y.G.; McKeown, C.H.; Tekle, A.T. Effects of renewable energy policies on wind industry development in the US. J. Nat. Resour. Policy Res. 2010, 2, 245–262. [Google Scholar] [CrossRef]
- Dong, C. Feed-in tariff vs. renewable portfolio standard: An empirical test of their relative effectiveness in promoting wind capacity development. Energy Policy 2012, 42, 476–485. [Google Scholar] [CrossRef]
- Zhang, F. A field experiment on the role of socioemotional skills and gender for hiring in Turkey. In How Fit are Feed-in Tariff Policies? Evidence from the European Wind Market; The World Bank: Wasington, DC, USA, 2013. [Google Scholar] [CrossRef] [Green Version]
- Gavard, C. Carbon price and wind power support in Denmark. Energy Policy 2016, 92, 455–467. [Google Scholar] [CrossRef] [Green Version]
- Hitaj, C.; Loschel, A. The impact of a feed-in tariff on wind power development in Germany. Resour. Energy Econ. 2019, 57, 18–35. [Google Scholar] [CrossRef] [Green Version]
- Del Río, P.; Morán, M.A.T. Analysing the determinants of on-shore wind capacity additions in the EU: An econometric study. Appl. Energy 2012, 95, 12–21. [Google Scholar] [CrossRef]
- Quintana-Rojo, C.; Callejas-Albiñana, F.; Tarancón, M.A.; Del Río, P. Identifying the drivers of wind capacity additions: The case of Spain. A multiequational approach. Energies 2019, 12, 1944. [Google Scholar] [CrossRef] [Green Version]
- Huang, M.-Y.; Alavalapati, J.; Carter, D.R.; Langholtz, M. Is the choice of renewable portfolio standards random? Energy Policy 2007, 35, 5571–5575. [Google Scholar] [CrossRef]
- Liljenfeldt, J.; Pettersson, Ö. Distributional justice in Swedish wind power development—An odds ratio analysis of windmill localization and local residents’ socio-economic characteristics. Energy Policy 2017, 105, 648–657. [Google Scholar] [CrossRef]
- Jacquet, J.B. Landowner attitudes toward natural gas and wind farm development in northern Pennsylvania. Energy Policy 2012, 50, 677–688. [Google Scholar] [CrossRef]
- Cooke, P. Regional innovation systems: Development opportunities from the ‘green turn’. Technol. Anal. Strat. Manag. 2010, 22, 831–844. [Google Scholar] [CrossRef]
- Marra, A.; Antonelli, P.; Pozzi, C. Emerging green-tech specializations and clusters—A network analysis on technological innovation at the metropolitan level. Renew. Sustain. Energy Rev. 2017, 67, 1037–1046. [Google Scholar] [CrossRef]
- Goetzke, F.; Rave, T. Exploring heterogeneous growth of wind energy across Germany. Util. Policy 2016, 41, 193–205. [Google Scholar] [CrossRef]
- Xia, F.; Song, F. The uneven development of wind power in China: Determinants and the role of supporting policies. Energy Econ. 2017, 67, 278–286. [Google Scholar] [CrossRef]
- Del Río, P. Analysing future trends of renewable electricity in the EU in a low-carbon context. Renew. Sustain. Energy Rev. 2011, 15, 2520–2533. [Google Scholar] [CrossRef]
- Klaassen, G.; Miketa, A.; Larsen, K.; Sundqvist, T. The impact of R&D on innovation for wind energy in Denmark, Germany and the United Kingdom. Ecol. Econ. 2005, 54, 227–240. [Google Scholar] [CrossRef]
- Qiu, Y.; Anadon, L.D. The price of wind power in China during its expansion: Technology adoption, learning-by-doing, economies of scale, and manufacturing localization. Energy Econ. 2012, 34, 772–785. [Google Scholar] [CrossRef]
- Wene, C.-O. Energy technology learning through deployment in competitive markets. Eng. Econ. 2008, 53, 340–364. [Google Scholar] [CrossRef]
- Rubin, E.S.; Azevedo, I.M.; Jaramillo, P.; Yeh, S. A review of learning rates for electricity supply technologies. Energy Policy 2015, 86, 198–218. [Google Scholar] [CrossRef]
- Griliches, Z. R&D and Productivity; University of Chicago Press: London, UK, 1998. [Google Scholar]
- Söderholm, P.; Klaassen, G. Wind power in Europe: A simultaneous innovation–diffusion model. Environ. Resour. Econ. 2006, 36, 163–190. [Google Scholar] [CrossRef]
- Gonzalez-Aparicio, I.; Zucker, A.; Careri, F.; Monforti, F.; Huld, T.; Badger, J. EMHIRES dataset. Part I: Wind power generation European Meteorological derived High resolution RES generation time series for present and future scenarios. Tech. Rep. 2016. [Google Scholar] [CrossRef]
- Frantál, B.; Kunc, J. Factors of the uneven regional development of wind energy projects (a case of the Czech Republic). Geogr. J. 2010, 62, 183–199. [Google Scholar]
- Rodman, L.C.; Meentemeyer, R.K. A geographic analysis of wind turbine placement in Northern California. Energy Policy 2006, 34, 2137–2149. [Google Scholar] [CrossRef]
- Meyerhoff, J.; Ohl, C.; Hartje, V.; Juergen, M. Landscape externalities from onshore wind power. Energy Policy 2010, 38, 82–92. [Google Scholar] [CrossRef]
- Shivakumar, A.; Dobbins, A.; Fahl, U.; Singh, A. Drivers of renewable energy deployment in the EU: An analysis of past trends and projections. Energy Strat. Rev. 2019, 26, 100402. [Google Scholar] [CrossRef]
- Del Río, P. Designing auctions for renewable electricity support. Best practices from around the world. Energy Sustain. Dev. 2017, 41, 1–13. [Google Scholar] [CrossRef]
- Hausman, J.A. Specification tests in econometrics. Econometrica 1978, 46, 1251. [Google Scholar] [CrossRef] [Green Version]
- Huber, P.J. The behaviour of maximum likelihood estimates under nonstandard conditions. In Proceedings of the Fifth Berkeley Symposium on Mathematical Statistics and Probability, Berkeley, CA, USA, 21 June 1967; University of California Press: Berkeley, CA, USA, 1967; pp. 221–233. [Google Scholar]
- White, H. A heteroskedasticity-consistent covariance matrix estimator and a direct test for heteroskedasticity. Econometrica 1980, 48, 817. [Google Scholar] [CrossRef]
- Granger, C.W.J. Investigating causal relations by econometric models and cross-spectral methods. Econometrica 1969, 37, 424. [Google Scholar] [CrossRef]
- Abrigo, M.R.; Love, I. Estimation of panel vector autoregression in stata. Stata J. 2016, 16, 778–804. [Google Scholar] [CrossRef] [Green Version]
- Feurtey, É.; Ilinca, A.; Sakout, A.; Saucier, C. Institutional factors influencing strategic decision-making in energy policy; A case study of wind energy in France and Quebec (Canada). Renew. Sustain. Energy Rev. 2016, 59, 1455–1470. [Google Scholar] [CrossRef]
- Warren, C.R.; McFadyen, M. Does community ownership affect public attitudes to wind energy? A case study from south-west Scotland. Land Use Policy 2010, 27, 204–213. [Google Scholar] [CrossRef]
- Watanabe, C. Systems option for sustainable development-effect and limit of the ministry of international trade and industry’s efforts to substitute technology for energy. Res. Policy 1999, 14, 719–749. [Google Scholar] [CrossRef]
- Wiesenthal, T.; Mercier, A.; Schade, B.; Petric, H.; Dowling, P. A model-based assessment of the impact of revitalised R&D investments on the European power sector. Renew. Sustain. Energy Rev. 2012, 16, 105–112. [Google Scholar] [CrossRef]
- Toke, D.; Breukers, S.; Wolsink, M. Wind power deployment outcomes: How can we account for the differences? Renew. Sustain. Energy Rev. 2008, 12, 1129–1147. [Google Scholar] [CrossRef]
- Buen, J. Danish and Norwegian wind industry: The relationship between policy instruments, innovation and diffusion. Energy Policy 2006, 34, 3887–3897. [Google Scholar] [CrossRef]
- Agterbosch, S.; Glasbergen, P.; Vermeulen, W.J. Social barriers in wind power implementation in The Netherlands: Perceptions of wind power entrepreneurs and local civil servants of institutional and social conditions in realizing wind power projects. Renew. Sustain. Energy Rev. 2007, 11, 1025–1055. [Google Scholar] [CrossRef]
Figure 1.
Regional distribution of installed wind power capacity in Spain (2019, MW). Source: Wind Business Association (AEE).
Figure 1.
Regional distribution of installed wind power capacity in Spain (2019, MW). Source: Wind Business Association (AEE).


Table 1.
Variables.
| Variable | Description | Source |
|---|---|---|
| WINDCAP | Installed capacity of wind energy (dependent variable) | Red Eléctrica de España |
| TERTIARY | Percentage of population with higher studies | Eurostat |
| HIGHTECHEMPLOY | Percentage of the energy sector in regional employment in high tech sectors | Eurostat |
| PRIVATE R&D | Private investment in R&D in percentage on regional GDP | Eurostat |
| INVESTMENT | Investment in fixed capital per inhabitant. | Eurostat |
| METEO | Production of wind energy according to meteorological conditions | EMHIRES |
| FARM SIZE | Average size of wind farm | Wind Business Association (AEE) |
| DENSITY | Population Density | Eurostat |
| CRISIS | Dummy: value 1 in crisis years (2008–2014) | - |
Source: own elaboration.
Table 2.
Panel VAR–Granger causality Wald test.
| Equation | Excluded | chi2 | df | Prob > chi2 |
|---|---|---|---|---|
| WINDCAP | TERTIARY | 4.184 | 4 | 0.382 |
| HIGHTECHEMPLOY | 0.479 | 4 | 0.976 | |
| ALL | 4.974 | 8 | 0.760 | |
| TERTIARY | WINDCAP | 3.412 | 4 | 0.491 |
| HIGHTECHEMPLOY | 1.157 | 4 | 0.885 | |
| ALL | 4.656 | 8 | 0.794 | |
| HIGHTECHEMPLOY | WINDCAP | 1.441 | 4 | 0.837 |
| TERTIARY | 2.850 | 4 | 0.583 | |
| ALL | 5.767 | 8 | 0.673 |
Note: The null hypothesis is that the excluded variable does not Grange-cause equation variable, where df means degrees of freedom. ALL refers to the test that all lags of all endogenous variables other than those of the dependent variable in each equation are jointly zero. Source: own elaboration.
Table 3.
Estimation results.
| Model 1 | Model 2 | |||||||
|---|---|---|---|---|---|---|---|---|
| Standardized Beta | S.E. | t-statistic | p-value | Standardized Beta | S. E. | t-statistic | p-value | |
| METEO | 0.141 | 0.000 | 1.41 | 0.179 | 0.017 | 0.000 | 0.3 | 0.765 |
| FARM SIZE | 0.011 | 0.009 | 0.54 | 0.598 | −0.032 | 0.012 | −1.25 | 0.228 |
| TERTIARY | 0.362 | 0.024 | 1.56 | 0.138 | 0.457 * | 0.027 | 1.75 | 0.1 |
| HIGHTECHEMPLOY | −0.456 ** | 0.069 | −2.18 | 0.044 | −0.441 ** | 0.059 | −2.5 | 0.024 |
| INVESTMENT | 0.171 | 0.086 | 1.18 | 0.255 | 0.167 | 0.088 | 1.13 | 0.276 |
| INVESTMENT (T-1) | - | - | - | - | 0.009 | 0.047 | 0.11 | 0.912 |
| INVESTMENT (T-2) | - | - | - | - | 0.105 * | 0.033 | 1.89 | 0.077 |
| PRIVATE R&D | 0.746 * | 2.899 | 1.89 | 0.077 | 0.424 * | 1.626 | 1.92 | 0.073 |
| PRIVATE R&D (T-1) | - | - | - | - | 0.147 ** | 0.407 | 2.66 | 0.017 |
| PRIVATE R&D (T-2) | - | - | - | - | 0.110 | 0.581 | 1.4 | 0.181 |
| DENSITY | −0.613 | 0.015 | −0.83 | 0.421 | −1.038 * | 0.012 | −1.73 | 0.102 |
| CRISIS | 0.140 | 0.150 | 0.93 | 0.366 | 0.057 | 0.063 | 0.91 | 0.377 |
| R WITHIN | 0.4937 | - | - | - | 0.5231 | - | - | - |
| R BETWEEN | 0.1127 | - | - | - | 0.1974 | - | - | - |
| AIC | 340.2589 | - | - | - | 141.3699 | - | - | - |
| BIC | 366.0649 | - | - | - | 177.6565 | - | - | - |
Note: ** and * denote significance at the 5% and 10% levels, respectively. Source: own elaboration.
© 2020 by the authors. Licensee MDPI, Basel, Switzerland. This article is an open access article distributed under the terms and conditions of the Creative Commons Attribution (CC BY) license (http://creativecommons.org/licenses/by/4.0/).
Share and Cite
MDPI and ACS Style
Gutiérrez-Pedrero, M.-J.; Ruiz-Fuensanta, M.J.; Tarancón, M.-Á. Regional Factors Driving the Deployment of Wind Energy in Spain. Energies 2020, 13, 3590. https://0-doi-org.brum.beds.ac.uk/10.3390/en13143590
AMA Style
Gutiérrez-Pedrero M-J, Ruiz-Fuensanta MJ, Tarancón M-Á. Regional Factors Driving the Deployment of Wind Energy in Spain. Energies. 2020; 13(14):3590. https://0-doi-org.brum.beds.ac.uk/10.3390/en13143590
Chicago/Turabian StyleGutiérrez-Pedrero, María-Jesús, María J. Ruiz-Fuensanta, and Miguel-Ángel Tarancón. 2020. "Regional Factors Driving the Deployment of Wind Energy in Spain" Energies 13, no. 14: 3590. https://0-doi-org.brum.beds.ac.uk/10.3390/en13143590
Note that from the first issue of 2016, this journal uses article numbers instead of page numbers. See further details here.