Energy Price Policies and Food Prices: Empirical Evidence from Iran


1
Department of Agricultural Economics, Ferdowsi University of Mashhad, Mashhad 9177948974, Iran
2
Department of Agricultural Economics & Master of Int’l Agriculture, Oklahoma State University Stillwater, Stillwater, OK 74078, USA
*
Author to whom correspondence should be addressed.
Energies 2020, 13(15), 4031; https://0-doi-org.brum.beds.ac.uk/10.3390/en13154031
Submission received: 13 June 2020
/
Revised: 30 July 2020
/
Accepted: 1 August 2020
/
Published: 4 August 2020
(This article belongs to the Special Issue Energy Policy and Policy Implications 2020)
Abstract
:During the last decade, the rising trend in energy prices and its potential effect on food prices have become a controversial issue between policy-makers and economists. Therefore, research addressing the relationship between food and macroeconomic variables, such as energy prices, will be useful in providing information for the design of appropriate economic policies. This study uses data from Iran to examine the impacts (short- and long-term) of exchange rate and energy prices on food prices. Iran is a good case study as in recent years its consumers have faced a rapid increase in both fuel and food prices. The variables employed in this study are the prices of ten food products, exchange rate (the value of Iranian rial per US dollar), and petroleum prices. All data in this study are from the Statistical Centre of Iran (SCI). We employ the panel unit root test, Pedroni co-integration tests, Pooled Mean Group (PMG), Mean Group (MG), and Dynamic Fixed Effects (DFE) estimation techniques, applied to a panel of monthly prices for ten food products for the period of March 1995 to February 2018. Results show that in both the short- and long-run, food prices would increase in response to an increase in energy prices. Findings also suggest that the appreciation of the United States Dollar (USD) in terms of the Iranian rial exerts a positive and significant impact on food prices in the long run.

1. Introduction
Iran is one of the world’s most energy-rich countries, accounting for about 11% of world oil reserves and 15.3% of world gas resources, and therefore plays an important role in the global energy markets [1]. In Iran, the government’s annual budget is heavily dependent on energy resources, as about 60% of the government’s income comes from oil and gas resources. Note that in Iran, the oil and gas industry is not private and is owned by the government. Energy prices in Iran are often determined by the government and therefore, they have little dependence on global energy market fluctuations. As a result, energy prices in Iran are often divorced from global prices as the government uses the energy price policy for welfare and income support. Due to direct and indirect energy subsidies, the prices of energy in Iran, especially gasoline, have been some of the cheapest in the world, so that gasoline prices have been in the range of 0.10–0.40 United States Dollar (USD) per liter over the last forty years [2]. The social and environmental problems of these supportive policies, on the one hand, the intensification of economic sanctions, and consequently increase in the budget deficit on the other hand were strong reasons for the government to pursue energy price reform policies. Eliminating energy subsidies officially began in 2010, which is considered the greatest one-shot rise in energy prices anywhere in the world [3]. Given the adverse effects of these policies on household welfare, especially in low-income deciles, the sudden rise in energy prices are often met by widespread protests; Bolivia, Pakistan, and Nigeria are good examples in this regard. Recently, following a 200 percent increase in energy prices, Iran witnessed widespread protests. After the implementation of the energy policy, numerous questions and concerns among researches and policy-makers have been raised regarding its potential effect on inflation, especially food prices.
On the other side of the argument, rising food prices is one of the major problems faced by policy-makers in developing countries, such as Iran, because, rising food prices are viewed as a threat to food security and fair distribution of income [4]. Wodon and Zaman [5] indicate that an increase in food prices caused an increase in poverty in sub-Saharan Africa. Green, et al. [6] predict that the rise in food prices leads to a reduction in food consumption in poor countries. In addition, the results of their model show that low-income households will be negatively impacted by the increase in food prices. Similar findings are obtained by Zheng and Henneberry [7] for Chinese urban households. According to the findings by the United Nations Food and Agriculture Organization, the global rise in cereal prices pushed almost 40 million people into hunger in 2008 [8]. Hence, in order to design effective policies that reduce the adverse effects of rising food prices, several studies have been conducted to detect the determinants of food price fluctuations. A number of studies have shown that energy prices are a key factor in determining food prices [9,10,11,12,13,14]. Hence, an explicit insight into the effects of the energy price policies on food prices would be a useful tool for making sound economic policies in Iran, as well as drawing lessons for other countries embarking on similar reforms.
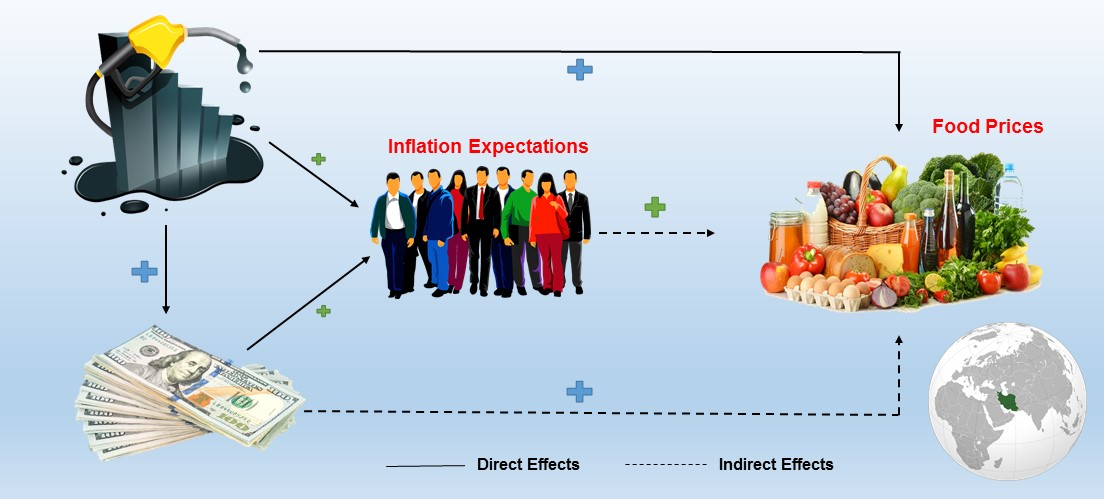
A review of literature reveals that energy prices could both directly and indirectly impact food prices. Regarding the direct effect, the evidence suggests that changes in energy prices influence the cost of energy intensive inputs (e.g., fuel and chemical inputs) and transportation costs. Therefore, the changes in the price of energy would directly affect the cost of agricultural production, food processing and marketing, and consequently the price of food to consumers. Hanson, et al. [15] imply that the increase in oil prices is regarded as a driving factor contributing to the rise in production costs and consequently agricultural commodity and food prices. Dvoskin and Heady [16] show that doubling the price of energy causes a 5% decrease in energy demand for food production and a 12% increase in the cost of food production. On the other hand, the indirect impact of energy prices on food prices can be attributed to its impact on the exchange rates. Abbott, et al. [17] found strong evidence that changes in oil prices influence the local currency. Additionally, Harri, et al. [18] argued that an increase/decrease of local currency due to the variations in energy prices could affect domestic food prices and food trade.
In recent years, most empirical studies on this topic have examined the impact of energy prices on food prices. There are three research branches in the literature related to the relation between these variables. The first strand of research argues that there is no evidence to support the effect of energy prices on food prices [9,19,20]. For instance, Reboredo [9] explores the causal linkage among global energy prices and the wheat, soybean, and corn prices for the period 1998–2011. The findings indicate that the changes in crop prices are not caused by crude oil price fluctuations. The second branch is related to studies that examine the relationship between energy and food prices during two time periods. These studies found neutrality among energy and food prices in the first period, but verify the existence of a link between the variables under study in the second period [13,21]. For example, Nazlioglu, Erdem and Soytas [21] examine the volatility spillover among energy prices and selected agricultural commodity prices using daily data over the period 1986–2011. The authors divide sample data into two sub-periods from 1986 to 2005 and from 2006 to 2011. They recognize that there is no evidence for volatility spillover among two markets in the first period, while for the second period, the authors find evidence of a volatility spillover among energy and food markets. The third group refers to the studies that found that the changes in energy prices cause food price fluctuations [11,18,22,23,24,25]. For example, Nazlioglu and Soytas [22] investigate the dynamic linkages between world oil prices, exchange rates, and crop prices for the period 1980–2010 by employing the panel co-integration analysis. They reveal that there is strong evidence that shows the changes in energy prices affect crop prices. Moreover, the findings of the econometric estimates point to the significant impact of the weak dollar in increasing food prices.
A review of the literature indicates that the majority of studies in this area focus on investigating the link between global oil prices and global food prices. In fact, there is a research gap in how domestic energy prices could influence domestic food prices. In addition, to our knowledge, there has been no study examining the impact of energy price policies on food prices in oil-exporting countries with severe trade sanctions. One of the main reasons for the scarce literature available in these countries could be difficulty in accessing data resources. Hence, due to the different economic structure of these countries with free-trade countries, conducting an empirical study in this scientific field in this group of countries can significantly contribute to the ongoing debate on the relationship energy price policies and food prices. Given the importance of this issue, the current study attempts to fill these research gaps by conducting an empirical investigation of the linkage between domestic energy and food prices, using Iran as a case study.
The key target of the current study is to explore the short- and long-term effects of energy prices and the exchange rate on ten individual food prices, using the panel Autoregressive Distributed Lag (ARDL) co-integration technique. This study contributes to the literature in several important ways. First, the impacts of domestic energy prices and exchange rate on a set of domestic food prices are investigated and, second, we use monthly data from March 1995 to February 2018, to assess the short- and long-term linkages between the variables of concern (the impact exchange rate and energy prices on food prices). Therefore, the second contribution of this study is in its use of a long enough time series to examine the long-term impacts in addition to the short-term effects. To the best of our knowledge, this is the first study that evaluates the direct and indirect impacts of energy prices on food prices in Iran.
2. Materials and Methods
Figure 1 shows the main steps of modeling and empirical analysis for examining the relationship between research variables. In the first step, it is essential to check the level of stationary of series to investigate the long-and short-term relationships among research variables. When the variables are not stationary, it is important to carry out a panel co-integration test. If this test is verified, the ARDL co-integration technique could be employed to analyze the research data. Pooled Mean Group (PMG), Dynamic Fixed Effect (DFE), and Mean Group (MG) estimation techniques have been used to estimate the short-and long-term coefficients. Finally, in order to check the robustness of the long-run coefficients, the Fully Modified Ordinary Least Square (FMOLS) and Dynamic Ordinary Least Squares (DOLS) are utilized. In the continuation of this section, more details of each step are provided.
2.1. Empirical Models
According to the aforementioned discussion, we expect food prices to be linked to energy prices and exchange rates. For model specification, we consider a log–log regression as follows:
In Equation (1), the subscripts i = 1, 2, …, 10, are for ten food products, t = 1, 2, …, T, are for months March 1995 to February 2018; is the food prices; represents the energy prices, and depicts the exchange rate (the value of Iranian rial per USD). Nazlioglu and Soytas [22] and Shaari, et al. [26] argue that energy prices are important determinants of the cost of food production and transportation (direct effect). Energy prices also have a notable impact on food prices through exchange rates (indirect effect). Hence, it is expected that rising energy prices would lead to an increase in food prices. Henneberry, et al. [27], Henneberry, et al. [28], and Radmehr and Henneberry [11] indicate that exchange rates are important factors impacting agricultural trade so that a depreciation of the national currency is expected to lead to an increase in agricultural exports (foreign demand). Therefore, the appreciation of the USD in terms of the Iranian rial is expected to contribute significantly to the increase in food prices. It is worth noting that an increase in the exchange rate means a depreciation of the Iranian rial (appreciation of the USD).
In the current study, we employ the econometric technique proposed by Pesaran, et al. [29]. The study investigates the long-and short-term relationships among food prices, exchange rate, and energy prices within the ARDL framework as follows:
Here,
In Equation (2), is the vector of the independent variables, while is the food products-level fixed effects, is the coefficient of the lagged , and represents the coefficients of the lagged independent variables.
The ARDL co-integration technique has attracted a lot of attention due to its capabilities and advantages over traditional co-integration methods. This approach considers the problems of endogeneity, as well as calculates the short-and long-run coefficients individually in a single model. Furthermore, this technique could be used when the integration ordered variables are mixed of I (0) or/and I (1) [30].
The panel ARDL by modifying the above equation into the error correction term (ECT) is as follows:
where
In Equation (4), denotes the coefficient of speed of adjustment to the long-term status; is the estimated long-run coefficients for independent variables.
To estimate the dynamic panel data models, several techniques are developed in the literature. One of the most widely used of these techniques is the PMG estimator introduced by Pesaran, Shin and Smith [29]. In this technique, it is assumed that the short-term coefficients, intercepts, and the variance of the errors are different across food groups, while the coefficients of long-term are constrained to be homogeneous across the food groups. The second approach is the MG estimator. In this method, different regressions for each food group are estimated separately and then the unweighted mean of coefficients is calculated for the entire panel. The third approach is DFE. In the DEF technique, the long- and short-term coefficients are assumed to be equal across the food groups, while excluding the intercept coefficient. To select the most appropriate estimation technique, the Hausman tests are employed.
2.2. Data
In the current study, we constructed a set of panel data of ten food products (bread and cereals, dairy, aquatic meats, beverages, sugar and sweets, fruits and dried fruits, meats, oils and fats, vegetables, and other) over the monthly period from March 1995 to February 2018. The variables employed in this study are the Iranian Consumer Price Index (CPI) of ten food products which is considered as a proxy of food prices, exchange rate (the value of Iranian rial per USD), and petroleum prices. Required data for analysis is obtained from the Statistical Centre of Iran (SCI). The data used was transformed into natural logarithms form. The summary statistics of the variables are presented in Table 1. Based on the results of this table, the average logarithmic form of food prices was 2.901 and its maximum and minimum were 5.540 and 0.073, respectively. The average petroleum price was 8.418, with a small variability (0.286), and the average logarithmic form of the exchange rate was 5.066. In addition, a comparison between sub-group foods shows that sugar and sweets had the highest average (3.293) and vegetables had the lowest average (2.368).
3. Results
3.1. Unit Root and Co-Integration Tests
The findings of the Levin, Lin, and Chu (LLC) unit root test are reported in Table 2. It is worth noting that the panel data used in this study are balanced, which means that the data for each food group and for every time period is available. Table 2 shows that the null hypothesis of this test can be accepted for the variable of lnFP. In other words, the variable of lnFP is non-stationary at the level, while stationary at first difference. Therefore, it is likely that there is a long-run co-integrating linkage among the variables of concern. Hence, to examine the existence of a long-run relationship between study variables, the Pedroni co-integration test developed by Pedroni [31] and Kao co-integration test advanced by Kao [32] were employed. The Pedroni co-integration test includes seven statistics: four statistics (panel v-statistic, rho-statistic, PP-statistic, and ADF-statistic) related to the within-dimension, and three statistics (group rho-statistic, PP-statistic, and ADF-statistic) related to the between-dimension. The null hypothesis of these two groups of statistics is no co-integration. The null hypothesis for the Kao test is similar to the Pedroni test. The findings of these tests are reported in Table 3. As can be seen in Table 3, in the Pedroni test, all statistics except the panel v-statistic statistically reject the null hypothesis of no co-integration among the research variables. Similarly, the findings of Kao test approve the presence of co-integration between study variables. Above all, we can conclude that there is explicit evidence of a long-term co-integration equilibrium between variables.
Although the findings of this section approve the existence of co-integration among the variables in this study, they do not provide the magnitude of this linkage. Therefore, in the next step, the long-term and short-term parameters are estimated by the ARDL co-integration technique.
3.2. Panel ARDL Results
In this section, we employed the three methods of the PMG, DFE, and MG to estimate the short-and long-run effects of the exchange rate and energy prices on food prices. Table 4 indicates the results of the short-term coefficients, speed of adjustment coefficients, and long-term coefficients for these three estimators. The long-term coefficients of energy prices were positive and significant in the PMG and DFE estimators, while insignificant in the MG estimator. However, energy prices significantly contributed to food prices in the short-run based on the results of the PMG, MG, and DFE estimation techniques. In this study, to compare the findings of three estimators and select the most appropriate of the method, we utilized the Hausman test. Based on this test, pairwise comparisons were performed between the MG and the PMG techniques, and the MG and the DFE techniques. The null hypothesis in the comparison between the MG and the PMG is that the PMG technique is efficient and consistent as well as preferable to the MG technique. Accepting the null hypothesis in the comparison between MG and DFE indicates that the DFE technique is efficient and consistent as well as preferable to the MG estimator.
Table 4 renders the results of the Hausman test. As seen in Table 4, the value of the Hausman test in the comparison between the MG and the PMG is statistically insignificant, showing that the PMG method is more efficient than the MG. In addition, in the term of the MG and the DFE, the results of the Hausman test confirm that the DFE estimator is more appropriate than the MG technique to estimate the ARDL panel. Therefore, it can be concluded that the PMG and DFE techniques are more appropriate than the MG technique. However, given that the PMG estimator allows heterogeneity in the short-term, in the continuation of this section, the results of this estimator will be examined.
A quantitative evaluation of the long-term effect of energy prices on food prices indicates that a 1% increase in energy prices causes a 1.499% rise in food prices. Furthermore, the results reveal that this variable exerted a positive and significant impact on food prices in the short-run. The magnitude of 0.012 shows that a 1% increase in energy prices led to a rise of 0.012% in food prices. These findings indicate that although the effect of an increase in food prices can be negligible in the short-run, its long-term effects will be considerable. The findings of this study reveal that the exchange rate has a positive long-term effect on food prices. A 1% rise in the exchange rate caused a 2.874% increase in food prices in the long-run, although the short-term coefficients were negative and insignificant. This implies that a rise in the exchange rate has the greatest long-term impact on food prices.
The coefficients of the error correction term were negative and significant in the three estimators, which shows the existence of a long-term relationship between the variables in this study. The magnitude of −0.005 in the PMG estimator shows 0.5% of deviations from the long-term equilibrium of food prices, which are corrected every month. This result reveals that food prices take a long time to return to equilibrium following the independent variable shocks.
3.3. Robustness Analysis
Due to the fact that the food groups selected in this study do not have the same share in household expenditures, the categories may contain heterogeneous properties. In this situation, the estimation problems, including serial correlation, heteroscedasticity, and endogeneity are likely to occur [33,34,35]. Hence, in the current study, to examine the robustness of the long-run coefficients estimated by the PMG estimator, the FMOLS and DOLS were employed. The FMOLS is proposed by Pedroni [36] to estimate the long-term co-integrating vectors for heterogeneous co-integrated panels. This estimator utilizes a non-parametric method to overcome the endogeneity bias and serial correlation. The DOLS estimation approach is developed by Kao and Chiang [37]. This method also considers endogeneity problems of variables and is used to check efficiency when there is a mixed order of integration among research variables [38].
Table 5 reports the FMOLS and DOLS estimation results. As seen in Table 5, food prices are positively and significantly affected by energy prices and exchange rate. In the DOLS, the coefficient magnitudes of energy prices and exchange rate were 0.91 and 1.32, respectively. These results imply that a 1% increase in energy prices and exchange rate causes a 0.91% and 1.32% rise in food prices, respectively. In the FMOLS, the coefficient values of energy prices and exchange rate were 0.93 and 1.51, respectively, indicating a 1% increase in energy prices and exchange rate that leads to a rise of 0.93% and 1.51% in food prices, respectively. The results reported in this section are similar to the PMG’s findings. Therefore, we can conclude that the PMG results are robust.
3.4. Impulse-Response Functions
In order to have a comprehensive understanding of the dynamic relationship between food prices, energy prices, and exchange rate, we estimated the impulse response function (IRF). The IRF provides explicit information about the dynamic response of food prices to exchange rate and energy price shocks. Figure 2 shows the impulse responses for the shock to food prices. The 95% confidence intervals of IRF were calculated by Monte Carlo estimated standard errors, with 500 repetitions. In Figure 2A, the effect one Standard Deviation (SD) shock in lnFP on lnFP is instantaneously positive, but its degree declines in the long-term. A positive one SD shock within energy prices leads to an increase in food prices both in the short- and long-term. Similarly, the results indicate that the effect of one SD shock in the exchange rate on food prices is positive.
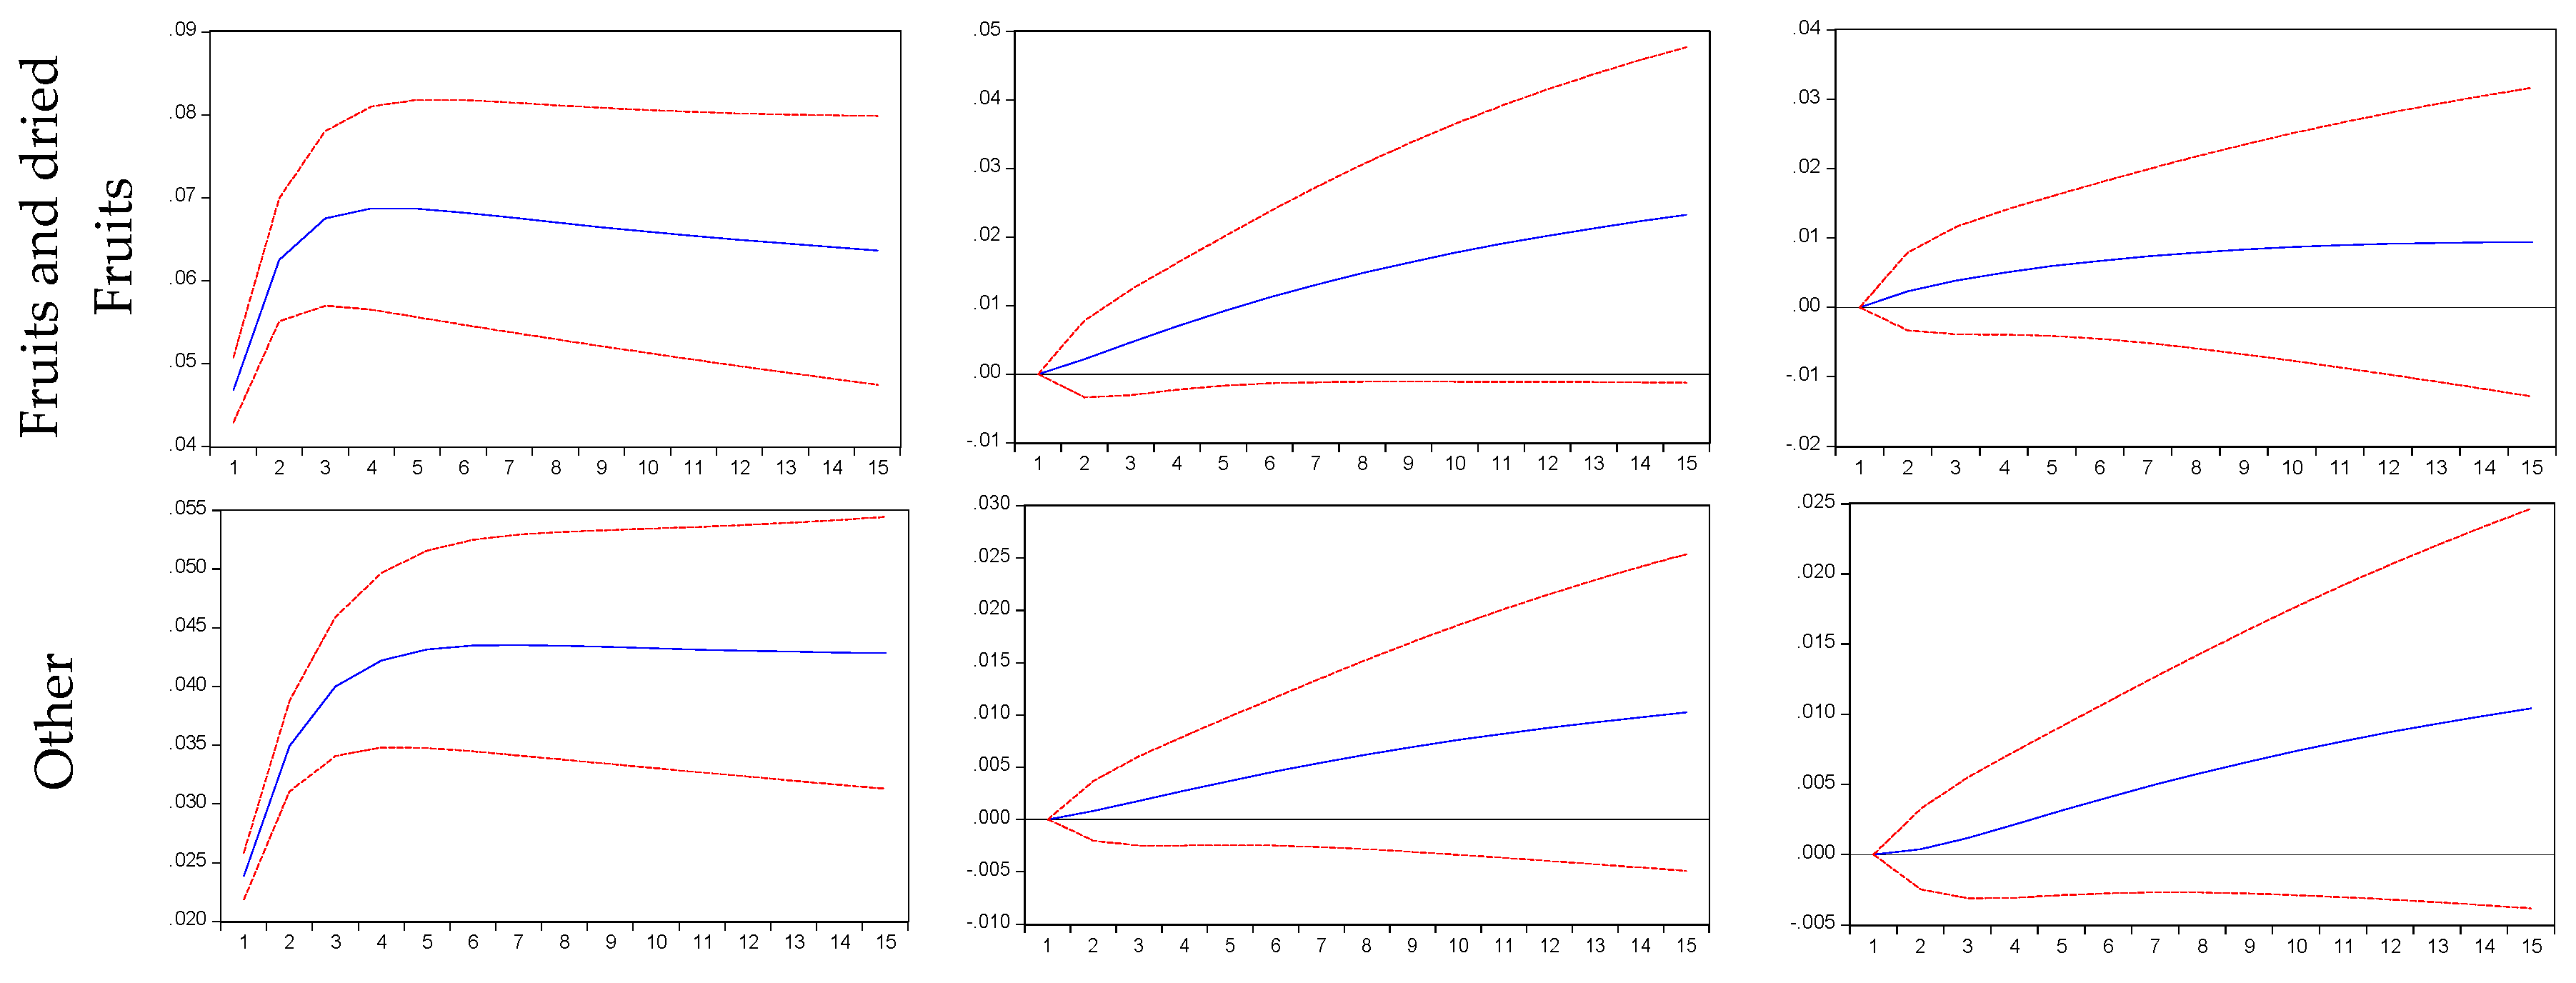
For a deeper insight into the dynamic relationship between the price of each food product and energy and currency prices, we complemented our analysis by estimating IRF separately for each food product (see Figure A1 in Appendix A). Figure A1 shows that the response of each food product price to its own shock is positive and significant in mid-term (periods 3 to 5), but these impacts decrease gradually in the long-term. These results are supported by the IRF for panel VAR presented in Figure 2A. The response of each food product price to energy price shocks indicate that it starts from zero and then grows in the long-run in all food products, which is consistent with the results obtained from Figure 2A, Table 4 and Table 5. However, the responses of all food product prices to exchange rate shocks are positive in the long-run, which is consistent with the results obtained from Figure 2C, Table 4 and Table 5.
3.5. Granger Causality
The existence of co-integration between food prices, exchange rate, and energy prices confirms the presence of Granger causality at lease in one direction. Therefore, the panel VAR-Granger causality test was implemented to evaluate the causal linkage between variables of concern (see Table 6). As the results show, there exists two-way causality between food prices and energy prices, two-way causality between food prices and exchange rate, and two-way causality between energy prices and exchange rate. Such findings are consistent with Nazlioglu and Soytas [22] and Gözgör and Kablamacı [39].
4. Discussion
In summary, the results of this study provide strong support for the role of domestic energy prices in determining food prices in both the short-and long-run periods in Iran. These results are consistent with the findings of other studies confirming that energy prices significantly contribute to the rise in global food prices [14,40,41]. These findings also are in line with the studies that show food product prices in individual countries are positively and significantly affected by the change in energy prices [22,23,42,43]. However, what distinguishes this study’s results from prior studies that examined the role energy prices on food prices in other countries is that the intensity of the long-run impact of energy prices on food prices is much higher in Iran compared with other countries. Our estimates suggest that a 1% increase in the price of energy is associated with the increase in the expected food price in the range of 0.91% to 1.49%, while these effects are much weaker in other countries. For example, Ibrahim [10] argues that a 1% increase in energy prices causes a 0.06% increase in Malaysia’s food prices. Factually, if the energy price rises, in a stable economy it is expected that the food prices increase as much as the share of energy in the cost of agricultural production, food processing and marketing, and consequently the price of food to consumers. However, in high-inflation countries such as Iran, rising energy prices could lead to increased inflation expectations of households and firms [44]; consequently, increase households’ food demand and decrease firms’ food supply (prefer to sell produce at a higher price in the future). These findings are confirmed by Figure 2A,B. As results show, a positive one SD shock within energy prices leads to an increase in food prices and it is not only eliminated but also strengthened in the long run.
The results of this study also confirm that energy prices have an indirect (in addition to direct) positive impact on food prices through an appreciation of the exchange rate. This result is consistent with the findings of Nazlioglu and Soytas [12]. It is worth mentioning that the indirect effect of fluctuations in energy prices on food prices through the exchange rate in Iran is different from the experience of other countries. In fact, the stability of the foreign exchange rates is highly influenced by political stability, and any fears about reducing oil revenues (supply of foreign currency) could motivate people to hoard foreign currencies [45]. Hence, rising energy prices with the aim of eliminating the budget deficit can be a negative signal in the foreign exchange market (appreciation of foreign currencies) which can indirectly cause changes (increase) in food prices. As these results are confirmed by Figure 2C. In fact, the impact of exchange rate shocks on food prices will intensify in the long run. To sum up, the findings reveal that food prices take a long time to return to equilibrium following independent variable shocks.
Looking at the impact of energy prices and exchange rates on each individual commodity price, the results in Figure A1 suggest that the effect one SD shock in energy price and exchange rate leads to an increase in each individual commodity price. Although the magnitude of the impact of these shocks on individual commodity prices are not same, which could be related to government financial and regulatory support for the production and supply of some food commodities [46]. For example, due to this support, the energy price and exchange rate shocks have insignificant effects on meat price.
The findings of this study indicate that the policy of increasing energy prices in Iran has serious adverse effects on inflation in food, and consequently the welfare of households and firms. Despite the importance of this topic, to our knowledge, few studies have focused on the potential effects of this policy on food prices in Iran. What emerges from the results of this study is that important factors such as political and social shocks as well as inflation expectations could play key roles in explaining the relationship energy policy and food prices in this country. Hence, future studies could fruitfully explore this issue further by quantifying these factors and incorporating in empirical models.
5. Conclusions
The current study examines the short-and long-term impacts of the exchange rate (the value of Iranian rial per USD) and energy prices on food prices in Iran, using monthly prices ranging from March 1995 to February 2018. The panel unit root test, Pedroni co-integration tests, PMG, MG, and DFE estimation techniques are applied for a panel of ten food products. We used the Hausman test to choose among these estimation techniques. According to this test, the PMG is selected, as this technique is most efficient. The estimated long-run coefficients of panel ARDL are also evaluated for robustness using the DOLS and FMOLS. Therefore, it can be concluded from the results of this study that the continuation of the current energy policy leading to rising energy prices will cause an increase in food prices and, therefore, it will have a negative impact on consumer welfare, especially in low-income deciles of Iranian population who spend about 44 percent of their income on food products (high-income deciles spend about 17 percent of their income on food). Hence, rising energy prices would increase the share from food in the spending basket of low-income households which is certainly expected to lead to more food costs insecurity. Thus, policy-decision makers should take into account the adverse effects of the changes in energy prices on domestic food prices when designing income support and economic stabilization policies. Furthermore, to overcome the negative effects of rising energy prices on consumer welfare, the government should implement complementary food policies such as price controls, export tariffs and other export restrictive policies, and import expansion policies. It has been demonstrated that the policy of increasing energy prices can indirectly affect food prices through the exchange rate. Given this fact, policy makers should take into account the indirect effect of oil prices on food price stabilization policies. From the manufacturers’ point of view, given that a significant portion of the inputs required to produce food are supplied through imports, appreciation of foreign currencies leads to an increase in the cost of food production. In this situation, if the government does not support manufacturing firms, it can be expected to reduce investment, production, demand, and consequently be conductive to the emergence of stagflation. Furthermore, the results indicate that the elimination of energy subsidies can play a crucial role in increasing inflation expectations of households and firms, which in turn could exacerbate the negative effects of this policy on food prices. Hence, in this situation, communication strategies and management of economic expectations that directly targets the beliefs of households and firms could therefore serve not only to reduce the food inflation but also enhance the economic stability. The results of the current study can provide useful information for domestic and international manufacturers, traders, and investors in predicting prices with higher confidence. For example, when energy prices and exchange rate (the value of dollar) rise, manufacturers can expect to raise prices and production costs (especially those who are dependent on imported inputs.).
Author Contributions
Conceptualization, R.R. and S.R.H.; methodology, R.R.; software, R.R.; validation, R.R. and S.R.H.; formal analysis, R.R.; investigation, R.R. and S.R.H.; writing—original draft preparation, R.R.; writing—review and editing, S.R.H.; visualization, R.R. and S.R.H.; supervision, S.R.H.; and project administration, S.R.H. All authors have read and agreed to the published version of the manuscript.
Funding
The research was partially supported from the teaching funds generated from Shida Henneberry’s classes in the Department of Agricultural Economics and the Master of International Agriculture Program (MIAP) at Oklahoma State University (OSU). Article Publication Charges (APC) were paid by the Department of Agricultural Economics Research Funds at OSU.
Conflicts of Interest
The authors declare no conflict of interest.
Appendix A
Figure A1.
Impulse response function (IRF) of each food product to energy price and exchange rate shocks.
Figure A1.
Impulse response function (IRF) of each food product to energy price and exchange rate shocks.


References
- Moshiri, S. Energy Price Reform and Energy Efficiency in Iran. IAEE Energy Forum 2013, 2013, 33–37. [Google Scholar]
- Moshiri, S. Consumer responses to gasoline price and non-price policies. Energy Policy 2020, 137, 111078. [Google Scholar]
- Salehi-Isfahani, D.; Stucki, B.W.; Deutschmann, J. The Reform of Energy Subsidies in Iran: The Role of Cash Transfers. Emerg. Mark. Finance Trade 2015, 51, 1144–1162. [Google Scholar] [CrossRef]
- Benson, T.; Mugarura, S.; Wanda, K. Impacts in Uganda of rising global food prices: The role of diversified staples and limited price transmission. Agric. Econ. 2008, 39, 513–524. [Google Scholar]
- Wodon, Q.; Zaman, H. Rising Food Prices in Sub-Saharan Africa: Poverty Impact And Policy Responses; World Bank Policy Research Working Paper; The World Bank: Washington, DC, USA, 2008. [Google Scholar]
- Green, R.; Cornelsen, L.; Dangour, A.D.; Turner, R.; Shankar, B.; Mazzocchi, M.; Smith, R.D. The effect of rising food prices on food consumption: Systematic review with meta-regression. BMJ 2013, 346, f3703. [Google Scholar]
- Zheng, Z.; Henneberry, S.R. Estimating the impacts of rising food prices on nutrient intake in urban China. China Econ. Rev. 2012, 23, 1090–1103. [Google Scholar]
- Gallet, C.A. The demand for fish: A meta-analysis of the own-price elasticity. Aquac. Econ. Manag. 2009, 13, 235–245. [Google Scholar]
- Reboredo, J.C. Do food and oil prices co-move? Energy Policy 2012, 49, 456–467. [Google Scholar]
- Ibrahim, M.H. Oil and food prices in Malaysia: A nonlinear ARDL analysis. Agric. Food Econ. 2015, 3, 190. [Google Scholar] [CrossRef] [Green Version]
- Radmehr, R.; Henneberry, S.R. The Impact of Prices of Oil, Currency, and Capital on Food Prices: An Empirical Evidence from the Panel VAR Analysis. In Proceedings of the Southern Agricultural Economics Association (SAEA) Annual Meeting, Birmingham, AL, USA, 2–5 February 2019. [Google Scholar]
- Nazlioglu, S.; Soytas, U. World oil prices and agricultural commodity prices: Evidence from an emerging market. Energy Econ. 2011, 33, 488–496. [Google Scholar]
- Chen, S.-T.; Kuo, H.-I.; Chen, C.-C. Modeling the relationship between the oil price and global food prices. Appl. Energy 2010, 87, 2517–2525. [Google Scholar]
- Saghaian, S.H. The impact of the oil sector on commodity prices: Correlation or causation? J. Agric. Appl. Econ. 2010, 42, 477–485. [Google Scholar]
- Hanson, K.; Robinson, S.; Schluter, G. Sectoral Effects of a World Oil Price Shock: Economywide Linkages to the Agricultural Sector. J. Agric. Appl. Econ. 1993, 18, 96–116. [Google Scholar]
- Dvoskin, D.; Heady, E.O. Commodity Prices and Resource Use Under Various Energy Alternatives in Agriculture. West. J. Agric. Econ. 1977, 2, 53–62. [Google Scholar]
- Abbott, P.C.; Hurt, C.; Tyner, W.E. What’s Driving Food Prices? Farm Foundation: Oak Brook, IL, USA, 2008. [Google Scholar]
- Harri, A.; Nalley, L.; Hudson, D. The relationship between oil, exchange rates, and commodity prices. J. Agric. Appl. Econ. 2009, 41, 501–510. [Google Scholar]
- Fowowe, B. Do oil prices drive agricultural commodity prices? Evidence from South Africa. Energy 2016, 104, 149–157. [Google Scholar]
- Zhang, Z.; Lohr, L.; Escalante, C.; Wetzstein, M. Food versus fuel: What do prices tell us? Energy Policy 2010, 38, 445–451. [Google Scholar]
- Nazlioglu, S.; Erdem, C.; Soytas, U. Volatility spillover between oil and agricultural commodity markets. Energy Econ. 2013, 36, 658–665. [Google Scholar]
- Nazlioglu, S.; Soytas, U. Oil price, agricultural commodity prices, and the dollar: A panel cointegration and causality analysis. Energy Econ. 2012, 34, 1098–1104. [Google Scholar]
- Hezareh, R.; Shnoushi, N.; Mohammadi, H.; Saghaian, S.M. Analysing the role of economic variables on food prices in the selected oil exporting and importing countries. Agric. Econ. 2015, 9, 75–96. [Google Scholar]
- Esmaeili, A.; Shokoohi, Z. Assessing the effect of oil price on world food prices: Application of principal component analysis. Energy Policy 2011, 39, 1022–1025. [Google Scholar]
- Alghalith, M. The interaction between food prices and oil prices. Energy Econ. 2010, 32, 1520–1522. [Google Scholar]
- Shaari, M.S.; Hussain, N.E.; Abdullah, H. The effects of oil price shocks and exchange rate volatility on inflation: Evidence from Malaysia. Int. Bus. Res. 2012, 5, 106–112. [Google Scholar]
- Henneberry, D.; Henneberry, S.; Tweeten, L. The strength of the dollar: An analysis of trade-weighted foreign exchange rate indices with implications for agricultural trade. Agribusiness 1987, 3, 189–206. [Google Scholar]
- Henneberry, D.; Drabenstott, M.; Henneberry, S. A weaker dollar and US farm exports: Coming rebound or empty promise? Econ. Rev. 1987, 72, 22–36. [Google Scholar]
- Pesaran, M.H.; Shin, Y.; Smith, R.P. Pooled mean group estimation of dynamic heterogeneous panels. J. Am. Stat. Assoc. 1999, 94, 621–634. [Google Scholar]
- Saint Akadiri, S.; Alola, A.A.; Akadiri, A.C.; Alola, U.V. Renewable energy consumption in EU-28 countries: Policy toward pollution mitigation and economic sustainability. Energy Policy 2019, 132, 803–810. [Google Scholar]
- Pedroni, P. Critical values for cointegration tests in heterogeneous panels with multiple regressors. Oxf. Bull. Econ. Stat. 1999, 61, 653–670. [Google Scholar]
- Kao, C. Spurious regression and residual-based tests for cointegration in panel data. J. Econom. 1999, 90, 1–44. [Google Scholar]
- Stock, J.H.; Watson, M.W. A simple estimator of cointegrating vectors in higher order integrated systems. Econom. J. Econom. Soc. 1993, 61, 783–820. [Google Scholar]
- Rehman, F.U.; Noman, A.A.; Ding, Y. Does infrastructure increase exports and reduce trade deficit? Evidence from selected South Asian countries using a new Global Infrastructure Index. J. Econ. Struct. 2020, 9, 10. [Google Scholar]
- Isaiah Zayone, T.; Henneberry, S.R.; Radmehr, R. Effects of Agricultural, Manufacturing, and Mineral Exports on Angola’s Economic Growth. Energies 2020, 13, 1494. [Google Scholar]
- Pedroni, P. Fully modified OLS for heterogeneous cointegrated panels and the case of purchasing power parity. Manuscr. Dep. Econ. Indiana Univ. 1996, 5, 1–45. [Google Scholar]
- Kao, C.; Chiang, M.-H. On the estimation and inference of a cointegrated regression in panel data. Available at SSRN 1807931. 1999. Available online: https://papers.ssrn.com/sol3/papers.cfm?abstract_id=1807931 (accessed on 5 August 2019).
- Alam, M.M.; Murad, M.W. The impacts of economic growth, trade openness and technological progress on renewable energy use in organization for economic co-operation and development countries. Renew. Energy 2020, 145, 382–390. [Google Scholar]
- Gözgör, G.; Kablamacı, B. The linkage between oil and agricultural commodity prices in the light of the perceived global risk. Agric. Econ. Zemed. Ekon. 2014, 60, 332–342. [Google Scholar]
- Rezitis, A.N. The relationship between agricultural commodity prices, crude oil prices and US dollar exchange rates: A panel VAR approach and causality analysis. Int. Rev. Appl. Econ. 2015, 29, 403–434. [Google Scholar]
- Shahnoushi, N.; Saghaian, S.; Hezareh, R.; Tirgari Seraji, M. Investigation of Relationship Between World Food Prices and Energy Price: A Panel SUR Approach. In Proceedings of the Southern Agricultural Economics Association (SAEA) Annual Meeting, Birmingham, AL, USA, 4–7 February 2017. [Google Scholar]
- Kohansal, M.R. Hezareh, The impacts of oil price shocks, exchange rate on food prices in urban areas of Iran. J. Agric. Econ. Res. 2017, 8, 171–190. [Google Scholar]
- Udoh, E.; Egwaikhide, F.O. Does international oil price volatility complement domestic food price instability in Nigeria? An empirical enquiry. Int. J. Econ. Financ. 2012, 4, 235–246. [Google Scholar]
- Coibion, O.; Gorodnichenko, Y.; Kumar, S.; Pedemonte, M. Inflation expectations as a policy tool? J. Int. Econ. 2020, 124, 103297. [Google Scholar] [CrossRef]
- Habibi, N. The Iranian economy in the shadow of economic sanctions. Middle East Brief 2008, 31, 1–8. [Google Scholar]
- Darbandi, E.; Radmehr, R.; Saghaian, S.H. The Impact of Consumer Beef Safety Awareness on US Beef Exports. Int. Trade J. 2020, 1–22. [Google Scholar]
Figure 1.
Flowchart of research methodology.

Figure 2.
Impulse response function (IRF). (A) Response of lnFP to lnFP; (B) Response of lnFP to lnEP; (C) Response of lnFP to lnEX.
Figure 2.
Impulse response function (IRF). (A) Response of lnFP to lnFP; (B) Response of lnFP to lnEP; (C) Response of lnFP to lnEX.


Table 1.
Summary statistics of the variables.
| Variables | Mean | Standard Deviation | Minimum | Maximum |
|---|---|---|---|---|
| 8.418 | 0.286 | 7.918 | 8.939 | |
| 5.066 | 1.597 | 2.305 | 6.907 | |
| 2.901 | 1.273 | 0.073 | 5.540 | |
| 2.564 | 1.423 | 0.578 | 4.975 | |
| 3.025 | 1.174 | 1.009 | 5.110 | |
| 2.787 | 1.242 | 0.946 | 5.402 | |
| 3.126 | 1.024 | 1.617 | 5.277 | |
| 3.293 | 0.923 | 1.759 | 5.148 | |
| 2.556 | 1.541 | 0.135 | 5.267 | |
| 3.072 | 1.181 | 1.042 | 5.534 | |
| 3.107 | 1.056 | 1.640 | 5.166 | |
| 2.368 | 1.581 | 0.073 | 5.540 | |
| 3.116 | 1.073 | 1.514 | 5.428 |
Table 2.
Unit root test results.
| lnFP | lnEX | lnEP | |
|---|---|---|---|
| LLC test (level) | 0.086 | −1.2959 * | −3.7628 *** |
| LLC test (first difference) | −1.3873 * | - | - |
* and *** respectively, show the rejection of null hypothesis of unit root at the 10% and 1% levels.
Table 3.
Co-integration test results.
| Statistic | p-Value | Weighted Statistic | p-Value | |
|---|---|---|---|---|
| Pedroni co-integration test | ||||
| Panel v-statistic | 0.9345 | 0.1750 | 1.0036 | 0.1578 |
| Panel rho-statistic | −5.2606 *** | 0.0000 | −5.1776 *** | 0.0000 |
| Panel PP-statistic | −3.3788 *** | 0.0004 | −3.2999 *** | 0.0005 |
| Panel ADF-statistic | −2.8810 *** | 0.0020 | −2.7587 *** | 0.0029 |
| Group rho-statistic | −3.9149 *** | 0.0000 | ||
| Group PP-statistic | −2.9137 *** | 0.0018 | ||
| Group ADF-statistic | −2.2147 ** | 0.0134 | ||
| Kao co-integration test | ||||
| Statistic | p-value | |||
| ADF | −4.4378 *** | 0.0000 | ||
| Residual variance | 0.0013 | |||
| HAC variance | 0.0032 | |||
** and *** respectively, show the rejection of null hypothesis of no co-integration at the 5% and 1% levels.
Table 4.
Food prices, energy prices, and exchange rate: The dynamic model.
| PMG | MG | DFE | ||||
|---|---|---|---|---|---|---|
| D.V: lnFP | Long-Term | Short-Term | Long-Term | Short-Term | Long-Term | Short-Term |
| ECT | −0.005 *** (0.001) | −0.007 *** (0.002) | −0.006 *** (0.0009) | |||
| −0.008 (0.015) | −0.009 (0.108) | −0.009 (0.106) | ||||
| 0.012 ** (0.005) | 0.106 ** (0.004) | 0.011 ** (0.004) | ||||
| 2.874 *** (0.786) | 1.6889 (1.565) | 3.013 *** (0.503) | ||||
| 1.499 *** (0.219) | 0.816 (0.571) | 1.391 *** (0.128) | ||||
| Constant | −0.147 *** (0.038) | −0.181 *** (0.029) | −0.187 *** (0.029) | |||
| Hausman Test | 1.05 # | 0.01@ | ||||
| Hausman test p-value | 0.592 | 0.997 | ||||
| Observations | 2870 | 2870 | 2870 | |||
** and *** respectively, significance at the 5% and 1% levels. Standard errors in parentheses. # shows comparing MG with PMG. @ shows comparing MG with DFE.
Table 5.
Dynamic Ordinary Least Squares (DOLS) and Fully Modified Ordinary Least Square (FMOLS) estimation results.
Table 5.
Dynamic Ordinary Least Squares (DOLS) and Fully Modified Ordinary Least Square (FMOLS) estimation results.
| DOLS | FMOLS | |||
|---|---|---|---|---|
| D.V: lnFP | Coef. | Std. Err | Coef. | Std. Err |
| 1.32 *** | 0.101 | 1.51 *** | 0.092 | |
| 0.91 *** | 0.018 | 0.93 *** | 0.016 | |
| Observations | 2870 | 2870 | ||
***, significance at the 1% level.
Table 6.
Granger causality Wald test.
| Excluded | Chi-sq | df | p-Value |
|---|---|---|---|
| D.V: lnFP | |||
| 26.427 *** | 2 | 0.000 | |
| 11.372 *** | 2 | 0.003 | |
| All | 26.861 *** | 4 | 0.000 |
| D.V: lnEP | |||
| lnFP | 26.318 *** | 2 | 0.000 |
| 23.613 *** | 2 | 0.000 | |
| All | 37.455 *** | 4 | 0.000 |
| D.V: lnEX | |||
| lnFP | 11.527 *** | 2 | 0.003 |
| 7.996 ** | 2 | 0.018 | |
| All | 11.602 ** | 4 | 0.020 |
** and *** respectively, significance at the 5%, and 1% levels.
© 2020 by the authors. Licensee MDPI, Basel, Switzerland. This article is an open access article distributed under the terms and conditions of the Creative Commons Attribution (CC BY) license (http://creativecommons.org/licenses/by/4.0/).
Share and Cite
MDPI and ACS Style
Radmehr, R.; Rastegari Henneberry, S. Energy Price Policies and Food Prices: Empirical Evidence from Iran. Energies 2020, 13, 4031. https://0-doi-org.brum.beds.ac.uk/10.3390/en13154031
AMA Style
Radmehr R, Rastegari Henneberry S. Energy Price Policies and Food Prices: Empirical Evidence from Iran. Energies. 2020; 13(15):4031. https://0-doi-org.brum.beds.ac.uk/10.3390/en13154031
Chicago/Turabian StyleRadmehr, Riza, and Shida Rastegari Henneberry. 2020. "Energy Price Policies and Food Prices: Empirical Evidence from Iran" Energies 13, no. 15: 4031. https://0-doi-org.brum.beds.ac.uk/10.3390/en13154031
Note that from the first issue of 2016, this journal uses article numbers instead of page numbers. See further details here.