Article

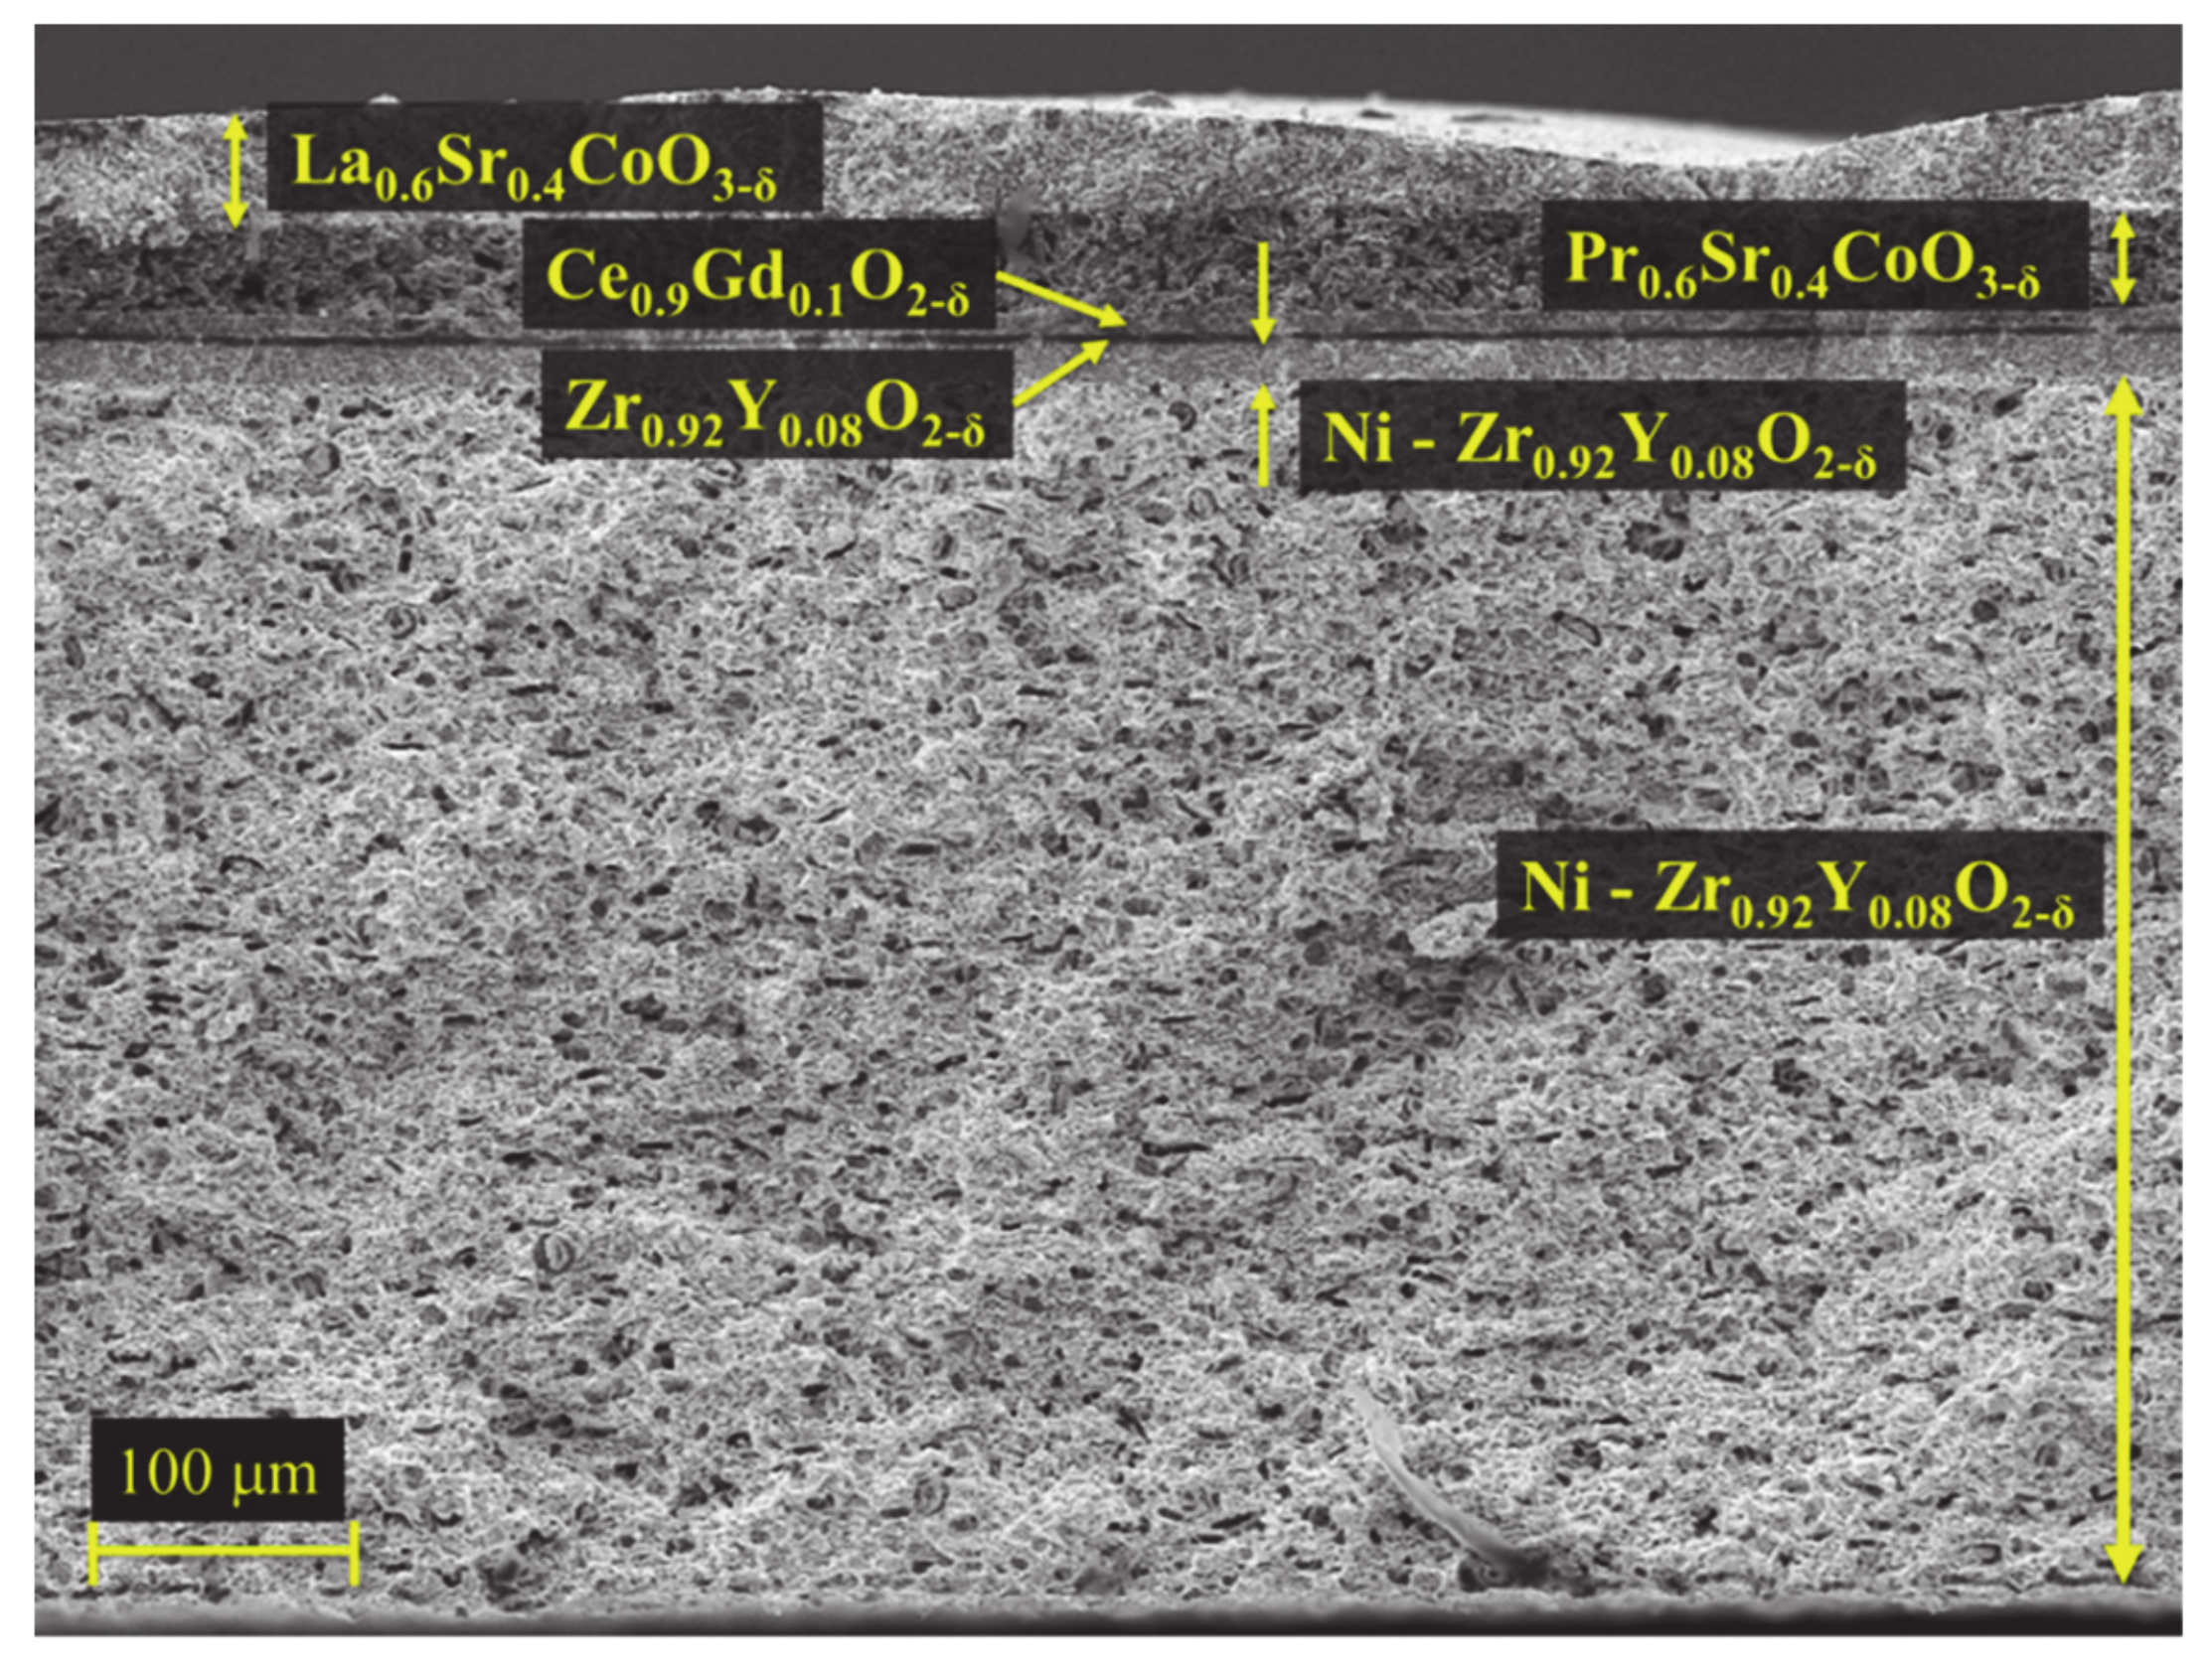
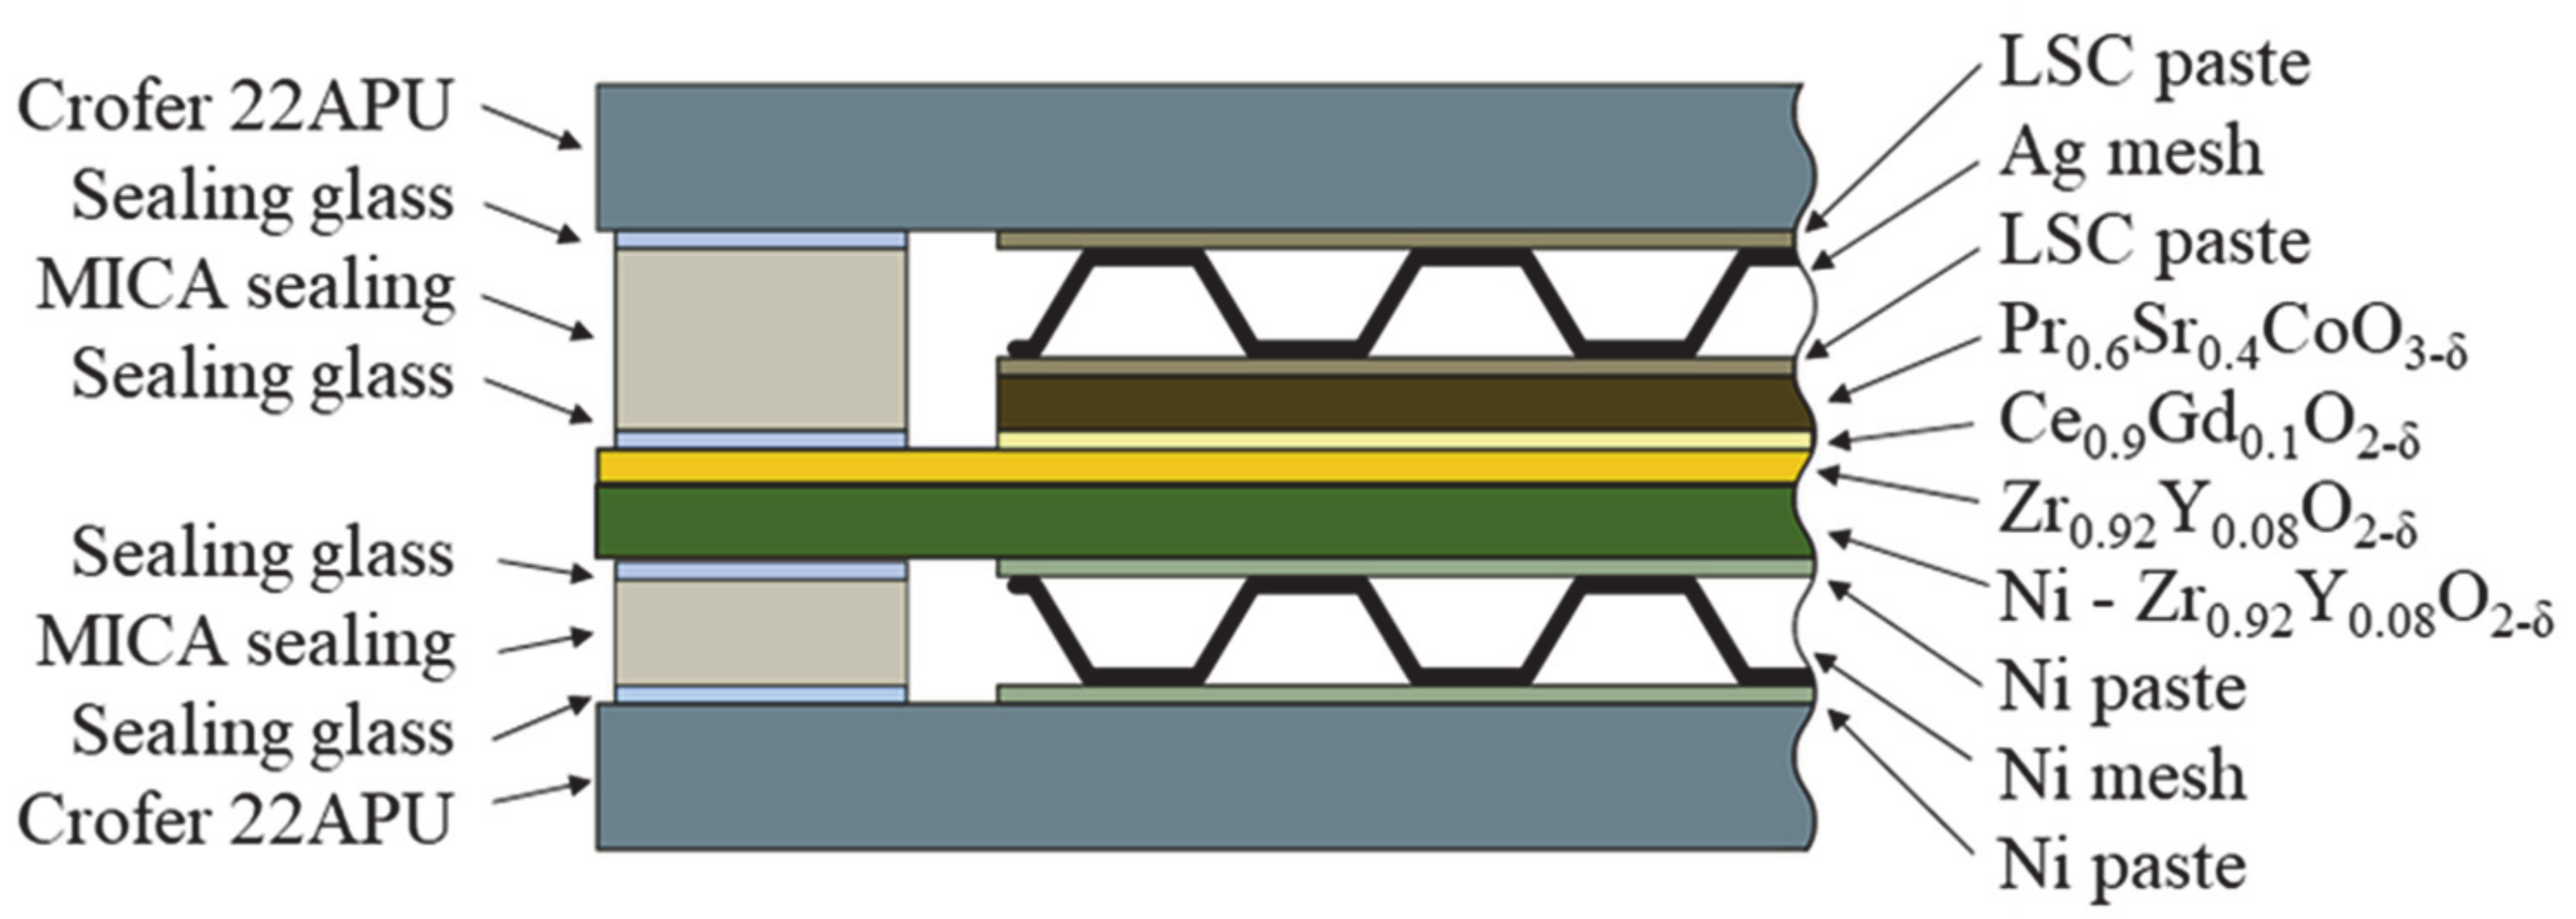
Study of Long-Term Stability of Ni-Zr0.92Y0.08O2-δ|Zr0.92Y0.08O2-δ|Ce0.9Gd0.1O2-δ |Pr0.6Sr0.4CoO3-δ at SOFC and SOEC Mode

Institute of Chemistry, Faculty of Science and Technology, University of Tartu, 50411 Tartu, Estonia
*
Author to whom correspondence should be addressed.
Submission received: 21 December 2020 / Revised: 20 January 2021 / Accepted: 27 January 2021 / Published: 4 February 2021
(This article belongs to the Special Issue Design, Modeling, and Optimization of Novel Fuel Cell Systems)

Abstract

:
Long term stability is one of the decisive properties of solid oxide fuel cell (SOFC) as well as solid oxide electrolysis cell (SOEC) materials from the commercialization perspective. To improve the understanding about degradation mechanisms solid oxide cells with different electrode compositions should be studied. In this work, Ni-Zr0.92Y0.08O2-δ (Ni-YSZ)| Zr0.92Y0.08O2-δ (YSZ)|Ce0.9Gd0.1O2-δ (GDC)|Pr0.6Sr0.4CoO3-δ (PSC) cells are tested in the SOFC regime for 17,820 h at 650 °C, and in the SOEC regime for 860 h at 800 °C. The SOFC experiment showed a degradation speed of 2.4% per 1000 h at first but decreased to 1.1% per 1000 h later. The electrolysis test was performed for 860 h at 800 °C. The degradation speed was 16.3% per 1000 h. In the end of the stability tests, an electrode activity mapping was carried out using a novel 18O tracing approach. Average Ni grain sizes were measured and correlated with the results of the oxygen isotope maps. Results indicate that Ni coarsening is dependent on solid oxide cell activity. Strontium, chromium and silicon concentrations were also analyzed using the ToF-SIMS method and compared to the electrode activity map, but significant correlation was not observed.

1. Introduction

The increasing demand for electrical energy and the simultaneous need to reduce greenhouse gas emissions turns the public interest from conventional fossil fuel based thermal power systems to sustainable energy solutions. One promising technology that makes possible the conversion of fuel to electricity and excess electricity to fuel is the reversible solid oxide cell (RSOC). If RSOC works as a solid oxide fuel cell (SOFC), then it converts chemical energy to electricity, but if it works as a solid oxide electrolysis cell (SOEC), then it could be used for electrolysis of water as well as CO2 [1], or for co-electrolysis of water and CO2 for production of valuable synthesis gas (H2 + CO) [2,3].
For successful commercialization, several conditions should be fulfilled. In addition to high activity and reasonable production price, time stability is one of the most important criteria. The estimated required durability for SOFC mobile applications is approximately 20,000 h and for stationary application approximately 40,000 h [4]. For electrolysis cells, approximately 40,000 h durability with high fuel production rate is necessary for commercialization [5,6]. However, long term electrochemical performance characterization is resource intensive and, therefore, only some commercially interesting compositions have been tested in the time range of several thousand hours [7].
Some degradation mechanisms in SOFC and SOEC electrodes are same or very similar, for example, Ni coarsening in humid atmosphere in SOFC anode and SOEC cathode, poisoning of TPB with Si particles or Cr poisoning. However, very different degradation mechanisms also appear in SOEC mode compared to SOFC mode, like nano ZrO2 precipitation from Zr dissolved in Ni bulk [8,9] or formation of cracks along the grain boundary close to the electrolyte–oxygen electrode interface, which might result in oxygen electrode delamination [10]. It should be remembered that the electrode kinetics of processes occurring on hydrogen and oxygen electrodes in SOFC and SOEC modes are different [11,12], and also that thermal equilibria vary at different SOC operation modes. Oxidation of fuel in the SOFC process is exothermic while electrolysis of water consumes energy, and the total energy flow (considering reaction entropy changes and joule heat) is dependent on electrode potential. There is an excess of heat if SOEC operates at higher potentials than thermoneutral voltage, and additional heat should be supplied if SOEC is operating at lower voltages. The applied voltage largely defines the degradation mechanism and speed in the SOEC cell.
The most exhaustively studied solid oxide membrane-electrode systems contain yttria stabilized zirconia (YSZ) as an electrolyte, Sr doped LaMnO3 (LSM) as the oxygen electrode and a cermet of Ni and YSZ (Ni-YSZ) as the fuel electrode [13]. These materials show good thermomechanical and chemical compatibility between electrolyte and electrode layers and adequate electrochemical performance. Tests lasting more than 40,000 h in the SOFC regime have been carried out successfully [7]. Strontium doped lanthanum cobaltite, La1-xSrxCoO3-δ (LSC) and strontium and cobalt co-doped lanthanum ferrite La1-xSrxFe1-yCoyO3-δ (LSCF) are also attractive cathode material candidates for intermediate temperature SOFCs [14,15,16,17,18] and have been studied successfully in long term tests [10]. However, for better understanding of processes occurring in operating SOCs, alternative materials should also be tested in long term tests. Pr0.6Sr0.4CoO3-δ (PSC) is an interesting alternative for the LSM, LSC and LSCF cathodes because of its high activity [19,20,21] and good stability in medium length tests of button cells.
This study provides long-term electrochemical short stack test results using Ni-YSZ|YSZ|GDC|Pr0.6Sr0.4CoO3-δ solid oxide cells in fuel cells, as well as in electrolysis mode. Experiments were carried out in Crofer 22 APU gas compartments. After the long-term electrochemical performance test, the Ni-YSZ|YSZ|GDC|Pr0.6Sr0.4CoO3-δ membrane electrode assembly (MEA) was systematically characterized using the high resolution electron microscopy (HR-SEM) and time of flight secondary ion mass spectrometry (ToF-SIMS) methods. ToF-SIMS was used to conduct an oxygen isotope tracing experiment and to investigate distribution of strontium, silicon and chromium in the electrolyte, Ni-YSZ electrode and PSC electrode, respectively [22,23,24,25,26]. HR-SEM was used to evaluate the changes in the microstructure of the MEA of the fuel cell.

2. Materials and Methods

2.1. Sample Preparation

The electrochemical SOFC and SOEC tests were performed using identical solid oxide cells with an active area of 3.5 × 4 cm. Commercial hydrogen electrode supported NiO-YSZ|YSZ half-cells were used to support the oxygen electrode. The chemical barrier layer between the electrolyte and the oxygen electrode was prepared by screen-printing a thin layer of GDC paste (ESL) followed by 30 h sintering at 1300 °C. A raw powder of PSC was prepared using a glycine-nitrite process, starting from praseodymium, strontium and cobalt nitrates [27].
The screen-printing paste from PSC raw powder was prepared as described in our previous paper and screen-printed onto the chemical barrier layer made from GDC. The screen-printed PSC layer was sintered at 1100 °C for 3 h [17,28]. A SEM micrograph of the cross section of the solid oxide cell used in the current work is presented in Figure 1.
The long term SOC testing setup used in this study (furnace, cermet, collectors, sealings, etc.) was provided by Fuel Cell Materials and modified in-house. A schematic overview about the current collector-MEA-current collector assembly is presented in Figure 2. A mica seal from Fuel Materials and sealing glass from Schott (G018 354) was used. On the oxygen electrode side, LSC conductive ink from Fuel Cell Materials was used and a 3.5 × 4 cm silver mesh was attached as a contact structure.
The electrochemical test was carried out in a MELLEN (Single stack) furnace (The Mellen Company, Inc., Concord, NH, USA). In the beginning of the experiment, the temperature was slowly (3 °C min−1) increased to 850 °C for 1 h and then decreased to 800 °C to start reduction of the fuel electrode. For reduction of the NiO-YSZ, the gas mixture of 5% hydrogen and 95% nitrogen was fed to the electrode. The concentration of hydrogen was slowly increased to 100% during 4 h. The PSC electrode was flooded with air (compressed air).

2.2. Durability Tests

For the SOFC test (after reduction of Ni cermet), the temperature of the Ni-YSZ|YSZ|GDC|PSC cell was reduced to 650 °C. The hydrogen fuel flow rate was set to 50 mL min−1 and the air flow rate was set to 250 mL min−1. Fuel and oxidant flow directions were opposite to each other. The SOFC short stack was operated at a voltage of 0.85 V. The experiment lasted 17,820 h. In the end of the SOFC test, the activity mapping experiment was carried out. For this purpose, the air was replaced with a 20% mixture of 18O2 in nitrogen with a total flow rate 100 mL min−1. The 18O2 containing gas was introduced to the oxygen electrode compartment at OCV conditions. After 30 s at OCV to fill the gas compartment with 18O2 rich gas, a current of 0.1 A was applied in fuel cell mode for 90 s. In the final step after applying the current, the 18O2 flow was replaced with pure N2 (to avoid 16O2 in the gas compartment) and the cell was quickly cooled to room temperature.
The experimental configuration of the durability test at SOE mode was built identically to the SOFC setup using the same materials and procedures. The procedure for NiO-YSZ reduction was similar as in the case of SOFC test. The gas mixture for electrolysis was prepared from hydrogen, nitrogen and water. A gas mixture with 20% of hydrogen and 80% of nitrogen with total flow speed of 100 mL min−1 was introduced to the humidifier (FC100, Perma Pure LLC, Lakewood, NJ, USA) at 80 °C temperature, which provides around 46% water content in the carrier gas. Final composition of the gas was 46% water, 10.8% hydrogen and 43.2% of nitrogen, and the total gas flow rate after humidification was 185 mL min−1. The water temperature in the Perma Pure humidifier was maintained using a Julabo Corio-CD (JULABO GmbH, Seelbach, Germany) heating circulator. The electrochemical test of electrolysis was carried out at 800 °C and at the cell voltage of 1.5 V. The higher testing temperature was chosen because of insufficient current densities at 650 °C. The duration of the electrolysis test was 860 h. Immediately after finishing the SOE test, a similar electrode activity mapping was carried out like it was done after the SOFC test and as described above in the section of SOFC test.
To control electrode potential and to record current density values during the SOFC durability tests, a BK Precision 8500 Programmable DC Electronic (Sefram, Saint-Étienne, France) load connected with the PC was used to collect data. For electrical control in electrolysis mode, an AIM-TTi QPX1200SP (Aim-TTi, Huntington, UK) power supply connected with PC was used. The long term continuous test at the SOFC mode was carried out at 0.85 V cell potential. To construct the i-E curves at temperatures from 600 to 800 °C, the current densities at 0.8, 0.9 and 1 V electrochemical cell voltage values were recorded. The current density values during the electrolysis test were recorded starting from 0.9 V to 1.5 V and at temperatures from 650 to 850 °C. The current density values at different temperatures were also used to calculate total activation energies (Ea tot). During the electrolysis test, electrochemical impedance spectrometry (EIS) measurements were performed four times during the experiment (Solartron analytical 1400 and 1470E celltest system, Ametek, inc., Berwyn, PA, USA) at voltages from 0.9 to 1.5 V.

2.3. ToF-SIMS and HR-SEM Analysis

After the long-term test at fuel cell mode, the test rig was disassembled and the active area of the fuel cell MEA was broken into small pieces. The pieces were carefully broken from the MEA so that the studied surface sites were approximately equal distance from one another and formed a regular grid. Thirty-six pieces were selected that formed a 6-by-6 grid on the active area of the cell. The cross-sections of these pieces were characterized using HR-SEM and ToF-SIMS. The cross-sections of these fractures were scanned for positive and negative ions with the PHI TRIFT V nanoTOF time of flight secondary ion mass spectrometer (Physical Electronics, Inc. (PHI), Chanhassen, MN, USA) within a raster of 100 × 100 µm (Ga+, 30 keV). The HR-SEM (Zeiss EVO MA 15, Washington & Lee, Lexington, VA, USA) pictures of each material layer were taken at different magnifications.
The electrolysis test cell was also fractured and characterized at 36 places in a manner similar to the SOFC cell. The ToF-SIMS scans for negative and positive ions were measured within a raster of 50 × 50 µm. Pictures of some of the fractures were also taken with an HR-SEM at magnifications of 5000 and 15,000 times.

3. Results and Discussion

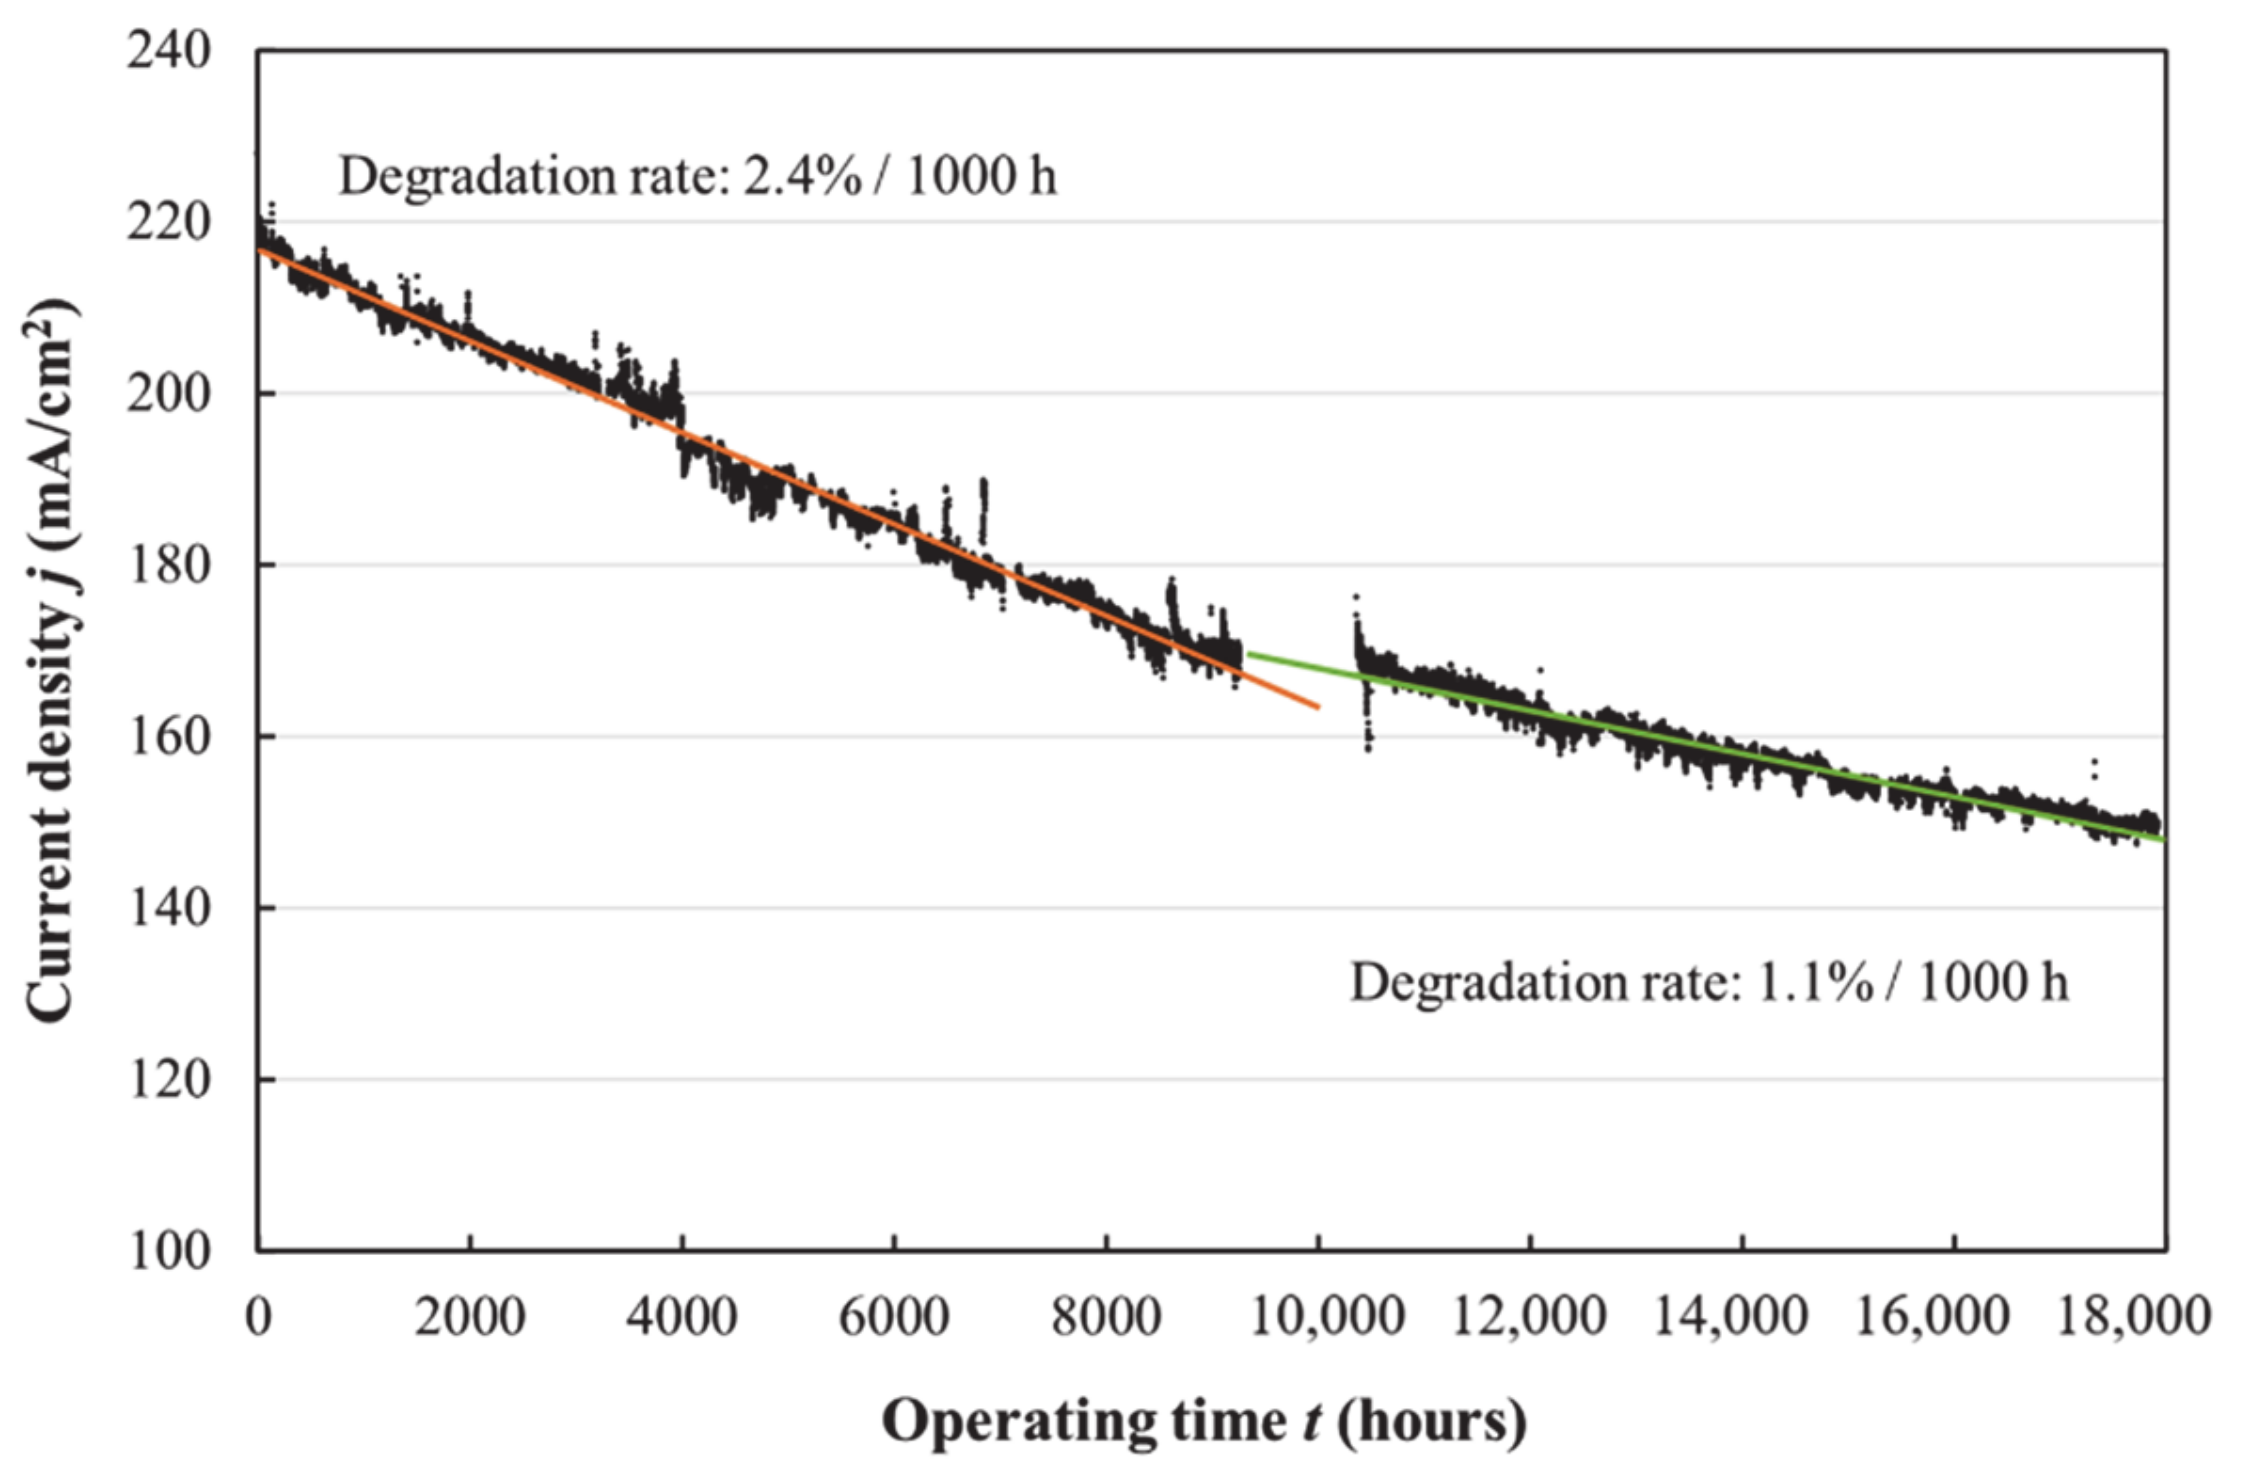
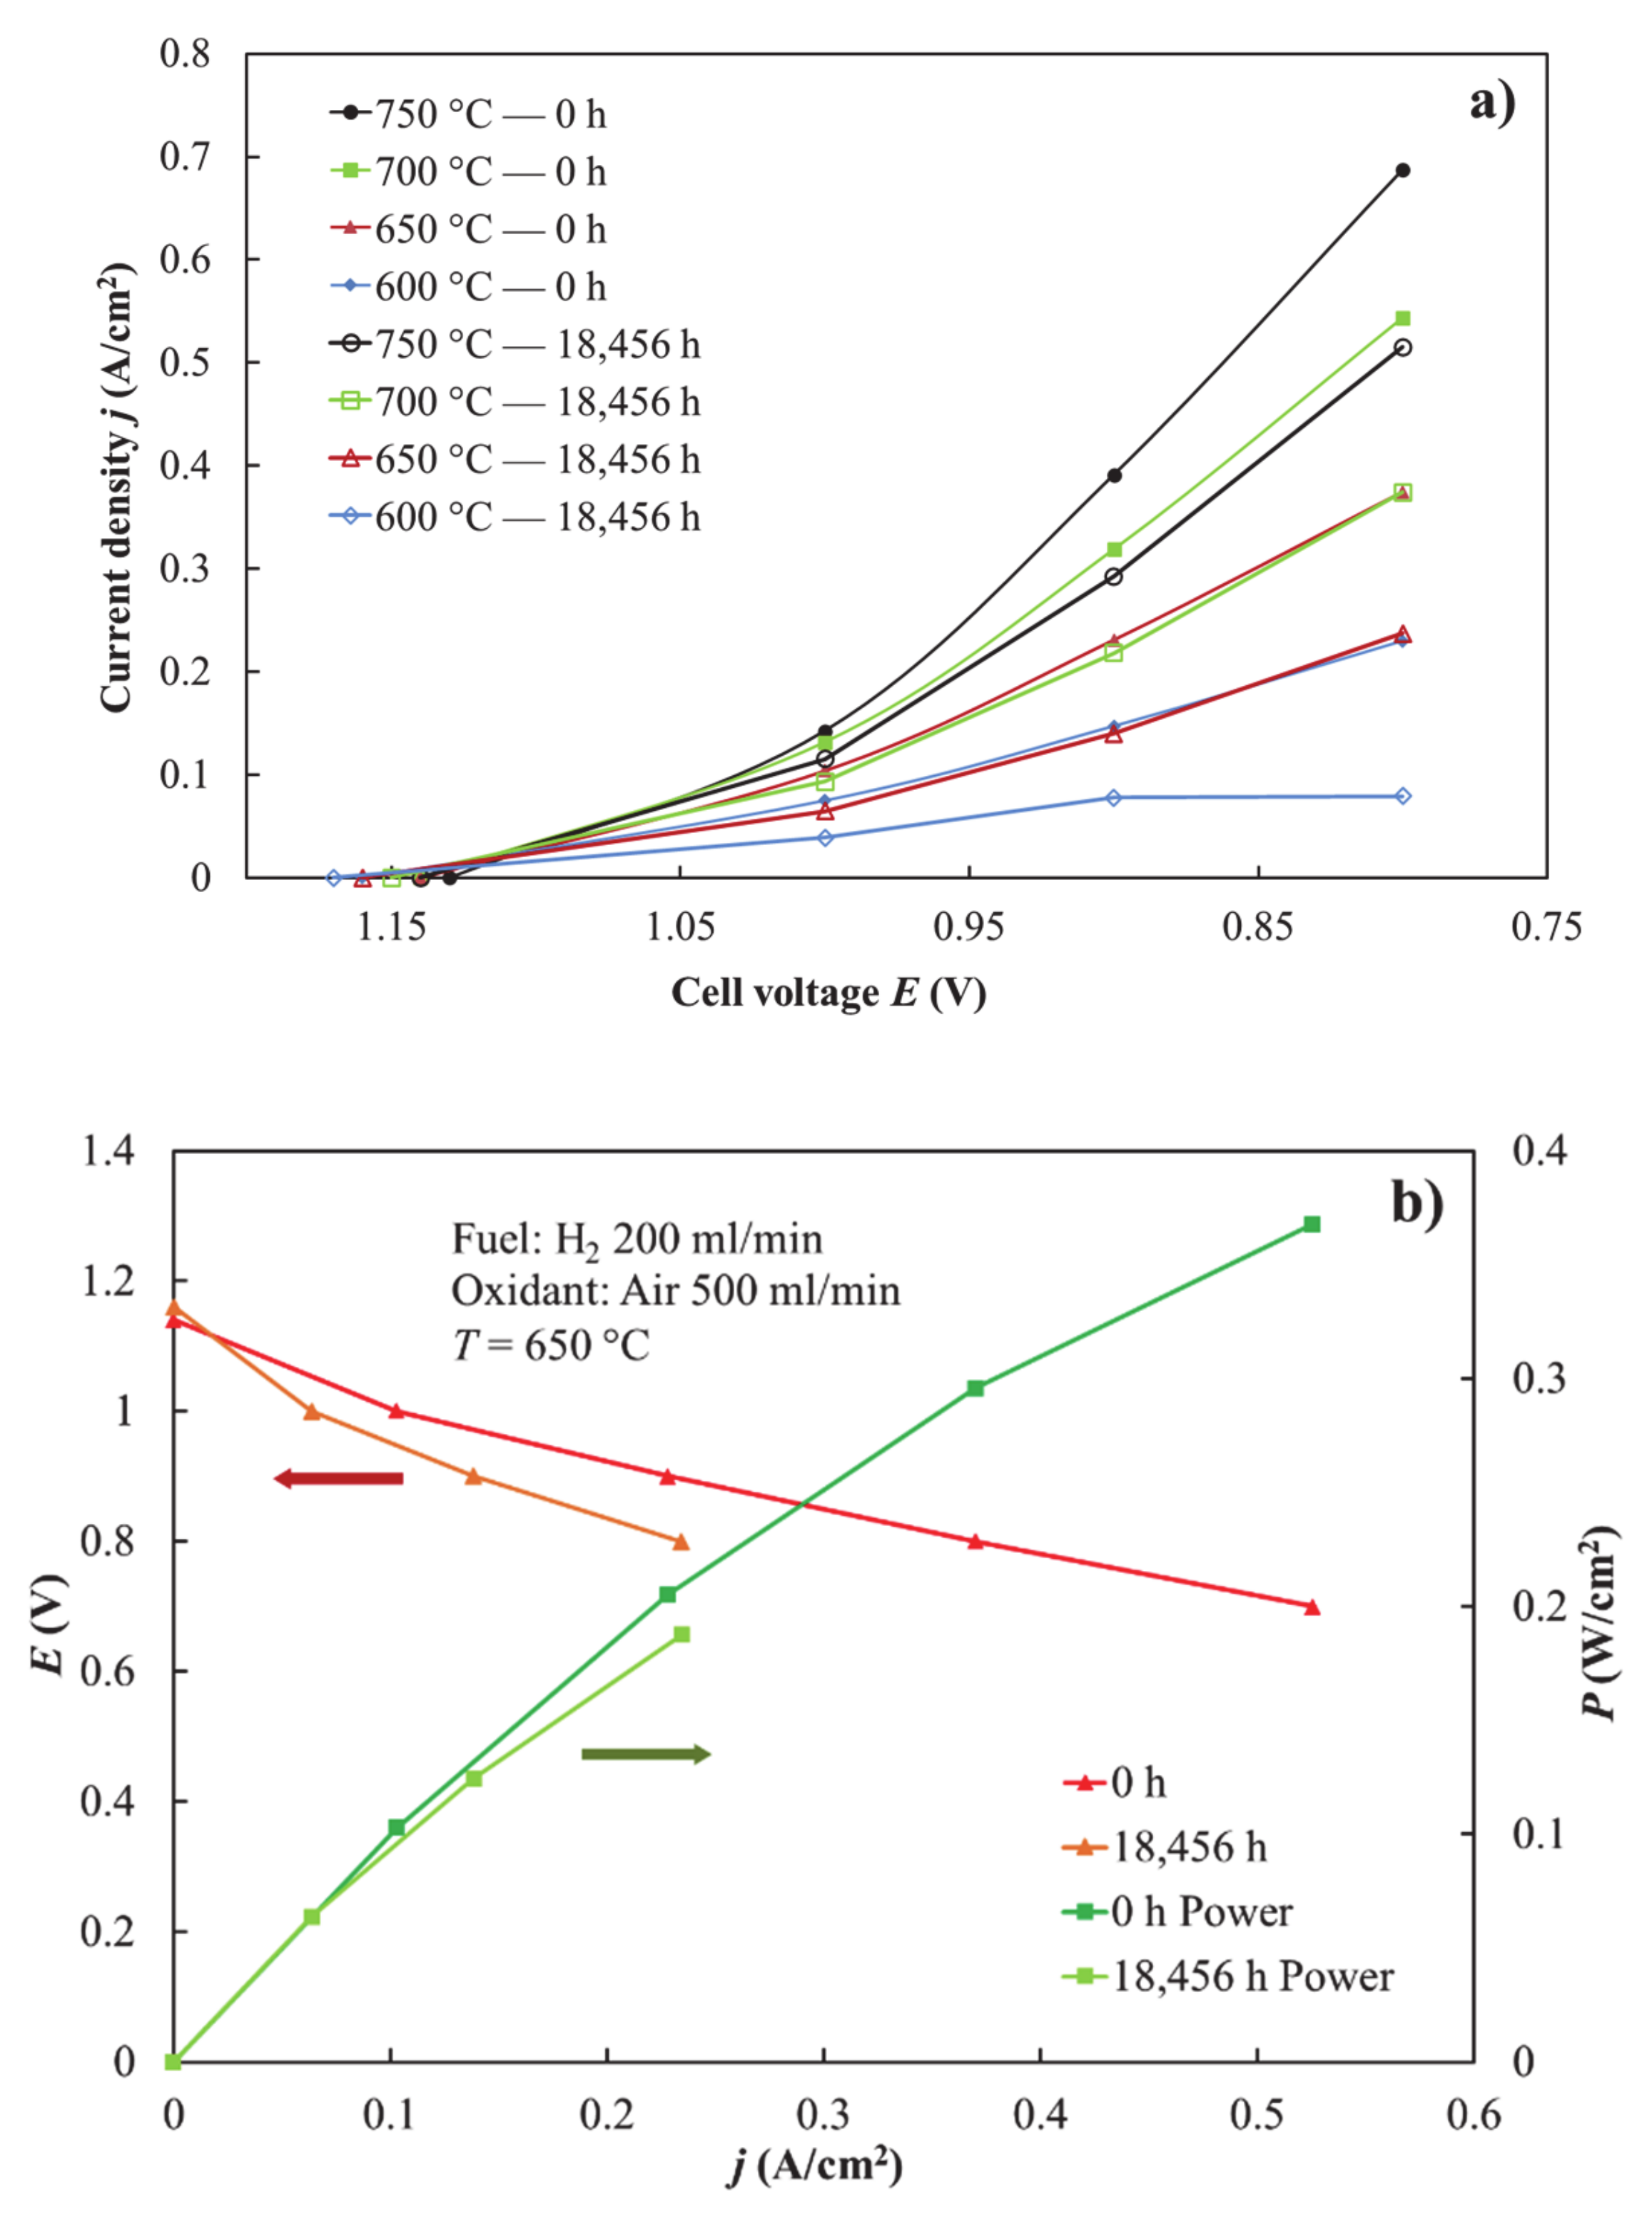
3.1. Electrochemical Long-Term Test in SOFC Mode

The electrochemical activity data collected during the 17,820 h long test are presented in Figure 3. The figure shows the current density of the cell, operated at 0.85 V, throughout the durability test. Degradation rate describes the decrease of current density during 1000 h and is given in percentages. Three different degradation stages could be distinguished. In the beginning of the experiment, a relatively quick stabilization stage appeared. During this few hundred-hour period, the degradation speed was approximately 20% per 1000 h. The degradation speed decreased to approximately 2.4% per 1000 h towards the middle of the experiment. During the second half of the experiment, the electrochemical performance stabilized and depicted 1.1% degradation per 1000 h. Lim et al. and Tao et al. reported similar performance change in their long-term test of Ni-YSZ|YSZ|GDC|LSCF but in shorter time frames [29,30].
The i-E curves and power density vs. current density curves in the beginning and in the end of experiment are demonstrated in Figure 4. The i-E curves in Figure 4a show a clear decline of current densities at different operating temperatures during the experiment. Figure 4b presents the decrease of current density and power density during the 18,456 h long experiment.
The total activation energy Ea tot calculated from temperature dependences of resistances obtained from the i-E curves is given in Table 1. The total activation energy, Ea tot, of the studied cell at 0.8 V was dependent on time and changed from 0.57 eV in the beginning to 0.95 eV in the end of experiment. Activation energies calculated at 1 V changed from 0.34 eV to 0.56 eV, which is 0.22 eV. Accurate explanation and interpretation of Ea tot changes of such very complex systems as a SOFC short stack is very complicated or even impossible without separate studies of system components; however, changes of this parameter might give some additional useful supporting information.
Dependence of activation energy change Ea tot on cell potential (current density) indicates that the limiting process is dependent on pO2, pH2O or pH2, i.e., it is most likely connected with properties of active centers in the cathode or anode or both electrodes. This line of reasoning leads to a conclusion that the main degradation processes in the studied SOFC short stack relate to changes in active centers of electrodes. This interpretation is also supported by the information from ToF-SIMS analysis—presence of Cr and Si particles on electrodes. The fact that the increase of total activation energy in time was bigger at higher current densities also supports the interpretation that the limiting process and degradational changes are connected to active centers of electrodes. The total degradation of the cell was comparable with similar experiments: i.e., single cell in contact with Crofer 22APU steel without special coating [7].

3.2. Electrochemical Long-Term Test at SOEC Mode

Figure 5 presents the dependence of current density on time measured at the Ni-YSZ|YSZ|GDC|PSC SOE cell measured at 800 °C cell temperature and at 1.5 V cell potential. The average degradation speed was 16% per 1000 h. As seen in Figure 5, partial recovery of the current density appears at certain operating times. These recovery steps correspond to the moments when the cell voltage was released to open circuit voltage (OCV) to carry out electrochemical impedance measurements. Short stay on OCV lead to 3–5% performance recovery. A similar phenomenon was observed by Hjalmarsson et al. during their long term electrolysis test and it has been ascribed to be due to the clearing of poisonous impurities such as silica from TPBs [31,32].
Figure 6 presents the i-E curves recorded at various operating temperatures starting from 650 °C to 850 °C and at different operating times. To characterize the sealing quality and precision of water concentration evaluation in the Perma Pure evaporator, it should be mentioned that experimental OCV values (OCV650 exp = 0.94 V; OCV750 exp = 0.90 V; OCV850 exp = 0.86 V) were in very good accordance with values calculated theoretically (OCV650 theor = 0.934 V; OCV750 theor = 0.896 V; OCV850 theor = 0.858 V) based on gas composition (pH2 = 0.108; pN2 = 0.432; pH2O = 0.46) and temperature.
The i-E curves confirm the same degradation phenomena that was seen in Figure 5. It is evident that solid oxide electrolysis cell performance degrades significantly with time.
It is worth mentioning here that the performance of the SOE cell improved slightly during the first 175 h. A similar phenomenon has been observed in other experiments. Zhang et al. also noted a similar effect in one of their 1000 h electrolysis tests and explained it through slow initial conditioning of the solid oxide cell [33]. The shape of the i-E curves at higher temperatures (750 °C to 850 °C) and operating voltages from 1.1 to 1.5 V indicate partially diffusion limited behavior. The linear shape of the i-E curves (Figure 6) at lower temperatures indicates high ohmic limitations of system components. At higher temperatures, the conductivities of system components and electrochemical reaction rates are high enough to cause a situation where diffusion of water in porous hydrogen electrode is limiting for total process speed.
The total activation energy values, shown in Table 2, were calculated similarly to the SOFC experiment to get information about changes in the limiting process. At higher cell voltages starting from 1.2 V up to 1.5 V, the activation energy values increase slightly throughout the operation time, but at lower operating voltages (1.1 and 1.0 V), Ea tot values decrease. For example, at a solid oxide cell voltage equal to 1 V, the activation energy starts from 0.56 eV and ends at 0.50 eV after 690 h, but at 1.5 V, the cell starts at 0.137 eV and ends at 0.181 eV.
These changes indicate clearly that the nature of the limiting processes is dependent on current density, i.e., on concentration of oxygen, hydrogen and water on electrodes as well as heat balance in the cell. Low Ea tot values at high voltages mainly characterize diffusional limitations. The increase of Ea tot from 0.14 to 0.18 eV is most likely connected with the shift of limiting the process from diffusional limitation to some other process because of electrode passivation or the increase of series resistance, as we see in the microstructural studies described below.
Change of the nature of limiting processes if electrode potential was increased from 1.1 V to 1.4 V is also very well illustrated by the change of characteristic shape of Nyquist plots in Figure 7. At high cell potentials (1.3 and 1.4 V), characteristic approximately 45-degree diffusion limitation plateaus appear at around the 1–10 Hz area, which also confirm the diffusional limitations at these conditions. At lower voltages, the limitations have a different nature. The semi-circle with 1.1 Hz maxima still appears, but the magnitude is much smaller.
The dependence of electrochemical polarization impedance on time is presented in Figure 8. The low frequency semicircles (with fmax at~1 Hz) are slightly noisy, but in comparison, these arcs measured at 24 h and 839 h are very similar. There are almost no changes, which is in good accordance with the fact that the main structure of the electrode (which defines diffusion speed in the electrode) is stable through the experiment. The main changes seen are in the mid frequency arc (with fmax~350 Hz). A systematic approximately 39% increase of this semicircle can be observed during the 815-h experiment. This frequency range is often associated with charge transfer processes, and because of that, it is possible that these changes are caused by the poisoning of electrodes with Cr or Si, or it might be connected to Ni coarsening in the SOEC cathode. Changes in charge distribution in MEA because of crack formation between the chemical barrier layer and electrolyte might also lead to impedance changes in this frequency region.

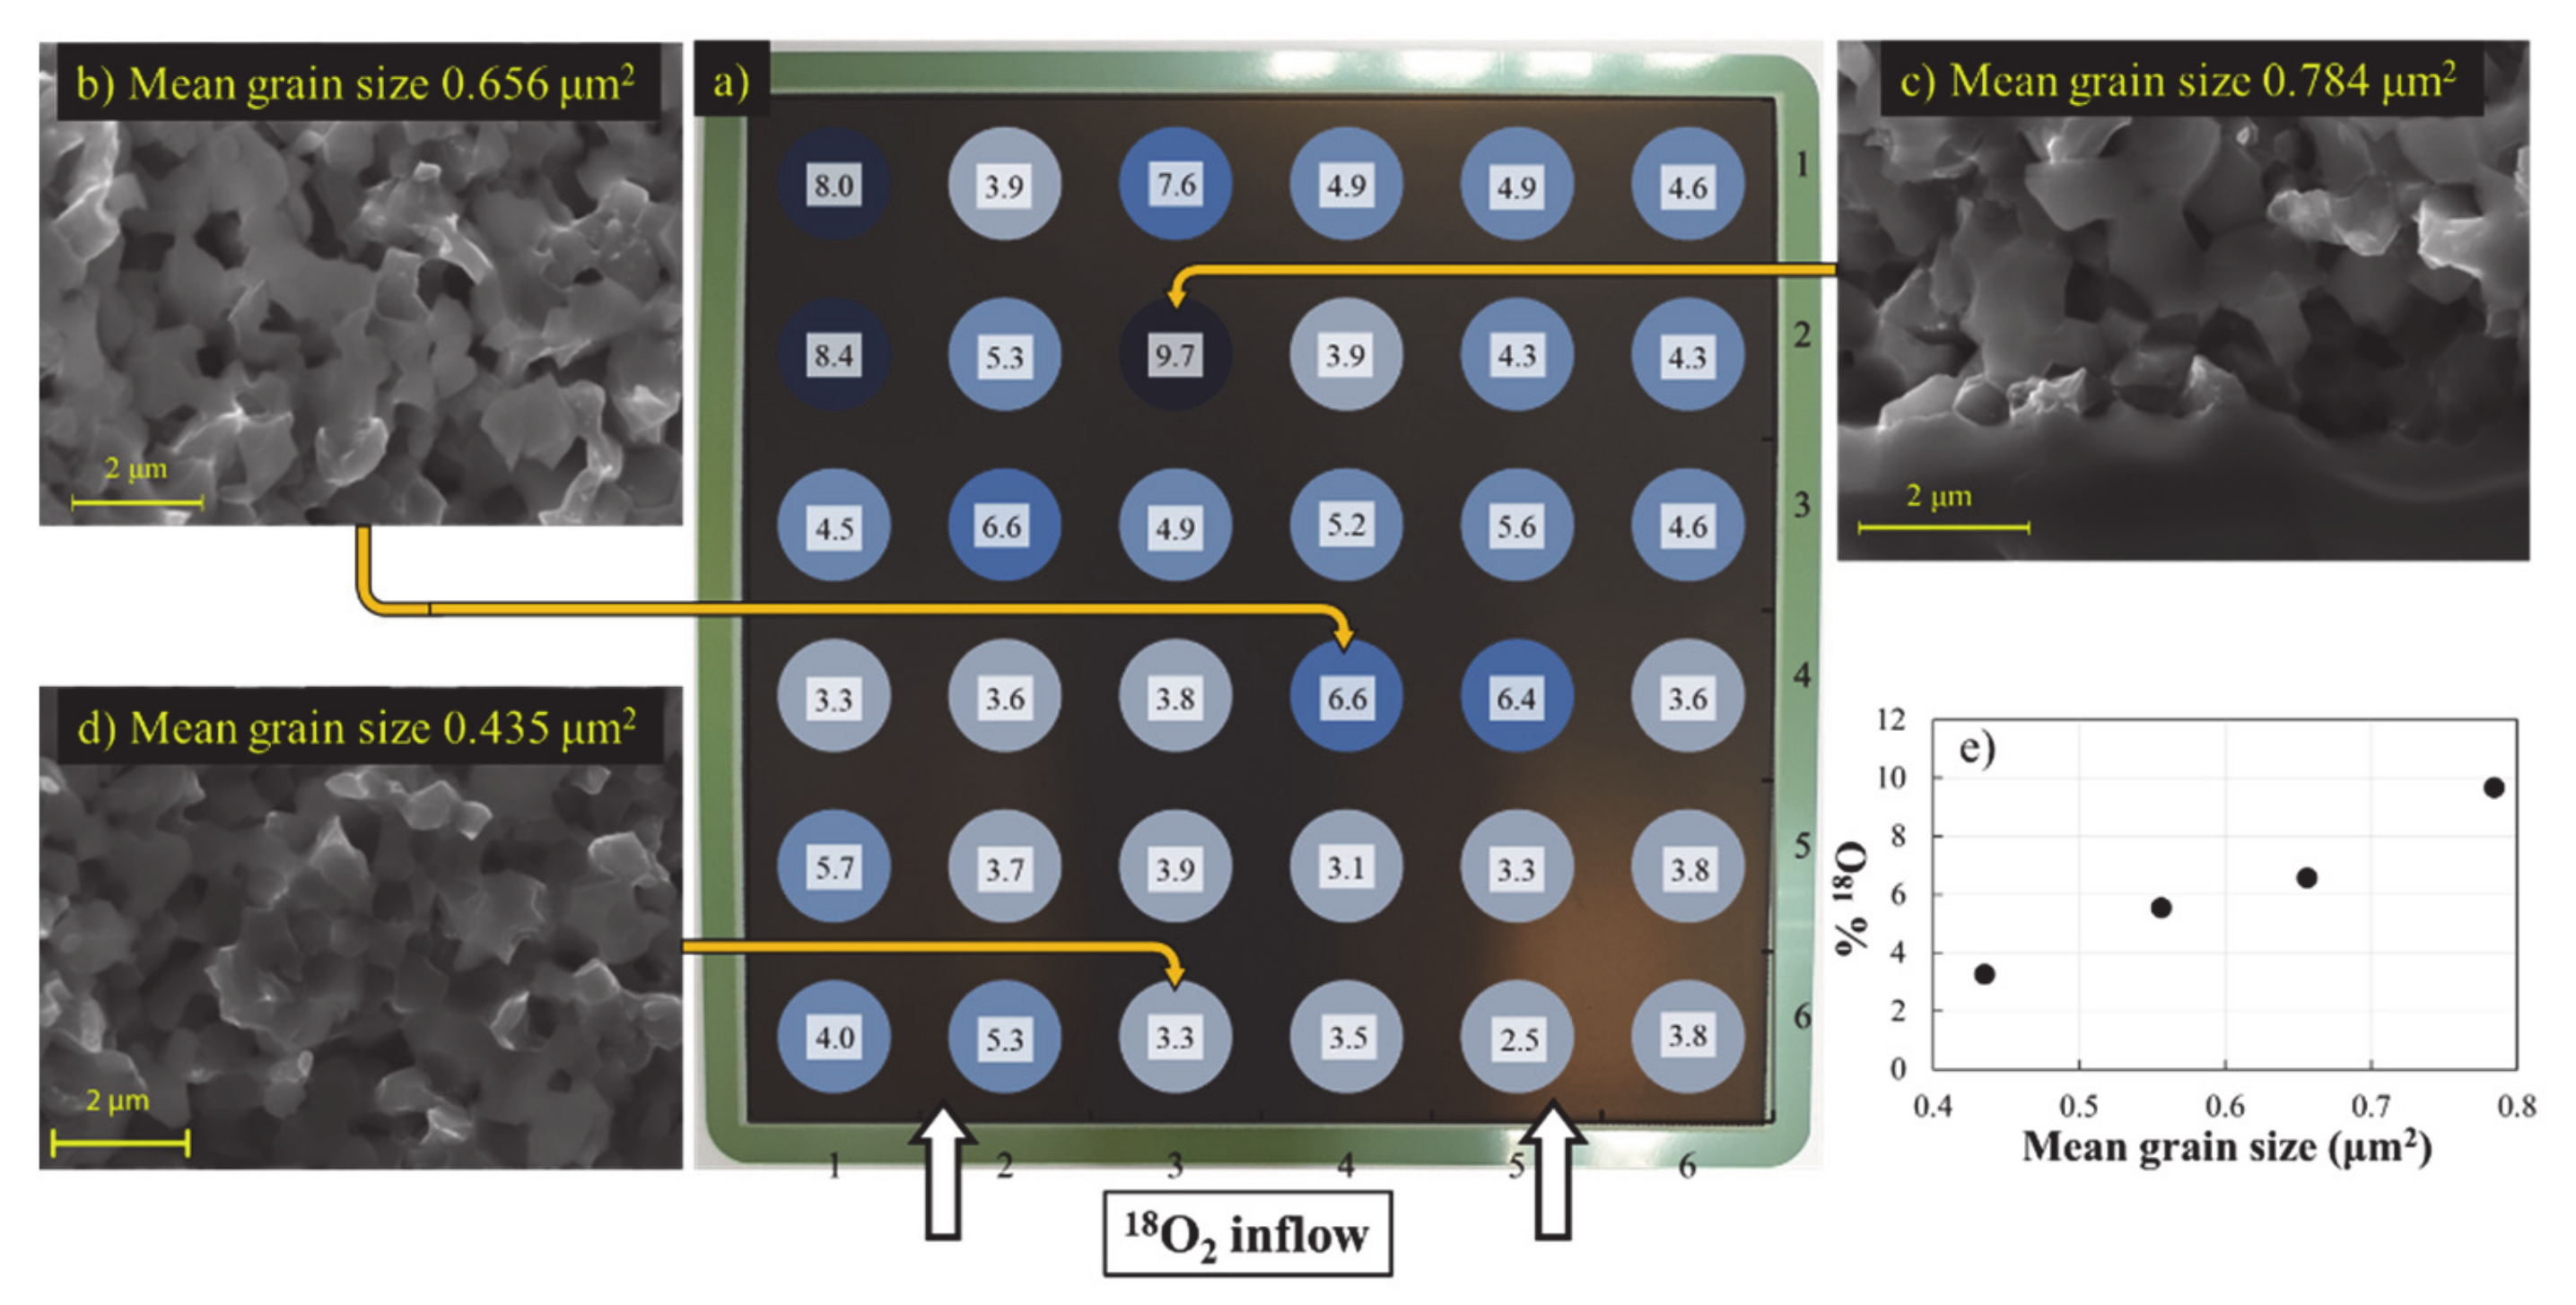
3.3. Electrode Activity Mapping Using 18O Tracing Method

To obtain information about electrode activity over its surface, an activity mapping method based on 18O tracing was carried out. For this purpose, 18O2 was introduced to the oxygen electrode gas compartment while an electric load was applied (at fuel cell mode) for a short specially optimized time (to avoid saturation of the electrode with 18O), as described in the experimental section. The cell was separated into pieces with similar sizes, and 18O content was analyzed. The ToF-SIMS spectra from each piece was analyzed for 18O and was shown as a ratio against the total oxygen found. The analysis results from each shard were set into a 6 × 6 grid according to the initial location of the shard. By color coding, an 18O content activity map was created. One such map made from the SOFC cell is presented in Figure 9a. The white arrows denote the direction of 18O2 flow in the cathode room. The hydrogen inflow in the anode room was from the opposite direction.
As it can be seen from the figure, the highest 18O concentrations were observed near the hydrogen inflow. Because these areas incorporated considerably more oxygen-18 ions, it is reasonable to assume that the current of oxide ions through the membrane during operation was also larger at these regions, i.e., the fuel cell activity was also higher at these areas. At areas with higher activity, there should be a higher temperature, more humidity and, because of that, a more active Ni coarsening process [4,30,34]. HR-SEM pictures were taken from pieces with different 18O activities, and microstructural parameters were correlated with the 18O content. The SEM micrographs suggest the presence of the nickel coarsening phenomenon. Using ImageJ, an image analysis tool, cross-sectional areas of Ni grains were measured, and the mean of these values was calculated (Figure 9b–d). Comparison of Ni grain size and 18O content at the same locations gives quite a nice correlation (with some deviating points). It can be clearly seen that coarser Ni particles are found in areas with higher 18O content. This correlation indicates that the Ni coarsening activity is affected by the activity of the fuel cell at certain locations—more active sites suffer a more intense coarsening process. Irregular distribution of intensity over the electrode is unlikely to be caused by inhomogeneities of MEA and most likely could be explained by the inhomogeneities of contact layers (in some areas, the gases have better access to electrode surface compared to other sites) and irregularities of electrical contact over the electrode surface, both caused by the stack assembly method.
A similar 18O based activity map was created from the SOEC test cell (Figure 10a). Regions with higher 18O content could be observed in Figure 10a. An important difference from the solid oxide fuel cell activity map is the overall relative content of 18O, which is significantly lower. Because the oxygen 18O isotope was introduced to the electrolysis cell at 800 °C, the cooling to room temperature took more time.
Because the activity of the solid oxide cell is dependent on temperature, the resulting higher activity enabled significant amounts of 18O to be exchanged back with 16O residues from the N2 used to flush over the electrode after stopping the 18O flow. This resulted in lower 18O content in the electrolysis cell compared to the fuel cell activity map. According to the 18O activity map, the most active areas in the Ni-YSZ electrode (Figure 10a) appear to be around the middle of the cell instead of the hydrogen inlet. Similar to the analysis of the SOFC electrode, certain areas were also characterized using HR-SEM and compared to each other. As seen in Figure 10e, with the increase of electrode activity, the Ni grain size also increases, similar to the fuel cell. In general, Ni grain size in the electrolysis cell seems to increase more than the Ni grain size in the fuel cell. This can be explained by the elevated operating temperature of the electrolysis cell, which strongly increases the rate of coarsening, or by the high water partial pressure known to promote the formation of Ni(OH)2, which can lead to Ni coarsening [34].

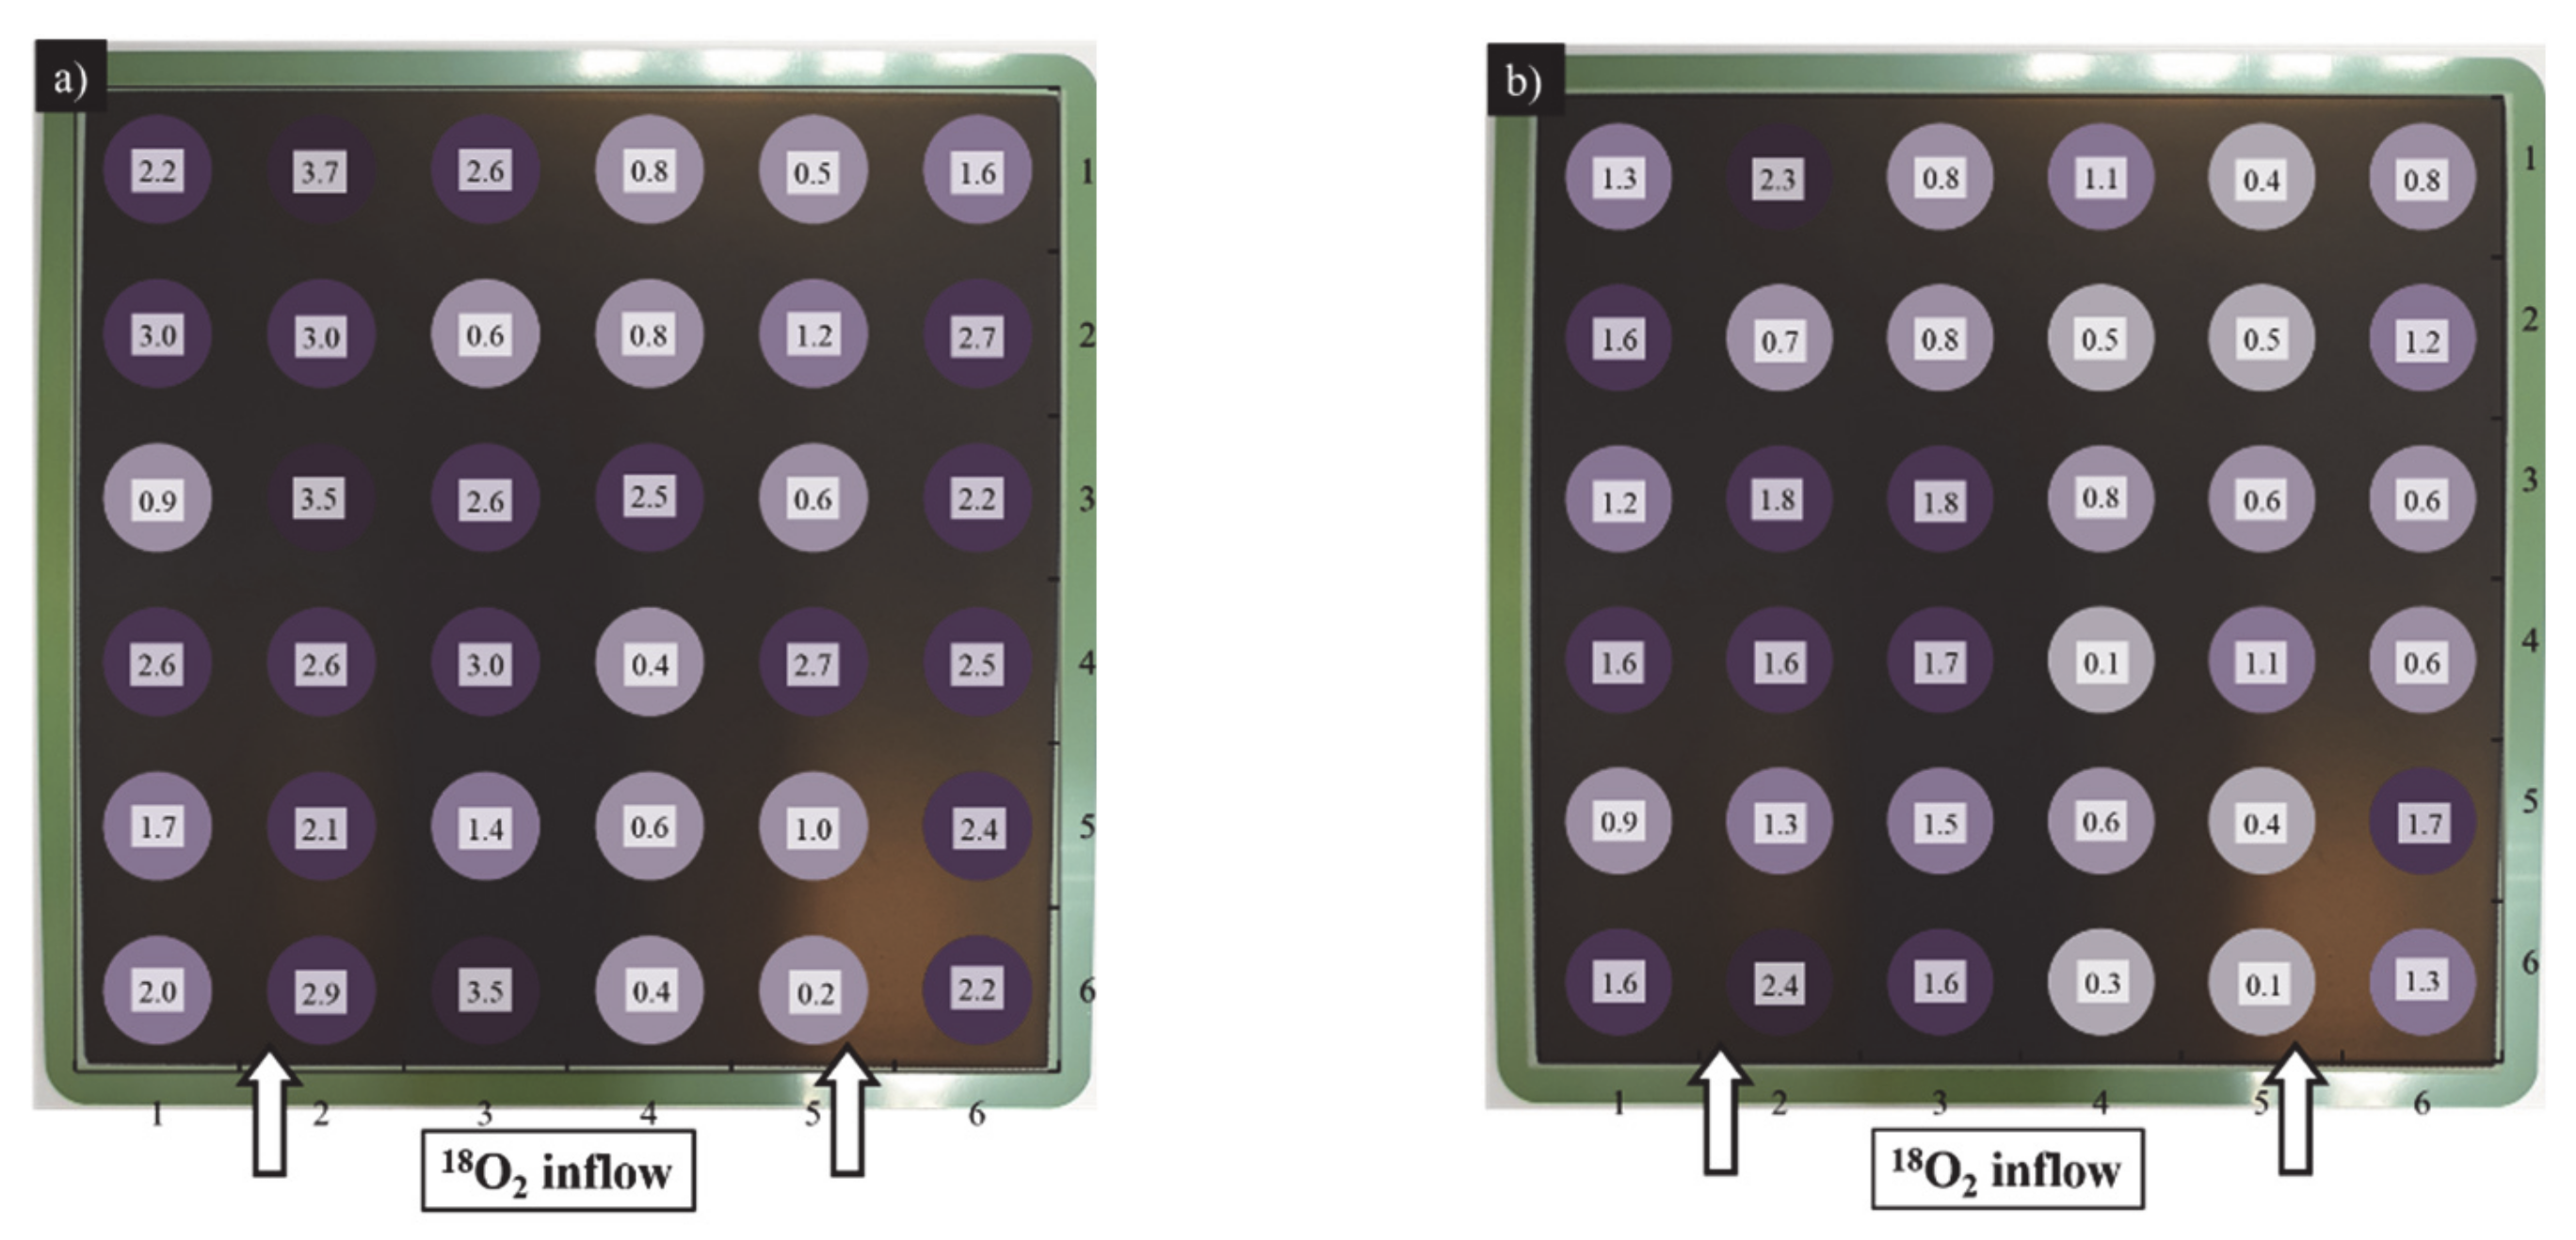
3.4. Chromium Poisoning

A significant amount of chromium was detected in the PSC layer and in the GDC interlayer of the SOFC cell during the ToF-SIMS analysis. The distribution of chromium species in the PSC and GDC layers of the fuel cell can be seen in Figure 11. Chromium poisoning is a well-known degradation mechanism, where Cr species can deposit onto reaction sites, blocking reactants and decreasing SOC performance [34,35,36,37]. Equation (1) was proposed by Miyoshi et al. for the mechanism of this chromium poisoning process [35].
2CrO2(OH)2(g) + 6e → Cr2O3 + 2H2O + 3O2−
They discovered that Cr preferably deposits near active sites of the oxygen electrode [35].
Based on information from literature and ToF-SIMS analysis, it can be concluded that one significant reason for degradation of electrochemical performance in long term SOFC experiments is chromium poisoning.
Some chromium can also be observed from the ToF-SIMS data of the electrolysis cell, as seen in Figure 12. As seen in the figure, chromium content was reliably detected at some regions, leaving most of the oxygen electrode with very low chromium content compared to the fuel cell cathode. One reason for this low Cr content could be different polarization of the electrodes, which may influence the processes. Another, more plausible reason, is the difference of operation time, which means that the electrolysis cell had less time to gather chromium oxide.
In the hydrogen electrode of SOFC, the Cr concentration was in the range from 0.6% to 0.8% without locations of high concentration. In the SOEC hydrogen electrode, which was used as a cathode, similar very low (0.6% range) Cr concentrations were observed with slightly higher, approximately 2%, content close to outflow.

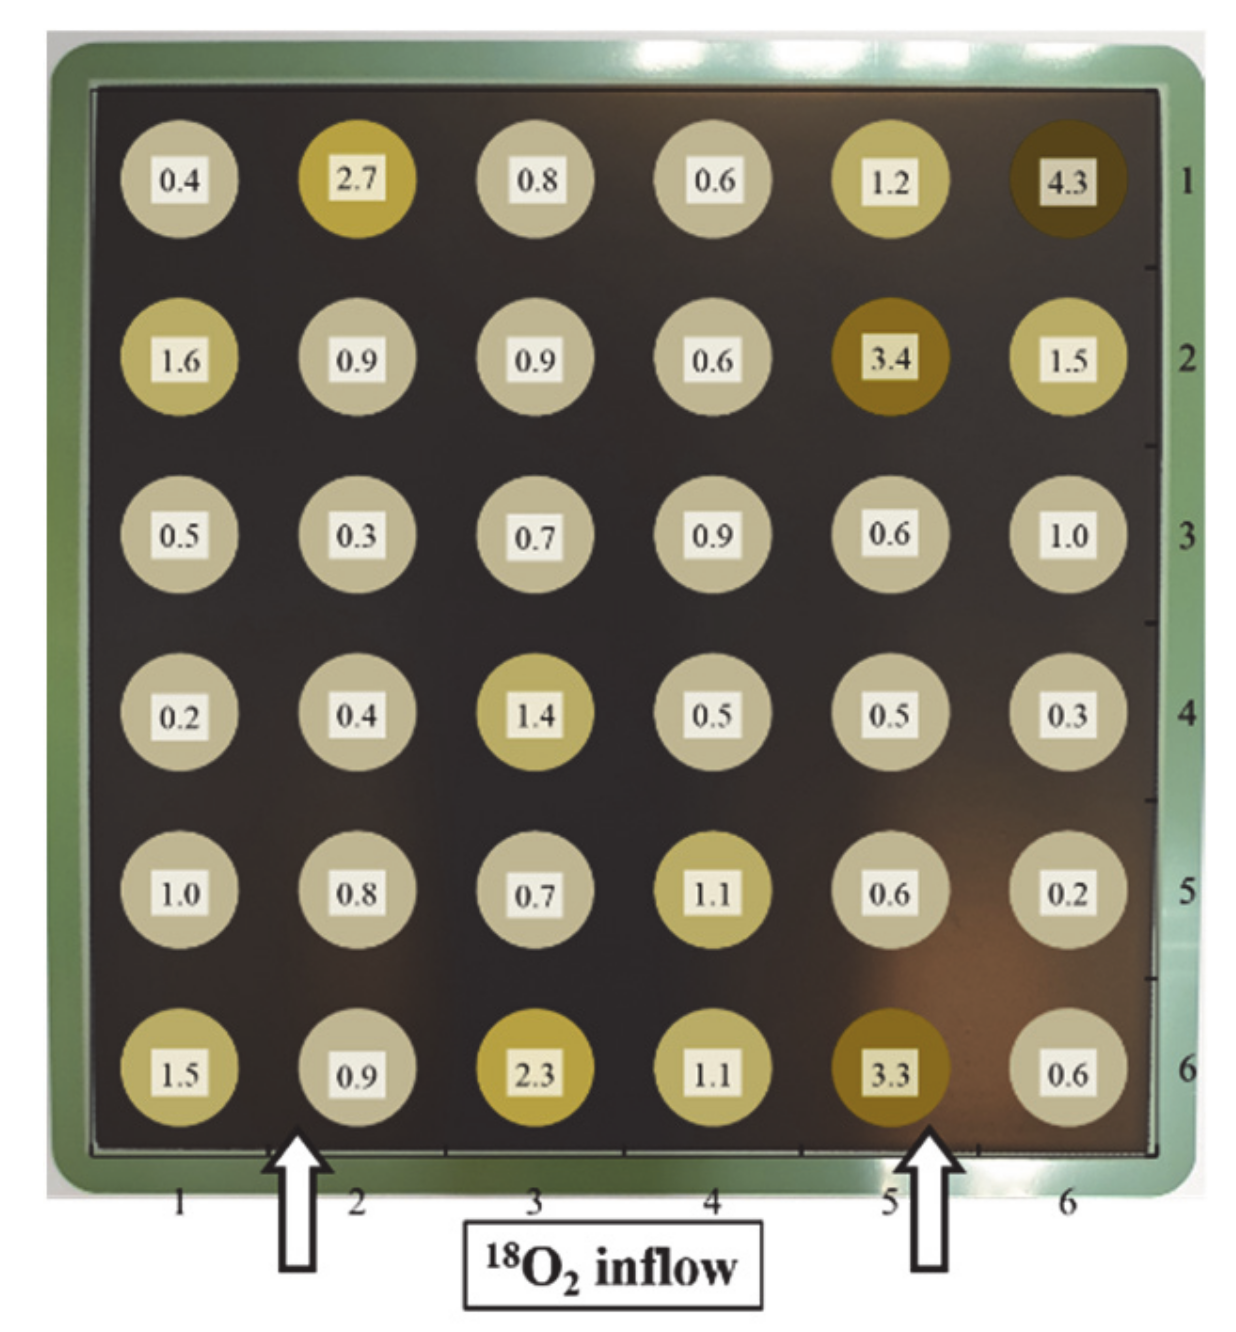
3.5. Silicon Poisoning.

The use of glass sealant at the fuel chamber posed a risk of introducing another degradation mechanism to the Ni-YSZ electrode. During the SIMS analysis, traces of Si were found in the Ni-YSZ material. A map was created from the data, which is seen in Figure 13. The distribution of Si mainly to the sides of the map suggests that the source of Si is the glass sealant. Even if the concentration of Si in the middle of electrode is relatively low, it is very likely that Si still contributes to the activation polarization of the solid oxide cell by blocking the reaction sites.
A similar Si distribution map was constructed for the electrode tested in electrolysis mode, presented in Figure 13b. In this map, the Si is also distributed more along the edges, but the concentration is higher than the amount of Si observed in the fuel electrode tested in fuel cell mode. This phenomenon could be explained by the high water content in the fuel chamber, which leads to Si vaporization in the form of Si(OH)4. The deposition would then follow Equation (2).
Si(OH)4(g) ↔ SiO2(s) + 2H2O(g)
A second condition that can activate Si mobility in the electrolysis cell was the higher temperature compared to the SOFC test. A few mechanisms have been proposed by Andersen et al. for silicon deposition in the fuel cell mode [36].
H2(g) + SiO2(s) ↔ SiO(g) + H2O(g)
SiO2(s) ↔ SiO(g) + 1/2O2(g)
The two plausible mechanisms include the reduction of SiO2 to volatile SiO by hydrogen, seen in Equation (3), and the decomposition of solid SiO2 into gaseous SiO and O2, seen in Equation (4). Both mechanisms with different proportions could be presented in the SOFC and SOEC mode.

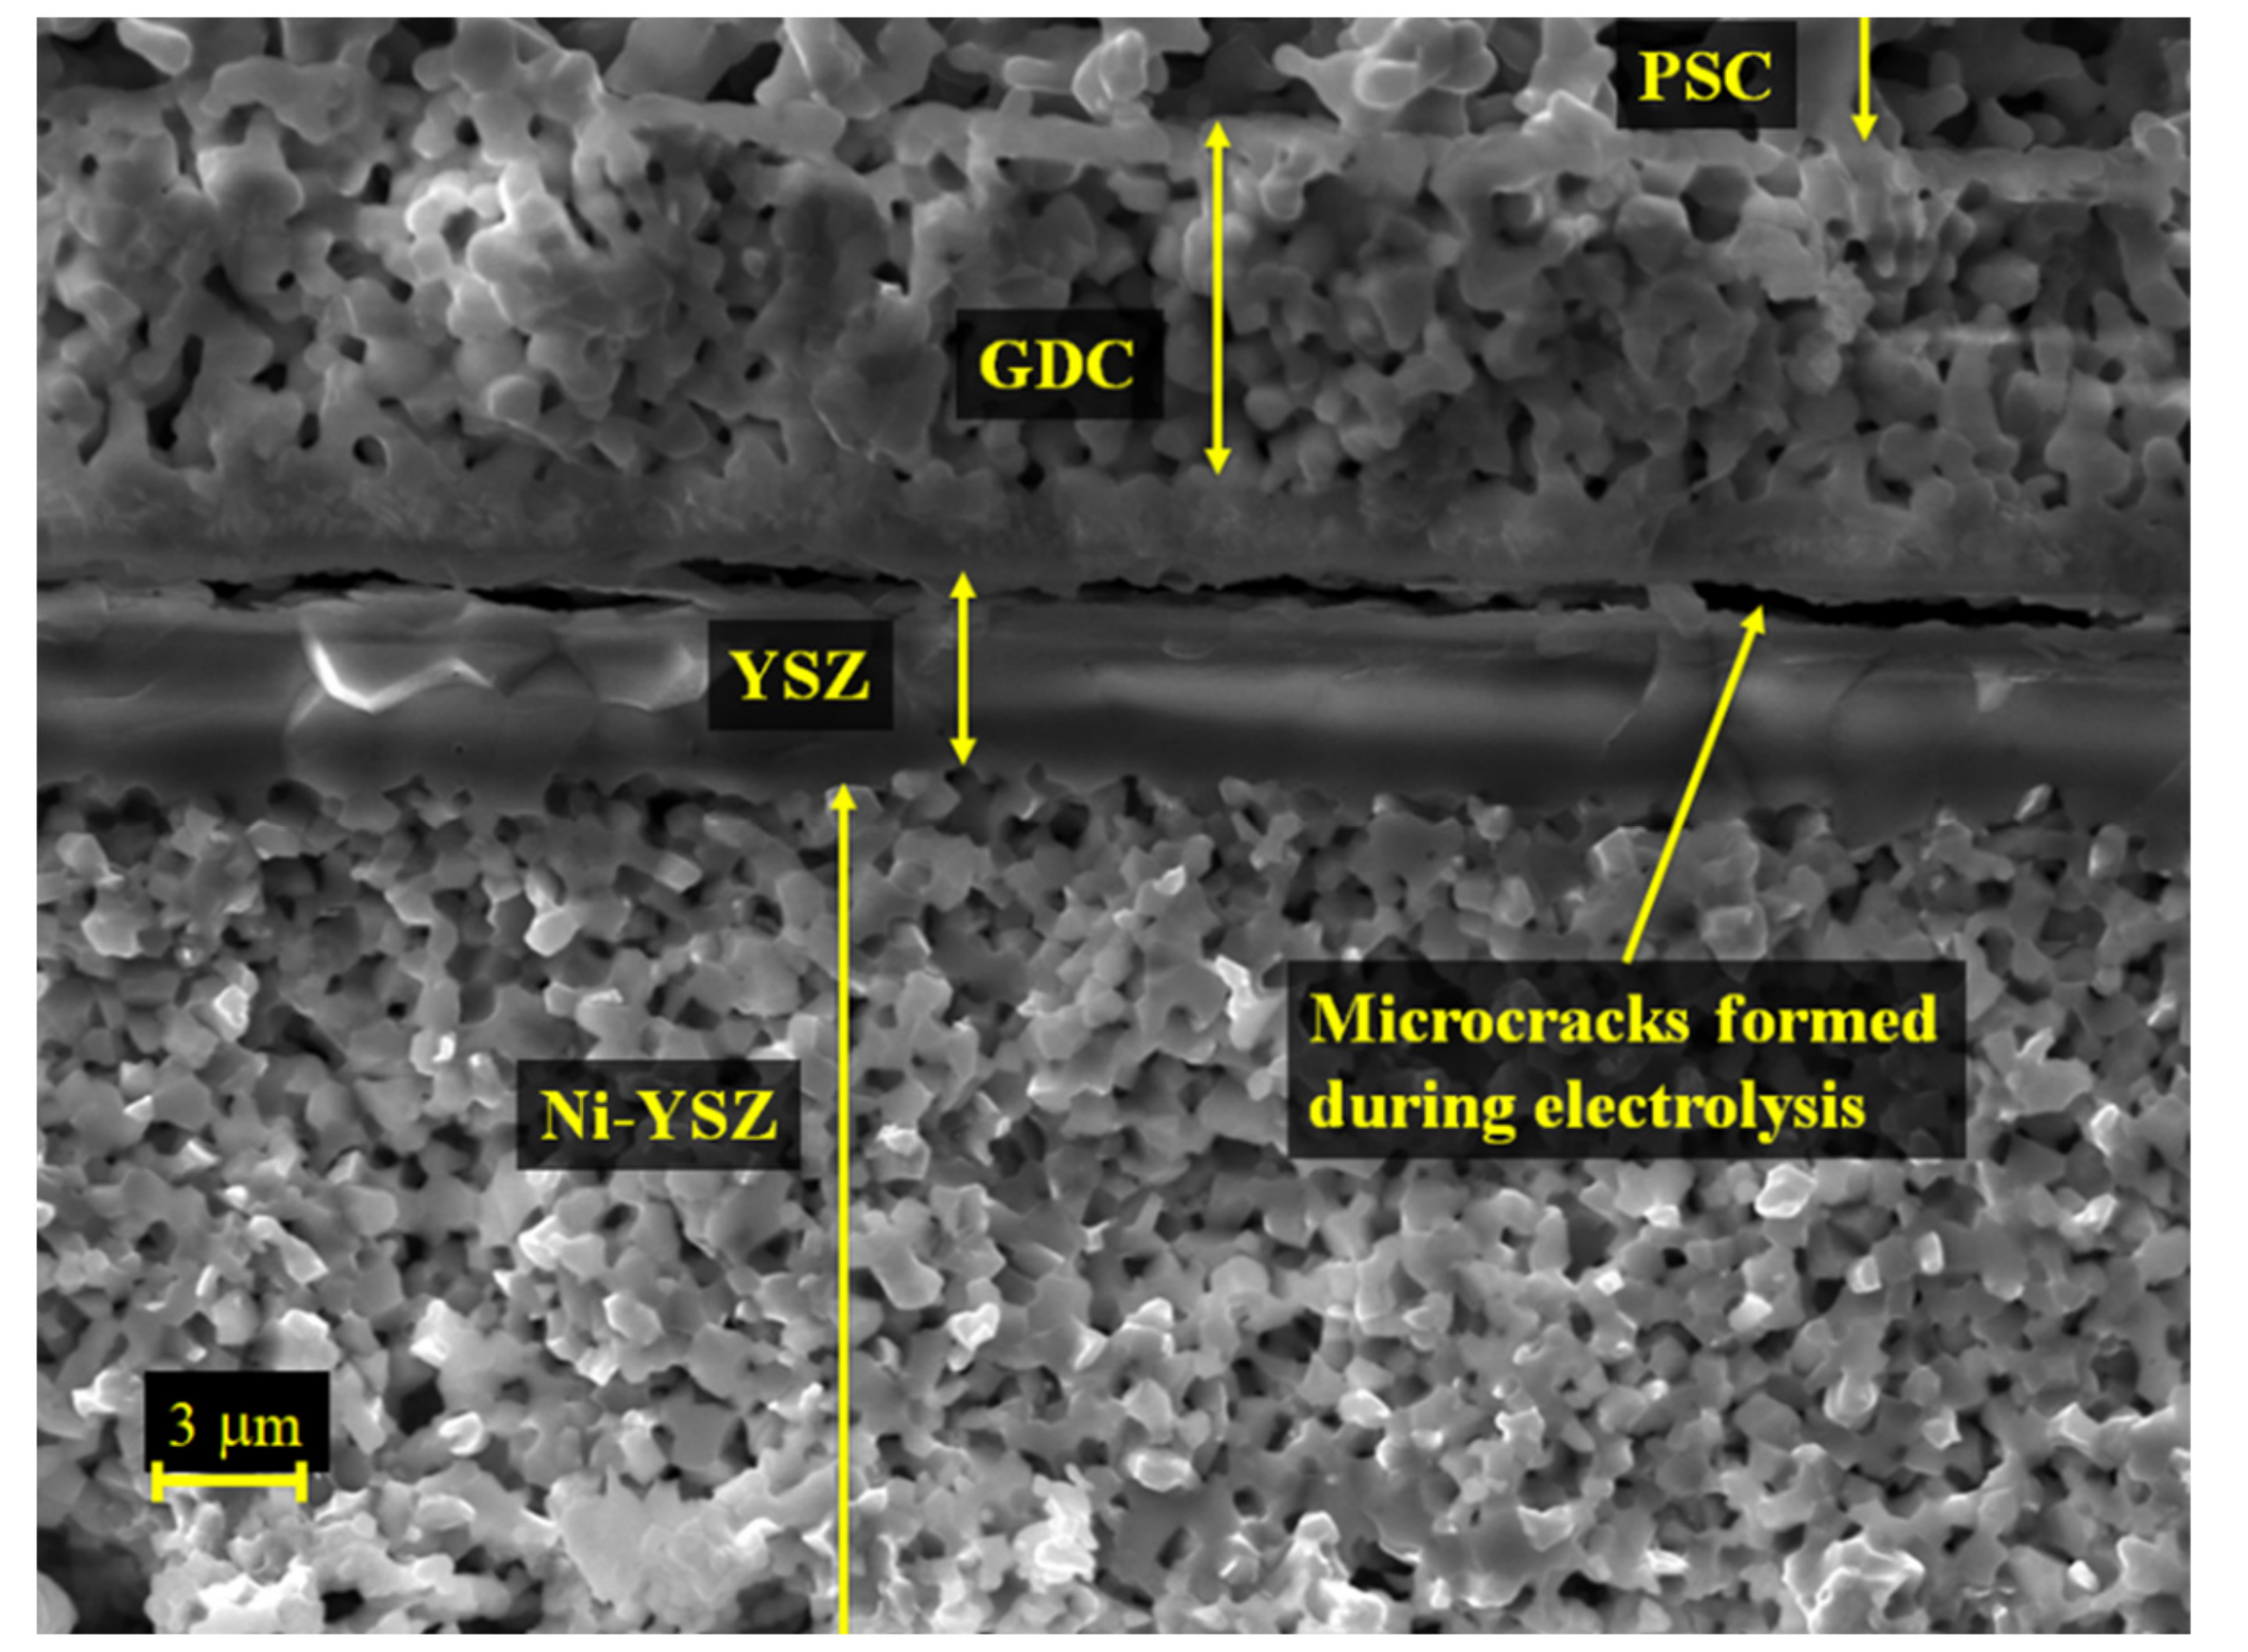
3.6. Crack Formation in the Electrolysis Cell

During microstructural analysis of the electrolysis cell with HR-SEM, the formation of micro-cracks were found in the interlayer between the YSZ electrolyte and GDC chemical barrier layer. Moçoteguy et al. suggest that under high current electrolysis operation, oxygen build-up might happen within the grain boundaries of the YSZ electrolyte [37]. The accumulating gas can create voids and create tension in the region, which can lead to cracks between layers. Mass transport of species with different mobilities in different phases is known to create voids within the YSZ grains close to GDC, known as “Kirkendall voids.” These voids can lead to cracks in the YSZ electrolyte, delamination or even to the total mechanical failure of the solid oxide cell. While examining the electrolysis cell with a scanning electron microscope, an extensive horizontal crack was found in many of its samples. An example of this crack can be seen in Figure 14. As it is shown, the crack does not exactly run at the YSZ border, but~1 μm below the GDC-YSZ border.
These cracks indicate the presence of mechanical stresses inside the YSZ electrolyte. These stresses could have been created by oxygen pressure build-up at the YSZ-GDC border, as suggested by Moçoteguy et al. [37], by change in lattice parameters as a result of SrO migration and reaction with ZrO2 or as a co-effect of these two.

4. Conclusions

Ni-Y0.08Zr0.92O2-δ|Y0.08Zr0.92O2-δ|Ce0.9Gd0.1O2-δ|Pr0.6Sr0.4CoO3-δ solid oxide cell based short stacks were tested in fuel cell mode at 650 °C for 17,820 h and in electrolysis mode at 800 °C for 860 h.
Degradation rates in the experiment performed in fuel cell mode were higher in the beginning of experiment, 2.4% per 1000 h for the first 9000 h, and lower in the second half of experiment, i.e., 1.1% per 1000 h. Degradation during electrolysis test was 16.3% per 1000 h.
Mapping of 18O traces over the surface area of studied electrodes was performed and electrode activity maps were made. From the same locations of the electrode, HR-SEM analysis was performed, and mean grain size of Ni was evaluated. From correlation of the activity of the electrode with Ni grain size at these locations, it appears that Ni coarsening activity is dependent on solid oxide cell activity in SOFC as well as in the SOEC mode.
Based on ToF-SIMS analysis results, chromium and silicon maps were constructed. It appears that there is no correlation between electrode activity and chromium concentration on the surface. Chromium concentrations in the hydrogen electrode were lower compared to the oxygen electrode. Significant concentrations of silicon were observed in the hydrogen electrode, located mainly at the sides of the electrode close to the gas sealing made from special glass. Both impurities cause changes in or close to the active centers in the triple phase boundary and influence the electrochemical performance in a bad way. The analysis of the changes in electrochemical performance supports the theory that the main reason of degradation in the SOFC mode is caused by impurities, but in the SOEC mode, the appearance of cracks in the electrolyte also plays an important role. Reasons for crack formation are a non-optimal interface between YSZ and GDC and also, most likely, the partial formation of SrZrO3 during preparation of the oxygen electrode.
It could be concluded that the Pr0.6Sr0.4CoO3-δ oxygen electrode shows good stability in the SOFC regime where the main cause of performance loss was impurities like chromium and silicon. In the electrolysis regime, in addition to impurities, the formation of cracks also causes performance loss. The preparation method should be optimized in order to achieve a stable MEA for electrolysis.

Author Contributions

Conceptualization: G.N., F.K., P.M.; methodology: F.K., P.M., R.K. and G.N.; software: R.K., P.M. and F.K.; validation: G.N., F.K. and P.M.; formal analysis: F.K.; investigation: F.K., G.N.; resources: G.N.; data curation: F.K.; writing—original draft preparation: F.K.; writing—review and editing: G.N., F.K. and P.M.; visualization: F.K.; supervision: G.N. and P.M.; project administration: G.N.; funding acquisition: G.N. All authors have read and agreed to the published version of the manuscript.

Funding

This research was funded by the EU through the European Regional Development Fund Project TK141 “Advanced materials and high-technology devices for energy recuperation systems”, by the Estonian Research Council institutional research grant IUT20-13, and personal research funding projects PUT1581 and PRG551.

Conflicts of Interest

The authors declare no conflict of interest.

References

  1. Küngas, R. Review—Electrochemical CO2 Reduction for CO Production: Comparison of Low-and High-Temperature Electrolysis Technologies. J. Electrochem. Soc. 2020, 167, 044508. [Google Scholar] [CrossRef]
  2. Lillmaa, K.; Maide, M.; Kanarbik, R.; Nurk, G.; Lust, E. Electrochemical Characteristics and Gas Composition Generated by La0.8Sr0.2Cr0.5Mn0.5O3–δCathode at Electrolysis and Co-Electrolysis Modes. J. Electrochem. Soc. 2016, 163, F3190–F3196. [Google Scholar] [CrossRef]
  3. Hauch, A.; Küngas, R.; Blennow, P.; Hansen, A.B.; Hansen, J.B.; Mathiesen, B.V.; Mogensen, M.B. Recent advances in solid oxide cell technology for electrolysis. Science 2020, 370, eaba6118. [Google Scholar] [CrossRef] [PubMed]
  4. Khan, M.S.; Wahyudi, W.; Lee, S.B.; Song, R.H.; Lee, J.W.; Lim, T.H.; Park, S.J. Effect of various sintering inhibitors on the long term performance of Ni-YSZ anodes used for SOFCs. Int. J. Hydrogen Energy 2015, 40, 11968–11975. [Google Scholar] [CrossRef]
  5. Jensen, S.H.; Larsen, P.H.; Mogensen, M. Hydrogen and synthetic fuel production from renewable energy sources. Int. J. Hydrogen Energy 2007, 32, 3253–3257. [Google Scholar] [CrossRef]
  6. Fu, Q.X.; Mabilat, C.; Zahid, M.; Brisse, A.; Gautier, L. Syngas production via high-temperature steam/CO2 co-electrolysis: An economic assessment. Energy Environ. Sci. 2010, 3, 1382–1397. [Google Scholar] [CrossRef]
  7. Blum, L.; Packbier, U.; Vinke, I.C.; de Haart, L.G.J. Long-Term Testing of SOFC Stacks at Forschungszentrum Julich. Fuel Cells 2013, 13, 646–653. [Google Scholar] [CrossRef]
  8. Chen, M.; Liu, Y.L.; Bentzen, J.J.; Zhang, W.; Sun, X.F.; Hauch, A.; Tao, Y.K.; Bowen, J.R.; Hendriksen, P.V. Microstructural Degradation of Ni/YSZ Electrodes in Solid Oxide Electrolysis Cells under High Current. J. Electrochem. Soc. 2013, 160, F883–F891. [Google Scholar] [CrossRef]
  9. Mogensen, M.B.; Hauch, A.; Sun, X.; Chen, M.; Tao, Y.; Ebbesen, S.D.; Hansen, K.V.; Hendriksen, P.V. Relation Between Ni Particle Shape Change and Ni Migration in Ni-YSZ Electrodes—A Hypothesis. Fuel Cells 2017, 17, 434–441. [Google Scholar] [CrossRef]
  10. Sun, X.; Hendriksen, P.V.; Mogensen, M.B.; Chen, M. Degradation in Solid Oxide Electrolysis Cells During Long Term Testing. Fuel Cells 2019, 19, 740–747. [Google Scholar] [CrossRef]
  11. Ebbesen, S.D.; Mogensen, M. Kinetics of Oxidation of H2 and Reduction of H2O in Ni-YSZ based Solid Oxide Cells. ECS Trans. 2013, 50, 167–182. [Google Scholar] [CrossRef]
  12. Njodzefon, J.C.; Klotz, D.; Kromp, A.; Weber, A.; Ivers-Tiffee, E. Electrochemical Modeling of the Current-Voltage Characteristics of an SOFC in Fuel Cell and Electrolyzer Operation Modes. J. Electrochem. Soc. 2013, 160, F313–F323. [Google Scholar] [CrossRef]
  13. Laguna-Bercero, M.A. Recent advances in high temperature electrolysis using solid oxide fuel cells: A review. J. Power Sources 2012, 203, 4–16. [Google Scholar] [CrossRef] [Green Version]
  14. Adler, S.B.; Lane, J.A.; Steele, B.C.H. Electrode kinetics of porous mixed-conducting oxygen electrodes. J. Electrochem. Soc. 1996, 143, 3554–3564. [Google Scholar] [CrossRef]
  15. Moller, P.; Kanarbik, R.; Kivi, I.; Nurk, G.; Lust, E. Influence of Microstructure on the Electrochemical Behavior of LSC Cathodes for Intermediate Temperature SOFC. J. Electrochem. Soc. 2013, 160, F1245–F1253. [Google Scholar] [CrossRef]
  16. Kivi, I.; Anderson, E.; Möller, P.; Nurk, G.; Lust, E. Influence of Microstructural Parameters of LSC Cathodes on the Oxygen Reduction Reaction Parameters. J. Electrochem. Soc. 2012, 159, F743. [Google Scholar] [CrossRef]
  17. Lust, E.; Küngas, R.; Kivi, I.; Kurig, H.; Möller, P.; Anderson, E.; Lust, K.; Tamm, K.; Samussenko, A.; Nurk, G. Electrochemical and gas phase parameters of cathodes for intermediate temperature solid oxide fuel cells. Electrochim. Acta 2010, 55, 7669–7678. [Google Scholar] [CrossRef]
  18. Lust, E.; Möller, P.; Kivi, I.; Nurk, G.; Kallip, S.; Nigu, P.; Lust, K. Optimization of the cathode composition for the intermediate-temperature SOFC. J. Electrochem. Soc. 2005, 152, A2306. [Google Scholar] [CrossRef]
  19. Kim, J.H.; Baek, S.-W.; Lee, C.; Park, K.; Bae, J. Performance analysis of cobalt-based cathode materials for solid oxide fuel cell. Solid State Ion. 2008, 179, 1490–1496. [Google Scholar] [CrossRef]
  20. Lee, S.; Miller, N.; Staruch, M.; Gerdes, K.; Jain, M.; Manivannan, A. Pr 0.6Sr 0.4CoO 3−δ electrocatalyst for solid oxide fuel cell cathode introduced via infiltration. Electrochim. Acta 2011, 56, 9904–9909. [Google Scholar] [CrossRef]
  21. Lust, E.; Möller, P.; Kivi, I.; Nurk, G.; Kallip, S. Electrochemical characteristics of La0.6Sr0.4CoO3-δ, Pr0.6Sr0.4CoO3-δ and Gd0.6Sr0.4CoO3-δ on Ce0.85Sm0.15O1.925 electrolyte. J. State Electrochem. 2005, 9, 882–889. [Google Scholar] [CrossRef]
  22. Nurk, G.; Vestli, M.; Moller, P.; Jaaniso, R.; Kodu, M.; Mandar, H.; Romann, T.; Kanarbik, R.; Lust, E. Mobility of Sr in Gadolinia Doped Ceria Barrier Layers Prepared Using Spray Pyrolysis, Pulsed Laser Deposition and Magnetron Sputtering Methods. J. Electrochem. Soc. 2016, 163, F88. [Google Scholar] [CrossRef]
  23. Tamm, K.; Möller, P.; Nurk, G.; Lust, E. Investigation of Time Stability of Sr-Doped Lanthanum Vanadium Oxide Anode and Sr-Doped Lanthanum Cobalt Oxide Cathode Based on Samaria Doped Ceria Electrolyte Using Electrochemical and TOF-SIMS Methods. J. Electrochem. Soc. 2016, 163, F586. [Google Scholar] [CrossRef]
  24. Budiman, R.A.; Bagarinao, K.D.; Liu, S.S.; Cho, D.H.; Ishiyama, T.; Kishimoto, H.; Yamaji, K.; Horita, T.; Yokokawa, H. Time-Dependence of Surface Composition, Transport Properties Degradation, and Thermodynamic Consideration of La0.6Sr0.4Co0.2Fe0.8O3-delta under Chromium Poisoning. J. Electrochem. Soc. 2018, 165, F1206. [Google Scholar] [CrossRef]
  25. Rohnke, M.; Schaepe, K.; Bachmann, A.K.; Laenger, M.; Janek, J. In situ ToF-SIMS monitoring of SOFC cathodes—A case study of La0.74Sr0.17Mn1.01O2.9 model electrodes. Appl. Surf. Sci. 2017, 422, 817–827. [Google Scholar] [CrossRef]
  26. Maide, M.; Lillmaa, K.; Salvan, L.K.; Möller, P.; Uibu, M.; Lust, E.; Nurk, G. Influence of Electrolyte Scaffold Microstructure and Loading of MIEC Material on the Electrochemical Performance of RSOC Fuel Electrode. Fuel Cells 2018, 18, 789–799. [Google Scholar] [CrossRef]
  27. Kivi, I.; Aruväli, J.; Kirsimäe, K.; Heinsaar, A.; Nurk, G.; Lust, E. Kinetic Response of La0.6Sr0.4CoO3-δLattice Parameters to Electric Potential Change in Porous Cathode at In Situ Solid Oxide Fuel Cell Conditions. J. Electrochem. Soc. 2015, 162, F354–F358. [Google Scholar] [CrossRef]
  28. Küngas, R.; Kivi, I.; Lust, K.; Nurk, G.; Lust, E. Statistical method to optimize the medium temperature solid oxide fuel cell electrode materials. J. Electroanal. Chem. 2009, 629, 94–101. [Google Scholar] [CrossRef]
  29. Lim, H.T.; Hwang, S.C.; Park, Y.M.; Lee, I.S. Performance and long term stability of large area anode supported solid oxide fuel cells (SOFCs). Solid State Ion. 2012, 225, 124–130. [Google Scholar] [CrossRef]
  30. Tao, Y.K.; Ebbesen, S.D.; Mogensen, M.B. Degradation of solid oxide cells during co-electrolysis of steam and carbon dioxide at high current densities. J. Power Sources 2016, 328, 452–462. [Google Scholar] [CrossRef]
  31. Hjalmarsson, P.; Sun, X.F.; Liu, Y.L.; Chen, M. Durability of high performance Ni-yttria stabilized zirconia supported solid oxide electrolysis cells at high current density. J. Power Sources 2014, 262, 316–322. [Google Scholar] [CrossRef]
  32. Hjalmarsson, P.; Sun, X.; Liu, Y.-L.; Chen, M. Influence of the oxygen electrode and inter-diffusion barrier on the degradation of solid oxide electrolysis cells. J. Power Sources 2013, 223, 349–357. [Google Scholar] [CrossRef]
  33. Zhang, X.Y.; O’Brien, J.E.; O’Brien, R.C.; Hartvigsen, J.J.; Tao, G.; Housley, G.K. Improved durability of SOEC stacks for high temperature electrolysis. Int. J. Hydrogen Energy 2013, 38, 20–28. [Google Scholar] [CrossRef]
  34. Khan, M.S.; Lee, S.B.; Song, R.H.; Lee, J.W.; Lim, T.H.; Park, S.J. Fundamental mechanisms involved in the degradation of nickel yttria stabilized zirconia (Ni-YSZ) anode during solid oxide fuel cells operation: A review. Ceram. Int. 2016, 42, 35–48. [Google Scholar] [CrossRef]
  35. Miyoshi, K.; Iwai, H.; Kishimoto, M.; Saito, M.; Yoshida, H. Chromium poisoning in (La,Sr)MnO3 cathode: Three-dimensional simulation of a solid oxide fuel cell. J. Power Sources 2016, 326, 331–340. [Google Scholar] [CrossRef] [Green Version]
  36. Andersen, T.; Hansen, K.V.; Mogensen, M.; Chorkendorff, I. Electrochemical removal of segregated silicon dioxide impurities from yttria stabilized zirconia surfaces at elevated temperatures. Solid State Ion. 2011, 190, 60–66. [Google Scholar] [CrossRef]
  37. Mocoteguy, P.; Brisse, A. A review and comprehensive analysis of degradation mechanisms of solid oxide electrolysis cells. Int. J. Hydrogen Energy 2013, 38, 15887–15902. [Google Scholar] [CrossRef]
Figure 1. SEM image of a cross section of the SOFC after the experiment. The cell is supported by a 470 μm thick Ni-YSZ electrode with a 17 μm thick active fuel electrode layer. The YSZ electrolyte is 4 μm, the GDC barrier is 9 μm and the PSCO oxygen electrode is about 34 μm thick.
Energies 14 00824 g001
Figure 2. Schematic drawing of the membrane electrode assembly for electrochemical measurements.
Energies 14 00824 g002
Figure 3. Dependence of current density on time of the SOFC durability test measured at T = 650 °C and at E = 0.85 V. A slow change of degradation rate can be observed starting from around the 9000 h mark.
Energies 14 00824 g003
Figure 4. i-E curves of the SOFC durability test measured at the beginning and end of the experiment. Figure (a) shows the curves at different temperatures. Figure (b) presents the i-E curves measured at 650 ℃ and power density curves at the same conditions.
Energies 14 00824 g004
Figure 5. Dependence of current density on operating time of the Ni-YSZ|YSZ|GDC|PSC SOEC short stack measured at T = 800 °C and at E = 1.5 V. A regeneration phenomenon can be seen after electrochemical impedance spectroscopy measurements.
Energies 14 00824 g005
Figure 6. Current density vs. cell potential curves of the Ni-YSZ|YSZ|GDC|PSC short stack in the electrolysis regime at different operation times and temperatures noted in the figure.
Energies 14 00824 g006
Figure 7. Effect of voltage (noted in figure) on impedance of the electrolysis cell. Nyquist plots was measured 174 h from the start of electrolysis test. T = 800 °C.
Energies 14 00824 g007
Figure 8. Dependence of polarization impedance of Ni-YSZ|YSZ|GDC|PSC short stack on time measured in electrolysis mode. T = 800 °C, E = 1.2 V. Measured at 4 different operation times, which are noted in the figure.
Energies 14 00824 g008
Figure 9. Composite figure of data gathered from long term SOFC test containing (a) the 18O ratio map created from ToF-SIMS data from the active Ni-YSZ fuel electrode, (bd) High resolution scanning electron microscopy pictures from near some more interesting sites with calculated mean Ni-YSZ grain sizes and (e) correlation between measured mean grain sizes and 18O ratios at certain sites.
Energies 14 00824 g009
Figure 10. Composite figure of data gathered from the 860-h long SOEC test containing (a) the 18O ratio map created from ToF-SIMS data from the active Ni-YSZ fuel electrode, (bd) HR-SEM pictures from near some more interesting sites with calculated mean Ni-YSZ grain sizes and (e) correlation between measured mean grain sizes and 18O ratios at certain sites.
Energies 14 00824 g010
Figure 11. Chromium distribution in the PSC electrode (a) and in the GDC (b) chemical barrier layer of the Ni-YSZ|YSZ|GDC|PSC SOFC short stack. The values represent the ratio of Cr counts to the total positive ion counts. The white arrows denote the direction of air flow at the oxygen electrode side.
Energies 14 00824 g011
Figure 12. Chromium distribution in the PSC oxygen electrode of Ni-YSZ|YSZ|GDC|PSC SOEC short stack. The values represent the ratio of Cr counts to the total positive ion counts. The white arrows denote the direction of air flow at the PSC oxygen electrode side.
Energies 14 00824 g012
Figure 13. Si distribution and content in the Ni-YSZ layer of the SOFC (a) and of the SOEC (b). Numbers indicate Si+ counts from total secondary positive ions detected at the fuel electrode.
Energies 14 00824 g013
Figure 14. SEM picture of a cross section of the electrolysis cell depicting a delaminating oxygen electrode.
Energies 14 00824 g014
Table 1. Total activation energies, Ea tot, of the Ni-YSZ|YSZ|GDC|PSC fuel cell at different voltages and measurement times.
Operation TimeEa tot at 0.8 VEa tot at 0.9 VEa tot at 1 V
0 h−0.57 eV−0.50 eV −0.34 eV
3240 h−0.65 eV−0.61 eV−0.45 eV
10,370 h−0.69 eV−0.65 eV−0.51 eV
17,820 h−0.95 eV−0.68 eV−0.56 eV
Table 2. Activation energies of the electrolysis cell at different voltages and time.
Operation TimeEa tot at
1 V
Ea tot at
1.1 V
Ea tot at
1.2 V
Ea tot at
1.3 V
Ea tot at
1.4 V
Ea tot at
1.5 V
0 h0.56 eV0.42 eV0.31 eV0.22 eV0.17 eV0.14 eV
357 h0.52 eV0.41 eV0.34 eV0.27 eV0.22 eV0.17 eV
690 h0.50 eV0.40 eV0.34 eV0.28 eV0.23 eV0.18 eV
Publisher’s Note: MDPI stays neutral with regard to jurisdictional claims in published maps and institutional affiliations.

