1. Introduction
The biocapacity of earth in biomass resources amounts to 172 billion t of dry matter that contains ten times more energy than the energy consumed worldwide [
1] (Eurotex, 2020). This huge energy potential remains largely unexploited, as only 1/7 of the world’s energy consumption is covered by biomass, mainly for traditional uses (combustion). However, 1 t of biomass is equivalent to about 0.4 t of fuel oil, only 3% of global energy needs are met by using available biomass [
2].
Residues and waste from agricultural and industrial processes in Mediterranean countries, such as olive kernels or rice husks from agro-industrial plants, wine from wineries or fruit stones from fruit processing industries, are insufficiently used, resulting in a significant amount of waste left in the fields. Taking Greece as a Mediterranean case, although its total available biomass reaches approximately 7,500,000 t of crop residues (cereals, maize, cotton, tobacco, sunflower, twigs, vines), and 2,700,000 t of forest residues (branches, bark), in addition to significant amounts of residual biomass from energy crops, the largest percentage of this biomass remains unused, often causing many hazards (fires, spreading diseases) [
2].
The European Union (EU) aims to increase biomass uses towards helping to achieve goals of renewable energy and greenhouse gas (GHG) emissions reduction. Facilities that use locally renewable energy sources, designed to supply local energy communities through micro- and small-scale units, are at the forefront of the EU energy strategy, while combined heat and power (CHP) production from agricultural waste and residue could be a viable way for the development of renewable, reliable, and affordable electricity, while improving waste management, contributing to sustainable agriculture, and implementing circular economy innovations [
3].
The end-users of bioenergy can vary in scale, from households, school, public buildings and tourist complexes to district heating, and heat and steam production in agro-industrial facilities. Thus far, CHP biomass systems have been proven to be viable only at large scales that are supported by tariffs or green certificates. However, it is important to mention that large scale bioenergy demand for the scale-up of biomass availability may have some consequences on the environmental impacts that the bioenergy sector can create, due to the direct relationship between the biomass demand scale and the GHG profile of its production.
Sustainable small-scale biomass plants, which produce CHP, appear to be among the most promising techniques for decentralized energy production if they can operate sustainably. The small-scale units benefit from a flexible integrated technology system, with the possibility of the successful penetration into the electricity market, in the market, and the promotion of regional development and the strengthening of the agricultural sector. However, investments or long repayment times create obstacles to their implementation [
3].
Gasification is the thermochemical conversion of biomass into gas-fuel through heat with a gasifier agent such as air, oxygen, or steam. Air is the most used gasification agent because it is cheap and readily available [
4]. The syngas produced can be stabilized in quality, so it is easier to be used and has multiple uses compared to the original biomass from which it derives, in gas engines and gas turbines, or even as a power supplier for liquid fuel production [
5]. Installed gasification units operating in different parts of the world are differentiated by the type of gasifier. Gasifiers fueled with organic materials and residual biomass may need to be specially designed for higher efficiencies, better economies, and a safe environment [
5]. Although the smallest size of biomass particles is favorable, it is essential to consider that energy consumption to reduce particle size should reduce overall energy efficiency, therefore different types of gasifiers should be designed to handle different sizes of biomass particles [
4].
Scope and Objectives of the Study
This study aimed to present a customized circular waste-based bioeconomy solution for a rice processing industrial sector, which is of great technological and commercial interest in many countries, and to support the use of simulation tools for the planning phase of bioenergy solutions within a circular bioeconomy. These tools are the Aspen PLUS V9 and Aspen Process Economic Analyzer for process simulation and economic assessment, respectively, which were used in this study for the air gasification-based CHP system fueled by rice residue.
The scientific objectives were: (1) the simulation of an atmospheric fluidized bed gasification (FBG) system fueled with rice husk (RH) for CHP generation with an Aspen Plus V9 simulation modeling (SM) tool; (2) the simulation of steam and (steam + oxygen) FBG scenarios to compare with the air FBG main scenario by using suitable indicators; and (3) the feasibility study of an air gasification-based unit with a capacity of 25,000 t/y RH using the Aspen Process Economic Analyzer.
This study does not intend to bring technical innovation beyond the state of the art on gasification and CHP technology. It is based on the SMARt-CHP innovative technology, a prototype of an FBG-based system designed and developed at Aristotle University, Greece, and funded by a European Commission LIFE+ project some years ago. The experimental proof of concept of RH gasification results are published elsewhere [
6]. After collecting the experimental results and designing an FBG system, it was considered a useful move for the bioenergy sector to introduce simulation modeling (SM) to allow developers and users to examine the system operation, using different possible scenarios and conditions, and using less time-consuming tools for planning at higher technological readiness levels (TRLs).
2. Methodology
The simulation study was based on experimental data obtained at our laboratory by previous researchers [
6]. The technology used was the SMARt CHP technology developed by our team and described in a previously published work [
7].
The modeled flow diagram of the bioenergy system was developed by using the Aspen Plus software, which proposes appropriate devices for the process simulation at the proposed operating conditions.
A sensitivity analysis was performed to explore the relation of syngas product using indicators such as the equivalence ratio (ER), low heating value (LHV), cold efficiency (CCE) and cold gas efficiency (CGE) and the steam-to-biomass ratio (SBR) by selecting the gasification agent as the design variable. The comparison of the gasification efficiency in relation to the use of other gasifying agents (air, steam, and combination of oxygen-steam) was also performed.
An economic assessment was performed by using the Aspen Process Economic Analyzer software, estimating the economic indicators of fixed investment, total investment, annual operating costs and the net profit of the unit, as well as the return of investment (ROI) and pay out time (POT) indicators, in order to assess economic viability.
Finally, conclusions of the study were drawn, while assumptions and approaches considered in the calculations were commented on.
3. Materials and Methods
RH is of a huge reserve and availability at a low price in Greece. It is the by-product of the industrial processing of rice. It accounts for approximately 20 wt.% of bulk grain weight and is very often used as an alternative source of silica in ceramics [
8]. It contains 70–80% organic substances such as cellulose, lignin, and 20–30% components such as silica, alkalis, and trace elements [
9]. Due to its high calorific value, it can be used as fuel for energy production by gasification [
10].
RH has a low inherent moisture content (<10 wt.%) and a C/N ratio >150, thus it is an appropriate fuel for thermochemical processing, such as gasification. Gasification generates the rice husk ash (RHA), which accounts for about 25% of the initial husk weight and causes environmental disposal problems [
11].
3.1. Choice of Materials
RH used in this study was provided by Greek company “Agrino”, which is the largest rice producer in Greece (5 t/h) (
http://www.agroenergy.gr/content, accessed on 30 May 2020). This production accounts for RH production of approximately 20 wt.% of the total paddy weight (whole grain). Therefore, 5 t/h of paddy grain produces about 1 t/h (20%) of RH, and when it is gasified to generate energy, it generates also about 250 kg/h (25 wt.%) of ash, a volume containing around 45 kg (85–95%) of amorphous silica [
12]. The ultimate, proximate, and chemical analysis of “Agrino” RH is presented in
Table 1.
3.2. Choice of the Technology
The technological system used was the SMARt-CHP system that produces renewable CHP from waste-biomass and is used for waste management [
7]. The electricity generated is either used on-site or it is supplied to the grid. The heat generated by the process is used to heat the industry’s buildings.
SMARt-CHP is a technological output that is suitable for circular economy applications. It consists of a pilot fluidized bed gasifier coupled with an internal combustion engine (ICE). It was designed and developed in our laboratory, funded by an EU LIFE+ project (
www.smartchp.eng.auth.gr, accessed on 30 May 2020). The unit includes the following parts:
- (1)
Biomass feeding system;
- (2)
Air supply, control, and preheating;
- (3)
FBG reactor;
- (4)
Gas sampling and offline analysis section;
- (5)
A cyclone filter for ash removal;
- (6)
A heated high-performance ceramic wall filter, where about 99% of the fine gas particle charge is maintained;
- (7)
A water purification unit, consisting of three refrigerants and a condenser in which the gas tar content is minimized.
The max capacity and efficiencies of the SMARt-CHP bioenergy generation technology are:
- ▪
Max. capacity (t/y) = 187.5
- ▪
Electrical efficiency, ne % = 25
- ▪
Thermal efficiency, nth = 67
3.3. Choice of Experimental Data
The experimental data on which the simulation was based were derived from experiments performed at our laboratory in the temperature range of 700–900 °C, with under-stoichiometric conditions of oxygen supply. A sub-stoichiometric ratio of 10/90
v/
v % O
2/N
2 was used. The conversion yield reached 24% wt./wt. The heat produced was on average 10.6 MJ/Nm
3. The syngas composition mainly consisted of carbon monoxide (CO), carbon dioxide (CO
2), methane (CH
4), hydrogen (H
2) and traces of ethylene (C
2H
4) and ethane (C
2H
6) with average values of 30, 40, 10, 16, 0.75, and 1.15% in
v/
v, respectively. Char, the solid gasification by-product, yielded at 33.5 wt.% [
6].
3.4. Choice of Simulation Modeling
Although models can mimic many natural phenomena, they require very detailed information (geometry, materials, and boundary conditions) and high computational resources. Models are classified as stoichiometric and non-stoichiometric depending on whether they are based on equilibrium constants or minimizing Gibbs free energy. Non-stoichiometric equilibrium models are the most common approach to describing the performance of a Fluidized Bed Gasifier (FBG). Aspen Plus is used to model biomass gasification processes [
13].
ASPEN Plus is the chemical industry’s leading process simulation software that allows the user to build a process model and then simulate it using complex calculations (models, equations, math calculations, regressions, etc.), while it enables lifecycle modeling from design through operations combining accuracy and time-saving. It is being used by many researchers to simulate the gasification process of biomass and wastes [
4,
14].
Ultimately, the choice of the model largely depends on the targets and experimentally available information. We knew that Aspen Plus modeling involving an FBG could be difficult due to the complexity of the hydrodynamic liquefaction and the complex nature of the natural and chemical phenomena that occur within the FBG.
Hypotheses and Model Assumptions
The accuracy of simulation results strongly depends on the decisions and assumptions that have been made.
Table 2 presents the assumptions made in this study for simulating the process of FBG.
3.5. Choice of Processes
The processes of this simulation concern pyrolysis, combustion, and gasification as well as the cleaning of the gaseous product. The first stage involves pyrolysis, which simulates the thermal decomposition of biomass before oxidation (i.e., the gasification zone of the gasifier, where the biomass is broken). The pyrolysis process is achieved at high temperatures around 500 °C and its goal is the conversion of biomass from non-conventional to simple components (H2, CO, CO2, CH4 and H2O). The second stage concerns combustion and gasification (i.e., the combustion zone and gasification zone of the gasifier, where the conventional components react with the gasification agent to further oxidation–reduction reactions after preliminary gasification).
For the evolution of temperature, we used information provided by the experimental study. First, the fuel was loaded into the reactor from the top at room temperature, while the gasification agent was introduced from the bottom of the reactor at ambient temperature if it was air and at above 100 °C if it was steam. As biomass moves downwards, it is subjected to cracking, carried out at a temperature up to 500 °C. Then, the gasification stage takes place, in a temperature range of 550–900 °C. The combustion products introduced into the reactor in the oxidation zone can rise the temperature up to 1100 °C for the need of breaking down the heavier hydrocarbons and tar of the syngas. As these products move downwards, they enter the reduction zone where a production gas is formed by the action of carbon dioxide and water vapor. Hot and dirty gas passes through a system of refrigerators, cleaners, and filters before being sent to engines, as it is the standard way [
15].
In the present simulation in the first-round calculations, air was used as the gasification agent, the oxygen of which, in combination with the high temperature, leads to combustion. At the same time, the remaining conventional components and combustion products were led to the gasification stage where the achieved temperature was above 700 °C. In this process, reactions such as the methane reforming reaction (MSR) and the water–gas displacement reaction (WGS) play an important role in the production of the high-value gas product based on the Gibbs free energy minimization principle.
The final stage involves wet cleaning through cooling water and the separation of clean gas and unwanted liquid products.
3.6. Choice of Reactions System
Biomass contains carbon, hydrogen, and oxygen as the main chemical components. Therefore, it can be represented by the molecular formula CxHyOz which can be quantified by the final analysis, where x, y and z represent the elemental fractions C, H, and O, respectively. RH molecular form is described as CH
αhO
βh (SiO
2)
δh, where ah, bh, dh and a, b, d were calculated by the analysis of RH from
Table 1.
We also assumed that the RH char has the chemical formula CHαOβ(SiO2)δ.
The homogeneous and heterogeneous chemical reactions that we considered to occur in the gasification process are shown in
Table 3. The number next to the reactions indicates the order in which they are performed. Hydrogen and carbon in combustion reactions (R-3, R-2), as well as water–gas in displacement and methanization reactions (R-7, R-4) are all exothermic and ideally provide the system with the required energy. On the other hand, steam reforming, Boudouard and water–gas shift reactions (R-6, R-8, R-5) are endothermic and their effect on gasification products becomes more apparent at high temperature.
This simulation involves 3 stages:
- ❖
The first stage involves the pyrolysis reaction, which is represented by the R-1 reaction and the volatiles include CO, CO2, H2, H2O, CH4, hydrocarbons with low molecular weights such as C2H4 and C2H6, carbon and tar.
- ❖
The second stage is combustion, where the RH char (CH
αO
β(SiO
2)
δ) is first subjected to partial combustion with oxygen to produce CO and CO
2, represented by the R-2 reaction, according to literature [
4].
- ❖
The third stage consists of gasification reactions represented by gasification reactions R-3 until R-7, according to the literature [
4].
In fact, there is another preliminary stage before cracking, which is the drying phase to reduce the raw material moisture content below 10 wt.%., depending on the moisture content of the raw material. We neglected the drying stage in this study because RH’ moisture content is 9.5 wt.% < 10 wt.% [
6].
We also considered the process of gasification to take place at the atmospheric pressure that is the most common [
16].
3.7. Choice of Reactor Blocks
The simulation of the gasification reactor was performed in Aspen Plus software with the array of 2 reactors, each of which had a separate use which at the same time led to the result. For a multi-phase or multi-action system such as RH gasification, which involves multiple decompositions, combination, and adverse reactions, it is recommended to use the type of Gibbs reactor (R-Gibbs) created in Aspen Plus required to solve all of them to predict equilibrium compositions. This type of reactor is based on minimizing the total Gibbs energy of the mixture products and allows control and transport.
Since R-Gibbs cannot handle non-conventional components such as RH, in the case that some electricity or heat is needed, this can be inserted into the R-Yield block. In this block, RH is converted into a system of equivalent environmental components at the same levels of enthalpy. This current, generated after R-Yield, in combination with the air required for partial combustion and gasification, is directed to the R-Gibbs block to produce the products of the gasification reactions. The R-Gibbs subunit calculates adiabatic reactivity temperatures, such as the equilibrium component (estimated using Gibbs free energy minimization). The R-Gibbs calculation subunit can also be used when one or more reagents are not fully involved in equilibrium conditions. This is achieved by specializing in the extent of equilibrium for the ingredients.
In the case of the gasification of RH where there are adiabatic conditions, the equilibrium of the composition of the product provided by R-Gibbs depends on the flow rates, composition, and temperature of the surface materials (rice husk and air) supplied to the gasifier. The reactor blocks are presented in
Table 4.
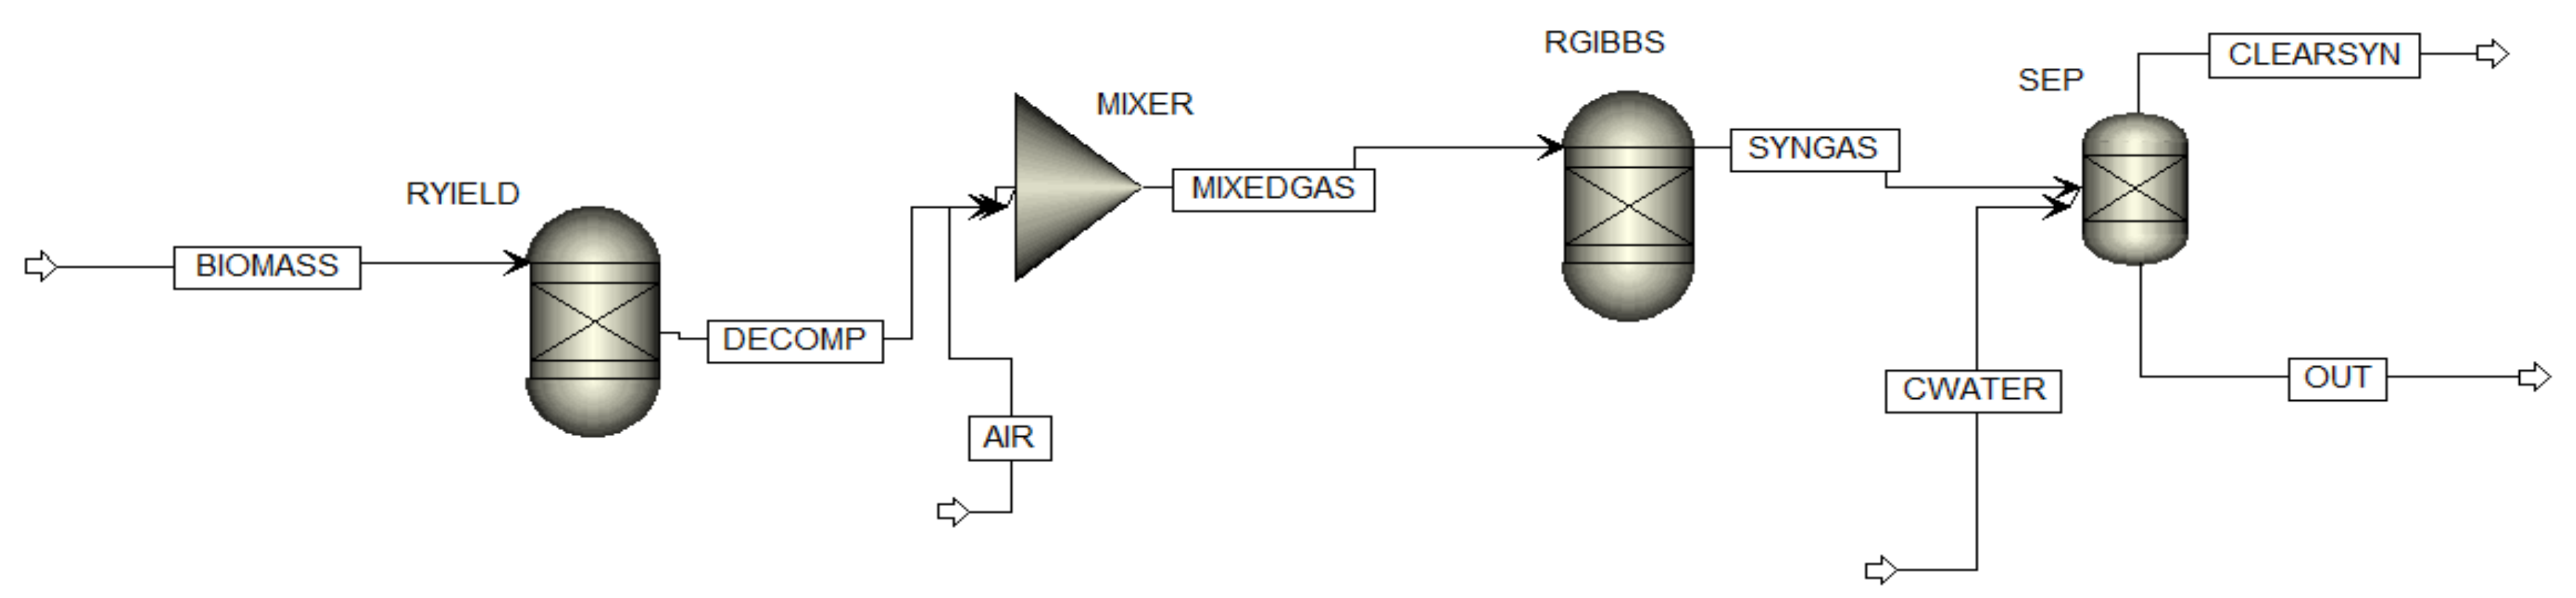
3.8. Flow Sheet of Air Gasification
In the software, the biomass supplied to the gasifier is characterized by the ultimate and proximate analysis and not by its chemical formula, as it is classified as non-conventional. The HCOALGEN and DCOALIG tool was used, for the the final analysis and sulfur analysis, to calculate the lowest heating value (LHV), the enthalpy calculation (HCOALGEN) and the density (DCOALIG) of the biomass (non-conventional component). The Peng Robinson equation was used to estimate all the physical properties of conventional components produced by the gasification process.
The R-Gibbs block calculates the equilibrium of the chemical equilibrium and the phase by minimizing the Gibbs free energy of the system. Before feeding the biomass to the R-Gibbs block, it must be decomposed into conventional elements using the R-Yields reactor. Thus, the R-Gibbs block was used to precisely simulate oxidants and reduction zones in the gas reactor. A mixer block was used to mix the products of the R-Yield reactor (Decomp) with the flow of air, in a sub-stoichiometric quantity, before entering the R-Gibbs block.
Figure 1 presents a comprehensive Aspen Plus flow sheet for the fluidized-bed gasification process, while
Table 5 descripts the Aspen Plus reactor blocks considered in the model.
The performance of the individual products of the R-Yield block can be estimated using a “block calculator”, i.e., a subroutine written in Fortran language defined by the user to estimate the performance of volatility products based on the final and immediate analysis of the biomass, or with approximate models of the reactions that take place during the firing stage and are processed in Excel software.
3.9. Energy Balances
We considered that the mixing ratio is high due to the fluidized bed gasifier, and that removal, combustion, and all gasification processes occur at a high rate, at the operating temperature. Therefore, the mass balance can be given by the Equation (1), considering the Gibbs free energy minimization concept.
where:
or
The term “elutriation” in Equation (1) refers to the separation of fine particles from smaller ones. It is important to include the contribution of the elutriation of fine particles from fluidized beds because it affects the residence time, conversion, and is used for reaction, drying and in energy balance.
The above Equation (4) is the total Gibbs equation (
nG) that must be minimized depending on the composition of the individual compounds at the operating temperature and pressure. This depends on the constraints imposed by individual balances written on closed systems [
4].
3.10. Air Gasification Syngas Composition Estimation
We based the estimation of syngas composition on the main reactions that took place during pyrolysis. Essentially, we followed the procedure described elsewhere [
17] but with a consideration of carbon efficiency close to 100% (YC = 0).
Therefore, based on the proportions resulting from the above reactions, the simplified yields of the conventional products follow the relationships:
Combining the above and the using the subroutine, we calculated the yields (v.v%) of CO, CO2, CH4, H2, C2H4, C2H6, and H2O.
The flows of the material were as follows: The releases of biomass gas components such as CO, H2, CO2, CH4, N2, H2O, and O2 are defined as routine components. Biomass is the non-conventional ingredient. The decomposition unit is very similar to the R-Yield performance reactor. In this section, the biomass is decomposed into some conventional solid elements, i.e., the gasification product in a simpler form of each element such as O2, H2, C, N2, and ash. The energy flow in this process is as follows: Some of the heat generated by the combustion of carbon is the heat loss of the whole system, and some flows to the pyrolysis reactor. The rest of the heat is provided by the gasification reaction to create gas. In the cracking unit, the carbon conversion ratio is 99%, i.e., it approaches 100% in the gasifier.
In the R-Gibbs reactor, chemical equilibrium reactions have been tested to represent the gasification process, namely the methane reforming reaction and the water–gas displacement reaction:
The methane reforming reaction is a chemical reaction that converts methane into carbon monoxide and/or hydrogen. WGS converts CO and H2O to extra H2 and carbon dioxide, as the reaction does not change linear sets and therefore the effect of the pressure on the reaction is minimal.
Assessing tar and char yields is a difficult task through a thermodynamic equilibrium model because tar is usually a non-equilibrium product. Since the predictions of mathematical models are substantially improved when tar formation is included, in this study, tar and carbon yields were considered as input parameters and were determined independently of the gasifier operating conditions, according to other bibliographic models. Thus, they were placed as inert ingredients in the R-Gibbs reactor. At high temperatures, such as those examined, the tar content is very moderate, while the gas efficiency is very high.
Tar was described as “C6H6” with the same thermochemical properties of benzene, while char was defined as carbon with the thermochemical properties of graphite.
4. Indicators for Monitoring and Assessing of FBG System
In order to be able to derive reliable and comparable results of the three scenarios, certain indicators must first be defined in addition to the gasification temperature, characterized as active evaluation indicators. Parameters such as temperature (T), equivalence ratio (ER), and biomass vapor ratio (SBR) are suitable for the synthesis of syngas, as well as the lowest heating value (LHV). The indicators used for the sensitivity analysis in this study are:
- (1)
Air–biomass equivalent ratio (ER).
- (2)
Steam–biomass ratio (SBR).
- (3)
Lower heating value (LHV).
- (4)
Higher heating value (HHV).
- (5)
Cold gas efficiency (CGE).
- (6)
Carbon conversion efficiency (CCE).
4.1. Air–Biomass Equivalence ratio (ER)
In this simulation, the gasification process was investigated by changing the air flow and consequently oxygen, which affects the ER equivalence ratio that is the main operating parameter. ER is defined as the air-to-biomass weight, relative to the stoichiometric air-to-biomass weight required for complete combustion. The ratio of air used in the system to the stoichiometric required air (ratio of air equivalence ratio) is an important factor to consider. Its wise choice discourages the stimulation of oxidation reactions. The reason for combustion equivalence is the ratio between the available oxidizer and the stoichiometric quantity required for the complete reaction. It will have a value of 1 for full combustion and 0 for pyrolysis, while the appropriate values fall in the range 0.19–0.43. Oxygen availability, both as a free molecule and as a percentage in the water molecule, is a key factor in gasification. ER is defined by the following equations [
14]:
4.2. Steam to Biomass Ratio (SBR)
In a steam gasification scenario, steam is used as the oxidizing agent instead of air. In this case, the steam-to-biomass ratio (SBR) is used as the ratio between the flow rate of the incoming steam to the flow rate of the biomass fed, as can be seen the following equation [
18]:
The biomass feed rate is maintained as constant while the steam flow is varied. Therefore, it is clear to foresee that above the SBR optimum range, the gas yield, LHV, and carbon conversion efficiency will tend to decrease because high amounts of unreacted H
2O will appear in the syngas, causing thermal efficiency to decline significantly. The optimum range of SBR is 0.2–0.4, based on the bibliography [
14].
4.3. Lower Heating Value (LHV)
The lower heating value (LHV) is defined as the net calorific value and is determined by subtracting the heat of vaporization of water vapor. The main research goal is to produce gas enriched in CO, H
2, and CH
4 because the presence of these fuels leads to gas of high heating value, suitable for further exploitation in internal combustion engines and turbines for power generation. The lowest heating value (LHV) of the produced gas is calculated using the following equation [
14]:
where X
CO, X
H2, and X
CH4 are the linear fractions of the gaseous products in syngas.
4.4. Cold Gas Efficiency (CGE)
CGE is the key index that measures the global performance of the gasification process. It is defined based on the first law of thermodynamics as the ratio between the chemical energy of raw syngas (calculated as the product of syngas mass flow and its lower heating value) and the chemical energy of RH feedstock. Therefore, CGE is the energy output over the potential energy input (chemical energy contained in the product gas with respect to the energy contained in the initial solid fuel) based on the LHV of both the solid fuel and the product gas. The CGE indicates the percentage of energy content of RH inherited from the syngas and can be calculated from the following equation [
18]:
where LHV
gas is the producer gas’s lower heating value, V
gas is the volume of produced gas and LHV
b is the lowest heating value of rice husks which is equal to 7.13 MJ/Nm
3. F
b is the RH feed.
4.5. Carbon Conversion Efficiency (CCE)
Carbon conversion efficiency (CCE) expresses how much of the natural carbon from biomass waste is transported to the gas produced. The equation used to calculate CCE is shown below [
18]:
where V
gas is the volume of produced gas, CO
v/
v% the volume percentage of gaseous species in the producer gas and C
b is the wt.% of carbon in the RH feed.
5. Results: Model Validation with Experimental Results (ERes)
The simulation results (SRes) for the FBG gasifier model were validated through comparisons with experimental data from one previous study [
6]. In order to be able to compare data obtained from the simulation of Aspen Plus, the gasification conditions of the experiments must first be provided. In each gasification cycle in the experimental study, 5 g of biomass of rice husk biomass were fed to the gasifier, so a 0.005 t/cycle. Additionally, as a gasification agent, the air under stoichiometry of 10/90
v/
v% (O
2/N
2) with a flow of 200 mL/min was used and the residence time in the gasifier was 32 min on average [
14]. Therefore, with simple calculations for each gasification cycle, 0.11 L/cycle of the gasification agent was estimated.
Table 6 shows the simulated results (SRes) of the syngas composition for three air gasification temperatures (T = 700, 800, 900 °C) and for various experimental results (Eres).
The ER value is directly related to the oxygen/air content in the gasifier, and if it is high, it can turn the gasification process towards combustion as
Table 6 shows. Higher ER values lead to a decrease in syngas heating value and in the higher conversion of H–Cs to CO and CO
2, a decrease in tar yield and CH
4 content in the syngas. Increasing temperature increases H
2 production in product gas due to the gasification of char and methane reforming reactions (
Figure 2).
Figure 2a–d compare the SRes with ERes of syngas composition in CO, CO
2, CH
4 and H
2 in function of the air gasification temperature.
As it can be noticed in
Figure 2, SRes show good accuracy in the prediction of H
2 but not for CO, CO
2 and CH
4, content. This indicates that the model needs modification to improve the accuracy of prediction.
This can be attributed to the fact that the RGIBBS reaction simulates better an entrained flow gasifier and not so well a fluidized bed gasifier, for which a semi-empirical model might fit better than the RGIBBS reaction. For a more detailed calculation of the difference between SRes and ERes,
Table 7 presents the calculated deviations by using the following equation: % deviation = [(SRes) − (ERes)/(ERes)] × 100.
As it can be noticed in
Table 7, deviations vary from −60.0 to +76.2. These are the lower and upper deviations that mainly occur in the case of CH
4 and consequently to the cold gas efficiency (CGE). While experimentally it appears that in the syngas there is a certain amount of methane, this is not the case in the simulated results. This devaluation of CH
4 is due to the minimization of Gibbs energy and the ideal chemical equilibrium reactor that were hypothesized in the simulation, which do not occur in real commercial gasification systems.
Additionally, the SMARt-CHP technology that was considered in this study for the experimental results produces tar and hydrocarbons (mainly methane), components that were neglected in the equilibrium-based predicted model.
Similarly, some small differences in the composition of the gaseous products are due to the consideration of the R-Yield reactor to simulate gasification in Aspen Plus. The RGIBBS reaction is rather closed to the entrained flow gasifier and not to the fluidized bed gasifier, for which a semi-empirical model might fit better than the RGIBBS reaction.
6. Sensitivity Analysis for Monitoring and Assessment by Using Indicators
A sensitivity analysis was conducted to monitor and assess the studied system by using the indicators described in the previous chapter.
6.1. Effect of Equivalence Ratio (ER) and Gasification Temperature on Syngas Composition
During gasification, emphasis is placed on the maximizing gas efficiency to produce a gas with an HHV to be efficient and used to generate electricity. Two parameters are the main ones that affect the efficiency and composition of the gas:
If a high ER is used, the syngas content on CO, H
2 and CH
4 decreases with a higher ER (
Figure 2); and the gas LHV decreases. At the same time, increasing the ER allows to increase the temperature of the reactor, promoting a higher flow through the reactor, and reducing the tar content in the syngas. According to the above figure, the concentration of CH
4 in syngas decreases dramatically with increasing ER. The CO and H
2 content decreases with very high ER. For the above reasons, an accurate choice of the two parameters is necessary to optimize the process.
At the Aspen Plus simulation of air gasification, the ER ratio was set at 0.3 to achieve a syngas with a high heating value.
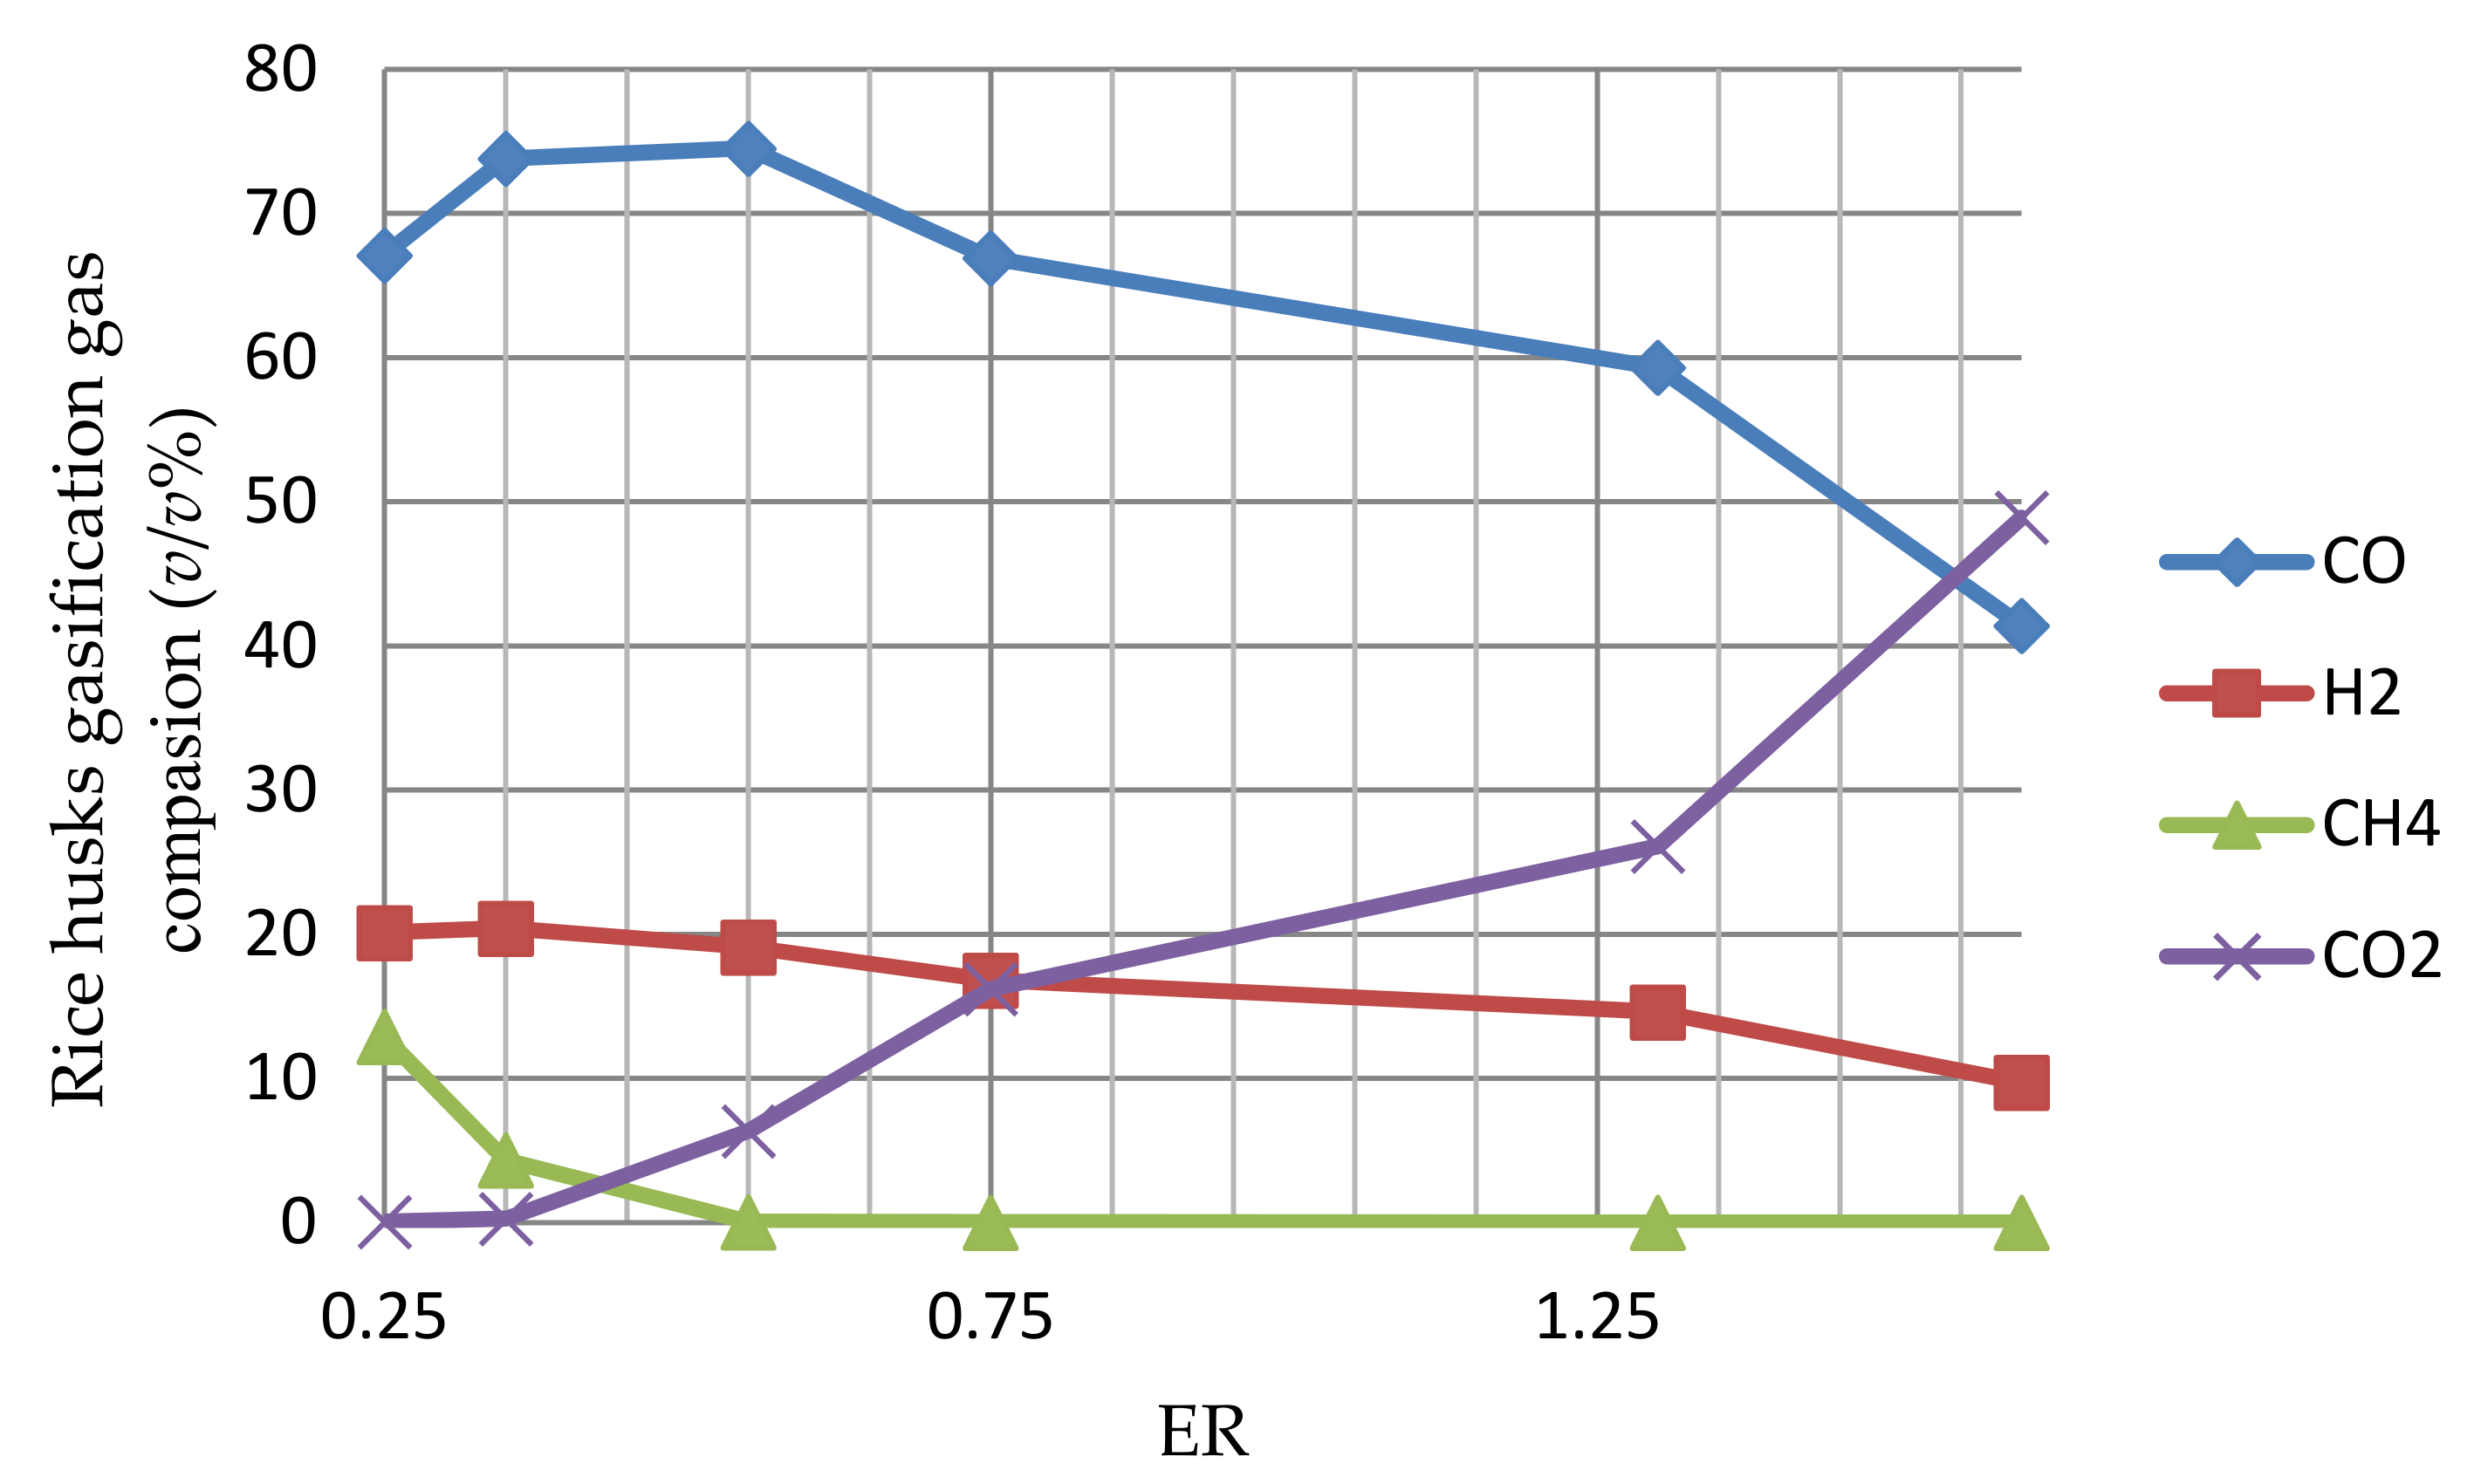
Figure 3 depicts the effect of ER on the composition of the syngas simulated results (SRes).
Based on the results from the above ER comparison chart, it is observed that for ER > 0.3, carbon dioxide (CO2) increases sharply, which is not desirable. Therefore, in the case of rice husk air gasification, an ideal ER ratio is proved to be 0.3 (quite close to the bibliographic one which is 0.27). It is obvious that for a given temperature, the increase in air (higher ER) leads to a decrease in the final efficiency of syngas.
Further increase in ER leads to reductions in CO and H2 concentrations, which is probably due to the favorable combustion reaction. The CO2 concentration increases sharply with the increase in ER due to complete combustion and reaches a value in the range of 20–30% at ER = 1. The change in the concentration of CH4 with an increase in ER is considered negligible. Further increases in ER were found to lead to reductions in CO and H2 volume fractions due to combustion reactions. LHV increases with increasing ER to the value in the range of 0.35 and then begins to decrease dramatically. In conclusion, ER had the opposite effect on LHV from temperature, i.e., higher ER reduced LHVgas due to the oxidation of part of the gaseous gases present in the syngas.
Moisture content (MC) of biomass affects the efficiency of the gasification process. It is known that the high content of MC is responsible for reducing H2 and CO in gas production and increasing CO2. As a result, the heating value of syngas decreases while the MC increases. For this reason, in this simulation, the biomass of rice husks with moisture content below 10% was used as a raw material.
The gasification unit was simulated in Aspen Plus software in the temperature range of 700–900 °C, with an air gasification agent and with stoichiometry (10/90
v/
v% O
2/N
2). This temperature range was implied by the experimental data because the process was studied in the temperature range of 550–900 °C to optimize the syngas quality. The ER was set to 0.3, a value set in the experimental study. The effect of temperature on the quality and the energy efficiency of the syngas was studied in Aspen Plus software and is shown in
Figure 4.
The temperature of the gasifier affects the overall composition of the final product as shown in the diagram above. This is because some of the related chemical reactions that take place inside the gasifier are endothermic. Higher temperatures favor endothermic reaction products according to Le Châtelier’s principle. Temperature promotes the formation of a gas produced with higher H2 and CO contents and therefore higher LHV. On the other hand, the content of CH4 and CO2 follows an opposite trend. CH4 decreases with temperature because the methane reaction formation is exothermic.
According to the above
Figure 4, CO
2 follows a downward trend until it is eliminated as the gasification temperature increases, in contrast to CO, which while initially having a lower composition than CO
2, follows an upward trend reaching very high percentages. H
2 shows a relatively small increase and stabilizes at 20
v/
v% from 750 °C onwards. CH
4 shows a very downward trend and stabilizes at 6
v/
v% from 750 °C onwards. Finally, it should be noted that the remaining hydrocarbons (C
2H
4 and C
2H
6) in the whole range of temperatures have a composition below 1
v/
v%.
The reduction in CO2 concentration could be attributed to the Boudouard reaction which takes place at a higher temperature range compared to the water–gas shift reaction. Therefore, CO production and CO2 consumption are preferred. In addition, methane reforming reactions affect the CH4 concentration which is reduced to a higher gasification temperature. The bottom line is that the produced gas from the simulation of the Aspen Plus gasification unit is rich in CO and H2, but poor in CH4 and CO2.
The molecular weight of the produced gas is 22.
6.2. Effect of Gasification Temperature on Syngas Low Heating Value (LHV)
It was observed that this LHV of the syngas stabilized at 13 MJ/Nm3 from 850 °C onwards. It is considered that at 850 °C, the gasifier reaches the highest fuel conversion. During these calculations, the LHV values of the syngas at 700, 800, and 900 °C were taken to be around 14.5, 13.0 and 13.0%, respectively.
6.3. Effect of Gasification Temperature on Cold Gas Efficiency (CGE)
CGE indicates the percentage of energy content of RH transferred in the gas product. CGE for all raw materials is directly proportional to the gasifier temperature according to the definition and Equation (15). However, gas LHV decreases with temperature, and CGE is higher at a higher gasification temperature due to the increased volume of gas product. The CGE from the rice husks is maximized at 850 °C where the gasifier reaches the highest fuel conversion. During these calculations, the CGE values of the FBG gasifier at 700, 800, and 900 °C were taken to be 85.0, 92.0, and 90.0%, respectively. The high CGE suggests that the coke is cracked.
6.4. Effect of Gasification Temperature on Carbon Conversion Efficiency (CGE)
Carbon conversion efficiency (CCE) expresses how much of the natural carbon from rice husk waste is transported to the produced gas. The maximum efficiency of carbon conversion (CCE) is at 900 °C, where the gasifier reaches the highest fuel conversion, and it is equal to 22%, while at 850 °C it reaches the 21% conversion. During these calculations, the CCE values of the FBG gasifier at 700, 800, and 900 °C were taken to be 16.5, 20.0, and 22.0%, respectively.
6.5. Study of Alternative Gasification Scenarios
The oxidizing agent has a significant effect on the heating value syngas produced. However, the main scenario studied was that of air gasification, and simulations of other two scenarios were attempted by using all the same hypotheses and conditions whilst only changing the gasification agent. Thus, the second scenario simulated was the steam gasification in the R-Gibbs reactor and the third scenario was the (air + oxygen) gasification.
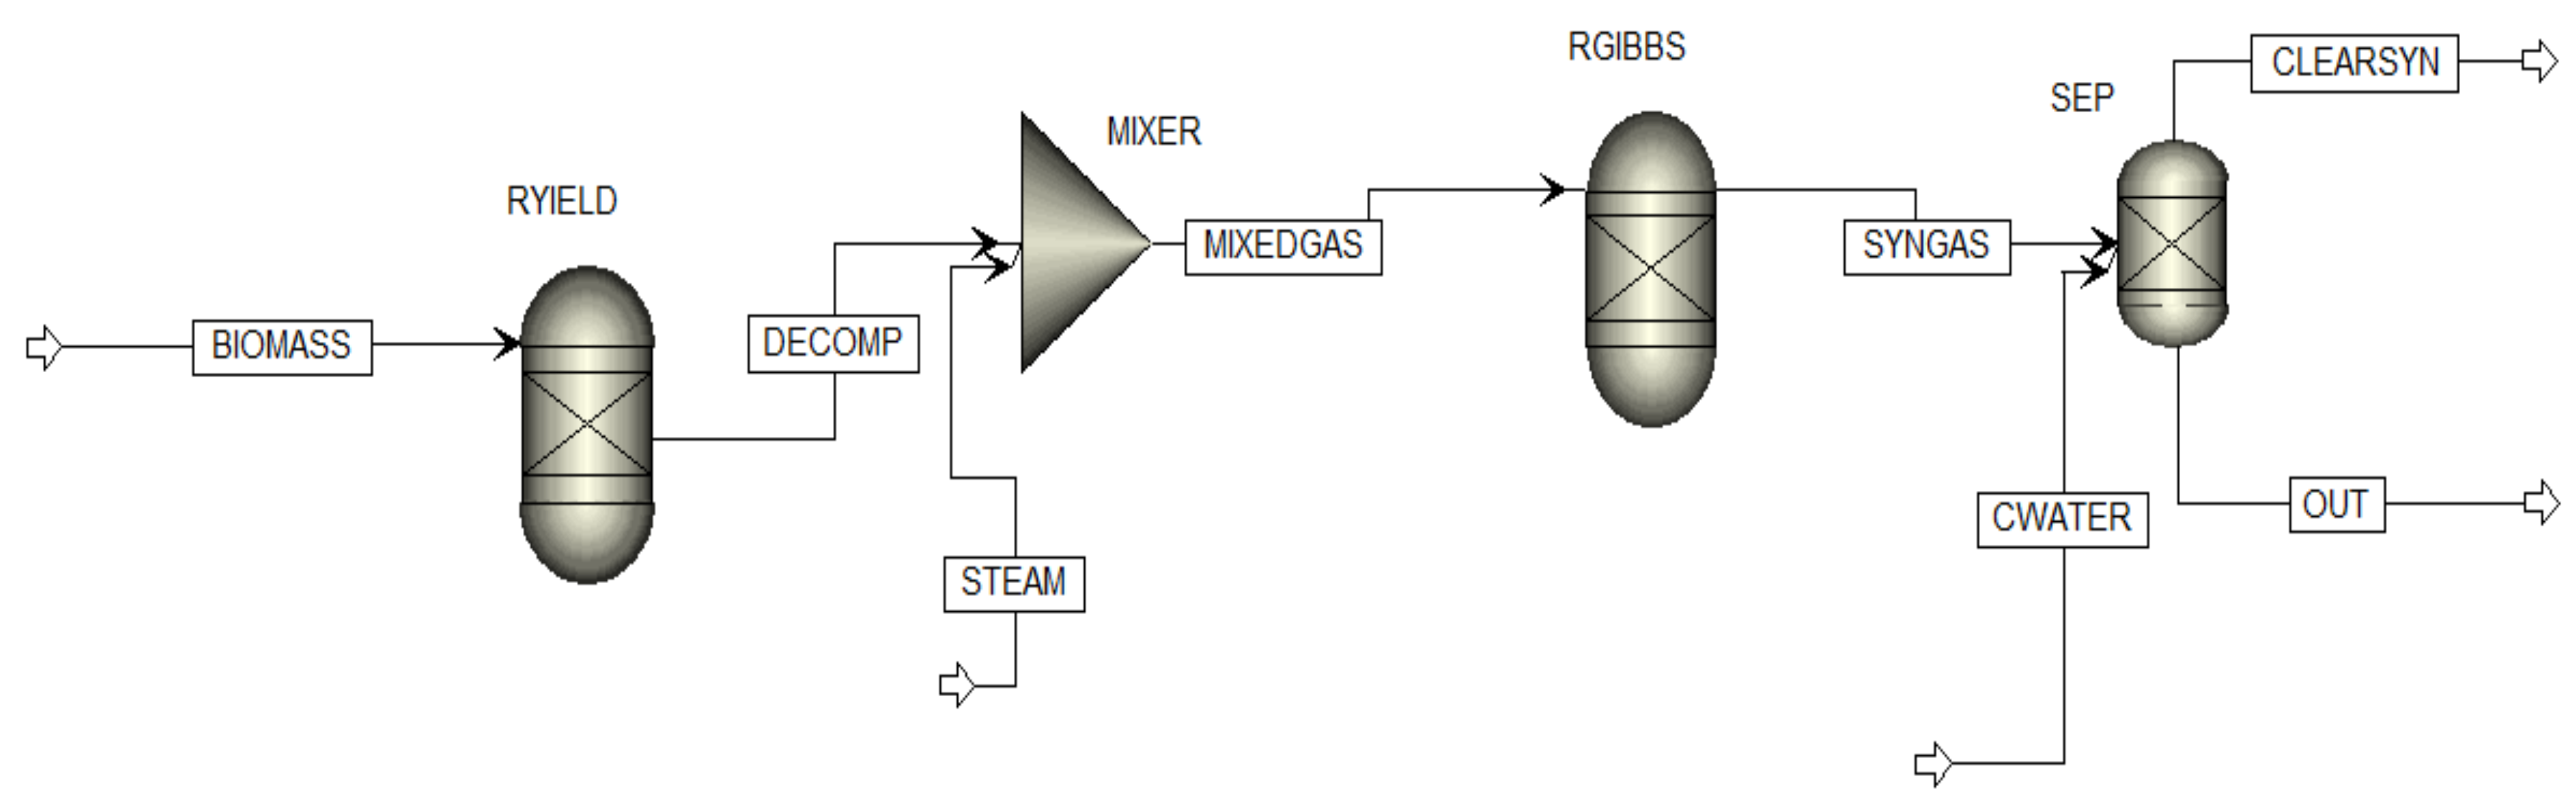
The flow sheet of the steam gasification scenario is presented in
Figure 5. The flow sheet of the (steam + oxygen) gasification is depicted in
Figure 6.
The results of the second alternative scenario calculated by the Aspen Plus worksheet are shown in
Table 8 with respect to SBR or ER, LHV and CCE indicators.
As can be noticed in the case of steam gasification, there is a larger initial amount of methane (CH
4) and less carbon monoxide (CO) compared with the results of air gasification as presented in
Table 6. Finally, based on
Table 8, there is an improvement in the composition of the gaseous product to the SBR = 0.5 and then as the SBR increases, the carbon dioxide increases, which is not desirable. Therefore, in the case of this study, the ideal value for the SBR was calculated as 0.4 (quite close to that of the literature which is 0.35).
The use of steam as a gasifier increases the partial pressure of H
2O in the gas reactor that favors water–gas, water–gas displacement and vapor reactions, leading to an increase in H
2 and CO
2 and a decrease in CO production as SBR increases. The heating value and hydrogen content of syngas are generally higher when the gasification of RH occurs with steam than when it occurs with air. However, based on
Table 8, the results are almost similar to those presented in gasification with air factor (
Table 6).
Both gasification agents (air and steam) are efficient with the only difference in the case of air, however, it is a cheap agent as opposed to the steam and steam gasification needs more energy to turn water into steam to be used in the process, although in the case of steam gasification, syngas has a higher H2 composition, resulting in higher LHV value.
Regarding the third alternative scenario of gasification with (steam + oxygen), it can be noticed that the best results are derived when ER = 0.3 and SBR = 0.4.
The comparison of the scenarios based on the syngas composition is depicted in
Table 9.
Based on
Table 9, for the gasification of RH with (oxygen + steam), the results regarding the composition of syngas were slightly better than those of gasification with air (
Table 6), but worse than those of steam gasification (
Table 8). This can be explained by the fact that the use of the agent (oxygen + steam) reduces the residence time of the air inside the reactor, preventing the continuous reactions in the gasifier from achieving the chemical equilibrium of a substance undertaken by the model.
However, (steam + oxygen) gasification needs an external energy source to maintain the reaction temperature, while oxygen and air are used in direct gasification because the oxidation reactions provide the energy required to sustain the temperature of the reaction. Nonetheless, oxygen is the best gasifying agent, though using oxygen is more costly and there is a risk that the gasification process may shift to combustion.
Therefore, the feasibility study that was conducted and is presented in the next chapter is the scenario of the assessment of its economic viability.
7. Feasibility Study
The Aspen Process Economic Analyzer was used for economic assessment. The SMARt-CHP characteristic values were used for the economic assessment. The cost of transportation and the price of RH was considered to be zero because it is hypothesized that the CHP unit will serve as a waste management solution for the rice processing company.
The Greek rice type “Agrino” is produced by the homonymous company which is the largest rice producer in Greece (5 t/hr). This production accounts for an RH production of approximately 20 wt.% of the total paddy weight (whole grain).
7.1. Fixed Investment Calculation (IF)
The first step in calculating the fixed investment is to calculate the cost of mechanical equipment. Based on the calculation by the Aspen Process Economic Analyzer, the cost of equipment amounts to USD 2,279,490 = EUR 2,101,735 for the scenario of air gasification and for a capacity of 25,000 t/y rice husks (USD/EUR = 1.084).
Based on the cost of purchased equipment, the amount of fixed investment of the facility was obtained. Using the estimation method based on the cost of procurement of mechanical equipment, the amount of the fixed investment was calculated. All individual costs are expressed as a percentage of the value of the mechanical equipment and represent average values for standard chemical installations [
19].
Table 10 shows fixed investment analysis using the Aspen Process Economic Analyzer. In
Table 10, the percentage of the land purchasing was intentionally omitted (6%) because the gasification unit was installed in the yard of the rice processing agro-industry.
7.2. Operating Costs Estimation
Summing up all the individual expenses together with some additional ones, the total annual operating costs of the unit were obtained, as shown in the following
Table 11.
The labor cost was calculated by using the Wessel Equation (19):
where α is a coefficient depending on the type of unit.
The following hypotheses were made:
- ❖
The unit is considered to be automated, and thus α = 11;
- ❖
It was considered that the unit operates for 292 days/y, a total of 7000 hr/y; therefore, the operation coefficient λ is equal to 0.8;
- ❖
The stages of the process were considered to be three;
- ❖
The labor cost was estimated based on the price of labor–hour = EUR 14.5 [
20].
7.3. Annual Sales Profits
The unit makes a profit on the one hand from the sale of electricity and heat, whilst on the other hand from the char. According to technology chosen, for an FBG unit for CHP and capacities of 100 kg/h, the energy produced is equal to 1.1–1.2 kWh for every 1 kg/h of power, regardless of the type of biomass. Thus, in our case of RH, the energy produced is set at 1.1 kWh for every 1 kg/h of RH gasified.
In the simulation performed, the capacity was 25,000 t/y RH, so by simple calculations, the generated energy was equal to around 99,000,000 kWh. From the produced energy, 28% was electricity and 72% thermal energy. Therefore, finally, 27,720,000 kWhel and 71,280,000 kWth will be produced by the gasification simulation unit and be sold as commodities.
The conversion of RH to char is equal to 35 wt.%. In the positive scenario of 25,000 t/y capacity, 8750 t/y char will be produced (0.35 * 25,000 = 8,750 t/y) which can be sold or used as biochar.
Table 12 shows cash inflows (S) generated by the unit from the sales of the commodities.
The gross income of the unit is calculated by using the equation:
The assumptions made to calculate the total net revenues (NRs), are the following:
- ▪
The unit’s lifespan is N = 10 years.
- ▪
Linear depreciation considered.
- ▪
Flat tax rate is t = 0.4.
- ▪
Depreciation coefficient for tax purposes is d = 1/N = 0.1.
- ▪
Depreciation coefficient for fixed capital is e = d.
The total net revenue was calculated by using Equation (18):
7.4. Estimation of ROI and POT Indexes
The ROI index expresses the performance in relation to the amount initially invested and is calculated by using the equation:
The POT economic index expresses the time required to equate finance with fixed investment capital and is calculated by using the equation:
The economic indicators are very positive.
7.5. Range of Viable Capacity Estimation
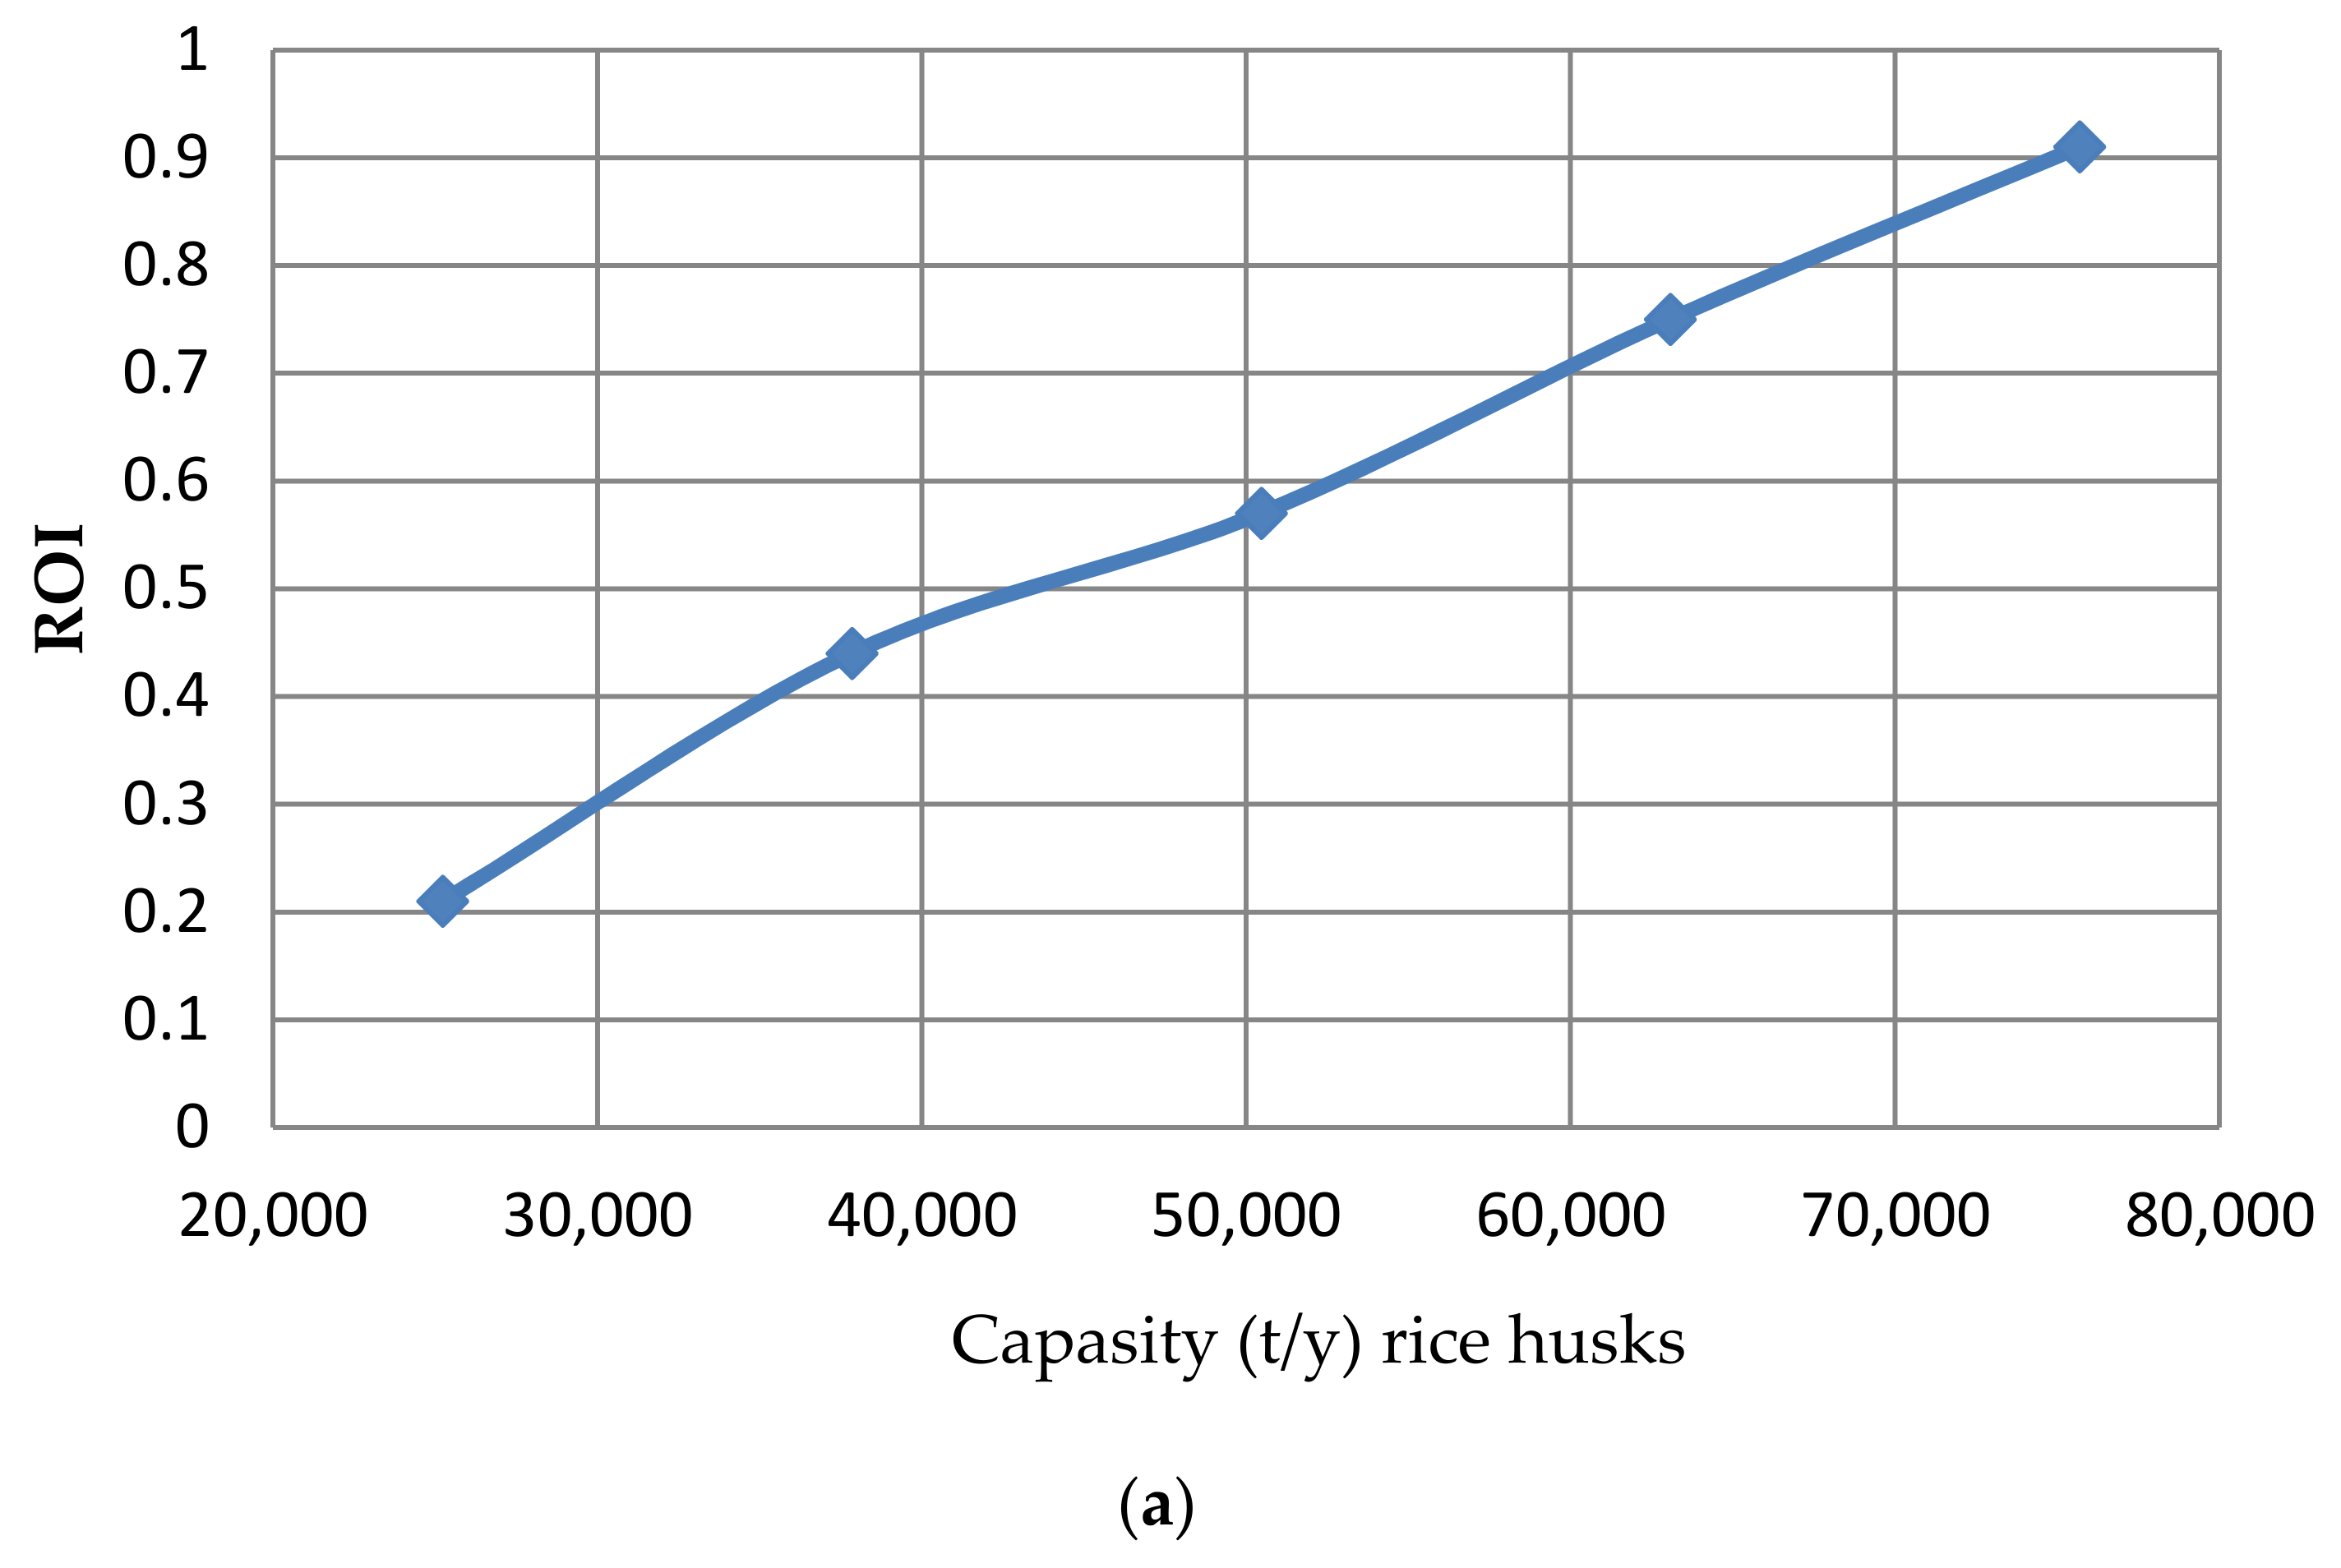
Based on the economic data and by using the ROI and POT indices, we can calculate the range in which the capacity of RH that is economically viable based on sensitivity analysis by Aspen Plus software and using as parameters the capacity, the fixed investment, occupational costs, utilities, and gross profit.
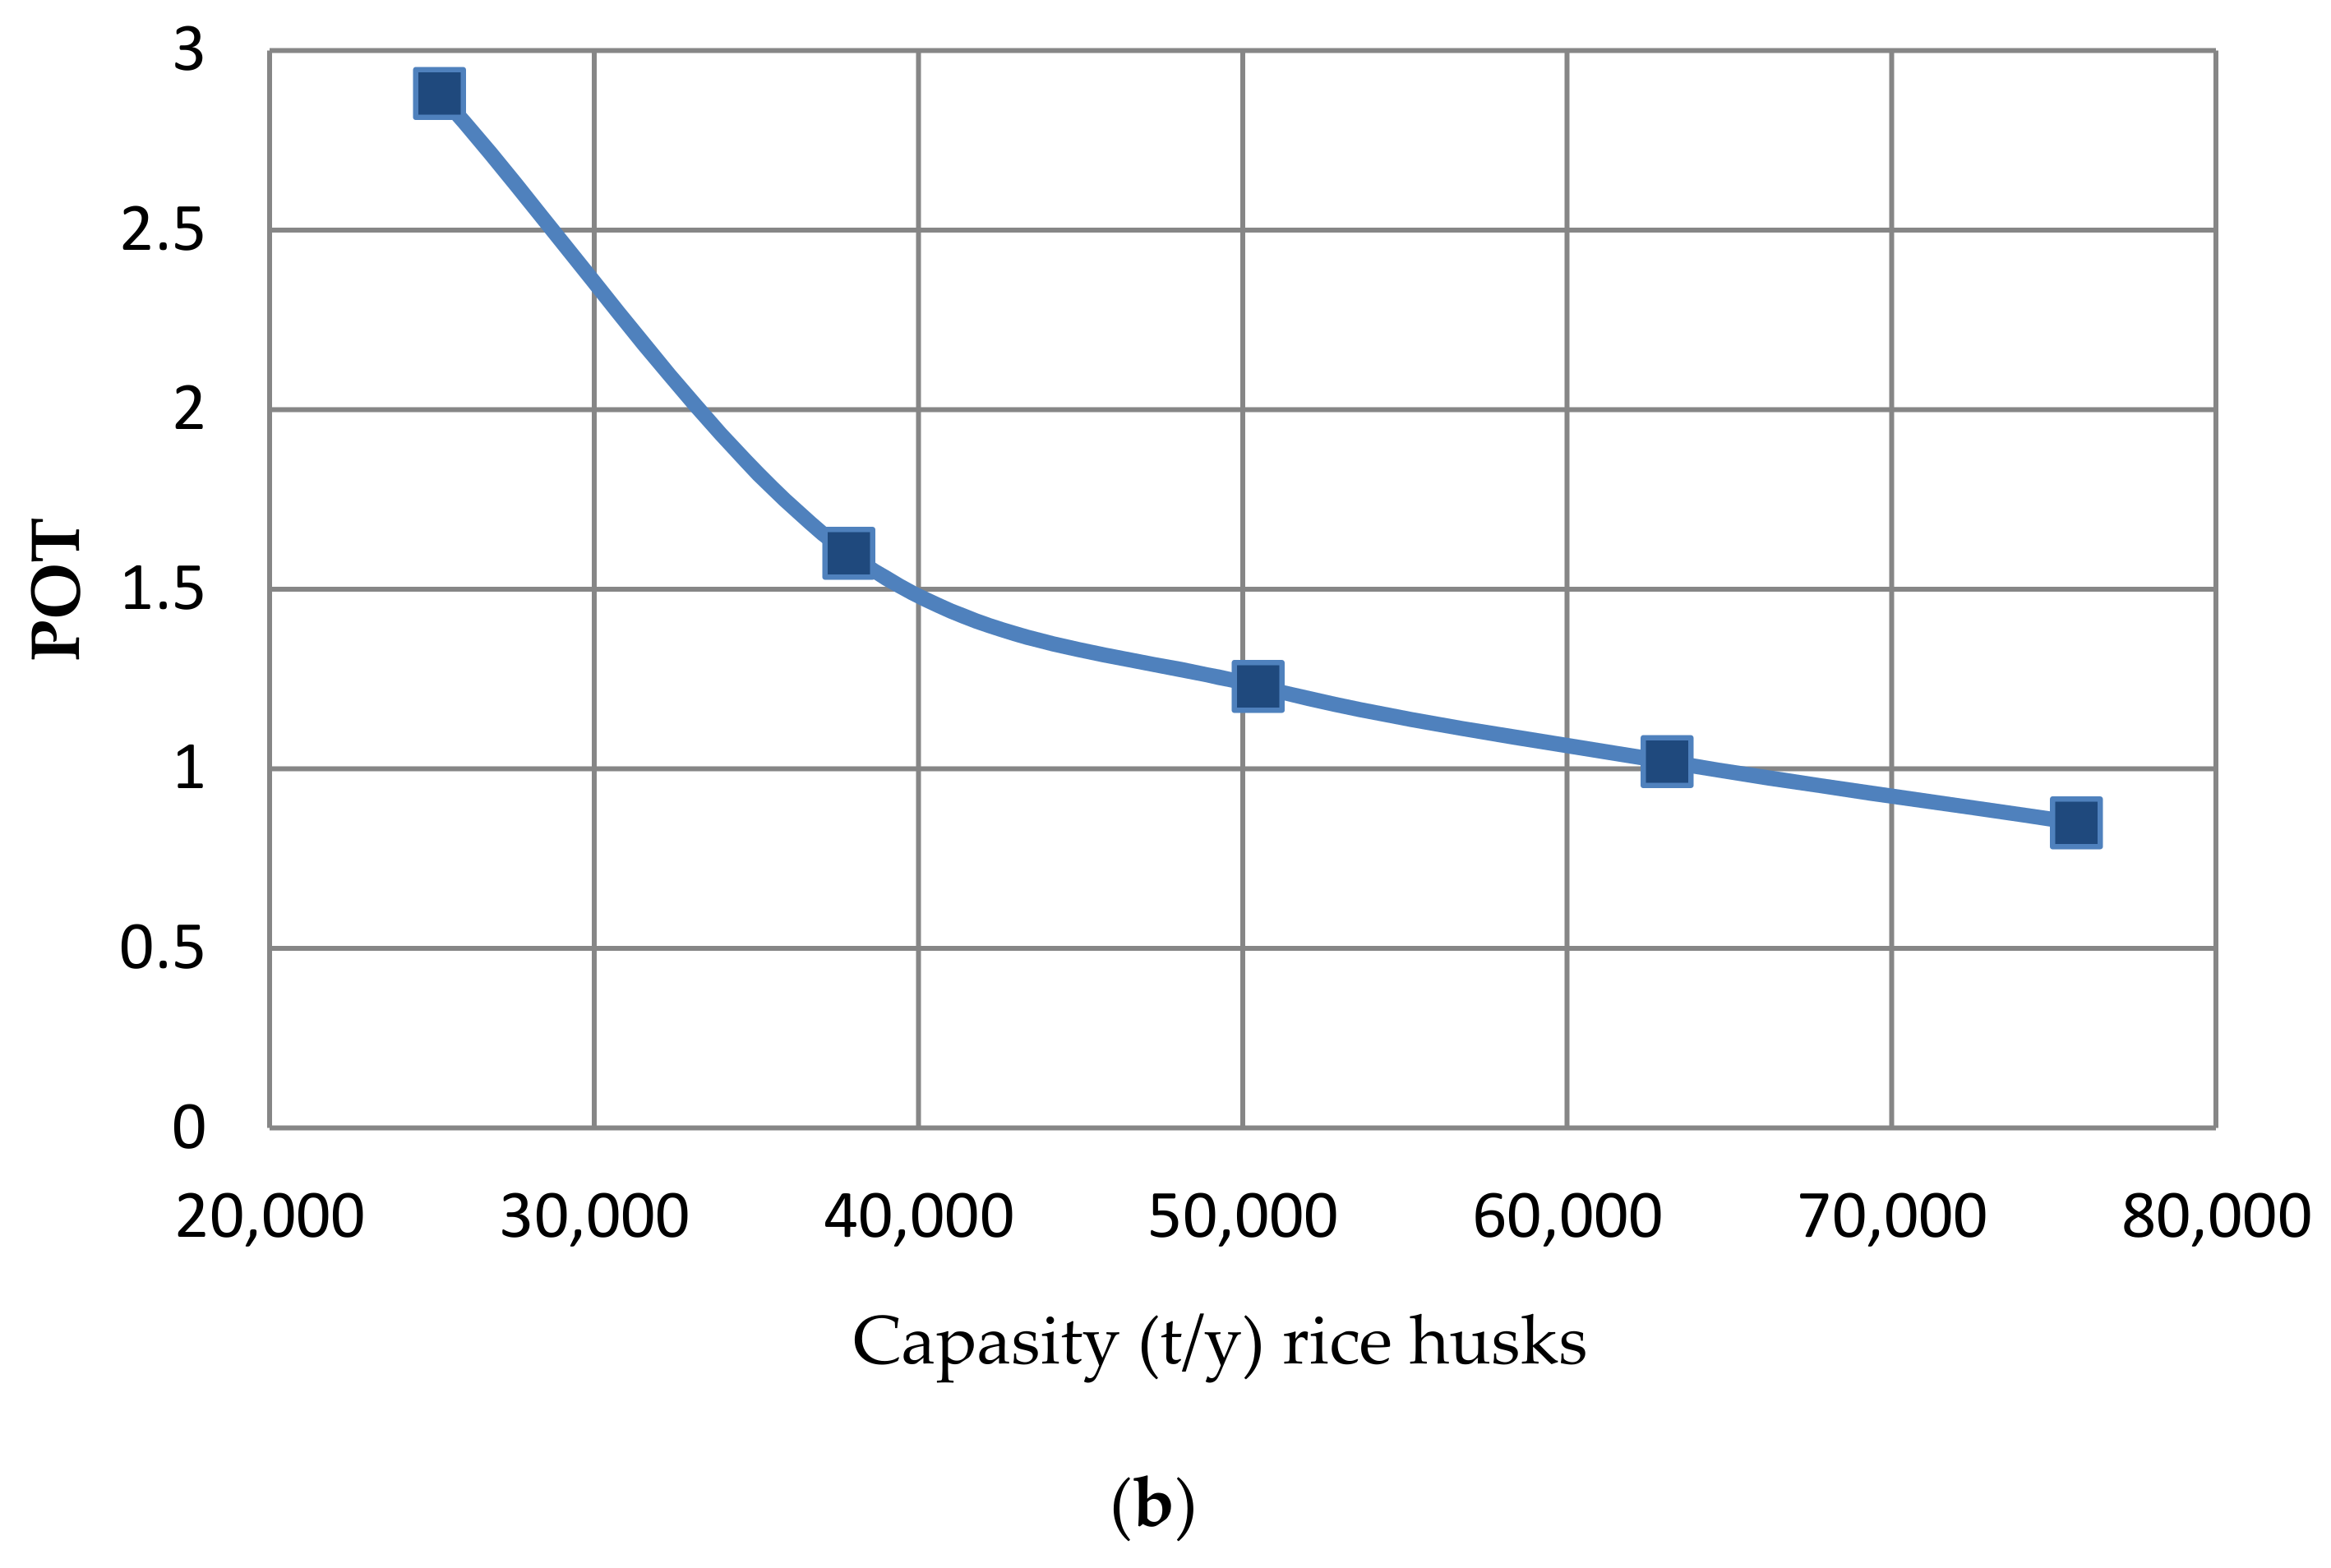
The only assumption we need to keep in mind is that the ROI must exceed 0.2 and the POT must never be lower than or exceed 3.63. For this reason, the Aspen Plus software performed a sensitivity analysis on the unit’s bandwidth (if the gasification unit operates for 7000 h/y).
Figure 7 depicts the evolution of economic indicators with the capacity.
In conclusion, the gasification system is viable at any capacity between 25,000 and 75,000 t/y. Comparing the economic simulation results of the three gasification scenarios based on different gasification agents, we found that although oxygen-steam gasification is the most favorable option for rich syngas production, the operating costs due to oxygen and high steam requirements, render the oxygen-steam gasification the less attractive economically scenario compared to the air-gasification.
8. Discussion on Environmental Issues
There are some concerns associated with RH gasification concerning the solid and gaseous by-products—mainly ash and carbon dioxide—derived from RH gasification. To overcome these challenges, we propose the following:
- ✔
RH pretreatment for ash removal.
FBG gasification technology is a known technology widely used in coal gasification. However, when agricultural residues are to be used in FBG systems, they must be pre-treated to meet the required specifications and not create operational problems because they contain large amounts of ash. The melting of the ash is a matter of great importance for the successful operation of the FBG systems, because it creates problems of agglomeration of the gasifiers, resulting in the unexpected interruption of the system and financial losses. Solving the ash problem is vital in achieving sustainable bioenergy production [
21]. In this study, a combination of a tailor-made pretreatment combining microwave heating with the traditional leaching pre-treatment technique (using water as the solvent) is suggested. With this pretreatment method rice husks-based fuels can be free from the ash constituents. This will result in the decreasing de-fluidization and preventing the operational problems of the SMARt FBG [
6].
- ✔
Alternative uses of gasification ash.
Ash can replace conventional silica sources for making lightweight construction material bricks/blocks [
22]. It is suggested that ash could be reused for environmental safety as follows:
- (1)
Ash can be used as an insulating material due to its low thermal conductivity.
- (2)
Ash can be used as an adsorbent to extract various contaminants from water and air.
- ✔
NH3 removal.
Biomass in its various forms often contains nitrogen. NO
x generated from nitrogen bound to RH can cause problems in the gasification system. In that case, it is advised that nitrogen in the form of NH
3 should be removed from the syngas to a minimum [
23].
- ✔
Catalytic tar cracking.
Rice contains ash rich in silicon dioxide, which has a melting temperature, well below the operating temperature range of gasifiers (>800 °C). Rice ash components such as Na, K, Cl, Ca, and Si interact with the bed material to form eutectic mixtures. The melting point decreases, and this creates serious bed agglomeration problems, especially when silica interacts with silica sand beds (SiO
2) usually used as catalytic material for tar cracking in the reactor [
14].
- ✔
Minimize the liquid gasification waste.
The design of an FBG unit should take care of the potential liquid waste produced in the cooling and purification of syngas unit. These are wastewater and condensate, which require treatment in situ. The condensate is known to contain acetic acid, phenol and many other oxygenated organic compounds that may or may not be soluble in water. This creates a risk for water contamination and side effects on workers’ health caused by suspended tar and soluble organic matter. In general, wastewater treatment is usually relatively simple and of low-cost chemical or biological [
23]. The most serious component is tar in wastewater. For this an effort should be made to minimize its presence through some operational alterations such as:
- ✔
To use tar cracking catalytic methods during or after the gasification process (in situ and off site);
- ✔
To use a hot syngas cleaning method.
- ✔
To use lower gasification temperatures to reduce the production of tar.
9. Conclusions
Modern agri-food industries face high energy bills and produce large quantities of residues, which could be utilized to provide added value at all levels (material, energy, environmental, economic). Gasification offers an attractive solution allowing the utilization of the waste’ energy content to produce energy and fuels to be used on-site or sold to the grid.
A rice husk fluidized bed gasification for a combined heat and power production system of 25,000 t/y capacity enables decentralized energy production from agro-industrial wastes, offering to the agro-industrial sector a circular utilization of resources, and reduction in their environmental footprint. In this study, the assumptions used to simulate the air FBG of rice husks by Aspen Plus software played an important role in the extraction of the results. We assumed that all reactors operate at a constant temperature and the pressure profile and at chemical equilibrium conditions which is not theoretically possible in real reaction conditions. However, in real conditions, the heat loss is higher than the simulated one affecting the whole process energy balance. In addition, for simplification, tar was not considered in the model.
Simulated results show good accuracy in the prediction for H2 but not for CO, CO2 and CH4 content. This indicates that the model needs modification to improve the accuracy of prediction. The results of air gasification showed a deviation from the experimental results varying from −25% to +33%. In general, the deviations in the quantities of the gas components and in the values of LHV, CGE and CCE indicators are not prohibitive. The largest deviations concern the yield of CH4 and the CGE. The limitations of our model were in assessing tar and char yields, which is a difficult task through a thermodynamic equilibrium model because tar is usually a non-equilibrium product. Since the predictions of mathematical models are substantially improved when tar formation is included, in this study, tar and carbon yields were considered as input parameters and were determined independently of the gasifier operating conditions, according to other bibliographic models. Thus, they have been placed, as inert ingredients, in the R-Gibbs reactor. At high temperatures, such as those examined, the tar content is very moderate, while the gas efficiency is very high. Another reason for the fact that simulated data do not fit very well with the experimental results might be attributed to the fact that the RGIBBS reaction is rather closed to the entrained flow gasifier and not to the fluidized bed gasifier, for which a semi-empirical model might fit better than RGIBBS reaction.
Among the three scenarios examined, the scenario of gasification with steam and oxygen gives a syngas with higher H2 content resulting in a higher LHV value. However, although, this is a more favorable result, the high thermal requirements of the steam increase the operating cost.
The Aspen Process Economic Analyzer was used for the economic assessment. The ROI and POT were very positive (0.21 and 2.8, respectively), for the case of air gasification with a capacity of 25,000 t/y.
Simulation modeling (SM) and the economic assessment of the planning phase of a gasification system had an increasingly important role in the design of and optimization of the processes and to give an idea of the economic viability of the industrial application, guiding the investors to decide. The main advantages of using SM as a customizable tool to help decision-making is that it makes it possible to analyze how the key process indicators affect the viability of a bioenergy system, without the need to spend more money and time on experimental demonstration.


