
Levelised Cost of Electricity (LCOE) of Building Integrated Photovoltaics (BIPV) in Europe, Rational Feed-In Tariffs and Subsidies


City- and Regional Planning Group, Institute of Safety, Economics and Planning (ISØP), Faculty of Science and Technology, University of Stavanger, 4021 Stavanger, Norway
*
Author to whom correspondence should be addressed.
Energies 2021, 14(9), 2531; https://0-doi-org.brum.beds.ac.uk/10.3390/en14092531
Submission received: 4 April 2021
/
Revised: 26 April 2021
/
Accepted: 27 April 2021
/
Published: 28 April 2021
(This article belongs to the Special Issue Building Integrated PV System)
Abstract
:Building integrated photovoltaics is one of the key technologies when it comes to electricity generation in buildings, districts or urban areas. However, the potential of building façades for the BIPV system, especially in urban areas, is often neglected. Façade-mounted building integrated photovoltaics could contribute to supply the energy demand of buildings in dense urban areas with economic feasibility where the availability of suitable rooftop areas is low. This paper deals with the levelised cost of electricity (LCOE) of building integrated photovoltaic systems (BIPV) in the capitals of all the European member state countries plus Norway and Switzerland and presents a metric to investigate a proper subsidy or incentive for BIPV systems. The results showed that the average LCOE of the BIPV system as a building envelope material for the entire outer skin of buildings in Europe is equal to 0.09 Euro per kWh if its role as the power generator is considered in the economic calculations. This value will be 0.15 Euro per kWh if the cost corresponding to its double function in the building is taken into the economic analysis (while the average electricity price is 0.18 Euro per kWh). The results indicate that the BIPV generation cost in most case studies has already reached grid parity. Furthermore, the analysis reveals that on average in Europe, the BIPV system does not need a feed-in tariff if the selling price to the grid is equal to the purchasing price from the grid. Various incentive plans based on the buying/selling price of electricity from/to the main grid together with LCOE of the BIPV systems is also investigated.

1. Introduction
A transition from fossil-based electricity production towards renewable-based energy production options is one of the critical metrics for reducing GHG emissions. Solar energy has recently received considerable attention as a feasible solution to facilitate and accelerate shifting toward such a goal. Solar energy could be harnessed by employing various technologies and methods [1]. Among the options, photovoltaic (PV) technology is the fastest-growing technology, leading to a sharp cost reduction and demand expansion of PV systems [2]. Therefore, it is crucial to precisely calculate solar PV electricity production cost and compare it with alternative energy sources. In this sense, the maximum power point tracking issue is also prominent [3]. PV system can be categorised and classified based on various approaches. One of them that has arisen significant attention recently is building integrated PV (BIPV) systems.
A BIPV is a photovoltaic system performing as the outer skin of a building [4]. Such a system keeps general specification of the building envelope materials, e.g., structural strength, weather and noise protection, insulation, etc. [5,6]. They can be categorised based on their type in the market, technology, connection to the grid and application [5,7]. Their application is not limited to buildings, and they can be employed by ships as an example [8]. By choosing the BIPV system for the building skins, the produced electricity by the system would be a clean energy resource to be consumed by the end-users where and when it is needed. This means less pressure on the development and expansion of the giant power transmission lines, and consequently, less transmission line lost power.
Concerning building skins, buildings play a vital role in the energy efficiency of urban areas since they are responsible for a significant percentage of the energy demand of such areas [9,10]. The remarkable radiation potential on the building skins in different climates is already explored [11]. In Europe, building energy use accounts for 41% of the total energy consumption of the cities [12]. Therefore, a transition to self-energy consumption buildings in cities is a prominent course of action toward nearly zero-energy cities. Urban energy transition (UET) has been recently come about to intensifying the endeavour towards promoting distributed generation (DG) and realign the energy production and consumption of buildings [13]. One of the leading solutions which can be of great assistance to reach such a goal is the energy prosumer notion [14]. Prosumers are consumers who can, because of their energy production capacity and by virtue of the regulatory conditions of the market and power systems, export their surpass energy to the distribution grid. BIPV is a convenient approach to proceed toward changing buildings role from energy consumers to energy prosumers.
Furthermore, the business model of building integrated photovoltaics (BIPV) is developing expeditiously. BIPV will soon be acknowledged as a building envelope material for the entire building skins, among other alternatives brick, wood, stone, metals, etc. [5,7]. In the new business model and among other things, in order to keep the uniformity of the building skin (similar to when the building skin is stone or glass), the BIPV could be employed as a building envelope material for all orientations of building skins. Therefore, the economic analysis will be carried out based on the average potential of the building skin. More explanation and logic behind this hypothesis can be found in this study [5].
Levelised cost of electricity (LCOE) is an approach to formulate and calculate the unit cost of electricity (kWh or MWh) over the economic life or full life of a project [15]. LCOE is a widely used metric among policymakers, investors, project managers, and researchers to evaluate the competitiveness and feasibility of different technologies and make decisions on whether to invest in specific renewable energy projects or not [16,17]. Furthermore, policymakers and authorities could set renewable energy policies by means of the LCOE approach. Authorities generally rely on LCOE to delineate support plans for renewable-based electricity generation technology against carbon-based electricity generation technology [18].
When it comes to the economic feasibility of BIPV or rational subsidy and incentive plans, LCOE is a great asset to evaluate the unit cost of electricity production by this technology. LCOE is used here as a metric to compare alternative sources of energy [19,20]. If the LCOE of BIPV is lower than the grid price, the project investment is concluded to be profitable and otherwise not. When the LCOE of BIPV is equal to the grid price, it is often referred to as “grid parity”, which means the energy can be generated or delivered to the grid at the same cost as it can be purchased.
The regulators and policymakers generally apply different approaches and plan to promote the BIPV technology and encourage citizens to use the technology by helping them to make the system financially viable. Some measures that the European countries have taken to facilitate the transition from consumers to prosumers by means in cities are listed here:
Net metering [21], where the prosumers get a bill based on their power generation and consumption over a period (from days to years). Hence, the prosumer offsets its electricity consumption with renewable energy resources over an entire billing period. It allows the prosumers to use its generated power at a time other than when it is produced. In fact, the prosumers are using the power grid as storage.
Feed-in tariff (FiT) [22], where prosumers are paid a fixed price for the energy they deliver to the power grid. Therefore, prosumers get paid at a rate called FiT for the surplus energy produced at home via renewable energy resources and sent on to the grid.
Export price [23], where a utility and a prosumer will have a power purchase agreement or PPA. It is usually based on a fixed price per kWh.
Network charge, where the prosumers will just pay the network charge for the power they send to the grid and give it back from the grid later. For example, it could be the same as the net metering approach except for paying a charge for using the grid as storage.
Tax exemption [24], where the prosumers will be exempted from energy taxes in the retail price of energy.
Grant Schemes [6], where governments grant a portion of the investments for the installed renewable energy resources to the owner.
When it comes to the literature review of the LCOE of BIPV systems, there is a lack of research in this regard. Several studies have investigated the LCOE of photovoltaics systems [25,26,27,28,29,30], but none of them investigated the BIPV systems. However, the economic analysis of BIPV systems and their LCOE is different from the PV systems. This is among other factors, because the BIPV system has dual functionality in the building and in addition to its application as a power generator, it also serves as a building envelope material for the building.
Two primary aims of this study are, therefore, to:
- Define, formulate, calculate, and present the LCOE of BIPV as a building envelope material for the European countries.
- Present a metric to determine the rational amount of subsidy or incentive for the BIPV system in the EU countries.
The paper is structured as follows: Section 2 deals with the input parameters of the research. The formulation of the methodology is discussed in Section 3. In Section 4, results are presented and analysed. An investigation is accomplished in Section 5 to evaluate the performance of non-optimal solutions. Finally, the conclusions are drawn in Section 6.
2. Input Parameters
The input parameters and formulation are discussed in this section. The required parameters to calculate LCOE of a BIPV system together with their values are listed here. More explanation of the parameters can be found on [5,6].
- Operation and maintenance (O&M) cost: 0.5% of the initial investment in Europe.
- Inverter replacement cost: 10% of the initial investment, to be replaced every 15 years.
- BIPV degradation rate: 0.5%.
- BIPV Lifetime: 30 years.
- Building envelope material cost: 230 Euro per sq.m. for the façade and 130 Euro per sq.m. for the roof.
- Transmission line lost power: see Table 1.
- Power delivery cost: 20% of the grid electricity tariff.
- Societal cost of carbon (SCC): 50 Euro per ton with a growth rate of 4%.
- GHG emission: Table 1, with a mitigation rate of 2.1%.
- Electricity tariff: Table 1, with a growth rate of 2%.
- Discount rate: 3%.
- BIPV efficiency: 16%.
- BIPV initial investment: 450 Euro per sq.m. for facades and 350 Euro per sq.m. for roofs.
Table 1 presents the value of some of these parameters in 2020.
3. Formulation
In this section, NPVI, NPVC and EG, which are BIPV net present value of incomes, BIPV net present value of costs, and BIPV total electricity production, are discussed and formulated.
3.1. System Income
The income and benefits of the system are, saving in building envelope material cost, transmission line lost power, power delivery cost, societal cost of carbon and power generation. The NPVI can, therefore, be calculated as Equation (1):
IBM, ITR, IPD, ISCC, IEG represent the income from saving in building envelope material cost, transmission line lost power, power delivery cost, societal cost of carbon and power generation, respectively. The quantified value of the saving from transmission line lost power can be calculated as presented in Equation (2):
EG, RTR, NP, DR, n and y represent annual energy generation, the ratio of transmission line lost power, power grid price, discount rate, the number of the year and BIPV lifespan, respectively. The quantified value of the system due to the saving in the power delivery cost is calculatable as follows in Equation (3):
RPD stands for the saving ratio in power delivery cost. The saving from carbon taxing is also presented in Equation (4):
RGHG and CP stand for the average GHG emission and societal cost of carbon, respectively. The income from system electricity generation is formulated, as shown in Equation (5):
The values of NP, CP, EG, and RGHG associated with the nth year of the BIPV system is calculatable as presented in Equations (6)–(9):
RNP, RCP, REG and RGH are abbreviations for electricity tariff growth ratio, societal cost of carbon growth ratio, BIPV degradation ratio and GHG mitigation ratio, respectively.
Finally, the NPV of the incomes can be determined as shown in Equation (10):
3.2. System Cost
The cost of the system is the investment, operation and maintenance and inverter replacement cost. Therefore, NPVC can be formulated as Equation (11):
CQ, CIR and COM stand for BIPV initial investment, inverter replacement cost, and operation and maintenance cost, respectively. The inverter replacement cost can be easily calculated, as presented in Equation (12):
The NPV of the operation and maintenance cost can be calculated as follows in Equation (13).
Therefore, the NPV of the costs can be determined as shown Equation (14):
3.3. System Energy Production
The electricity production of BIPV systems naturally degrades over time, and the decrease ratio is called the BIPV degradation rate. Depending on the material, the BIPV degradation rate varies [34]. The total electricity production of the system over its lifespan can be calculated as indicated in Equation (15):
where EG1 can be calculated as follows:
3.4. LCOE Formulation
LCOE, as mentioned in the introduction, is a term that stands for the cost of the power per kWh produced by the BIPV systems over the lifetime of the system, which is 30 years in this study. It can be calculated by Equation (17):
NPVC, NPVI, and EGT represent net present value of the costs of the system over its lifetime, net present value of the incomes of the system over its lifetime and total electricity generation over its lifetime, respectively.
4. Results
The analysis was carried out using Microsoft Excel, and the dataset is publicly available and attached to this paper as a supplementary file. The starting date for the system evaluation is the beginning of 2020.
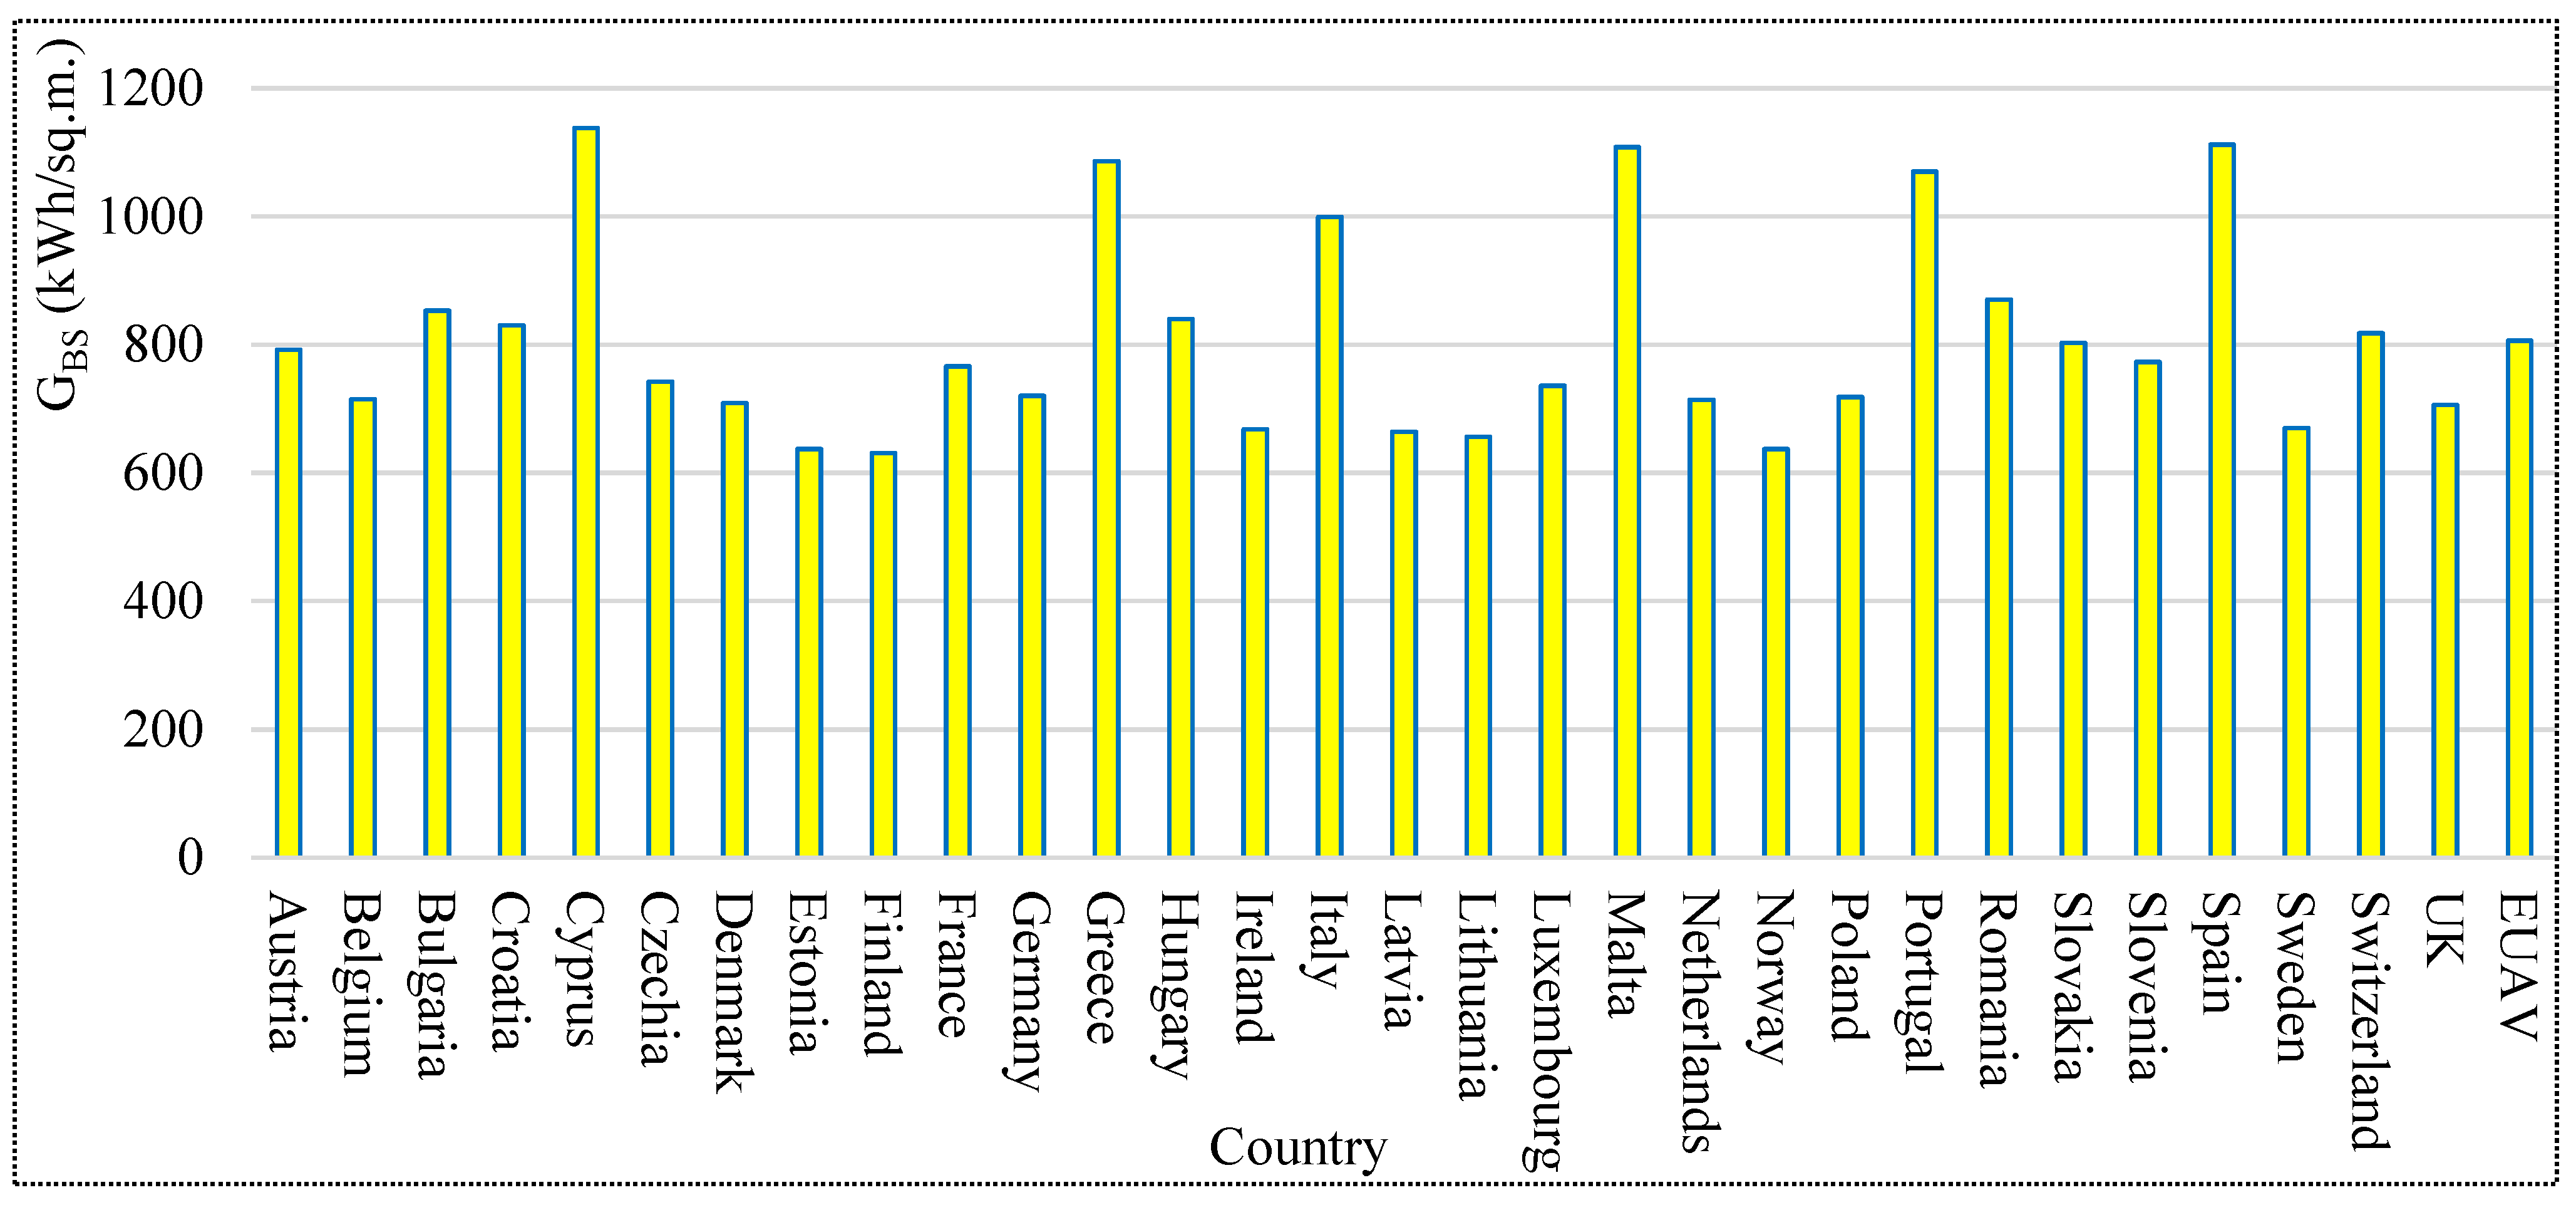
Figure 1 indicates the average incident solar radiation on the building skins (GBS) of the capital of the countries. BS stands for building skin and is the average value of building orientations (south, north, east, west and roof) for the discussed parameter. In other words, BS is a metric to evaluate the feasibility and suitability of BIPV systems as a building envelope material for the entire building skins in Europe. When it comes to appropriate feed-in tariff or subsidy for the BIPV system in Europe, the economic analysis of the entire building skin as an average of skin orientations is a useful tool to design and introduce rational incentives. The annual radiation on building skins varies from 631 kWh per sq.m. in Finland to 1138 kWh per sq.m. in Cyprus, with an average of 806 for the EU.
The primary raw data is taken from the Photovoltaic Geographical Information System (PVGIS) database [35]. The analysis and calculated amounts are based on the average hourly incident radiation data between 2005 and 2016 from the PVGIS (SARAH Solar Radiation Data) [35]. The secondary data is based on the analysis as explained.
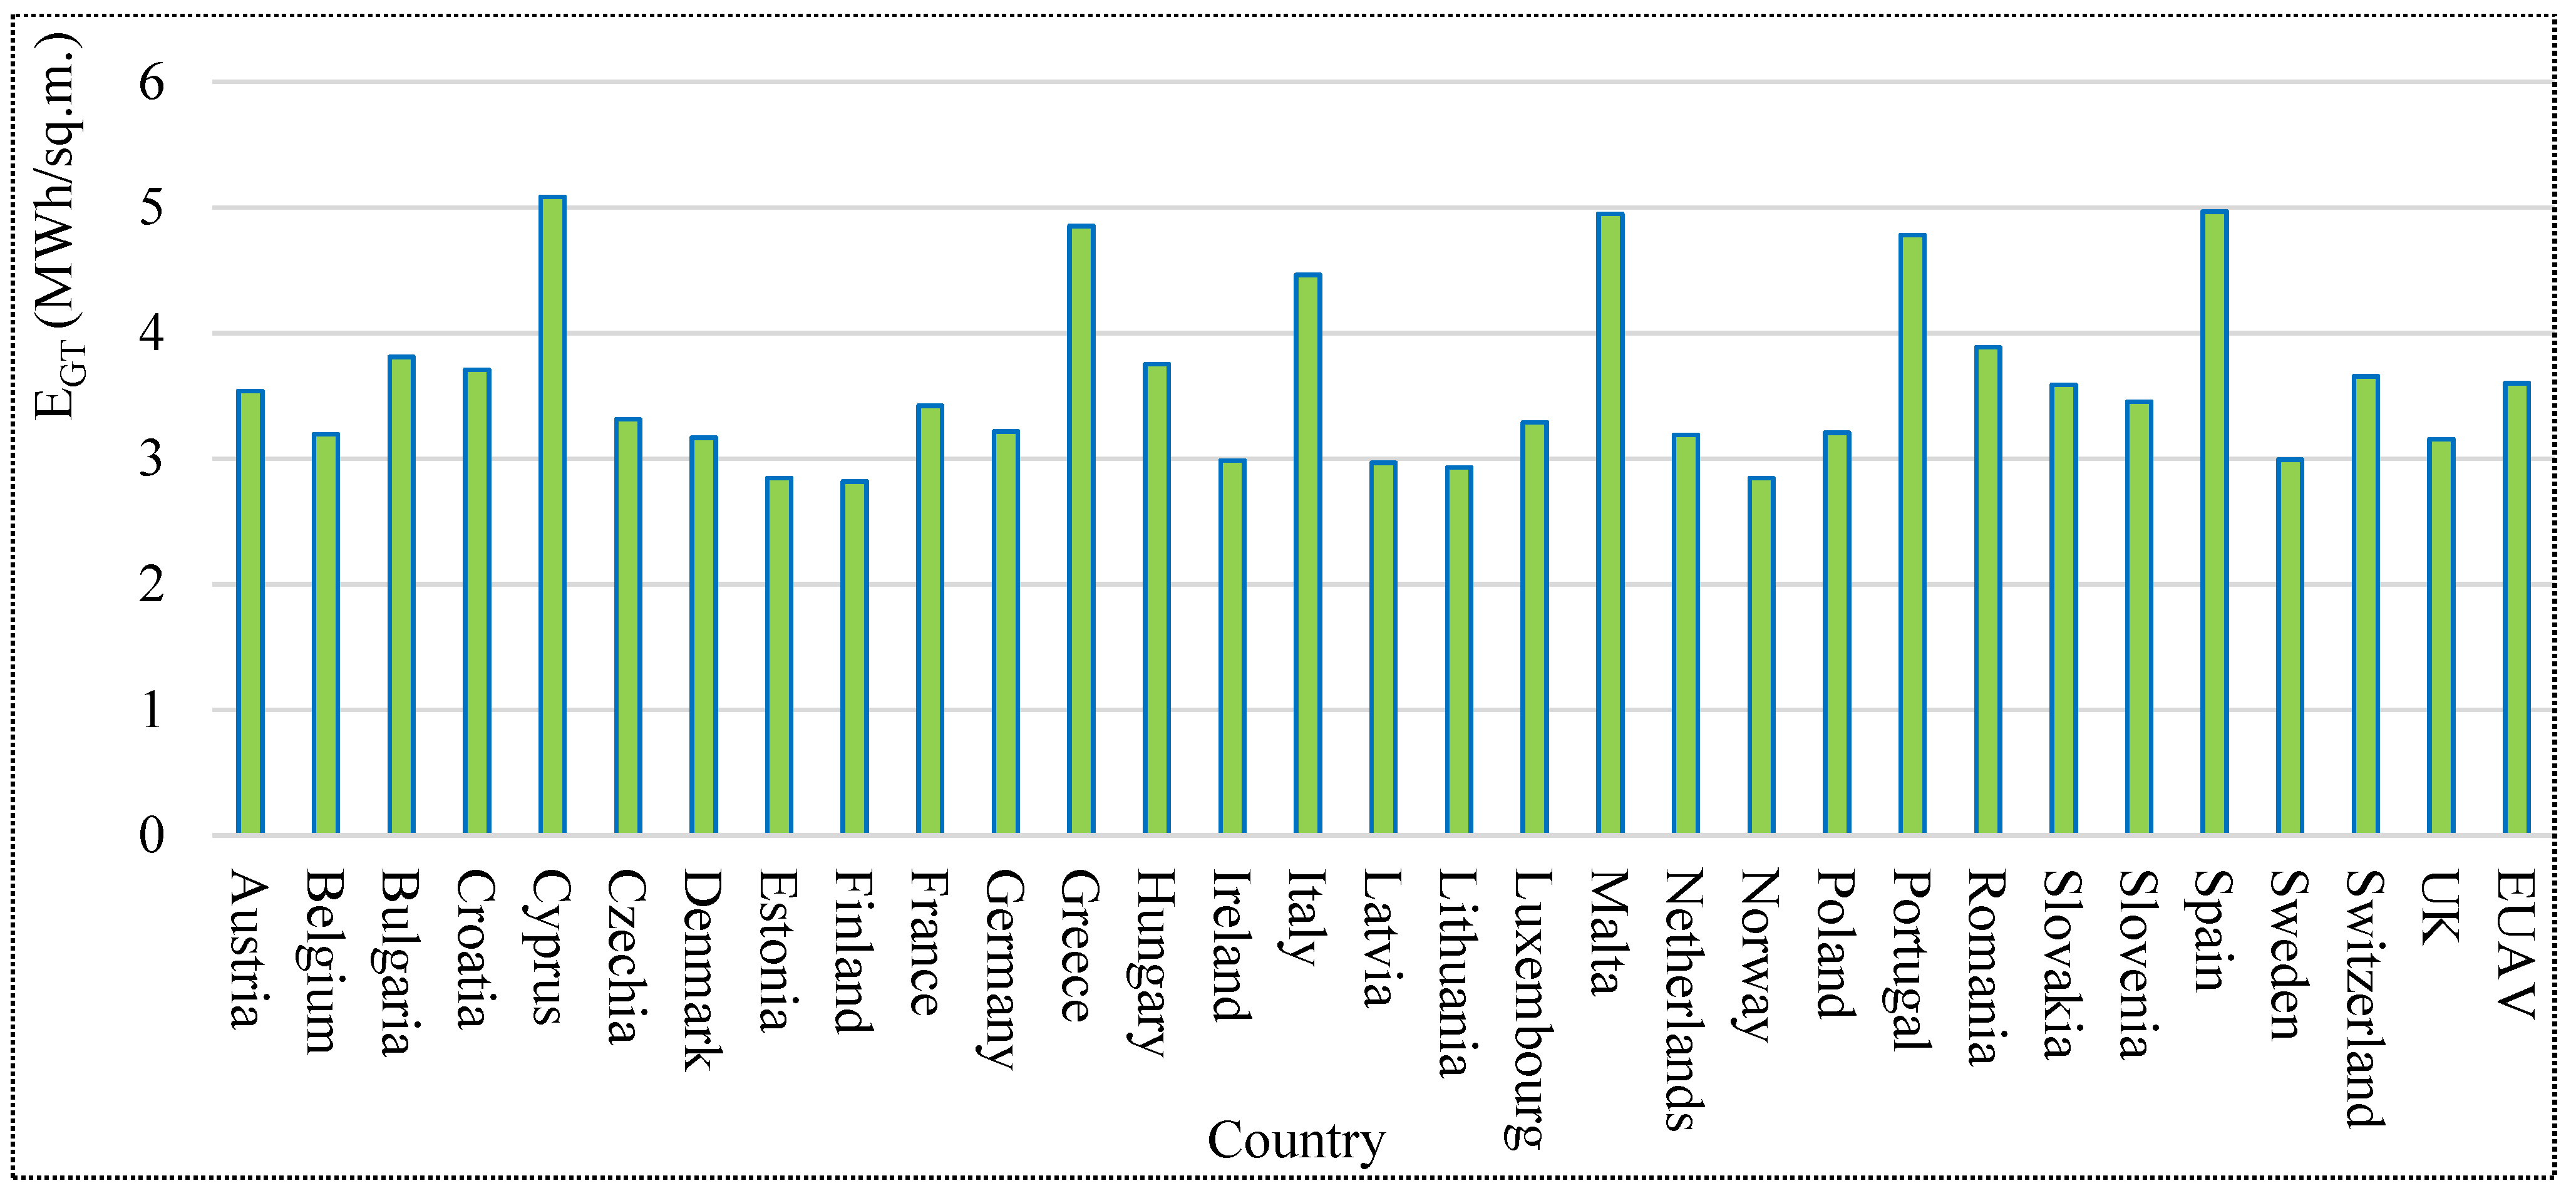
Figure 2 depicts the lifetime electricity production of the BIPV system (EGT) as a building envelope material for the skins of the buildings in the EU countries. The total production is between 2819 kWh per sq.m. (in Finland) and 5084 kWh per sq.m. (in Cyprus). The average production for the EU is 3601 kWh per sq.m.
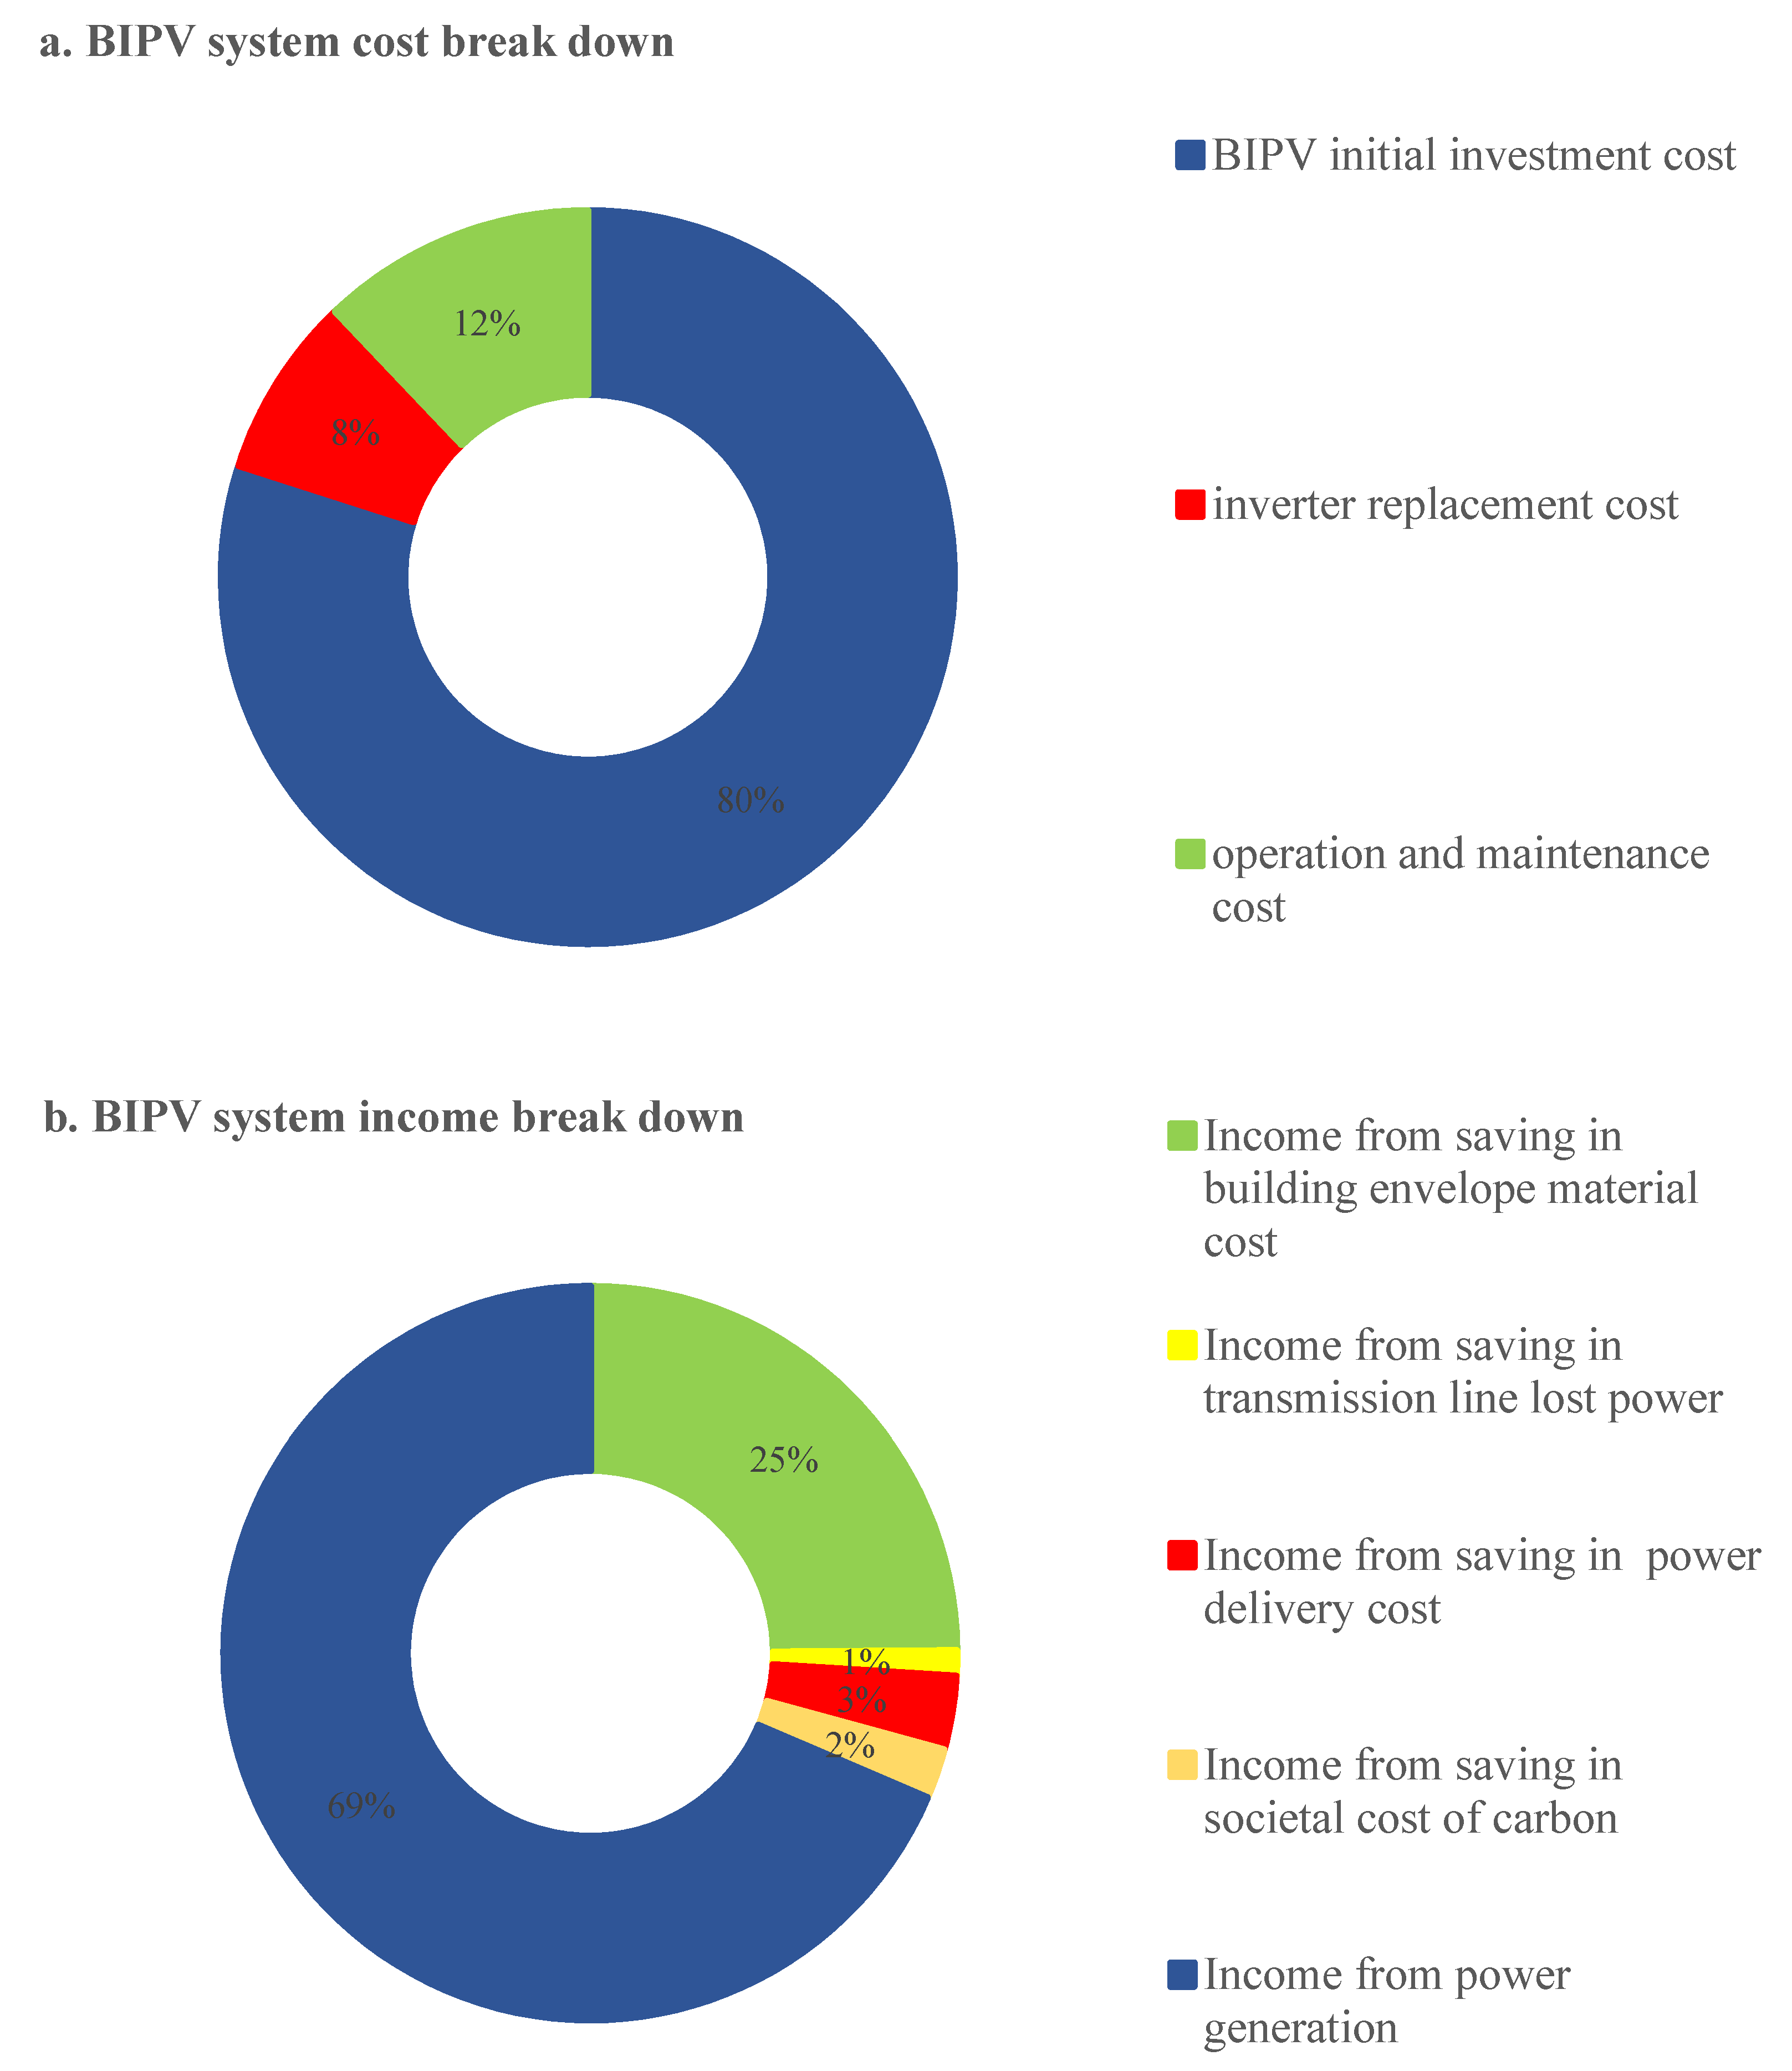
Table 2 illustrates the results of the analysis for the LCOE calculation. The analysis is carried out for the BIPV system as a building envelope material for the entire building skins. As can be seen from Table 2, in average in Europe, from each square meter of BIPV system as a building envelope material, 578 € income will be earned out of 3601 kWh electricity production of the system while the total cost is equal to 535 €.
Figure 3 illustrates the breakdown of the average income and the average cost for BIPV systems in the EU.
The LCOE analysis and allocated subsidy can be calculated and defined based on different points of views and approaches. They are discussed here in detail based on different scenarios.
4.1. Scenario 1
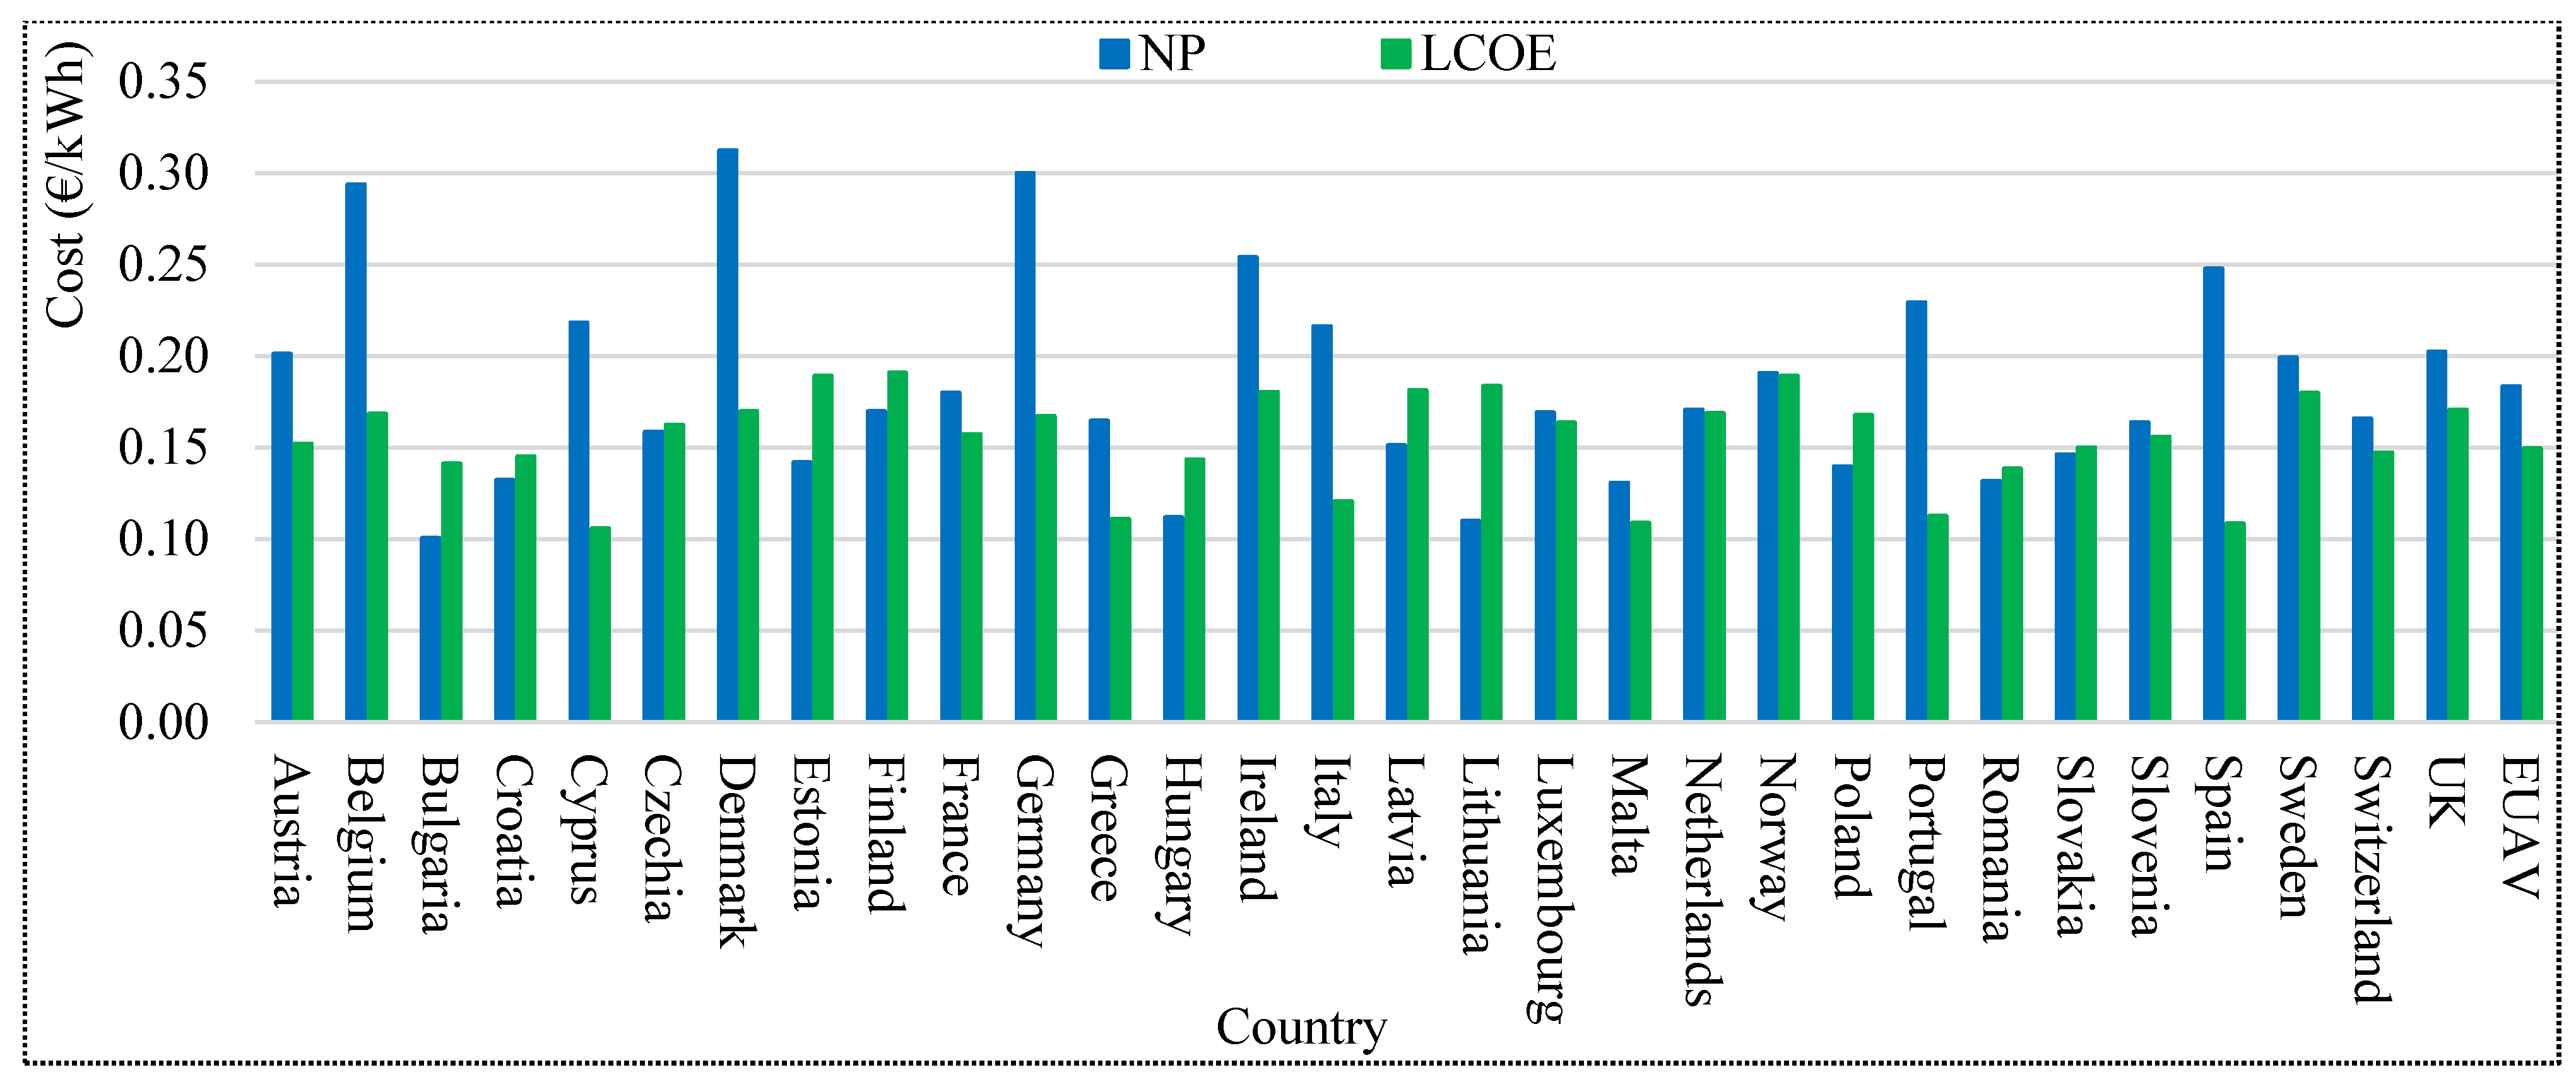
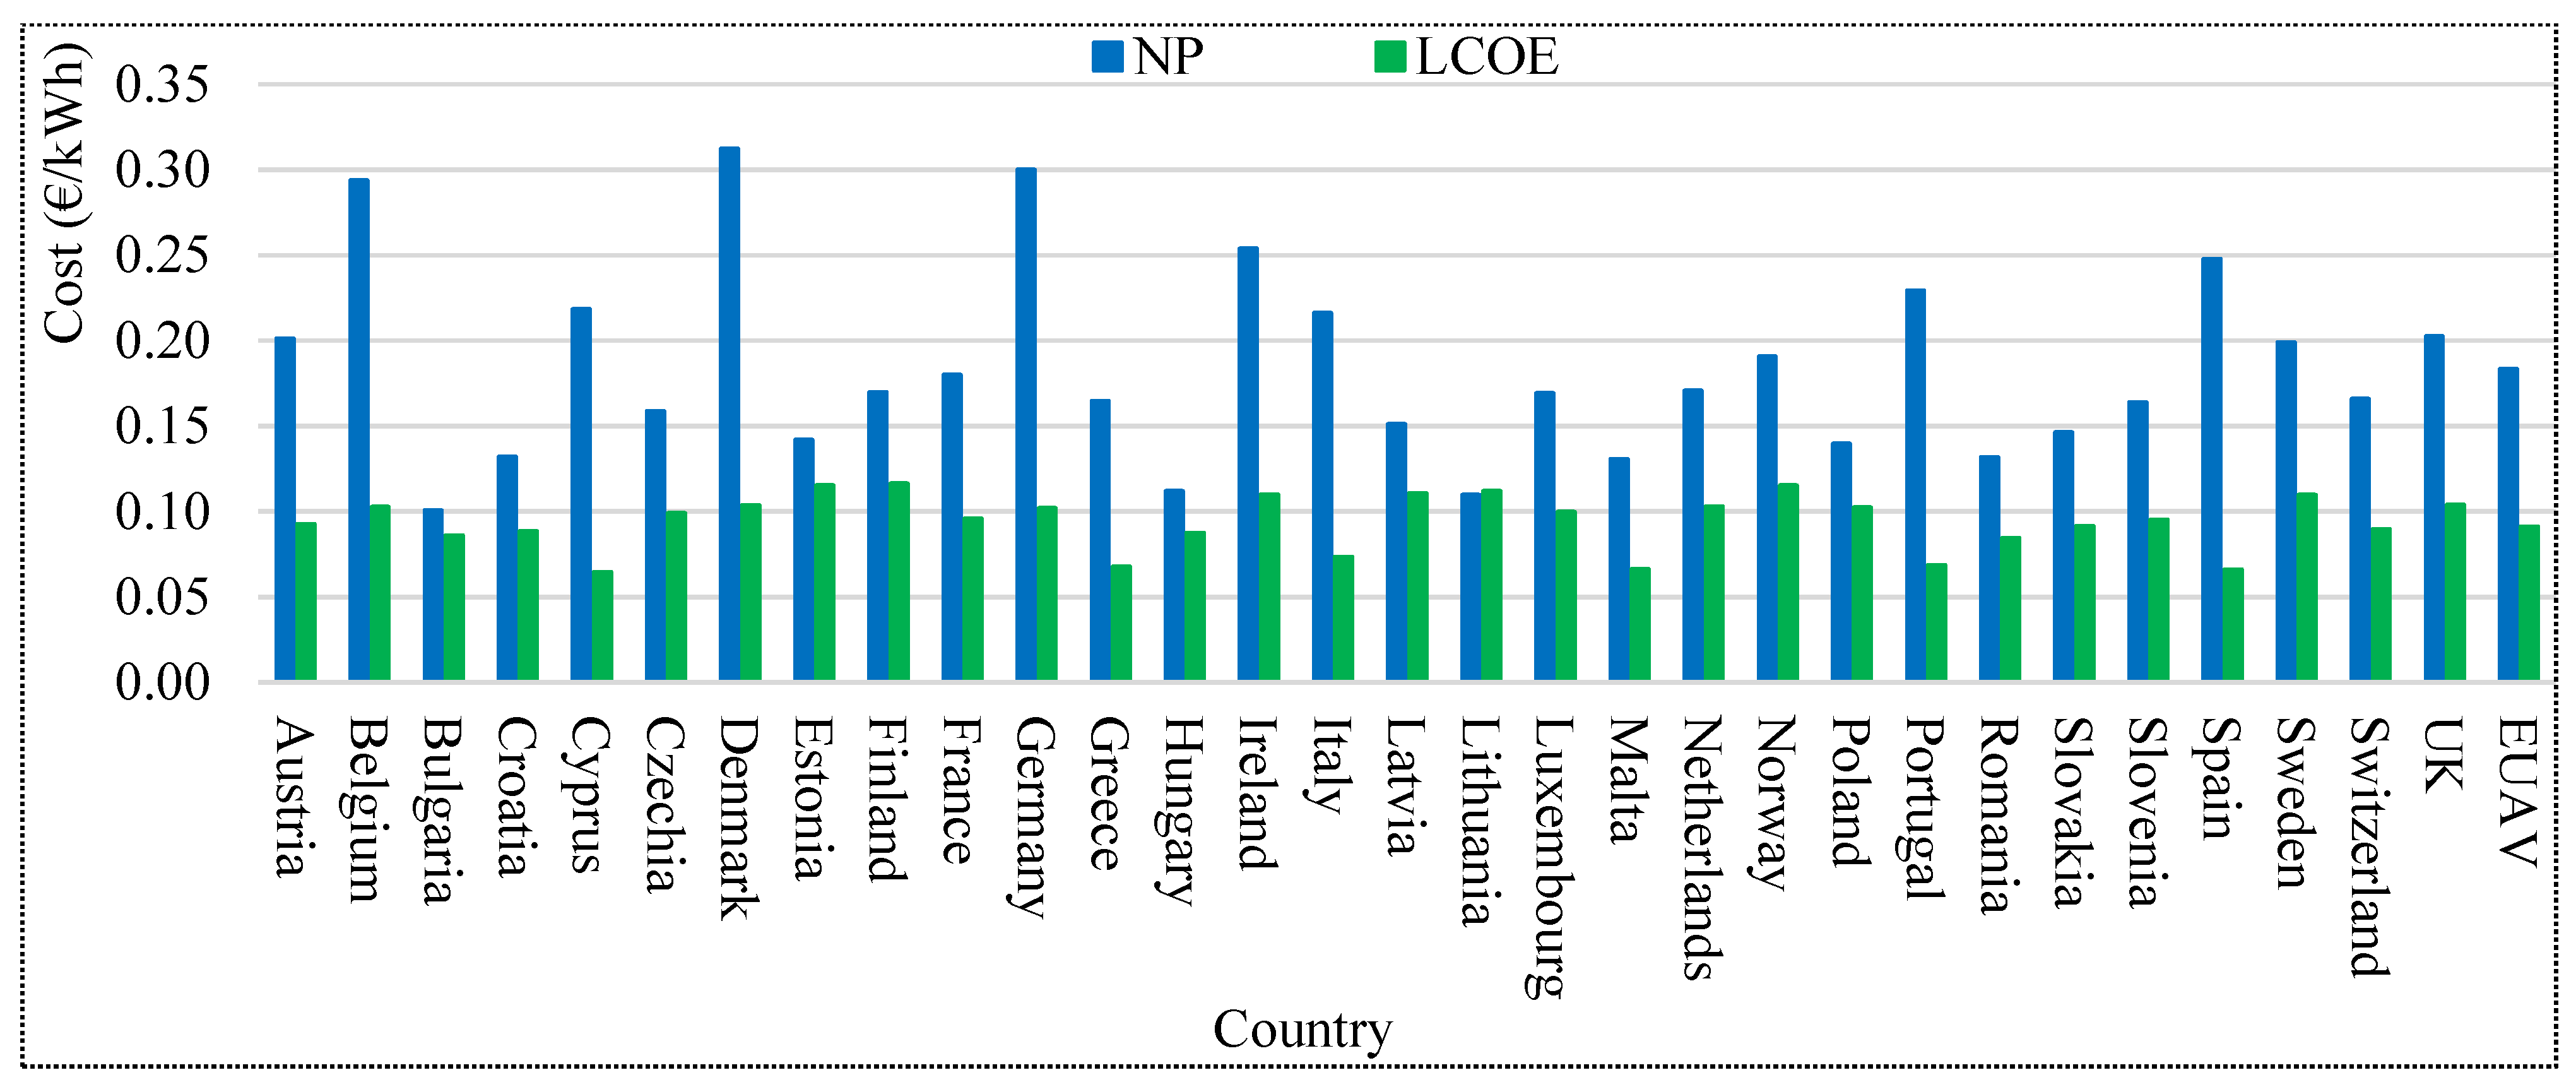
This scenario discusses the traditional approach of analysis, where the investment is the net present value of the total cost (NPVC). Figure 4 illustrates the electricity price of the grid and LCOE of BIPV as a building envelope material for the entire building.
As can be seen from the Figure 4, the LCOE in Bulgaria, Croatia, Czechia, Estonia, Finland, Hungary, Latvia, Lithuania, Netherlands, Norway, Poland, Romania and Slovakia is more than the network price in this scenario and in order to make the BIPV system economically feasible, a FiT rate is required (generally equal to the difference of NP and LCOE plus NP, in order to reach the grid parity). Furthermore, the analysis unfolds that on average in Europe, the BIPV system does not need a feed-in tariff if the selling price to the grid is equal to the purchasing price from the grid. This is investigated more later in this section.
4.2. Scenario 2
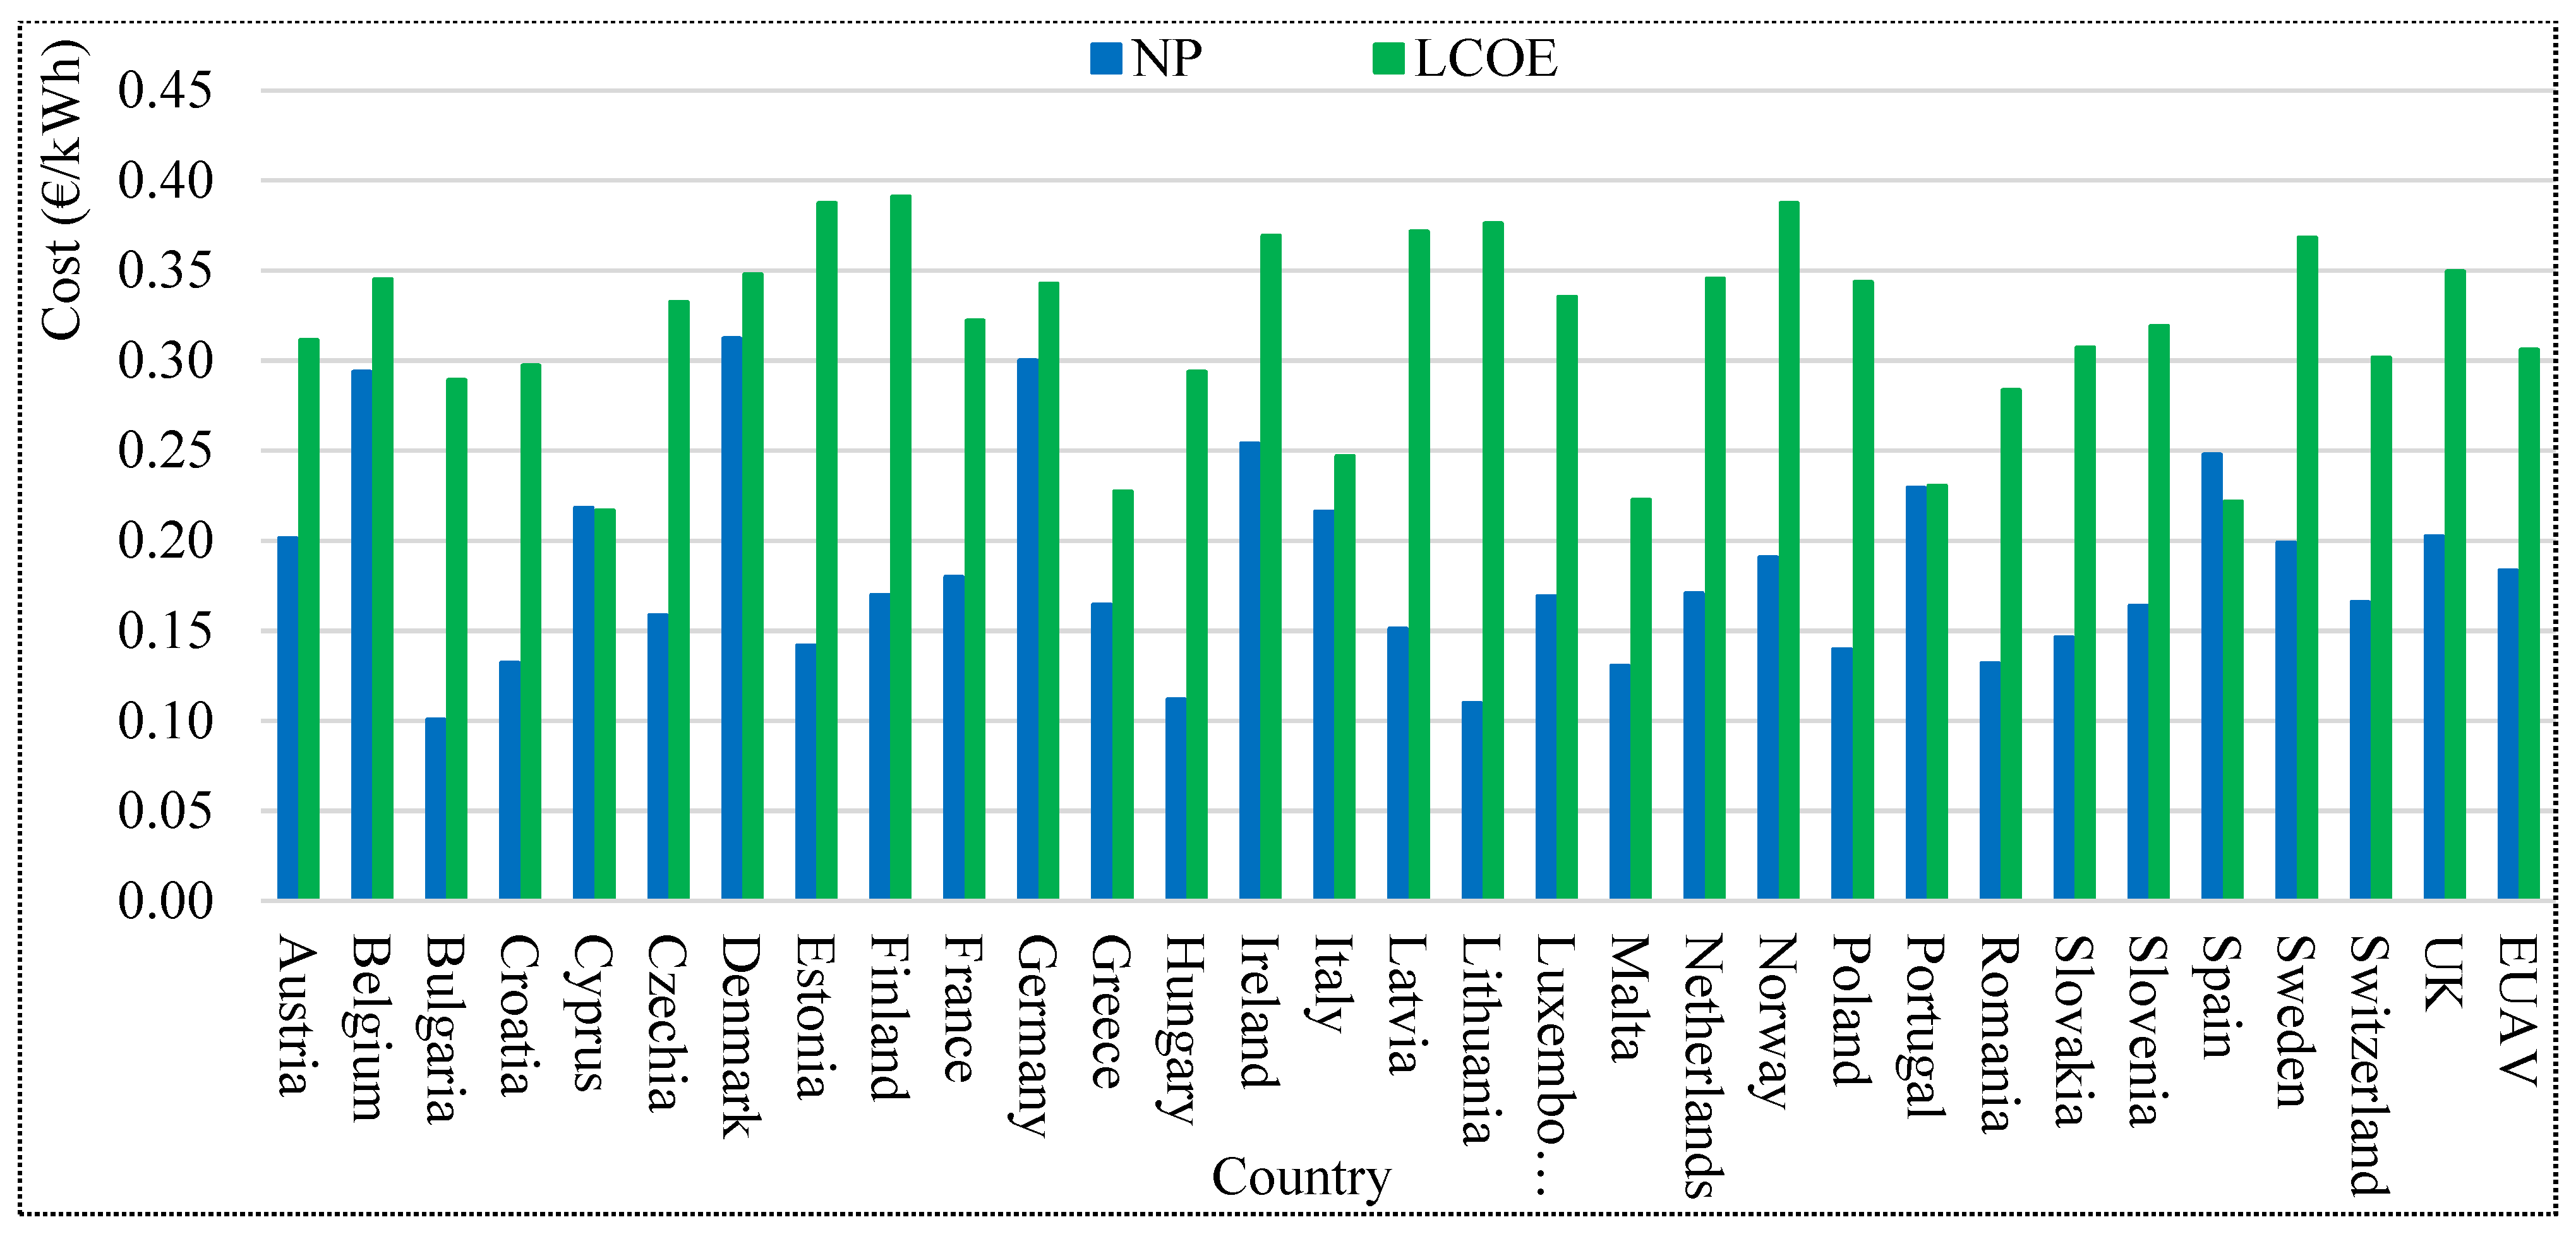
The scenario deals with the LCOE related to the total cost of the system associated with the BIPV system functionality as a power generator and not as a building envelope material. In other words, the hypothesis in this scenario is that the BIPV system is a substitute for other building skins materials and the cost associated to this application should not be taken into consideration when it comes to economic feasibility (because such an approach is irrational for alternative building envelope materials such as stone, wood, glass etc.). Therefore, the cost of the BIPV system must split between its applications on the building skins (as the building skin and the power generator). That fraction of the investment, which is related to the role of BIPV systems as a power generator, has been taken into consideration in the LCOE analysis of this scenario. Figure 5 represents the LCOE of this scenario in comparison with the grid price.
The result indicates that LCOE of BIPV system as a building envelope material for the entire outer skin of the buildings in all the locations is always less than the grid price if the investment related to the power generation task is taken into the analysis. The average LCOE for the EU (0.09 (€/kWh)) in this scenario is half of the average grid price in EU (0.18 (€/kWh)).
Although BIPV technology has reached the grid parity in almost all of the investigated countries, what is critical is the question that whether the local grid is willing to buy the electricity at the same price that sells it to the end-user or not. The answer to this question has a remarkable effect on the proper designing of subsidy for this technology. Answering such a question results in three different situations:
- If the grid is obliged to buy the surplus generated electricity of the BIPV from end-user at the same price that sells it to the end-user, then the technology is already mature in EU as figure shows and there is no need for additional incentive.
- If the buying price of the grid is less than its selling price but still more than the calculated LCOE, then the system is still profitable, and no subsidy is needed to make the system economically viable.
- If the buying price of the grid is even less than the calculated LCOE, then the end-user needs to either consume all the generated power of the BIPV system or receive an appropriate subsidy (normally equal to the difference between LCOE and buying price of the grid) in order to make the investment profitable.
The amount of rational subsidy, therefore, depends on the network price, LCOE and the price that the grid buy the surplus electricity generated by the BIPV system. Another approach to grant incentives to the BIPV technology is to reimburse the quantified environmental benefits of the system to the owner, which in this study are transmission line lost power, power delivery cost and societal cost of carbon (SCC). This can be allocated either in a FiT plan or a support package during the system implementation.
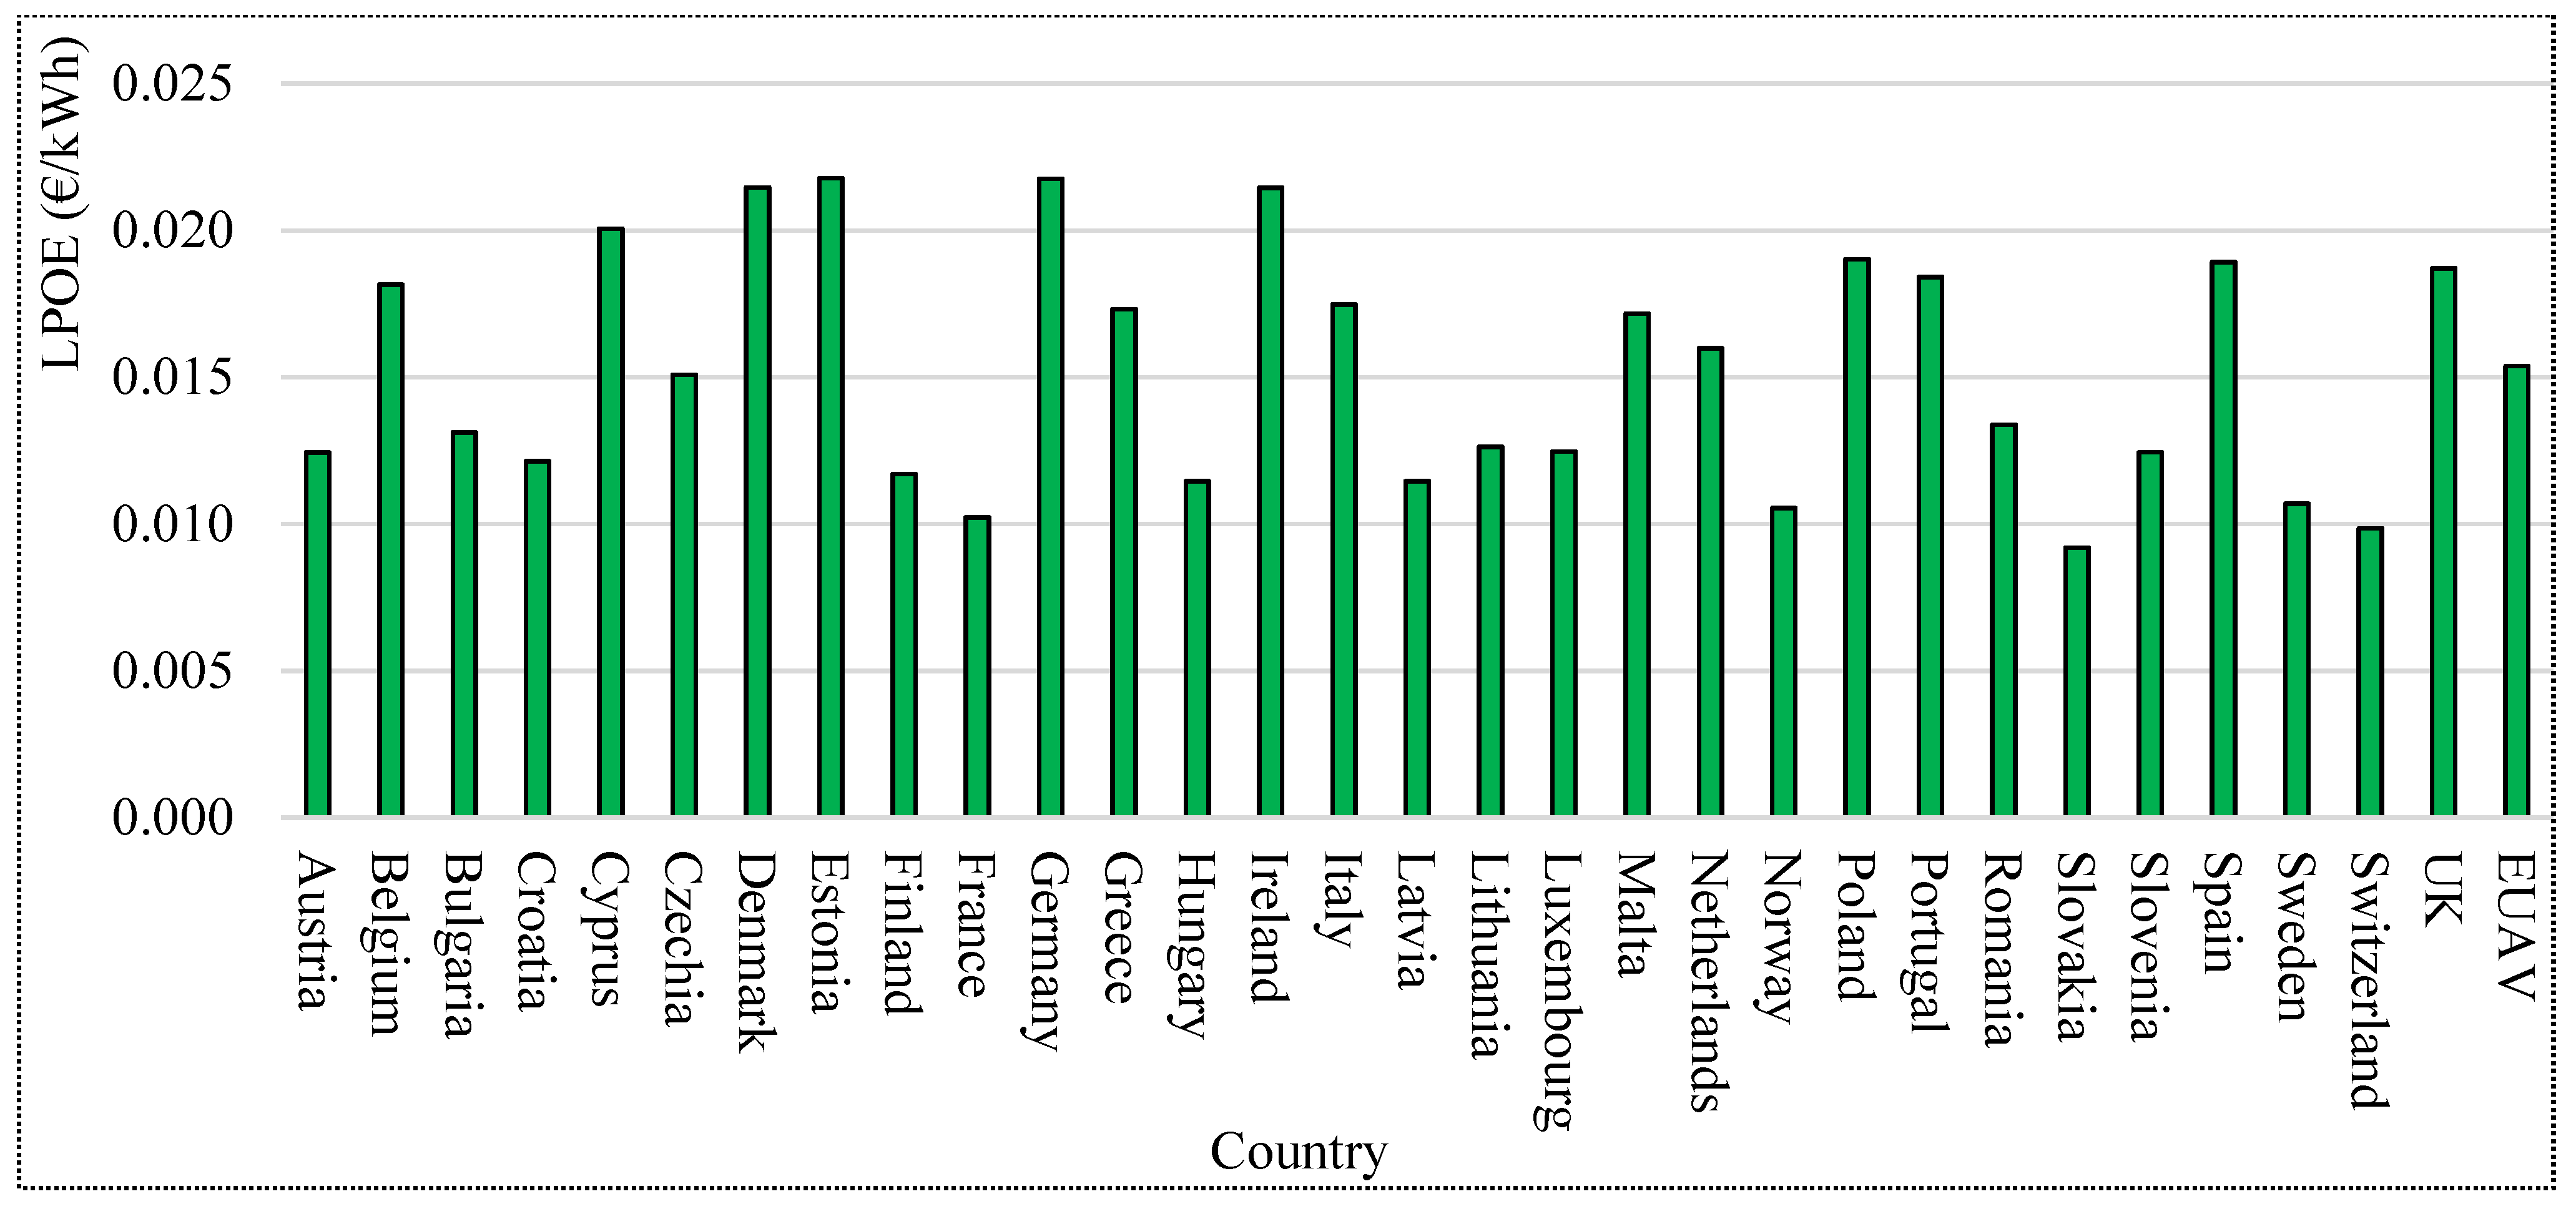
The levelised profit of environmental benefits (LPOE) of the BIPV system can be calculated as follows:
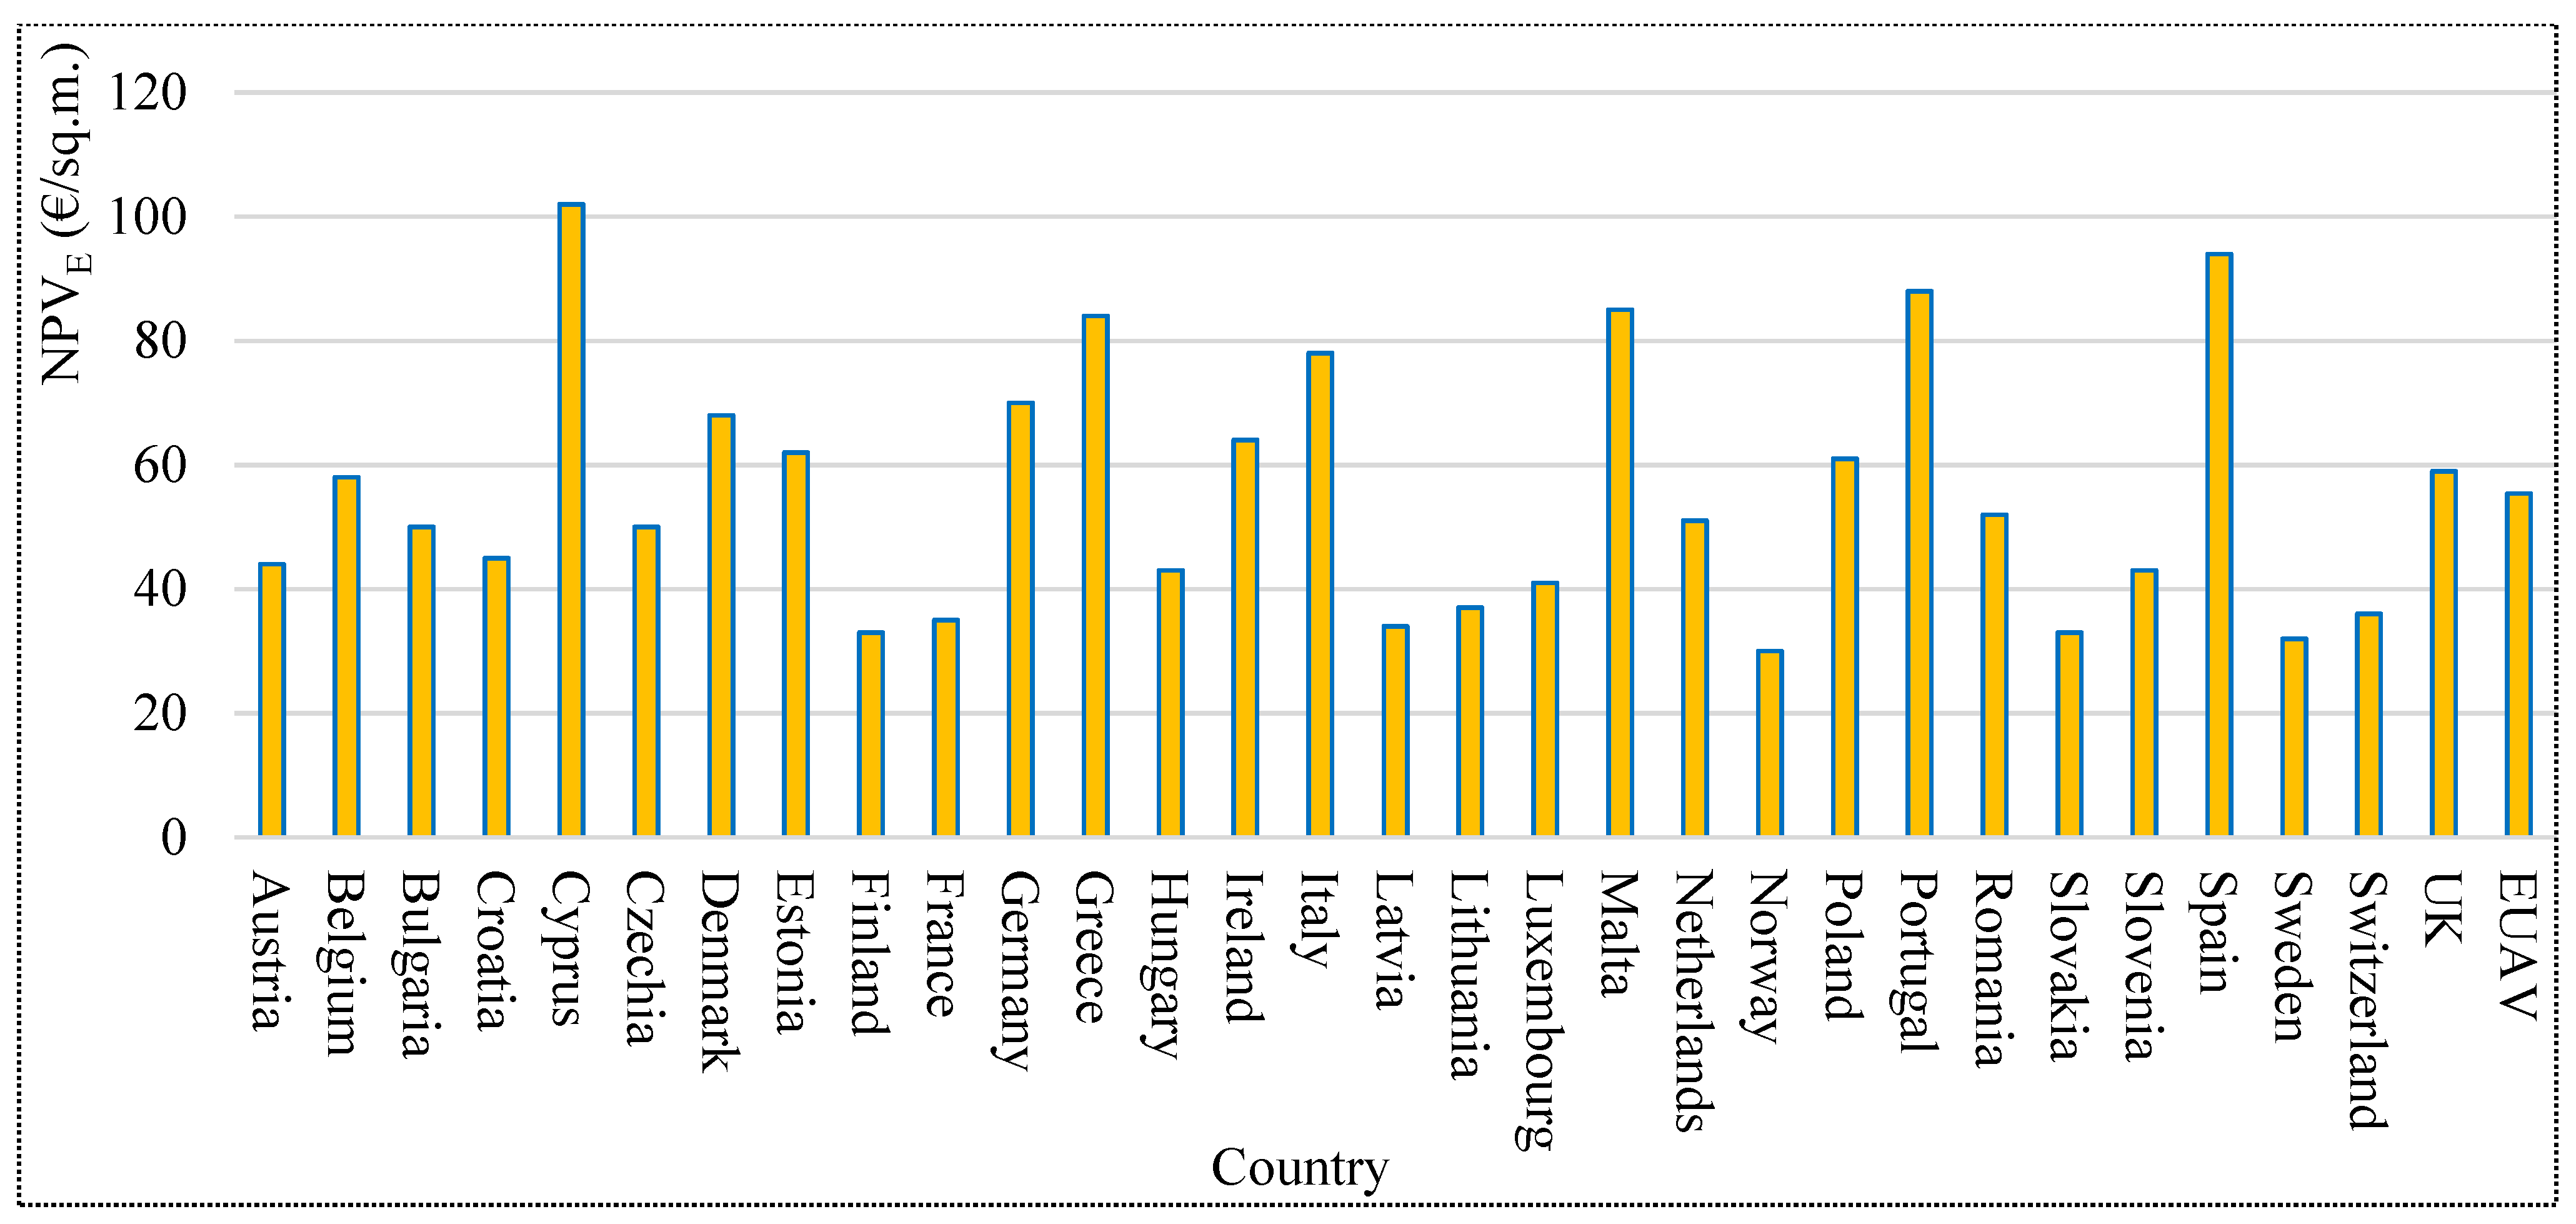
Figure 6 and Figure 7 illustrate the LPOE and NPVE for the investigated sites. As can be seen from the figures, LPOE in the EU varies from 0.09 € per kWh in Slovakia to 0.022 € per kWh in Germany and Estonia. The average value for the EU is 0.015 € per kWh.
When it comes to NPVE in the EU, Norway with a net present value of 30 € per sq.m. has the lowest amount, which is basically because of its low GHG emission in power production (thanks to hydropower production potential) and a quite low lost rate in the power transmission lines. The highest amount belongs to Cyprus because of its relatively high electricity price and GHG emission of its power plants.
5. Performance of Non-Optimal Solutions
Some studies from the literature claim a low performance or low efficiency of BIPV systems [36,37]. The lifetime of inverters is also controversial. Although new models in the market offer a warranted lifetime of 15 years, there are still many models in the market with a warranted lifetime of only ten years. Therefore, this section has investigated a scenario for a BIPV system with an efficiency of 10%, a lifetime of 25 years and an inverter replacement requirement for every ten years. The result is depicted in Figure 8, where it can be seen that the non-optimal performance of the BIPV system can significantly change the LCOE analysis and increase it meaningfully. In this case, the average LCOE of BIPV in Europe has been doubled (from 0.15 €/kWh to 0.3 €/kWh). This shows the importance of system design, system component selection and system implementation.
6. Conclusions
The findings from this study make several contributions to the current literature on BIPV technology. First, the study is set out to present a method, calculate and report the LCOE of BIPV systems for the EU countries and, more specifically, the LCOE for the BIPV system as a building envelope material for the outer skin of buildings. Second, the study presents a metric to the EU countries to investigate the current situation of the BIPV and determine whether the technology needs any incentive and subsidy or not by employing the discussed approach in this study.
The investigation revealed that the implementation of BIPV systems as a building envelope material has already passed the grid parity in 29 out of 30 EU countries if the corresponding cost to its role as a power generator is considered in the economic analysis. The only country in which BIPV needs support schemes to reach grid parity is Lithuania.
Moreover, the results showed BIPV systems have passed grid parity in most countries in the EU even when taking the total cost of the BIPV system as the investment into the calculation. In this case, Bulgaria, Croatia, Czechia, Estonia, Finland, Hungary, Latvia, Lithuania, Netherlands, Norway, Poland, Romania and Slovakia need support schemes to help the technology reach grid parity.
The study also illustrated that a non-optimal design of BIPV systems could double the LCOE, which highlights the importance of system design, system component selection, and system implementation.
Although the current study is based on average values and assumptions, the finding presents the underlying part and foundation of further studies regarding the LCOE of BIPV in the EU and the reasonable amount of subsidies or incentives for this technology to drive a faster rollout of BIPV in the EU.
Further work needs to be done to investigate and assess the impact of urban areas (shading, reflection, etc.) and the effect of climate on the system efficiency considering different technologies on the presented analysis.
Supplementary Materials
The following are available online at https://0-www-mdpi-com.brum.beds.ac.uk/article/10.3390/en14092531/s1.
Author Contributions
Conceptualization, H.G.; Data curation, H.G.; Formal analysis, H.G.; Funding acquisition, H.G. and H.N.R.; Investigation, H.G.; Methodology, H.G.; Project administration, H.G.; Resources, H.G.; Software, H.G.; Supervision, H.N.R.; Validation, H.G.; Visualization, H.G.; Writing—original draft, H.G.; Writing—review & editing, H.N.R. All authors have read and agreed to the published version of the manuscript.
Funding
The work reported in this paper was supported by the Department of Safety, Economics, and Planning of the University of Stavanger (Project name: Building Integrated Photovoltaic (BIPV) in dense urban areas, Project number: IN-12011).
Acknowledgments
The work reported in this paper was supported by the Department of Safety, Economics, and Planning of the University of Stavanger (Project name: Building Integrated Photovoltaic (BIPV) in dense urban areas, Project number: IN-12011). Special thanks also goes to the Smart City Group and Future Energy Hub at the University of Stavanger for their support.
Conflicts of Interest
The authors declare no conflict of interest. The funders had no role in the design of the study; in the collection, analyses, or interpretation of data; in the writing of the manuscript, or in the decision to publish the results.
Abbreviations
| Units | ||
| € | Euro | - |
| BIPV | Building integrated photovoltaics | - |
| BIPVEFF | Efficiency of the BIPV system | % |
| BIPVT | Building integrated photovoltaic thermal | - |
| CIR | inverter replacement cost | (€/sq.m.) |
| COM | operation and maintenance cost | (€/sq.m.) |
| CP | Societal cost of carbon | (€/g) |
| CQ | BIPV initial investment | (€/sq.m.) |
| DG | Distributed generation | - |
| DR | Discount rate | % |
| EG | BIPV total electricity production | (kWh/sq.m.) |
| FiT | Feed-in tariff | (€/kWh) |
| GBS | Average incident solar radiation on the building skins | (kWh/sq.m.) |
| GHG | Greenhaus gas | - |
| IBM | Income from saving in building envelope material cost | (€/sq.m.) |
| IEG | Income from power generation | (€/sq.m.) |
| IPD | Income from saving in power delivery cost | (€/sq.m.) |
| ISCC | Income from saving in societal cost of carbon | (€/sq.m.) |
| ITR | Income from saving transmission line lost power | (€/sq.m.) |
| kWh | Kilowatt-hour | - |
| LCOE | Levelised cost of electricity | (€/kWh) |
| LPOE | Levelised profit of environmental benefits | (€/kWh) |
| MWh | Megawatt-hour | - |
| n | The number of the year | - |
| NP | Power grid price | (€/kWh) |
| NPVC | BIPV net present value of cost | (€/sq.m.) |
| NPVE | BIPV net present value of environmental benefits | (€/sq.m.) |
| NPVI | BIPV net present value of incomes | (€/sq.m.) |
| O&M | Operation and maintenance | - |
| RCP | Societal cost of carbon growth ratio | % |
| REG | BIPV degradation ratio | % |
| RGH | GHG mitigation ratio | % |
| RGHG | Average GHG emission | (g/kWh) |
| RNP | Electricity tariff growth ratio | % |
| RPD | Saving ratio in power delivery cost | % |
| RTR | The ratio of transmission line lost power | % |
| UET | Urban energy transition | - |
| y | BIPV lifespan | years |
References
- Kabir, E.; Kumar, P.; Kumar, S.; Adelodun, A.A.; Kim, K.-H. Solar energy: Potential and future prospects. Renew. Sustain. Energy Rev. 2018, 82, 894–900. [Google Scholar] [CrossRef]
- Lee, C.-Y.; Ahn, J. Stochastic modeling of the levelized cost of electricity for solar PV. Energies 2020, 13, 3017. [Google Scholar] [CrossRef]
- Ko, J.-S.; Huh, J.-H.; Kim, J.-C. Overview of maximum power point tracking methods for PV system in micro grid. Electronics 2020, 9, 816. [Google Scholar] [CrossRef]
- Gholami, H.; Røstvik, H.N.; Müller-Eie, D. Holistic economic analysis of building integrated photovoltaics (BIPV) system: Case studies evaluation. Energy Build. 2019, 203, 109461. [Google Scholar] [CrossRef]
- Gholami, H.; Røstvik, H.N. Economic analysis of BIPV systems as a building envelope material for building skins in Europe. Energy 2020, 204, 117931. [Google Scholar] [CrossRef]
- Gholami, H.; Nils Røstvik, H.; Manoj Kumar, N.; Chopra, S.S. Lifecycle cost analysis (LCCA) of tailor-made building integrated photovoltaics (BIPV) façade: Solsmaragden case study in Norway. Solar Energy 2020, 211, 488–502. [Google Scholar] [CrossRef]
- Gholami, H.; Nils Røstvik, H. The effect of climate on the solar radiation components on building skins and building integrated photovoltaics (BIPV) materials. Energies 2021, 14, 1847. [Google Scholar] [CrossRef]
- Esmailian, E.; Gholami, H.; Røstvik, H.N.; Menhaj, M.B. A novel method for optimal performance of ships by simultaneous optimisation of hull-propulsion-BIPV systems. Energy Convers. Manag. 2019, 197, 111879. [Google Scholar] [CrossRef]
- Daly, H.; Walton, M. World Energy Outlook 2017. 2017. Available online: https://www.iea.org/reports/world-energy-outlook-2017 (accessed on 1 March 2021).
- International Renewable Energy Agency. Renewable Energy in Cities; International Renewable Agency: Abu Dhabi, United Arab Emirates, 2016. [Google Scholar]
- Gholami, H.; Røstvik, H.N.; Müller-Eie, D. Analysis of solar radiation components on building skins for selected cities. In Proceedings of the 14th Conference on Advanced Building Skins, Bern, Switzerland, 28–29 October 2019; Advanced Building Skins (ABS): Bern, Switzerland, 2019; pp. 541–549. [Google Scholar]
- Steemers, K. Energy and the city: Density, buildings and transport. Energy Build. 2003, 35, 3–14. [Google Scholar] [CrossRef]
- Villa-Arrieta, M.; Sumper, A. Economic evaluation of nearly zero energy cities. Appl. Energy 2019, 237, 404–416. [Google Scholar] [CrossRef]
- Parag, Y.; Sovacool, B.K. Electricity market design for the prosumer era. Nat. Energy 2016, 1, 1–6. [Google Scholar] [CrossRef]
- Aldersey-Williams, J.; Rubert, T. Levelised cost of energy—A theoretical justification and critical assessment. Energy Policy 2019, 124, 169–179. [Google Scholar] [CrossRef]
- Shen, W.; Chen, X.; Qiu, J.; Hayward, J.A.; Sayeef, S.; Osman, P.; Meng, K.; Dong, Z.Y. A comprehensive review of variable renewable energy levelized cost of electricity. Renew. Sustain. Energy Rev. 2020, 133, 110301. [Google Scholar] [CrossRef]
- Reichelstein, S.; Sahoo, A. Time of day pricing and the levelized cost of intermittent power generation. Energy Econ. 2015, 48, 97–108. [Google Scholar] [CrossRef]
- Varro, L.; Ha, J. Projected Costs of Generating Electricity—2015 Edition; Nuclear Energy Agency (NEA): Paris, France, 2015. [Google Scholar]
- Mohammadi, F.; Gholami, H.; Gharehpetian, G.B.; Hosseinian, S.H. Allocation of centralized energy storage system and its effect on daily grid energy generation cost. IEEE Trans. Power Syst. 2017, 32, 2406–2416. [Google Scholar] [CrossRef]
- Nissen, U.; Harfst, N. Shortcomings of the traditional “levelized cost of energy” [LCOE] for the determination of grid parity. Energy 2019, 171, 1009–1016. [Google Scholar] [CrossRef]
- Górnowicz, R.; Castro, R. Optimal design and economic analysis of a PV system operating under Net Metering or Feed-In-Tariff support mechanisms: A case study in Poland. Sustain. Energy Technol. Assess. 2020, 42, 100863. [Google Scholar] [CrossRef]
- Castaneda, M.; Zapata, S.; Cherni, J.; Aristizabal, A.J.; Dyner, I. The long-term effects of cautious feed-in tariff reductions on photovoltaic generation in the UK residential sector. Renew. Energy 2020, 155, 1432–1443. [Google Scholar] [CrossRef]
- Cui, Y.; Zhu, J.; Meng, F.; Zoras, S.; McKechnie, J.; Chu, J. Energy assessment and economic sensitivity analysis of a grid-connected photovoltaic system. Renew. Energy 2020, 150, 101–115. [Google Scholar] [CrossRef]
- De Oliveira Pinto Coelho, E.; Aquila, G.; Bonatto, B.D.; Balestrassi, P.P.; de Oliveira Pamplona, E.; Nakamura, W.T. Regulatory impact of photovoltaic prosumer policies in Brazil based on a financial risk analysis. Utilit. Policy 2021, 70, 101214. [Google Scholar] [CrossRef]
- Mundada, A.S.; Shah, K.K.; Pearce, J.M. Levelized cost of electricity for solar photovoltaic, battery and cogen hybrid systems. Renew. Sustain. Energy Rev. 2016, 57, 692–703. [Google Scholar] [CrossRef] [Green Version]
- Limmanee, A.; Songtrai, S.; Udomdachanut, N.; Kaewniyompanit, S.; Sato, Y.; Nakaishi, M.; Kittisontirak, S.; Sriprapha, K.; Sakamoto, Y. Degradation analysis of photovoltaic modules under tropical climatic conditions and its impacts on LCOE. Renew. Energy 2017, 102, 199–204. [Google Scholar] [CrossRef]
- Komilov, A. Location and orientation based LCOE: Simplified visual analysis and generalization of the levelized cost of electricity from storageless photovoltaic systems. Int. J. Energy Res. 2020, 45, 5649–5658. [Google Scholar] [CrossRef]
- Talavera, D.L.; Muñoz-Cerón, E.; Ferrer-Rodríguez, J.P.; Pérez-Higueras, P.J. Assessment of cost-competitiveness and profitability of fixed and tracking photovoltaic systems: The case of five specific sites. Renew. Energy 2019, 134, 902–913. [Google Scholar] [CrossRef]
- Patel, M.T.; Asadpour, R.; Woodhouse, M.; Deline, C.; Alam, M.A. LCOE*: Re-thinking LCOE for photovoltaic systems. In Proceedings of the 2019 IEEE 46th Photovoltaic Specialists Conference (PVSC), Chicago, IL, USA, 16–21 June 2019; pp. 1711–1713. [Google Scholar]
- Sinaga, R.; Tuati, N.F.; Beily, M.D.; Sampeallo, A.S. Modeling and analysis of the solar photovoltaic levelized cost of electricity (LCoE)-case study in Kupang. J. Phys. Conf. Ser. 2019, 1364, 012066. [Google Scholar] [CrossRef]
- World Bank Group. Electric Power Transmission and Distribution Losses (% of Output). Available online: https://data.worldbank.org/indicator/EG.ELC.LOSS.ZS?locations=BR (accessed on 1 March 2021).
- Moro, A.; Lonza, L. Electricity carbon intensity in European Member States: Impacts on GHG emissions of electric vehicles. Trans. Res. Part D Trans. Environ. 2018, 64, 5–14. [Google Scholar] [CrossRef] [PubMed]
- Eurostat. Electricity Price Statistics. Available online: https://ec.europa.eu/eurostat/statistics-explained/index.php/Electricity_price_statistics#Electricity_prices_for_household_consumers (accessed on 1 March 2021).
- Jordan, D.C.; Kurtz, S.R. Photovoltaic degradation rates—an analytical review. Prog. Photovolt. Res. Applicat. 2013, 21, 12–29. [Google Scholar] [CrossRef] [Green Version]
- Photovoltaic Geographical Information System (PVGIS). Overview of PVGIS Data Sources and Calculation Methods. Available online: https://ec.europa.eu/jrc/en/PVGIS/docs/methods (accessed on 1 March 2021).
- Acciari, G.; Adamo, G.; Ala, G.; Busacca, A.; Caruso, M.; Giglia, G.; Imburgia, A.; Livreri, P.; Miceli, R.; Parisi, A.; et al. Experimental investigation on the performances of innovative PV vertical structures. Photonics 2019, 6, 86. [Google Scholar] [CrossRef] [Green Version]
- Evola, G.; Margani, G. Renovation of apartment blocks with BIPV: Energy and economic evaluation in temperate climate. Energy Build. 2016, 130, 794–810. [Google Scholar] [CrossRef]
Figure 1.
Average incident solar radiation on the building skins (GBS) of the capital of the investigated countries.
Figure 1.
Average incident solar radiation on the building skins (GBS) of the capital of the investigated countries.

Figure 2.
Lifetime electricity production of the BIPV system (EGT) as building envelope material.

Figure 3.
BIPV system cost and income break down in Europe.

Figure 4.
NP and LCOE in Scenario 1.

Figure 5.
NP and LCOE in Scenario 2.

Figure 6.
Levelised profit of environmental benefits (LPOE) of the BIPV system.

Figure 7.
BIPV net present value of environmental benefits.

Figure 8.
NP and LCOE of a non-optimal solution.


Table 1.
Electricity tariffs, GHG and electric power transmission and distribution losses of the European countries.
Table 1.
Electricity tariffs, GHG and electric power transmission and distribution losses of the European countries.
| No | Country | Capital | Transmission Line Lost Power (Percent) [31] | GHG Emission (g/kWh) [32] | Electricity Tariff (Euro/kWh) [33] |
|---|---|---|---|---|---|
| 1 | Austria | Vienna | 5% | 156 | 0.20 |
| 2 | Belgium | Brussels | 5% | 233 | 0.29 |
| 3 | Bulgaria | Sofia | 9% | 585 | 0.10 |
| 4 | Croatia | Zagreb | 13% | 282 | 0.13 |
| 5 | Cyprus | Nikosia | 4% | 773 | 0.22 |
| 6 | Czechia | Prague | 5% | 587 | 0.16 |
| 7 | Denmark | Copenhagen | 6% | 386 | 0.31 |
| 8 | Estonia | Tallinn | 7% | 1152 | 0.14 |
| 9 | Finland | Helsinki | 6% | 209 | 0.17 |
| 10 | France | Paris | 4% | 92 | 0.18 |
| 11 | Germany | Berlin | 4% | 567 | 0.30 |
| 12 | Greece | Athens | 4% | 755 | 0.16 |
| 13 | Hungary | Budapest | 12% | 368 | 0.11 |
| 14 | Ireland | Dublin | 8% | 555 | 0.25 |
| 15 | Italy | Rome | 7% | 444 | 0.22 |
| 16 | Latvia | Riga | 9% | 185 | 0.15 |
| 17 | Lithuania | Vilnius | 22% | 262 | 0.11 |
| 18 | Luxembourg | Luxemburg | 6% | 283 | 0.17 |
| 19 | Malta | Valleta | 5% | 868 | 0.13 |
| 20 | Netherlands | Amsterdam | 5% | 582 | 0.17 |
| 21 | Poland | Warsaw | 6% | 929 | 0.14 |
| 22 | Portugal | Lisbon | 10% | 355 | 0.23 |
| 23 | Romania | Bucharest | 11% | 413 | 0.13 |
| 24 | Slovakia | Bratislava | 2% | 211 | 0.15 |
| 25 | Slovenia | Ljubljana | 5% | 351 | 0.16 |
| 26 | Spain | Madrid | 10% | 305 | 0.25 |
| 27 | Sweden | Stockholm | 5% | 25 | 0.20 |
| 28 | UK | London | 8% | 584 | 0.20 |
| 29 | Norway | Oslo | 6% | 19 | 0.19 |
| 30 | Switzerland | Bern | 7% | 37 | 0.17 |
Table 2.
System financial analysis in Europe.
| Country | IBM (€/sq.m.) | ITR (€/sq.m.) | IPD (€/sq.m.) | ISCC (€/sq.m.) | IEG (€/sq.m.) | CQ (€/sq.m.) | CIR (€/sq.m.) | COM (€/sq.m.) | NP (€/kWh) |
|---|---|---|---|---|---|---|---|---|---|
| Austria | 210 | 7 | 30 | 7 | 623 | 430 | 43 | 65 | 0.20 |
| Belgium | 210 | 10 | 39 | 9 | 821 | 430 | 43 | 65 | 0.29 |
| Bulgaria | 210 | 7 | 16 | 27 | 335 | 430 | 43 | 65 | 0.10 |
| Croatia | 210 | 13 | 20 | 12 | 429 | 430 | 43 | 65 | 0.13 |
| Cyprus | 210 | 9 | 46 | 47 | 971 | 430 | 43 | 65 | 0.22 |
| Czechia | 210 | 5 | 22 | 23 | 460 | 430 | 43 | 65 | 0.16 |
| Denmark | 210 | 12 | 41 | 15 | 866 | 430 | 43 | 65 | 0.31 |
| Estonia | 210 | 6 | 17 | 39 | 353 | 430 | 43 | 65 | 0.14 |
| Finland | 210 | 6 | 20 | 7 | 419 | 430 | 43 | 65 | 0.17 |
| France | 210 | 5 | 26 | 4 | 539 | 430 | 43 | 65 | 0.18 |
| Germany | 210 | 8 | 40 | 22 | 845 | 430 | 43 | 65 | 0.30 |
| Greece | 210 | 7 | 33 | 44 | 699 | 430 | 43 | 65 | 0.16 |
| Hungary | 210 | 10 | 17 | 16 | 367 | 430 | 43 | 65 | 0.11 |
| Ireland | 210 | 13 | 31 | 20 | 663 | 430 | 43 | 65 | 0.25 |
| Italy | 210 | 14 | 40 | 24 | 844 | 430 | 43 | 65 | 0.22 |
| Latvia | 210 | 8 | 19 | 7 | 392 | 430 | 43 | 65 | 0.15 |
| Lithuania | 210 | 15 | 13 | 9 | 281 | 430 | 43 | 65 | 0.11 |
| Luxembourg | 210 | 7 | 23 | 11 | 487 | 430 | 43 | 65 | 0.17 |
| Malta | 210 | 7 | 27 | 51 | 566 | 430 | 43 | 65 | 0.13 |
| Netherlands | 210 | 6 | 23 | 22 | 477 | 430 | 43 | 65 | 0.17 |
| Norway | 210 | 7 | 22 | 1 | 475 | 430 | 43 | 65 | 0.19 |
| Poland | 210 | 6 | 19 | 36 | 392 | 430 | 43 | 65 | 0.14 |
| Portugal | 210 | 23 | 45 | 20 | 959 | 430 | 43 | 65 | 0.23 |
| Romania | 210 | 12 | 21 | 19 | 448 | 430 | 43 | 65 | 0.13 |
| Slovakia | 210 | 2 | 22 | 9 | 459 | 430 | 43 | 65 | 0.15 |
| Slovenia | 210 | 6 | 23 | 14 | 495 | 430 | 43 | 65 | 0.16 |
| Spain | 210 | 25 | 51 | 18 | 1077 | 430 | 43 | 65 | 0.25 |
| Sweden | 210 | 6 | 25 | 1 | 521 | 430 | 43 | 65 | 0.20 |
| Switzerland | 210 | 9 | 25 | 2 | 530 | 430 | 43 | 65 | 0.17 |
| UK | 210 | 11 | 26 | 22 | 559 | 430 | 43 | 65 | 0.20 |
| EUAV | 210 | 9 | 27 | 19 | 578 | 430 | 43 | 65 | 0.18 |
Publisher’s Note: MDPI stays neutral with regard to jurisdictional claims in published maps and institutional affiliations. |
© 2021 by the authors. Licensee MDPI, Basel, Switzerland. This article is an open access article distributed under the terms and conditions of the Creative Commons Attribution (CC BY) license (https://creativecommons.org/licenses/by/4.0/).
Share and Cite
MDPI and ACS Style
Gholami, H.; Nils Røstvik, H. Levelised Cost of Electricity (LCOE) of Building Integrated Photovoltaics (BIPV) in Europe, Rational Feed-In Tariffs and Subsidies. Energies 2021, 14, 2531. https://0-doi-org.brum.beds.ac.uk/10.3390/en14092531
AMA Style
Gholami H, Nils Røstvik H. Levelised Cost of Electricity (LCOE) of Building Integrated Photovoltaics (BIPV) in Europe, Rational Feed-In Tariffs and Subsidies. Energies. 2021; 14(9):2531. https://0-doi-org.brum.beds.ac.uk/10.3390/en14092531
Chicago/Turabian StyleGholami, Hassan, and Harald Nils Røstvik. 2021. "Levelised Cost of Electricity (LCOE) of Building Integrated Photovoltaics (BIPV) in Europe, Rational Feed-In Tariffs and Subsidies" Energies 14, no. 9: 2531. https://0-doi-org.brum.beds.ac.uk/10.3390/en14092531
Note that from the first issue of 2016, this journal uses article numbers instead of page numbers. See further details here.