Article

Unbalanced Voltage Compensation with Optimal Voltage Controlled Regulators and Load Ratio Control Transformer

by
Akito Nakadomari
1,*,
Ryuto Shigenobu
2,
Takeyoshi Kato
3,
Narayanan Krishnan
4,
Ashraf Mohamed Hemeida
5,
Hiroshi Takahashi
6 and
Tomonobu Senjyu
1,*
1
Department of Engineering, University of the Ryukyus, 1 Senbaru, Nishihara-cho, Nakagami, Okinawa 903-0213, Japan
2
Department of Electrical, Electronic and Computer Engineering, University of Fukui 3-9-1, Bunkyo, Fukui 910-8507, Japan
3
Institute of Materials and Systems for Sustainability, Nagoya University, Furo-cho, Chikusa-ku, Nagoya 464-8603, Japan
4
Department of Electrical and Electronics Engineering, SASTRA Deemed University, Thanjavur 613401, Tamil Nadu, India
5
Department of Electrical Engineering, Faculty of Energy Engineering, Aswan University, Aswan 81528, Egypt
6
Fuji Electric Co., Ltd., Tokyo 191-8506, Japan
*
Authors to whom correspondence should be addressed.
Submission received: 29 April 2021 / Revised: 15 May 2021 / Accepted: 17 May 2021 / Published: 21 May 2021
(This article belongs to the Special Issue Power System Planning and Quality Control)

Abstract

:
Penetration of equipment such as photovoltaic power generations (PV), heat pump water heaters (HP), and electric vehicles (EV) introduces voltage unbalance issues in distribution systems. Controlling PV and energy storage system (ESS) outputs or coordinated EV charging are investigated for voltage unbalance compensation. However, some issues exist, such as dependency on installed capacity and fairness among consumers. Therefore, the ideal way to mitigate unbalanced voltages is to use grid-side equipment mainly. This paper proposes a voltage unbalance compensation based on optimal tap operation scheduling of three-phase individual controlled step voltage regulators (3ϕSVR) and load ratio control transformer (LRT). In the formulation of the optimization problem, multiple voltage unbalance metrics are comprehensively included. In addition, voltage deviations, network losses, and coordinated tap operations, which are typical issues in distribution systems, are considered. In order to investigate the mutual influence among voltage unbalance and other typical issues, various optimization problems are formulated, and then they are compared by numerical simulations. The results show that the proper operation of 3ϕSVRs and LRT effectively mitigates voltage unbalance. Furthermore, the results also show that voltage unbalances and other typical issues can be improved simultaneously with appropriate formulations.

1. Introduction

The growing global momentum toward decarbonization leads to the increasing use of photovoltaic power generation (PV), heat pump water heater (HP), and electric vehicles (EV). However, the variability of generation and load of such equipment introduces voltage unbalance issues in low voltage (LV) and medium voltage (MV) distribution systems. In [1], voltage unbalance is reported by monitoring an actual LV distribution system. Authors in [2] explained HPs’ and EVs’ random behavior, non-uniformed single-phase loads, and network asymmetry causes voltage unbalance. Stochastic investigations of the relationship between PV penetration and voltage unbalance are conducted in [3,4]; it reported that unacceptable voltage unbalance can occur depending on the PV penetration and placement. In [5,6], uncoordinated charging of EVs adversely affects voltage balances are showed. The increase in voltage unbalances lead to induction motor failures, increased losses, and additional cost of increasing a particular phase of the distribution line capacity. Therefore, in modern distribution systems with penetration of variable loads and distributed power sources, it is necessary to consider voltage unbalance compensation.
Conventionally, voltage regulation in distribution systems is performed using tap control of a load ratio control transformer (LRT) in distribution substations and step voltage regulators (SVR) installed on lines. The three-phase simultaneously tap operation of these devices keeps the voltage magnitude within the appropriate range, but they cannot mitigate voltage unbalance. Using a static var compensator (SVC) is an effective means, but its drawback is the high cost of equipment.
Different solutions are proposed in the literature to regulate unbalanced voltage in distribution systems. In [7], voltage deviation and the number of tap operations are minimized by optimizing reactive power injection of PV inverter and tap operations of on-load tap changer (OLTC). Authors in [8] proposed a capacitor placement method based on genetic algorithm (GA) to minimize the losses with appropriate voltage profiles. In [9], a modified firefly algorithm solved the optimal placement and capacity of distributed power sources for loss minimization. Distributed power sources allocation using a particle swarm optimization (PSO) based approach is presented in [10]. However, these studies evaluate voltege profiles only by the voltage deviations and do not consider the voltage unbalance metrics.
In order to evaluate voltage unbalance, various organizations such as IEC [11], IEEE [12], and NEMA [13] define different voltage unbalance metrics. Several papers use these metrics to assess voltage unbalance and thereby reduce voltage unbalance. In [3], voltage unbalances reduced by controlling the reactive power of the PV inverter. Authors in [5] minimized voltage unbalances by optimizing the plugin electric vehicles (PEV) charging with GA. Optimal scheduling of microgrid distributed resources for minimizing voltage unbalance is proposed in [14].
The authors of [3,5,14] focused on only one voltage unbalance metric. However, A few papers show that the consideration of only one voltage unbalance metric is insufficient to compensate for voltage unbalances. Authors in [15] reported that minimizing one voltage unbalance definition might increase another voltage unbalance definition. The condition where IEC definition is zero but unbalances remains is shown in [16]. Moreover, the IEEE definition does not include information on the voltage angle; obviously, it is impossible to detect unbalanced conditions completely.
Voltage unbalance compensation considering multiple voltage unbalance metrics is proposed in [15,16,17]. Authors in [15] provided voltage unbalance compensation by reactive power control of PV inverters based on IEC, IEEE, and NEMA definitions. In [16], in addition to the IEC definition, VUF 0 and MVUF are additionally defined, and voltage unbalance compensation with active and reactive power control of smart inverters is proposed. Voltage management by demand response and individual phase control of substation OLTC considering the IEC definition and VUF 0 is presented in [17].
Voltage regulation of unbalanced systems based on sensitivity analysis or controllers is investigated in [18,19,20]. These controller-based methods are beneficial in low computational cost, easy implementation, and decentralized control during a communication network failure. However, for unbalance metrics such as IEC and NEMA definitions, which contain information on voltage angle, the relationship between voltage value and metrics is complicated. Consequently, it is not easy to apply the controller-based method. Authors in [18] proposed a sensitivity-based voltage control with variously connected substation voltage regulators, but only the voltage deviations are monitored. The individual phase tap control of OLTC based on proportional control proposed in [19] instead increases the voltage unbalance. In [20], the sensitivity-based individual phase reactive power control of energy storage system (ESS) improves voltage magnitude unbalance defined by IEEE, but it is not easy to extend it to consider voltage angle unbalance. Hence, an optimization-based approach is suitable for voltage regulation considering multiple voltage unbalance metrics.
Furthermore, most of the existing approaches (e.g., [3,5,15,16,20]) use end-user equipment such as PV inverters, EVs, capacitors, and ESS. Hence, the methods introduce some issues such as dependency on the equipment’s capacity, and incentives or fairness to control owners’ equipment. Therefore, it is not practical to depend only on these methods for unbalance compensation, and it is desirable to voltage unbalance compensation using grid-side equipment mainly.
This paper investigates voltage unbalance compensation by optimal tap operation scheduling of three-phase individual controlled SVRs ( 3 ϕ SVR) composed of three single-phase regulators and LRT. The 3 ϕ SVRs can provide voltage unbalance compensation, and the LRT can provide control margins to the 3 ϕ SVRs by compensating overall voltage drops. A tabu search-based heuristic algorithm and a penalty approach formulation are implemented. In the formulation of the optimization problem, multiple voltage unbalance metrics are comprehensively considered. In addition, voltage deviations, network losses, and coordinated tap operations, which are typical issues in distribution systems, are also considered. Various optimization problems are formulated to investigate the impact of considering the typical issues on unbalance compensation. A typical MV three-phase distribution system with assumpting PV penetration and unbalanced load is used to simulate daily tap operation.
In summary, the significant contributions of this paper are:
  • The effectiveness validation of voltage unbalance compensation using 3 ϕ SVRs and LRT.
  • Comprehensive integration of multiple unbalance metrics into the optimization problem to address different voltage unbalance definition issues.
  • Consideration of voltage deviation, network losses, and coordinated tap operation with the voltage unbalance compensation and investigation of the impact of considering these typical issues on unbalance compensation.
  • Application and implementaion of tabu search-based heuristic to voltage unbalance compensation.
The rest of this paper is structured as follows: Section 2 describes the voltage unbalance metrics and other issues of unbalanced distribution systems treated in this study. In Section 3, we formulate various optimization problems. Section 4 introduces the tabu search as a solution method for optimization problems and then investigates the impact of the different formulations by comparing the solutions of optimization problems. Finally, Section 5 concludes this paper.

2. Voltage Unbalance Metrics and Typical Issues in Unbalanced Distribution Systems Operation

This section introduces the voltage unbalance metrics used in this study and other typical issues that a distribution system operator (DSO) must manage. In addition to voltage unbalance, voltage deviation, network losses, and coordinated tap operation will be outlined as challenges for efficient network operation.

2.1. Voltage Unbalance Metrics

Voltage unbalance is a condition in three-phase systems when either the phase voltages have different magnitudes, and the phase angle displacement is not equal to 120 , or both. Unbalanced load distribution and the penetration of single-phase PVs can increase voltage unbalance. Since there are various definitions of metrics for detecting voltage unbalance, careful attention should be paid to selecting voltage unbalance metrics. In the following subsections, the voltage unbalance metrics adopted in this study are described.

2.1.1. VUF (IEC Definition)

Voltage unbalance factor (VUF) is described by the symmetrical components’ negative and positive phase voltage magnitudes. The definition of VUF is provided by IEC standard [11] and also referred to as the “true” definition. It is widely used as a primary voltage unbalance metric. It is given by
VUF ( % ) = | V ˙ 2 | | V ˙ 1 | × 100 , where V ˙ 1 = V ˙ a + α V ˙ b + α 2 V ˙ c 3 , V ˙ 2 = V ˙ a + α 2 V ˙ b + α V ˙ c 3 .
Here, V ˙ 2 and V ˙ 1 are the negative and positive phase voltage phasers, respectively; V ˙ a , V ˙ b , V ˙ c are three-phase line-to-ground voltage phasors, and α = 1 120 . The IEC standard requires VUF should be less than 2% in LV and MV systems.

2.1.2. VUF0

In few papers, VUF 0 is defined additionally, which is described by the symmetrical components’ zero and positive phase voltage magnitudes [16,17]. Because the balanced three-phase voltage is equivalent to both the negative-phase voltage and zero-phase voltage is zero, introducing this definition is reasonable. It is given by
VUF 0 ( % ) = | V ˙ 0 | | V ˙ 1 | × 100 , where V ˙ 0 = V ˙ a + V ˙ b + V ˙ c 3 .
Here, V ˙ 0 is the zero-phase voltage phasor. VUF 0 is used as an unbalance metric to complement VUF. It is assumed that VUF 0 is required to be less than 2%. VUF and VUF 0 detect angle and magnitude unbalances; the NEMA [13] definition also detects angle and magnitude unbalances, but since VUF and VUF 0 sufficiently detect these, the NEMA definition is omitted in this paper.

2.1.3. PVUR (IEEE Definition)

The unbalance metric defined by IEEE [12] is referred to as phase voltage unbalance rate (PVUR). It is calculated using the line-to-ground phase voltage magnitudes V a , V b , and V c :
PVUR ( % ) = V md V ave × 100 , where V ave = V a + V b + V c 3 , V md = max | V a V ave | , | V b V ave | , | V c V ave | .
Since VUF and VUF 0 contain information on both voltage magnitude unbalances and angle unbalances, voltage magnitude unbalances cannot be monitored independently. Therefore, PVUR is used to monitor voltage magnitude unbalances independently; IEEE standard [12] prescribes that PVUR should be limited to 2% or less.

2.2. Voltage Deviations

Maintaining the bus voltages at a specified value is an essential requirement of power distribution systems. However, maintaining the voltages becomes more challenging in unbalanced systems due to unbalanced loads and PV installations. In order to quantify the voltage deviation of each phase, the voltage deviation rate is calculated as
VD t k n ( % ) = | V t k n V s | V s × 100 ,
where VD t k n is the voltage deviation rate of the n-phase voltage at time t and bus k, V t k n is the n-phase voltage at time t and bus k, and V s is the reference voltage. For the reliable operation of the distribution system, the voltage deviation rate must be less than the specified value. Therefore, all bus voltages should be constraints as
VD t k n VD lim ,
where VD lim is the constraint value of the voltage deviation rate. In general, VD t k n should be limited within 10%.

2.3. Network Losses

Network losses are directly increasing costs. Therefore, the minimization of network losses is an important objective for efficient distribution system operations. Network loss of a particular line can be calculated as
Loss t i = P ( V ˙ t i , I ˙ t i ) ,
where Loss t i is the network loss of line i at time t, V ˙ t i is the voltage drop of line i at time t, I ˙ t i is the current passing through line i at time t.

2.4. Coordinated Operation of Control Devices

In operating multiple voltage control devices, proper coordination among them is important. In this study, the following two issues related to the coordination of tap devices, such as 3 ϕ SVRs and LRT, are considered.

2.4.1. Unbalanced Operation of Control Devices

In multiple tap control devices operation, only some of the devices may operate unevenly. When a device reaches its tap limit due to unbalanced operation, it decreases the voltage margin for sudden fluctuations in load and generation. In addition, the unbalanced operation can also make it difficult to estimate the life of the devices. In three-phase individual control, this issue is even more pronounced. Therefore, the fair sharing of control responsibilities through mutual coordination among devices is required.

2.4.2. Deterioration of Control Devices

The lifetime of tap control devices is proportional to the number of tap operations. Therefore, in optimal operation to improve power quality, over-control of taps may decrease the lifetime of the devices. In general, the number of tap operations per day is limited within a specified value to avoid over-control of taps.

3. Optimization Problem Formulation

This section describes various optimization problems formulated to address voltage unbalances and other typical issues that a DSO interest in solving. Optimal scheduling problems for 3 ϕ SVR and LRT are formulated as nonlinear integer optimization problems. Tap positions of the control devices are control variables. First, we explain all objective functions, penalty constraints, and constraints formulated in this paper, and then the various optimization problems formulated by the combination of these formulas are described.

3.1. Objective Functions

3.1.1. Objective Function for Minimize VUF

For minimization of VUF only, an objective function is given by
f vuf = t = 1 N time k = 1 N bus VUF t k ,
where VUF t k is the VUF value of bus k at time t, N time is the total value of time intervals, and N b u s is the total value of buses in a system.

3.1.2. Objective Function for Minimize Sum of All Voltage Unbalance Metrics

The sum of all voltage unbalance metrics is minimized by
f vu = t = 1 N time k = 1 N bus VUF t k + VUF 0 , t k + PVUR t k ,
where VUF 0 , t k , PVUR t k are the VUF 0 and PVUR values of bus k at time t, respectively.

3.1.3. Objective Function for Minimize Loss

An objective function for minimizing network losses is given by
f loss = t = 1 N time i = 1 N line Loss t i ,
where, Loss t i is the network loss of line i at time t, and N line is the total number of lines in a system.

3.2. Penalty Constraints

Most of the problems described in Section 2 are treated as penalty constraints. Penalty constraints are incorporated into the optimization problem by summation with an objective function.

3.2.1. Penalty Constraint to Limit Voltage Deviation Rate

A penalty constraint to limit the voltage deviation rate to within a specified value is given by
Penalty vd = t = 1 N time k = 1 N bus n a , b , c w vd d t k n , where d t k n = 0 if VD t k n VD lim VD t k n VD lim otherwise .
Here, w v d is the weight factor for voltage deviation rate.

3.2.2. Penalty Constraint to Limit Voltage Unbalance Metrics

All voltage unbalance metrics is penalized as
Penalty vu = t = 1 N time k = 1 N bus w vu ( u 1 , t k + u 2 , t k + u 3 , t k ) ,
where
u 1 , t k = 0 if VUF t k < VUF lim VUF t k VUF lim otherwise , u 2 , t k = 0 if VUF 0 , t k < VUF 0 , lim VUF 0 , t k VUF 0 , lim otherwise , u 3 , t k = 0 if PVUR t k < PVUR lim PVUR t k PVUR lim otherwise .
Here, VUF lim , VUF 0 , lim , and PVUR lim are the constraint values of the VUF, VUF 0 , and PVUR, respectively; w v u is the weight factor for voltage unbalance.

3.2.3. Penalty Constraint to Reduce Unbalanced Operation

A following penalty constraint mitigates unbalanced tap operations:
Penalty tap 1 = t = 1 N time j = 1 N tap | T t j T c | 3 w tap 1 , j ,
where N tap is the total number of tap control devices (each phase tap of 3 ϕ SVRs is accounted for separately), T t j is the tap position of tap device j at time t, T c is the tap center position, and w tap 1 , j is the weight factor for the operation of the tap control device j.

3.2.4. Penalty Constraint to Limit the Number of Tap Operations per Day

The number of tap operations per day is limited by following penalty constraint as
Penalty tap 2 = j = 1 N tap w tap 2 p j , where p j = 0 if t = 1 N time 1 Δ T t j T lim t = 1 N time 1 Δ T t j otherwise , Δ T t j = | T t + 1 , j T t j | .
Here, T lim is the constraint value of the number of tap operations per day, w tap 2 is the weight factor for the number of tap operations per day, and Δ T t j is the difference of the tap position between time t t + 1 of device j.

3.3. Constraint

Inequality Constraint to Limit Tap Control Range

Most of the constraints were formulated as penalty constraints. The control range of the taps is formulated as a constraint. It is given by
T min T t j T max ,
where T min and T max are the minimum and maximum tap positions, respectively.

3.4. Optimal Scheduling Problem Formulation

In this subsection, we describe the formulations of five optimization problems using the objective functions, penalty constraints, and constraint introduced in the previous subsections.

3.4.1. Minimize VUF

The first problem formulation minimizes the VUF. It is considered in most of the existing literature. It includes the penalty constraint to limit voltage deviation rate and constraint to limit tap control range.
min Objective Function ( 7 ) subject to Penalty Constraint ( 10 ) Constraint ( 14 )

3.4.2. Minimize Sum of All Voltage Unbalance Metrics

The second problem formulation minimizes the sum of all voltage unbalance metrics. It includes the penalty constraint to limit voltage deviation rate and constraint to limit tap control range.
min Objective Function ( 8 ) subject to Penalty Constraint ( 10 ) Constraint ( 14 )

3.4.3. Minimize Losses

The third problem formulation minimizes the network losses. It includes the penalty constraint to limit voltage deviation rate and constraint to limit tap control range.
min Objective Function ( 9 ) subject to Penalty Constraint ( 10 ) Constraint ( 14 )

3.4.4. Minimize Losses with Voltage Unbalance Penalty

The fourth problem formulation minimizes the network losses with the penalty constraint to limit voltage unbalance metrics. It also includes the penalty constraint to limit voltage deviation rate and constraint to limit tap control range.
min Objective Function ( 9 ) subject to Penalty Constraints ( 10 ) , ( 11 ) Constraint ( 14 )

3.4.5. Minimize Losses with Voltage Unbalance and Tap Operation Penalty

The last problem formulation minimizes the network losses with the penalty constraint to limit voltage unbalance metrics and penalty constraints for improve tap operation. It also includes the penalty constraint to limit voltage deviation rate and constraint to limit tap control range.
min Objective Function ( 9 ) subject to Penalty Constraints ( 10 ) ( 13 ) Constraint ( 14 )

4. Simulation Results

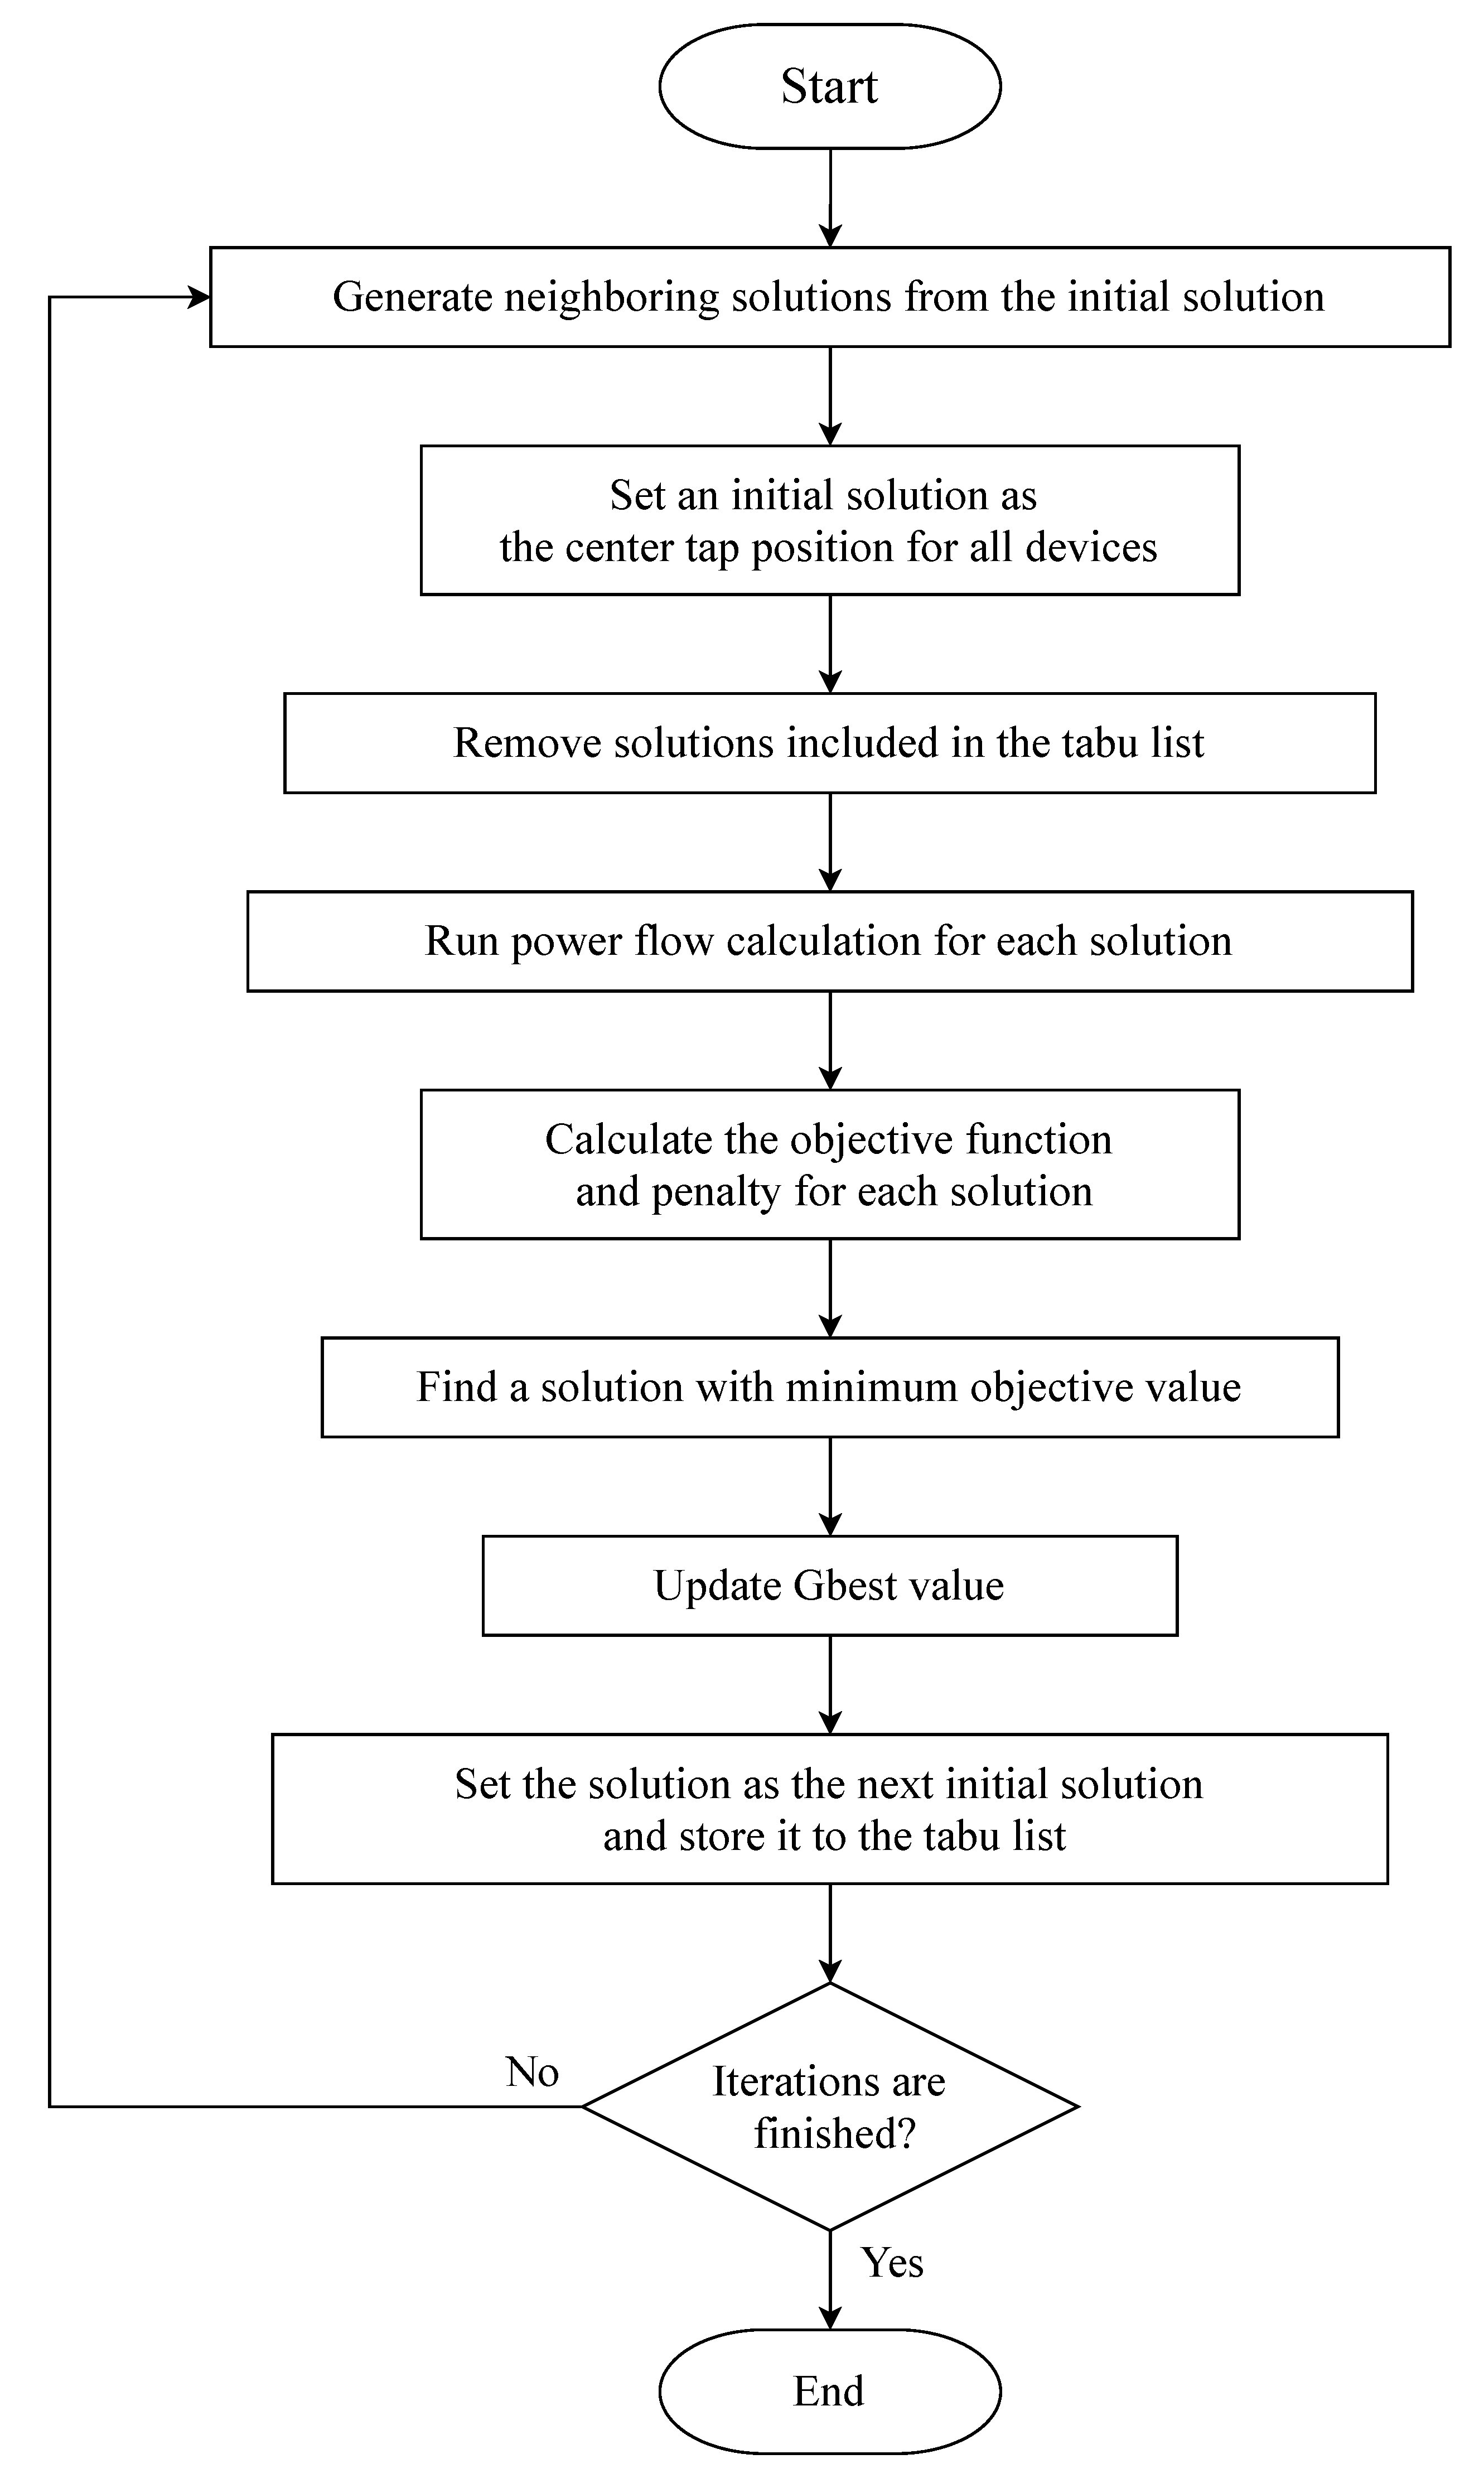
4.1. Optimization Method

As the solution to the nonlinear integer optimization problems, tabu search [21], a meta-heuristic algorithm based on the local search method, is applied. The tabu search is adopted because it can directly handle integer variables and is easy to apply even if the relationship between the control variables and the objective function is complex. In addition, the algorithm is deterministic, which makes it easy to implement and adjust parameters.
The basic algorithm of the tabu search is to search multiple neighborhoods of the initial solution and transition to the neighboring solution with the highest evaluation among them. Then, the solution is stored in the taboo list. While the solution is stored in the taboo list, the transition to that solution is prohibited. This prevents the solution from being looped. In addition, when the solution is not stored in the tabu list, transitions are made even when the solution deteriorates, thereby preventing the search from stagnating in local solutions. Solutions are evaluated through power flow calculation using the backward forward sweep (BFS) method. It is performed for all neighboring solutions at each iteration. For the simulation, we implemented a tabu search using MATLAB®. The applied tabu search procedure is illustrated in Figure 1. In all cases, the calculation time of the optimization process is less than 700 s in MATLAB 2020b with utilizing Parallel Computing Toolbox ™ on the PC with Intel CORE i9-9960X and 128 GB RAM.

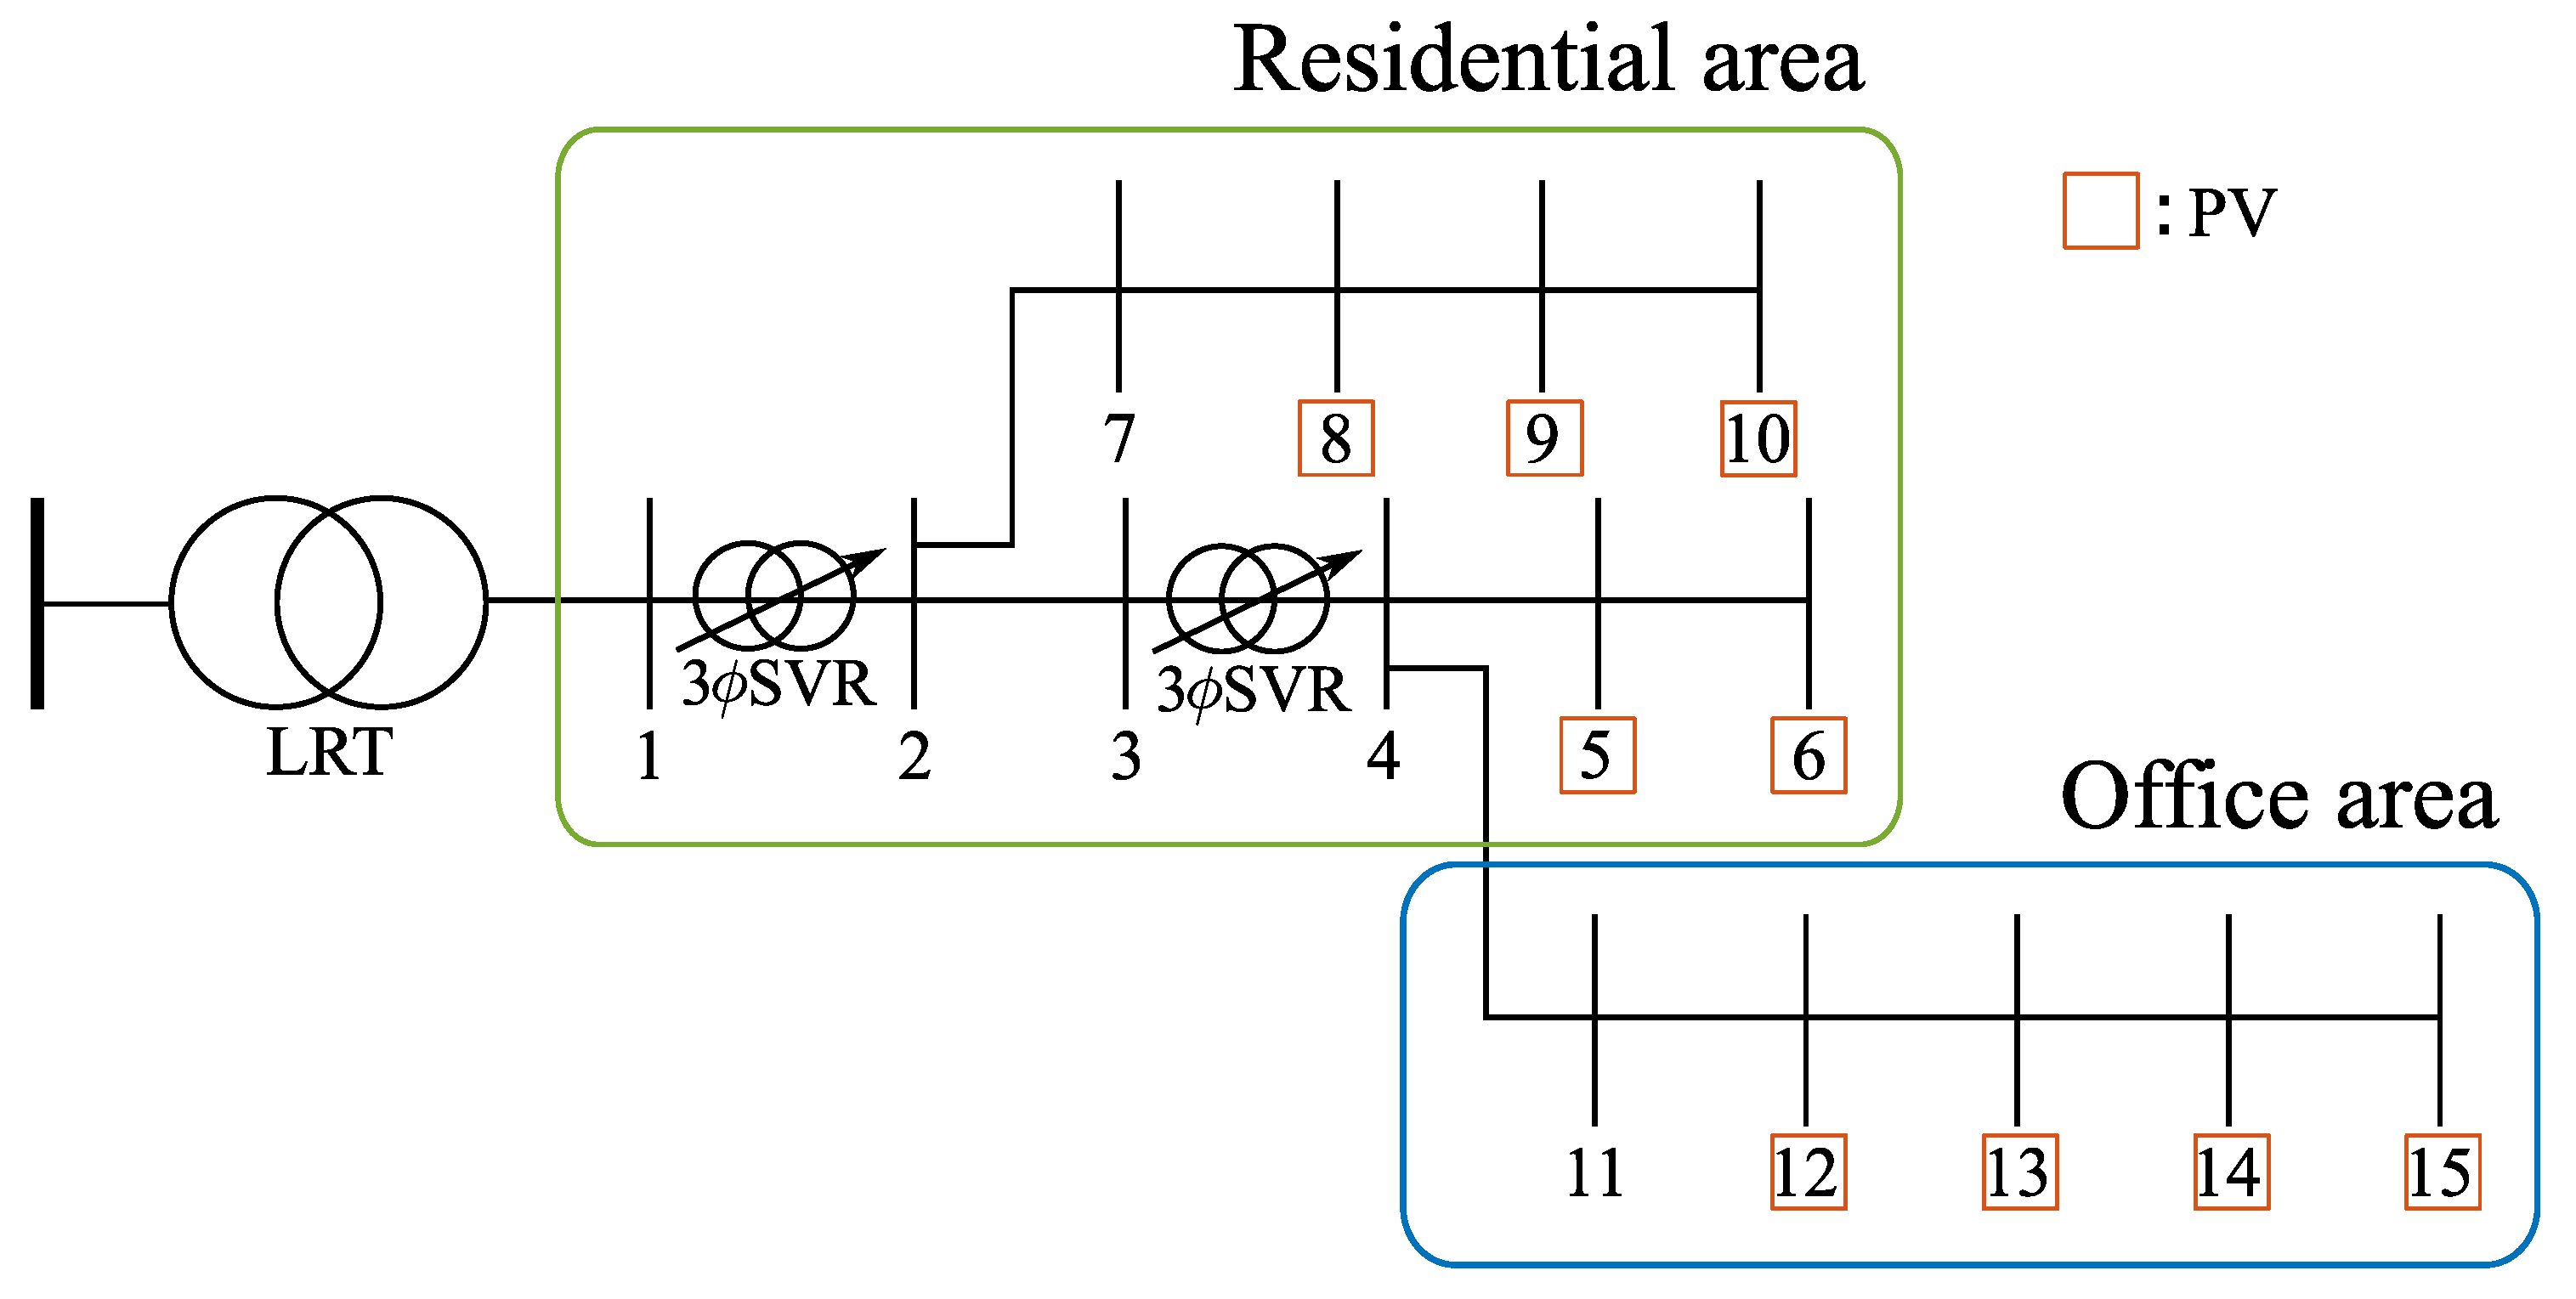
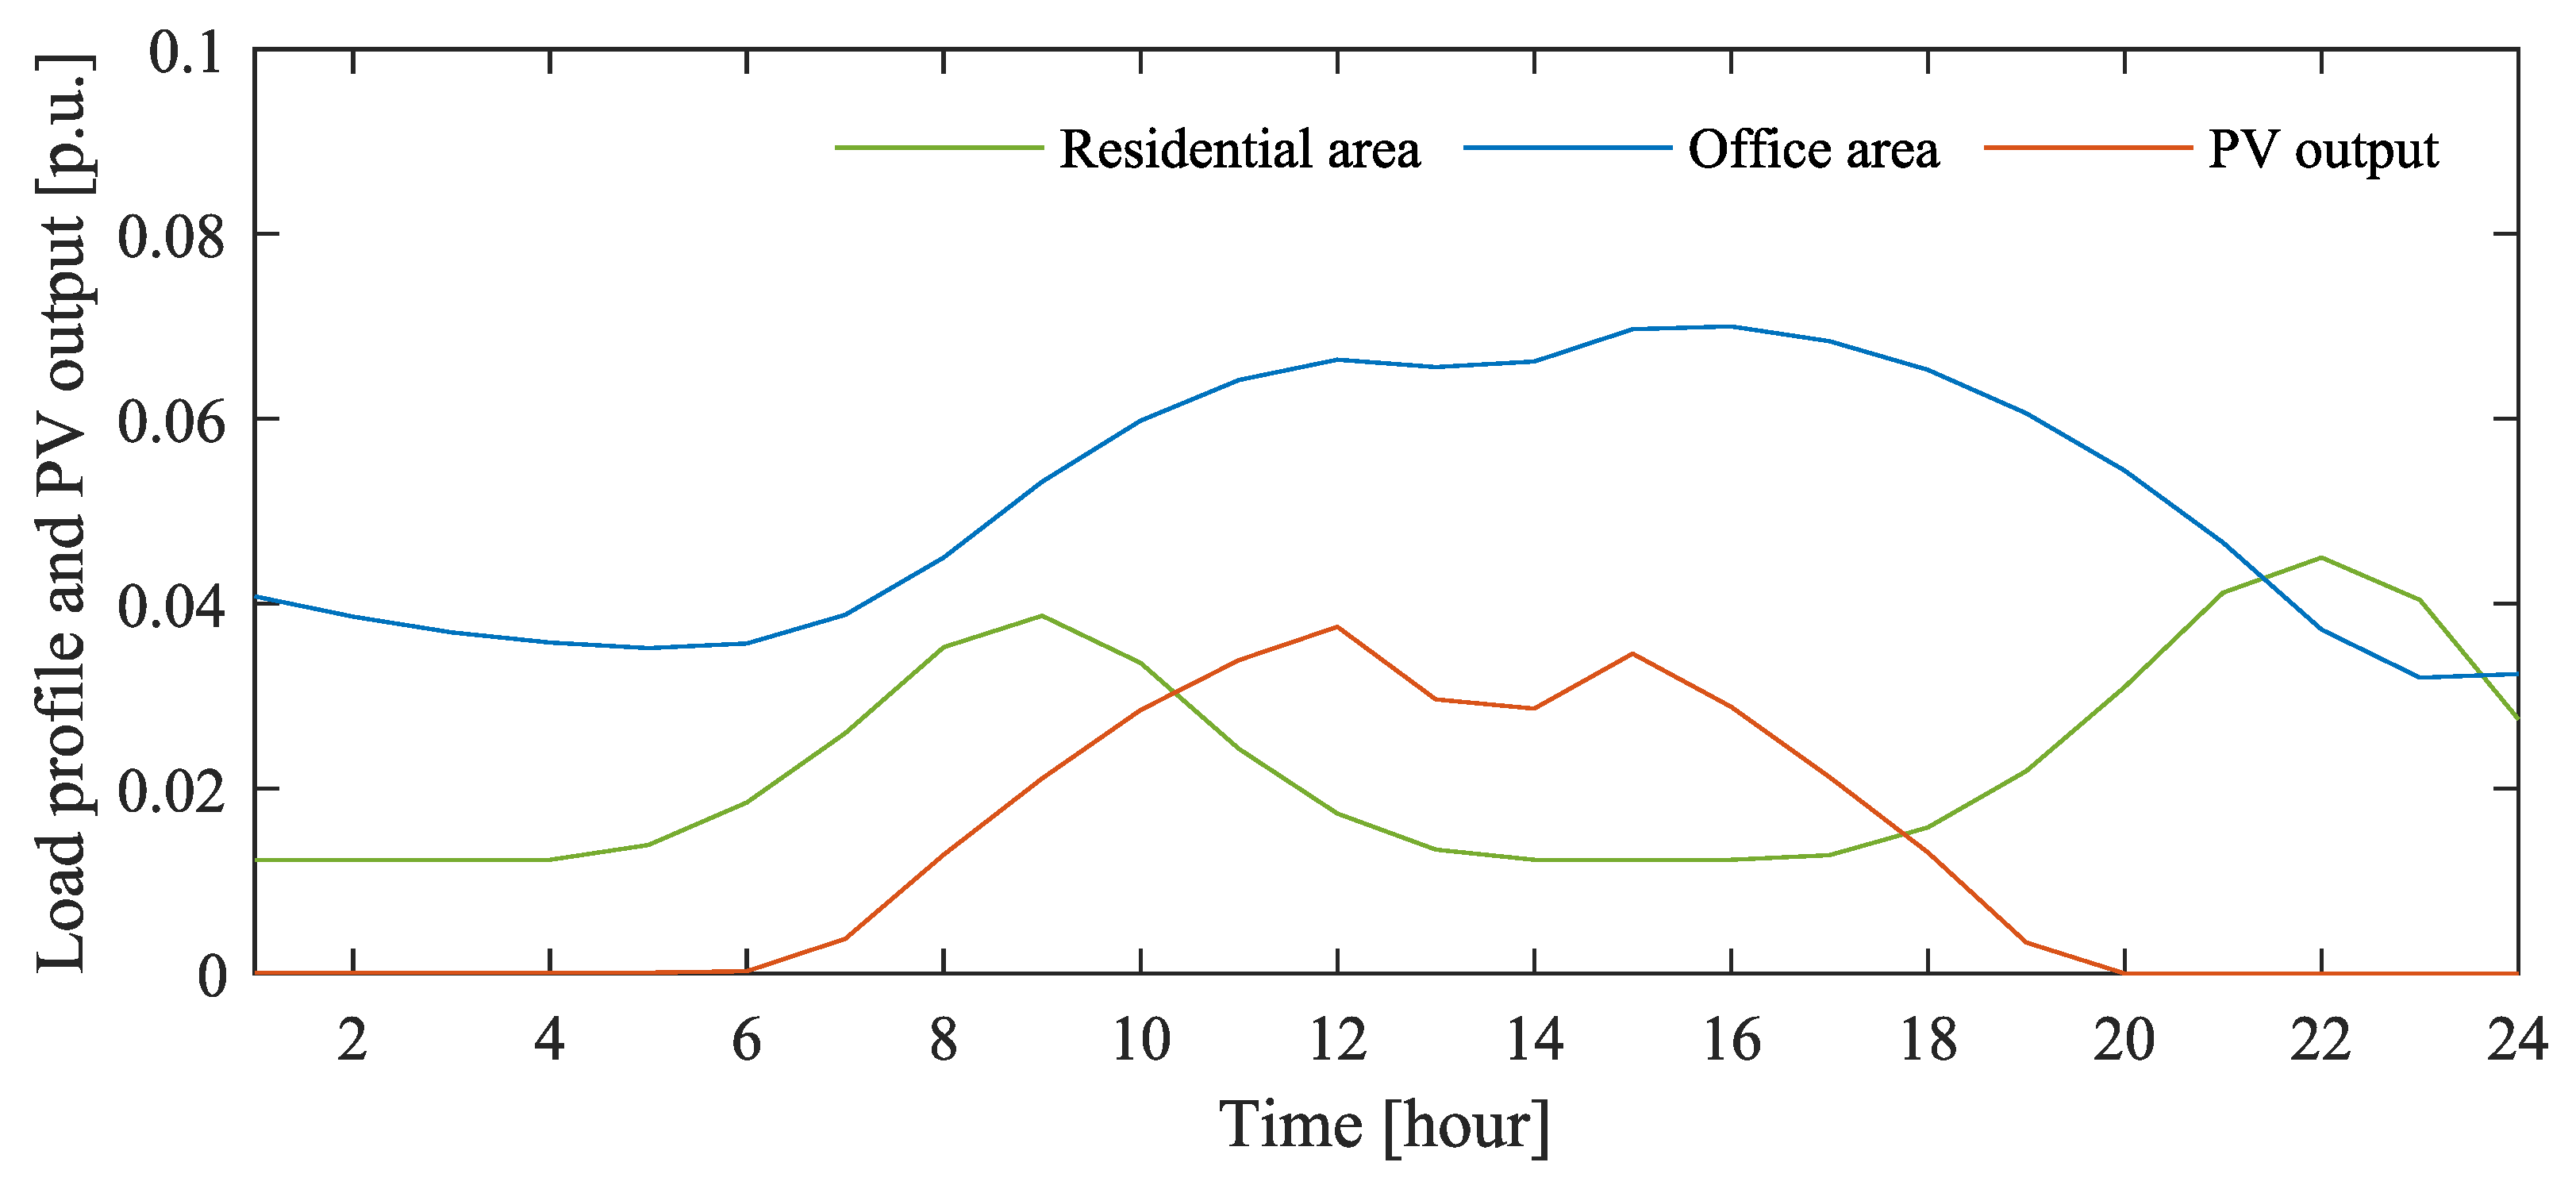
4.2. Distribution System Model

In this study, simulations are performed using a modified version of the MV distribution system model used in [22]. It is shown in Figure 2. The model has residential and office areas; and the daily load profile of each area and PV output are assumed as Figure 3. The daily load profiles in Figure 3 is extended as three-phase unbalanced loads by decreasing 20% in phase b and increasing 20% in phase c. PV is installed only in phase a.

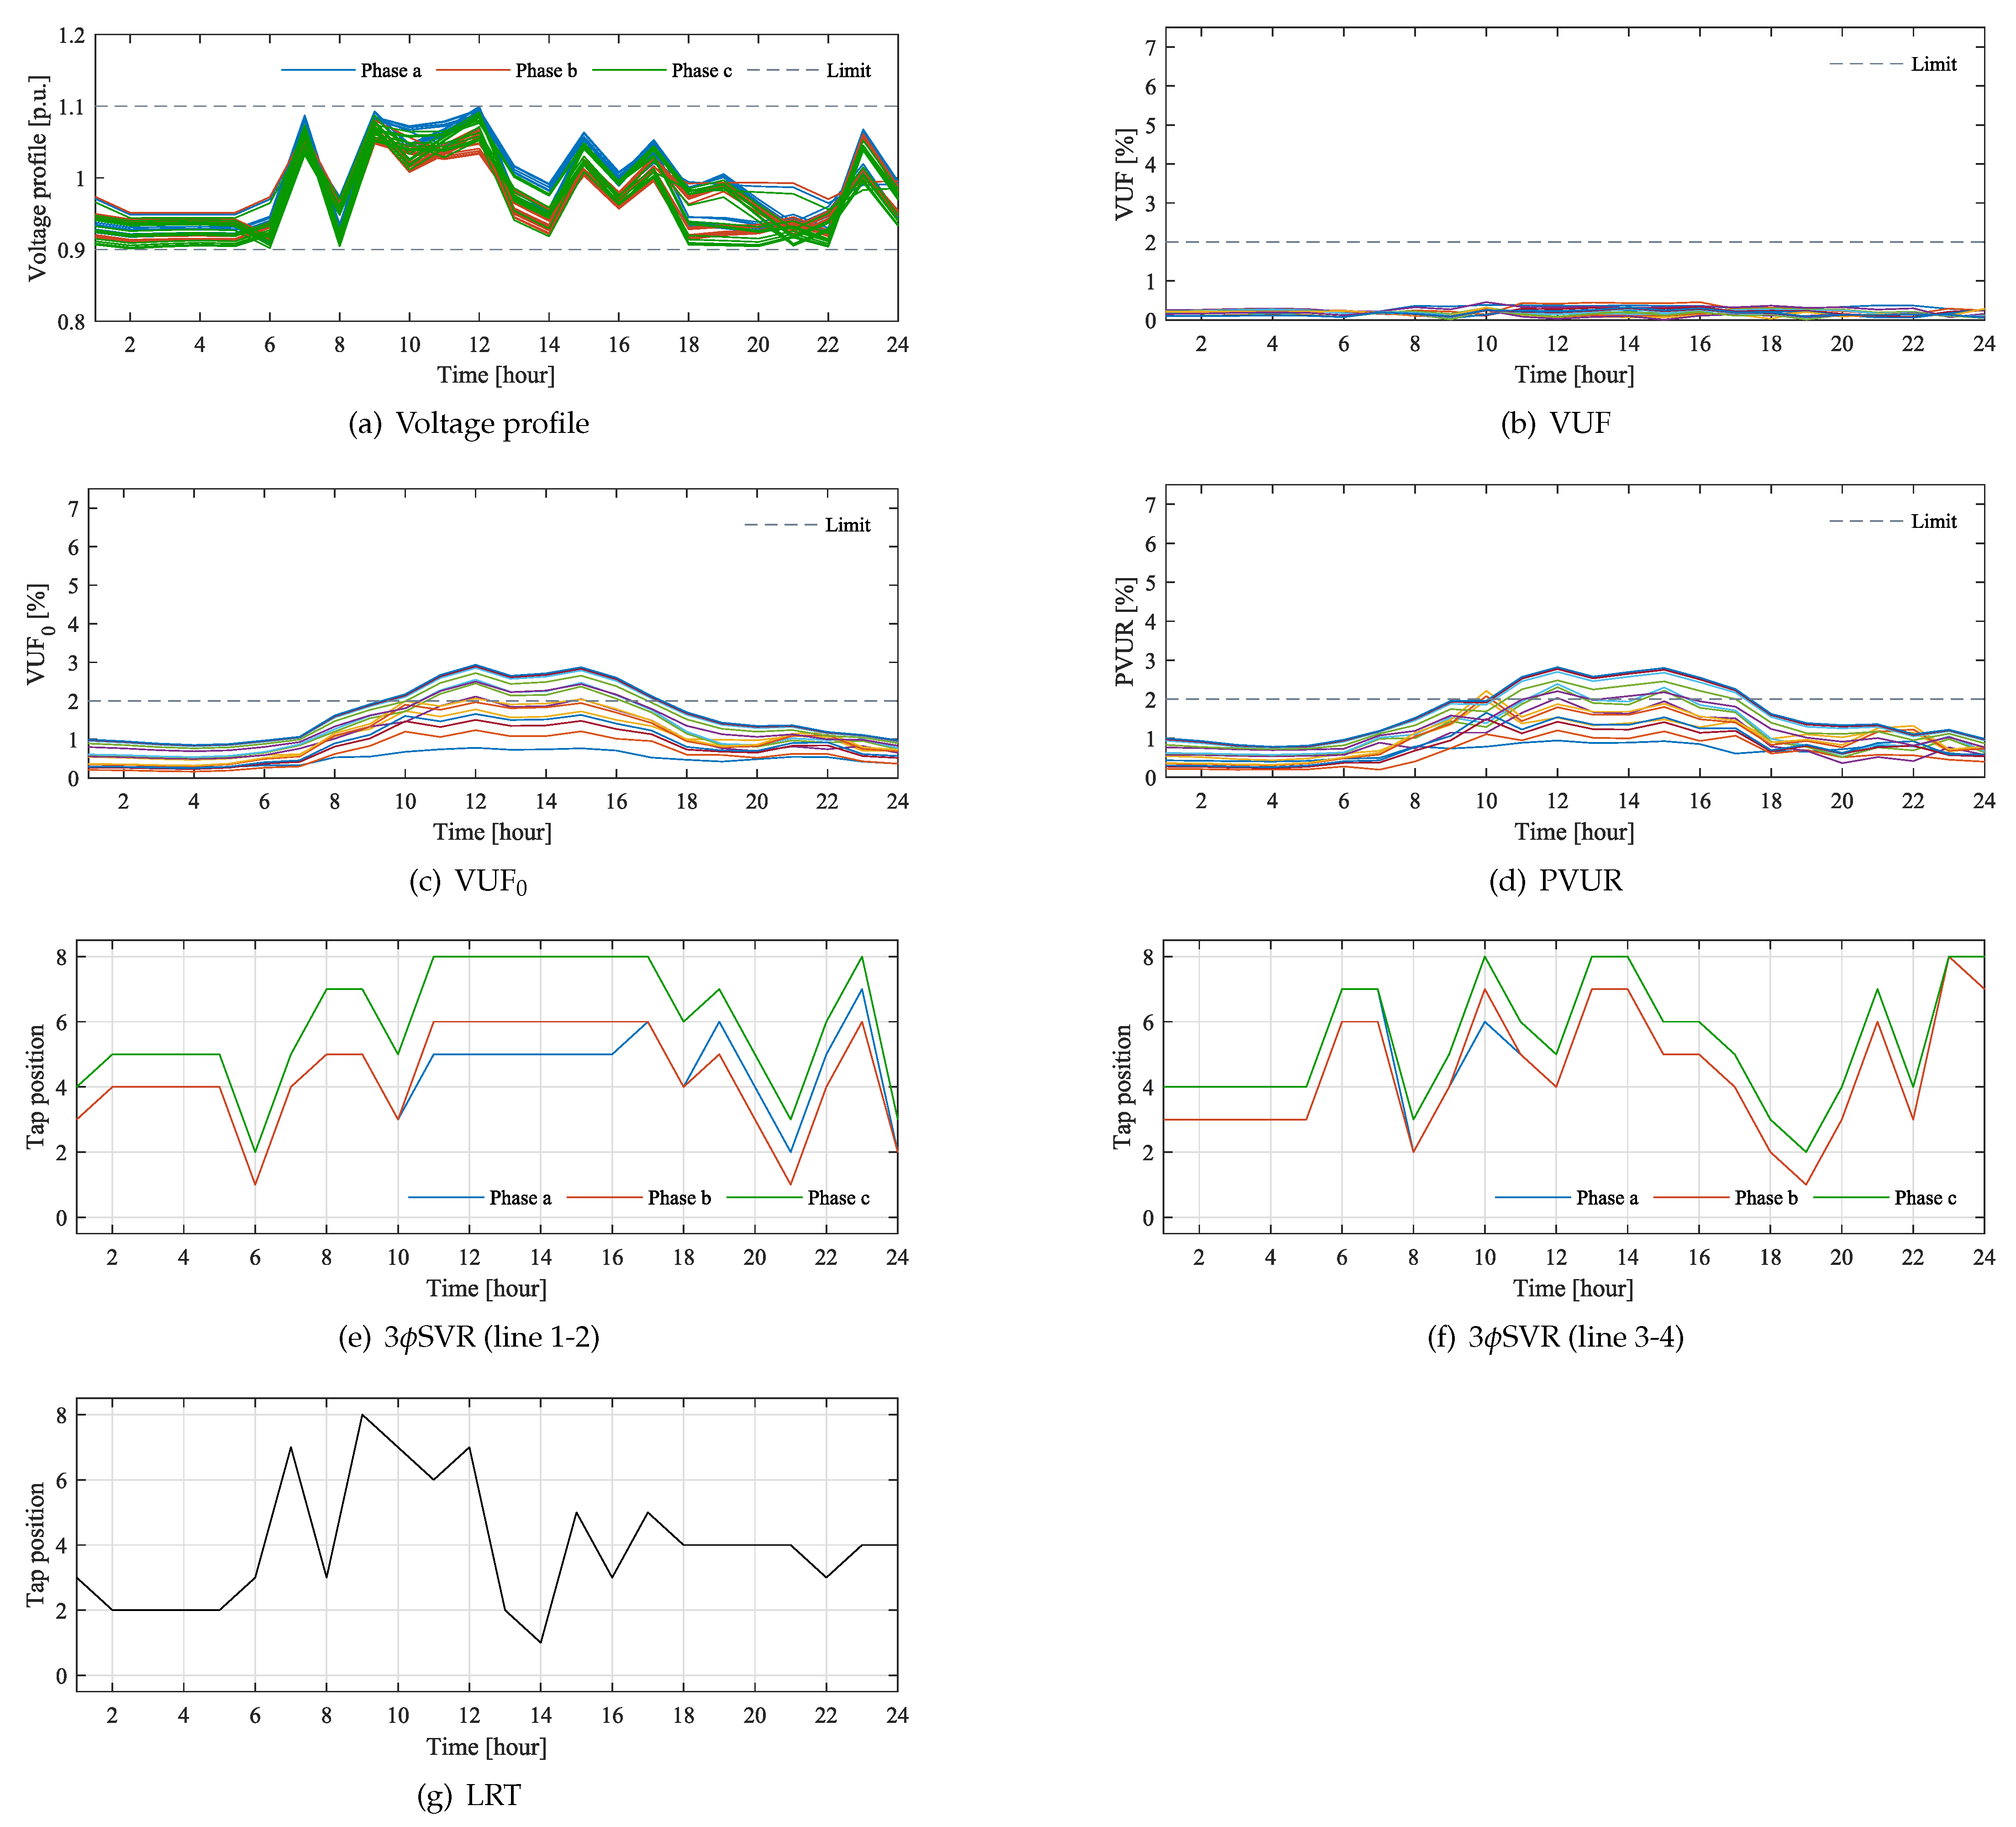
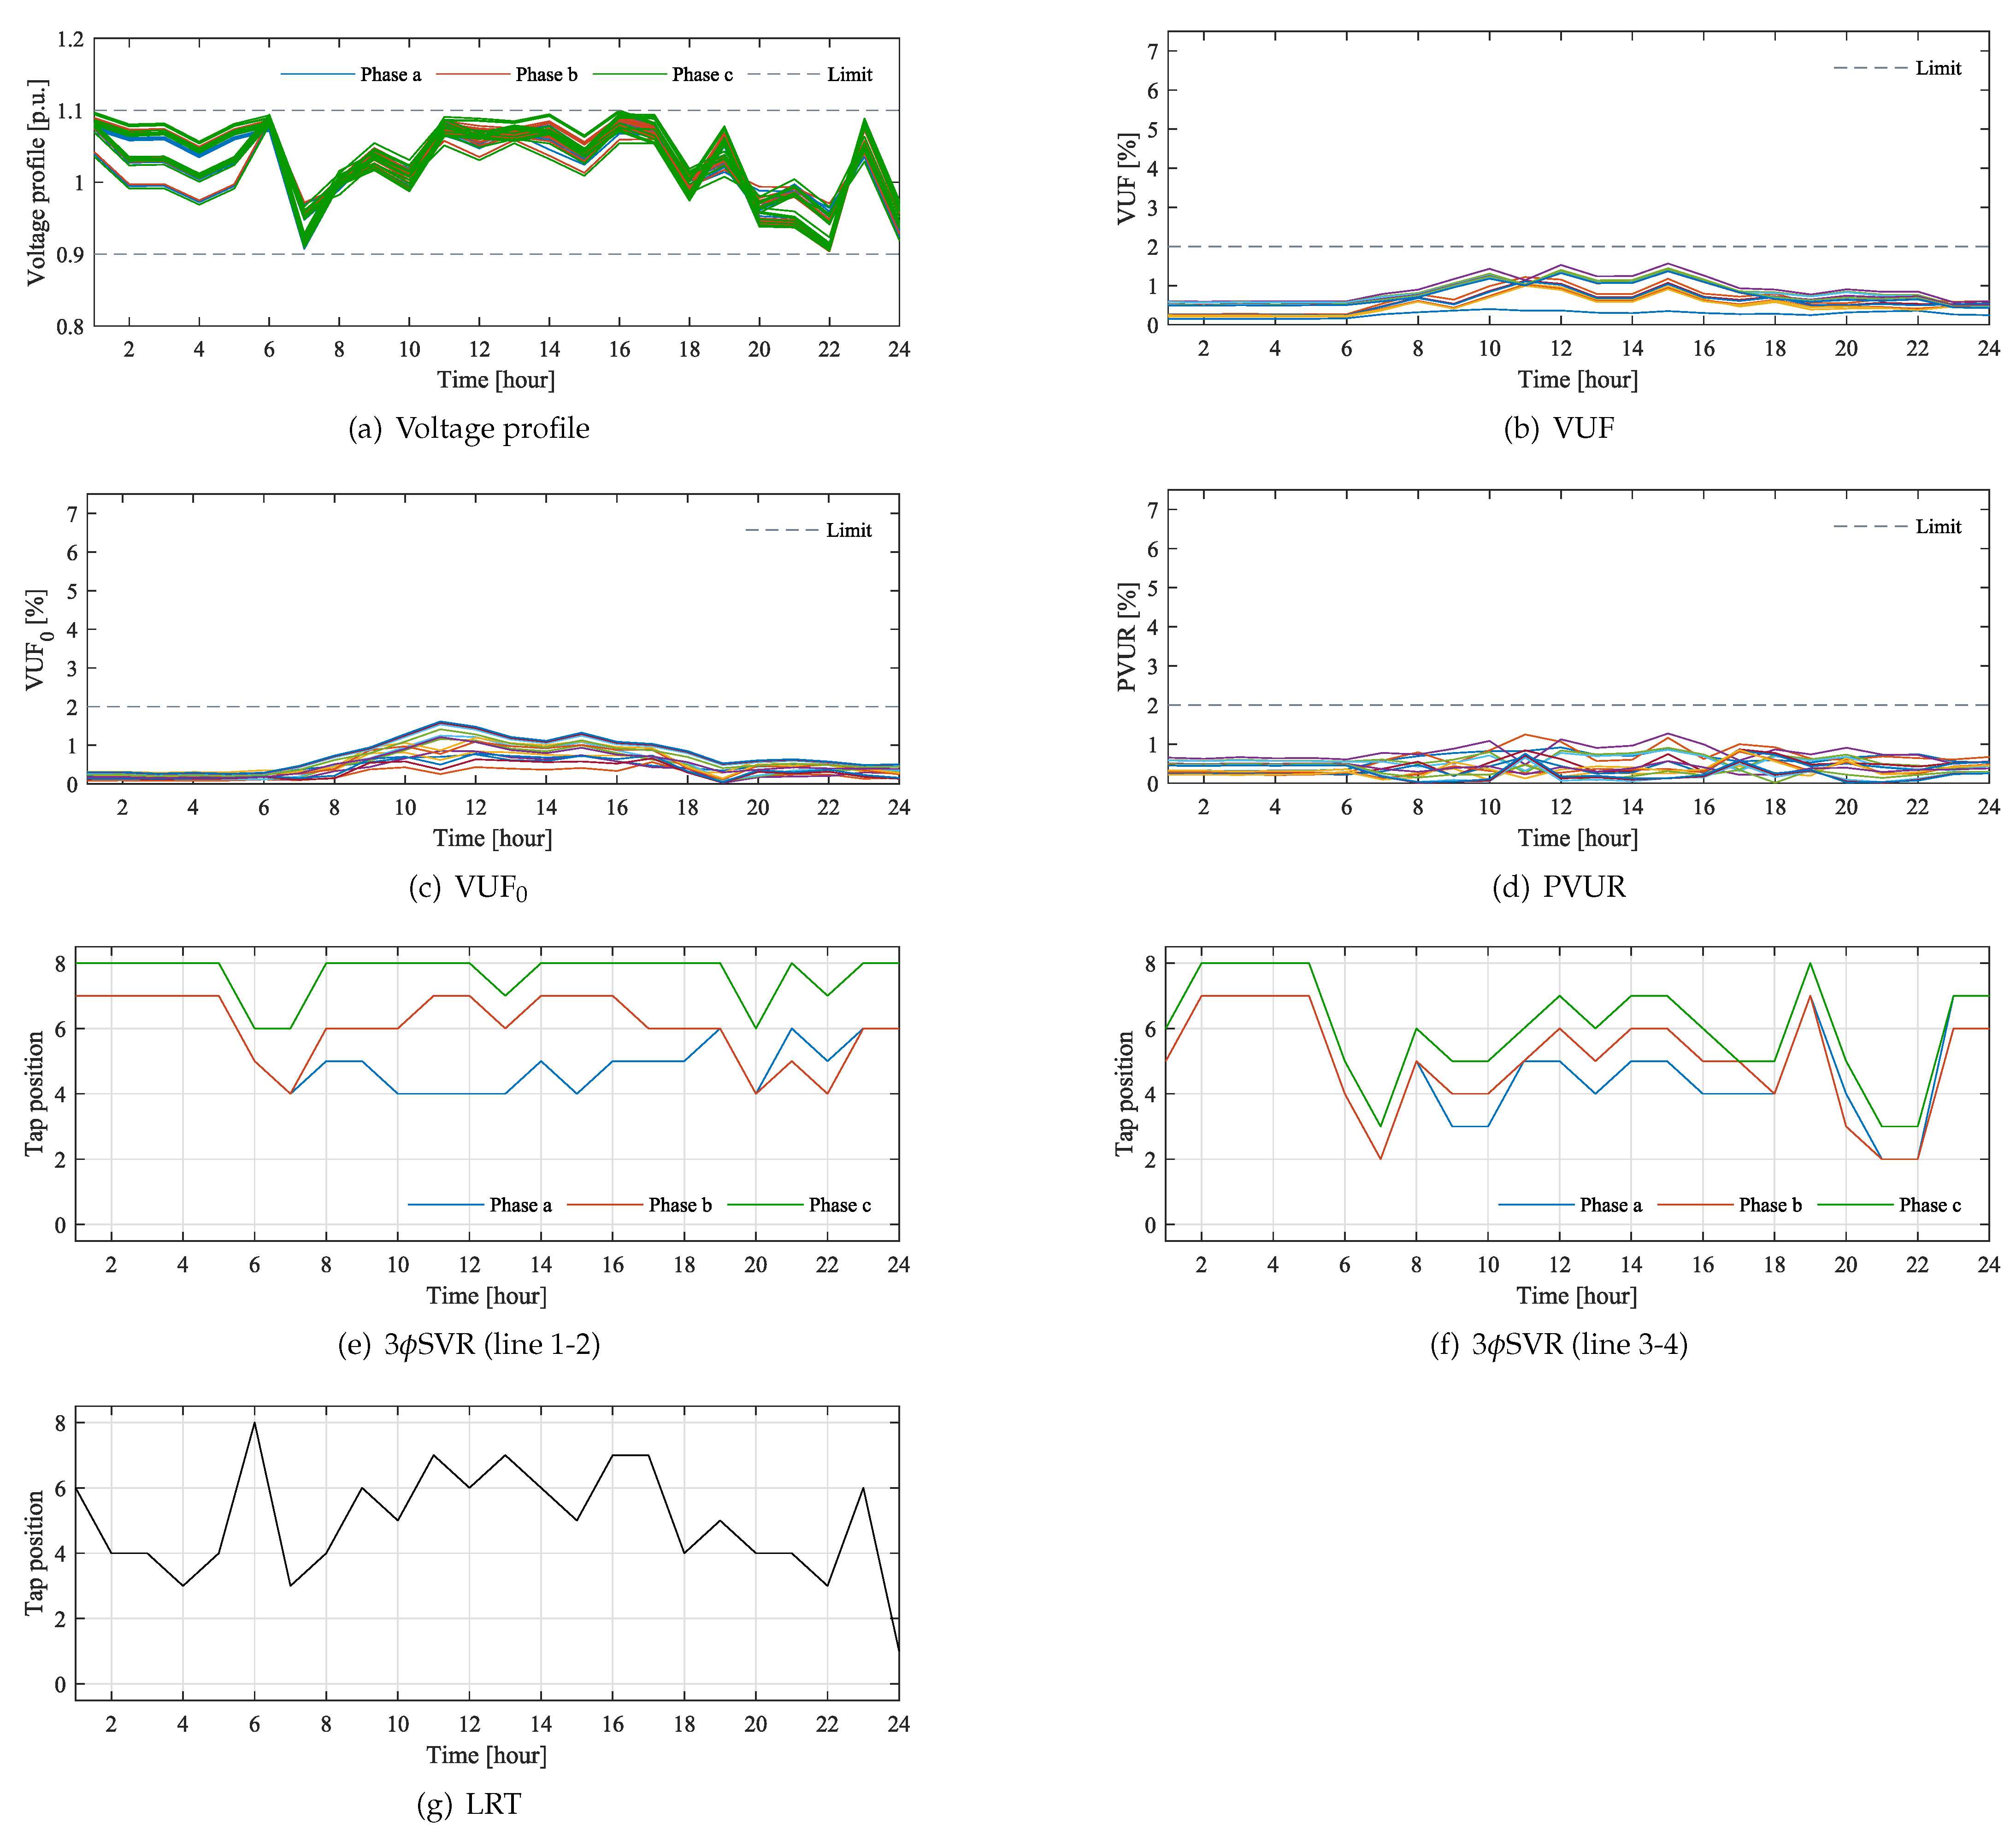
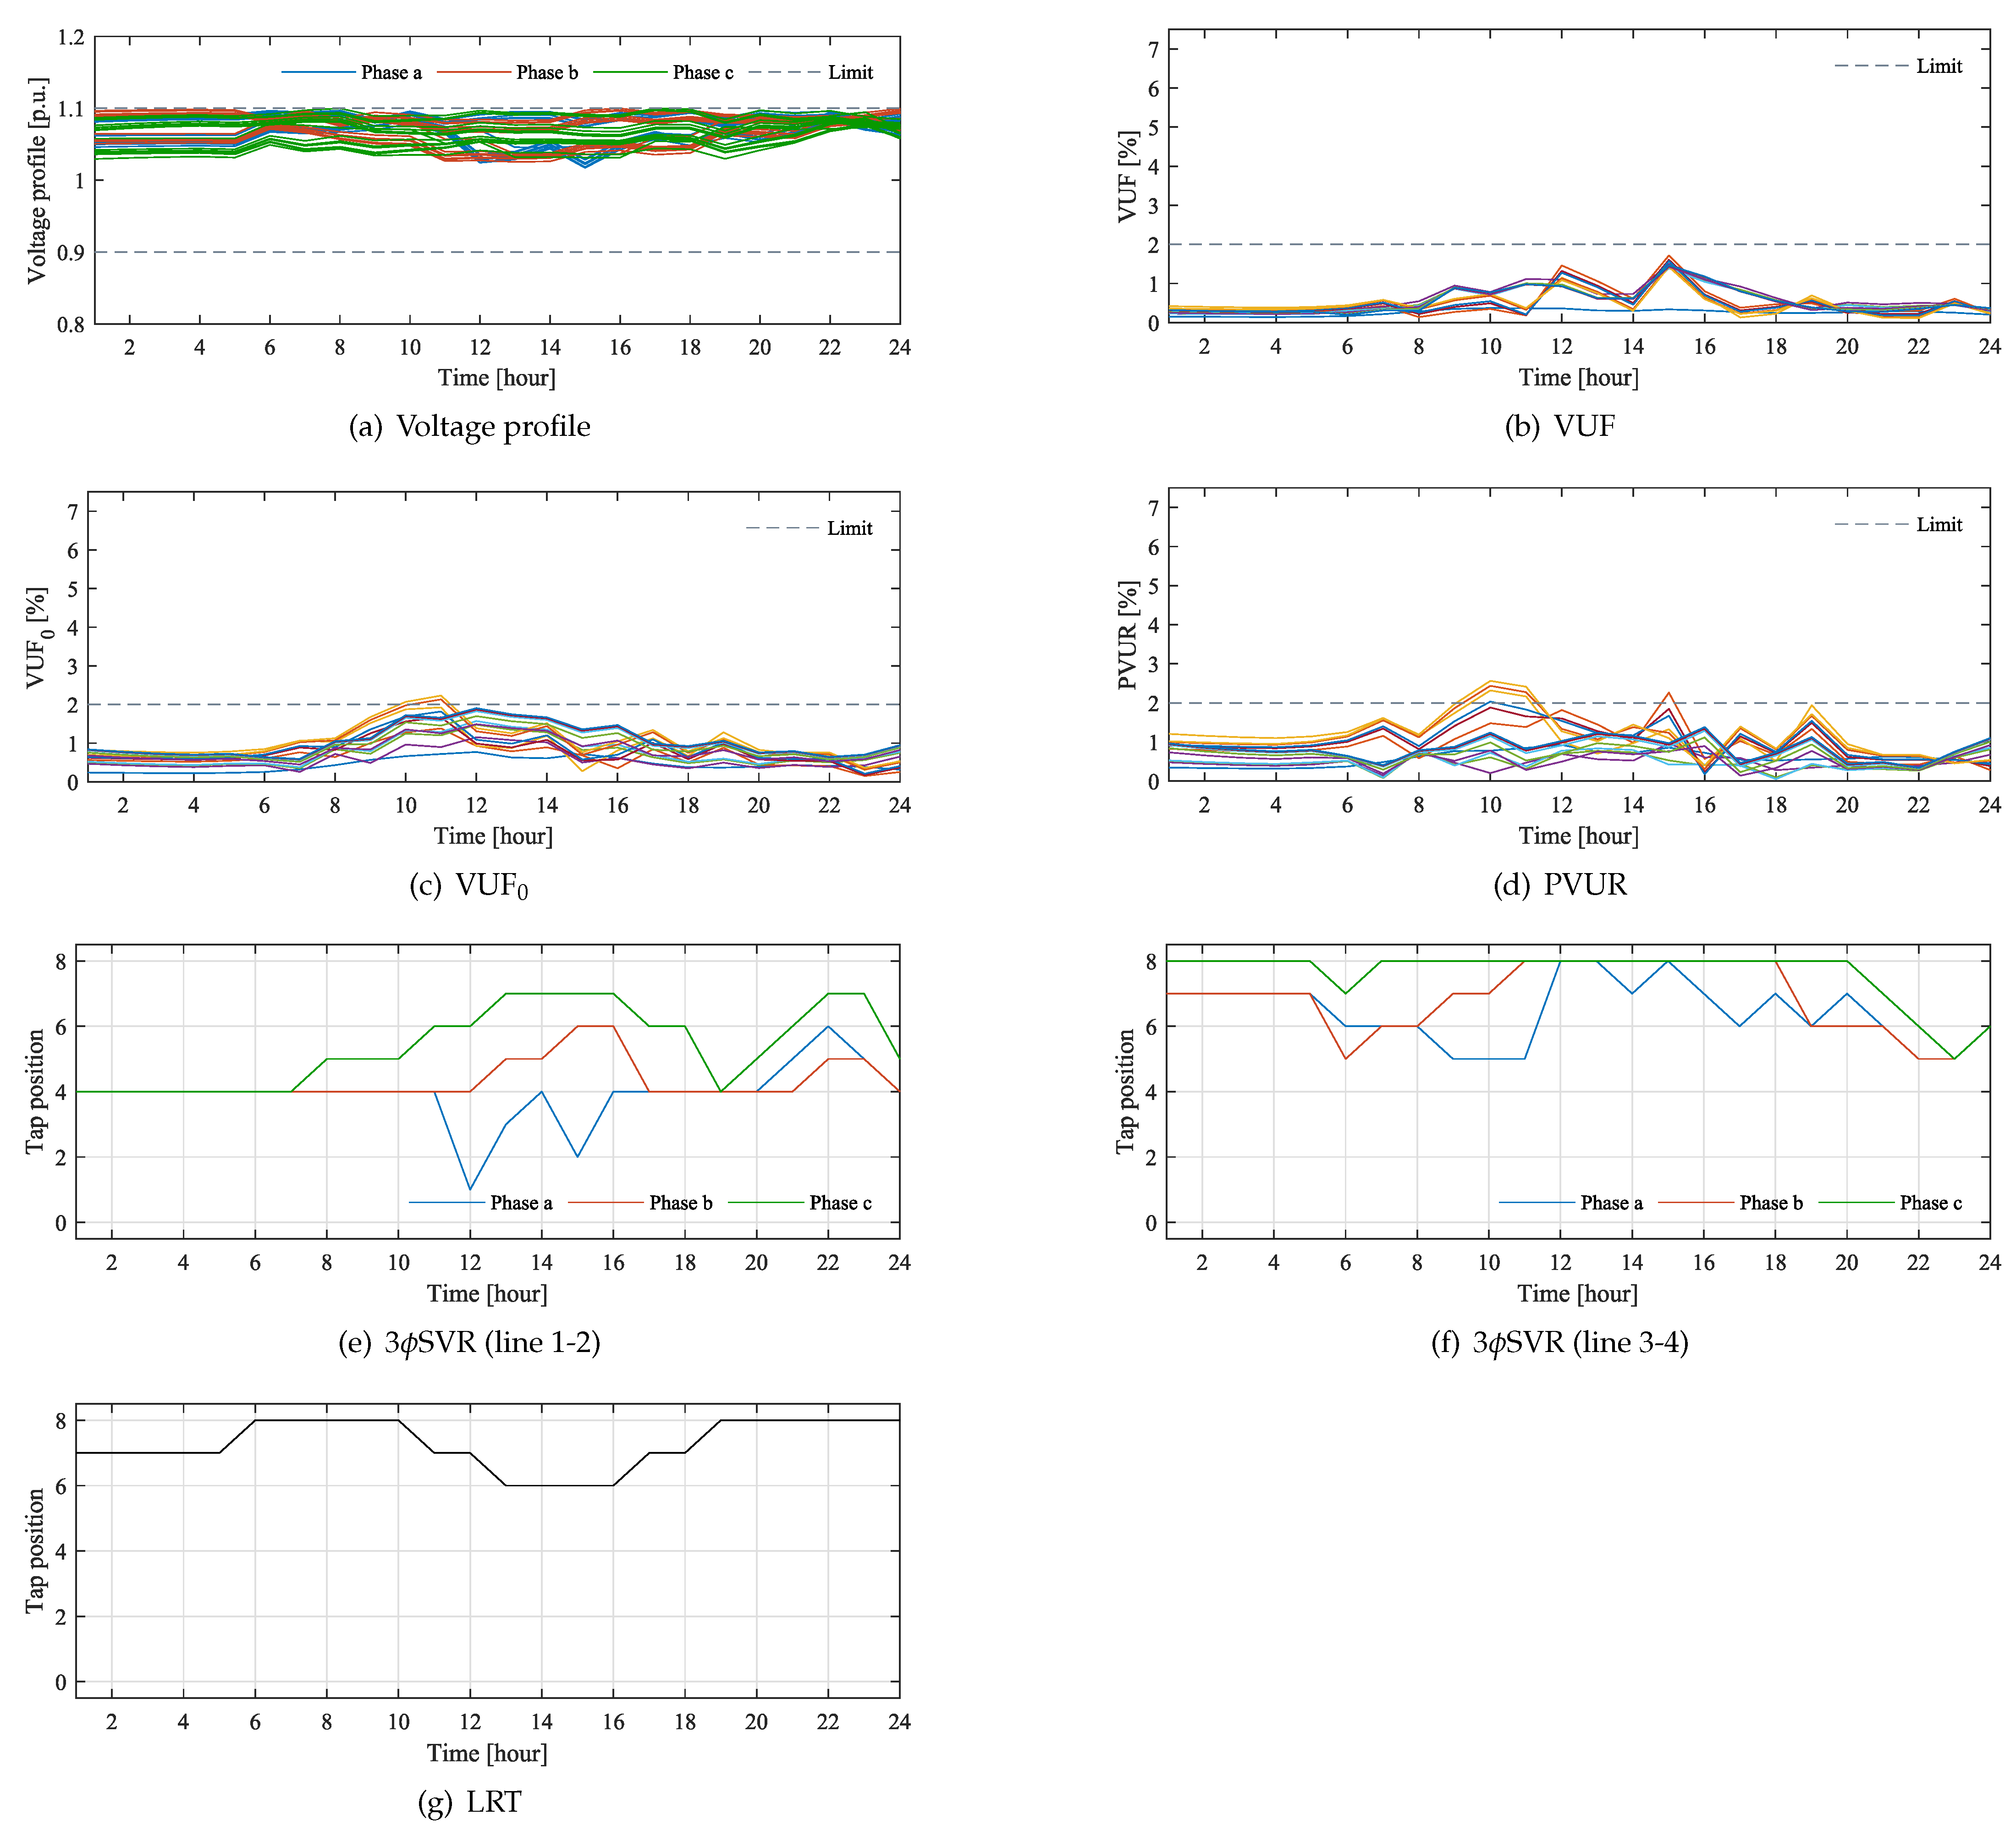
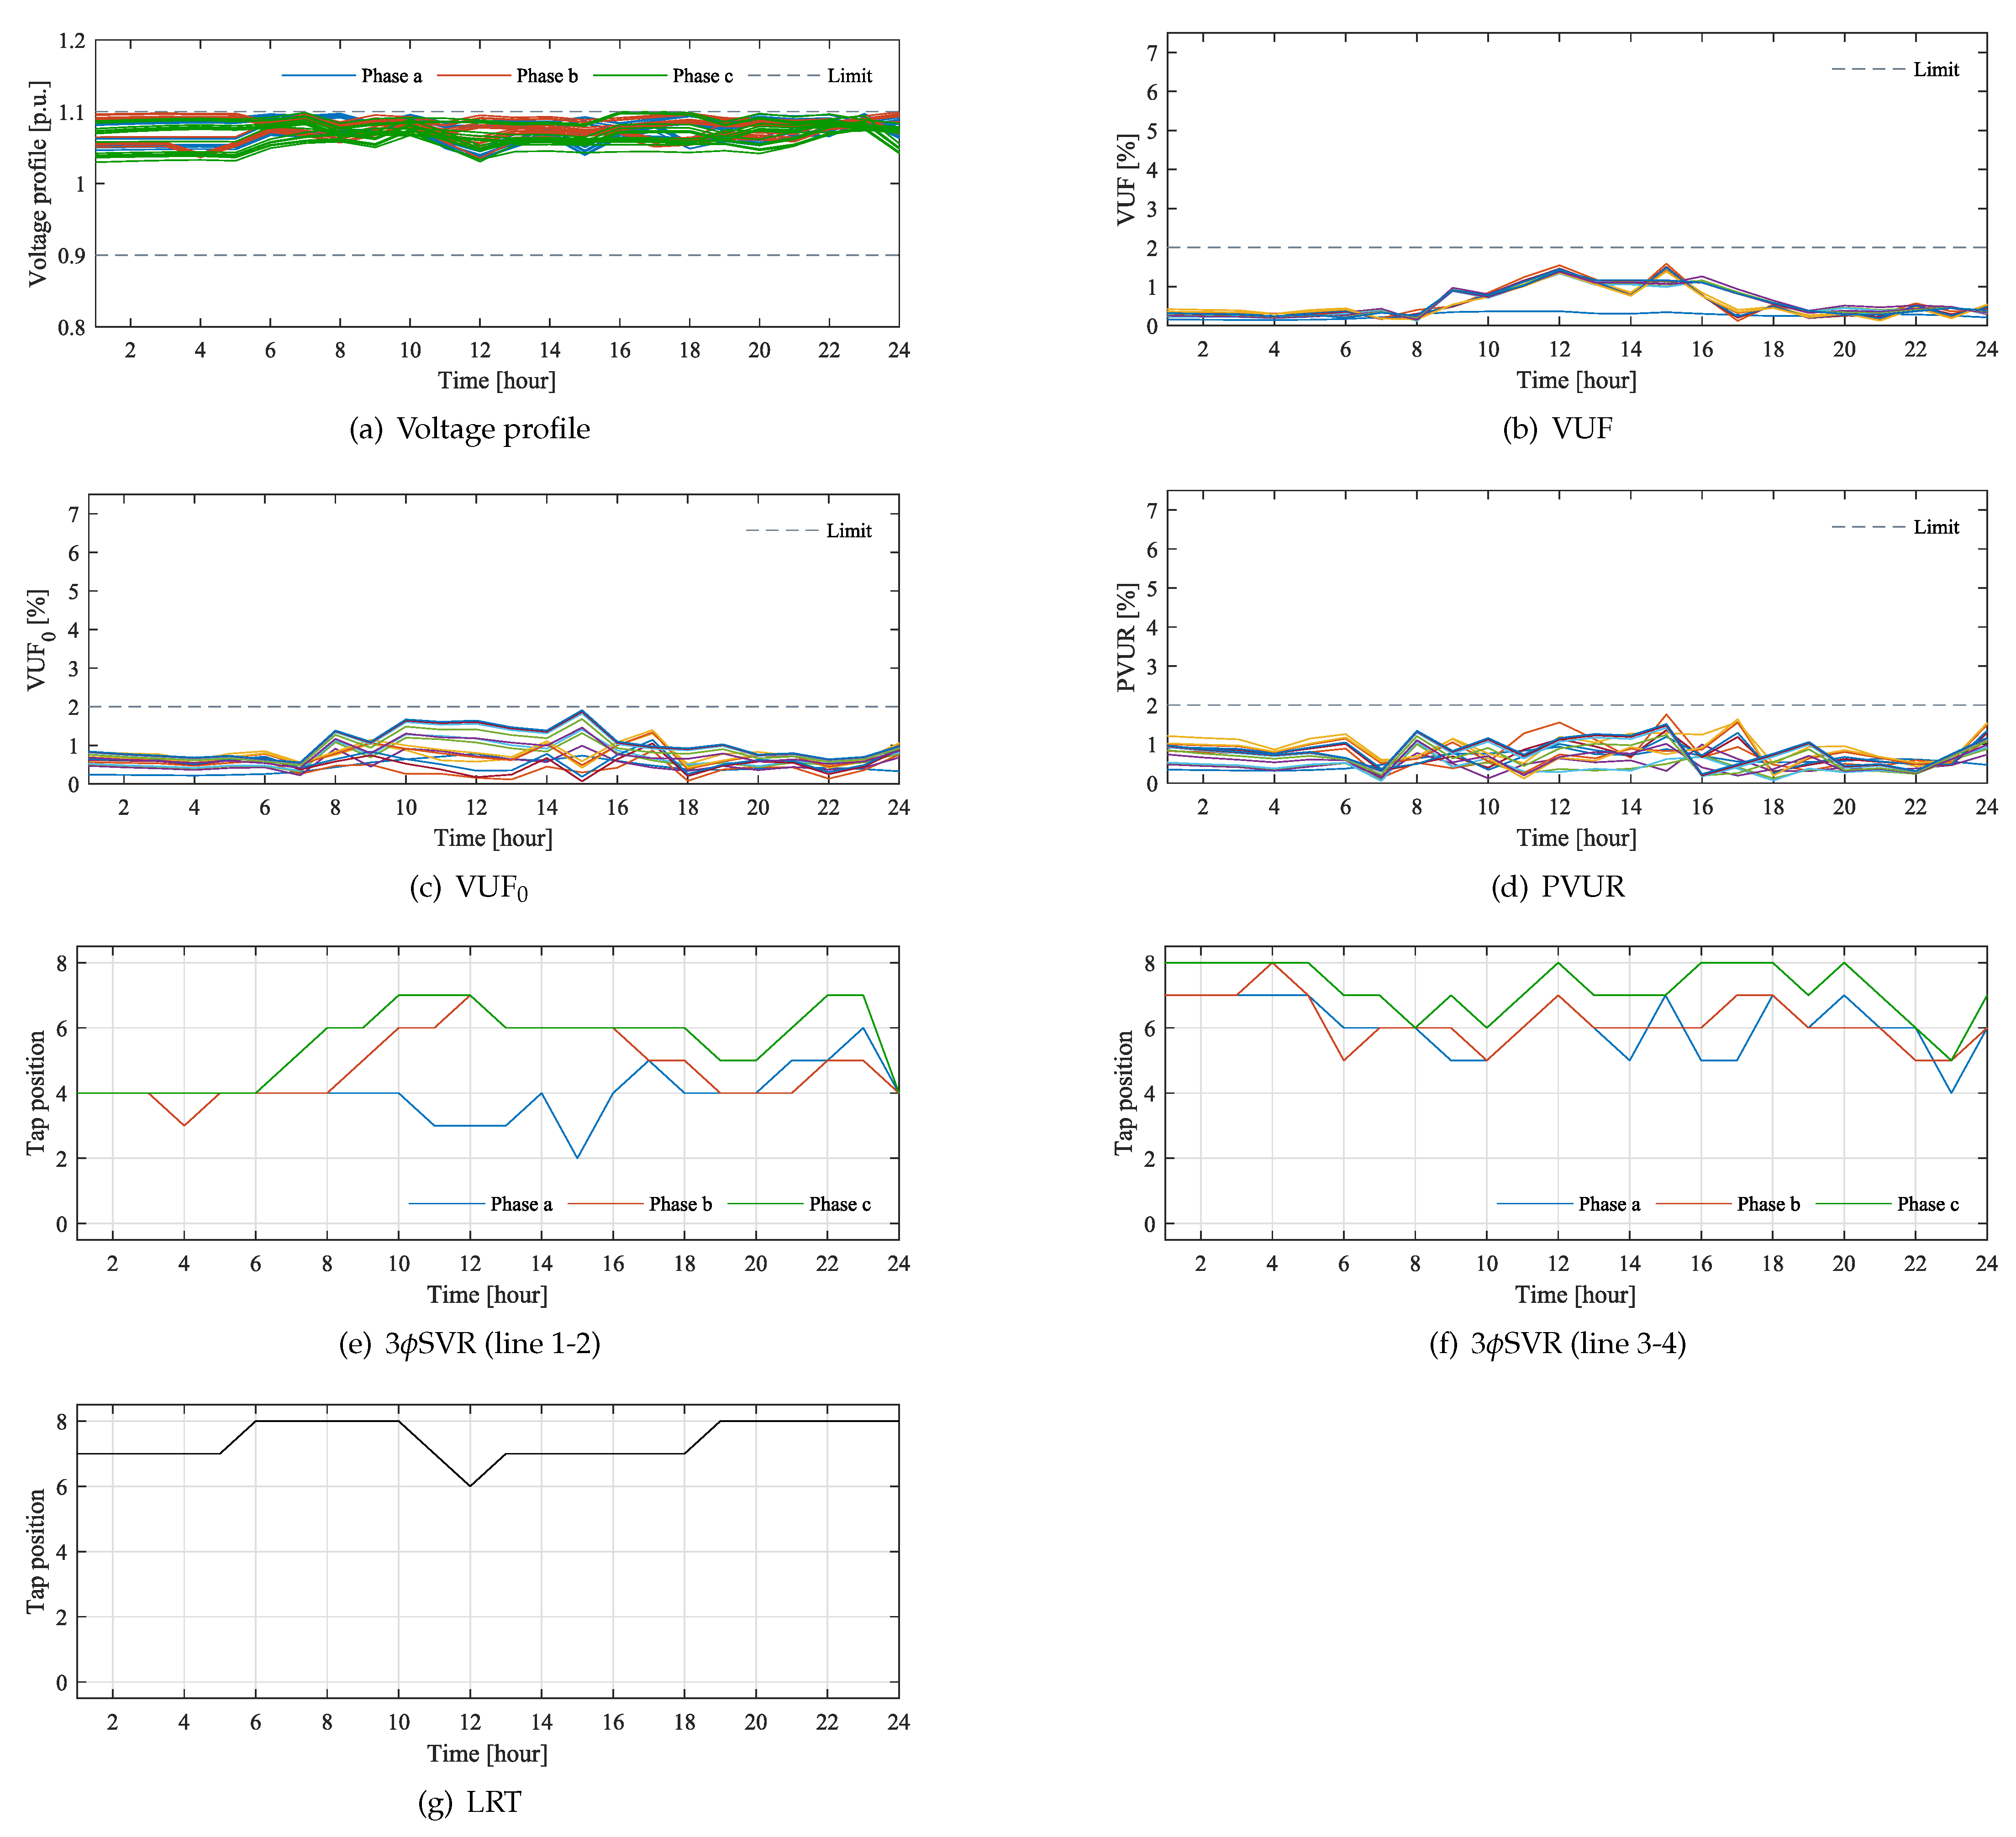
4.3. Case Study and Discussion
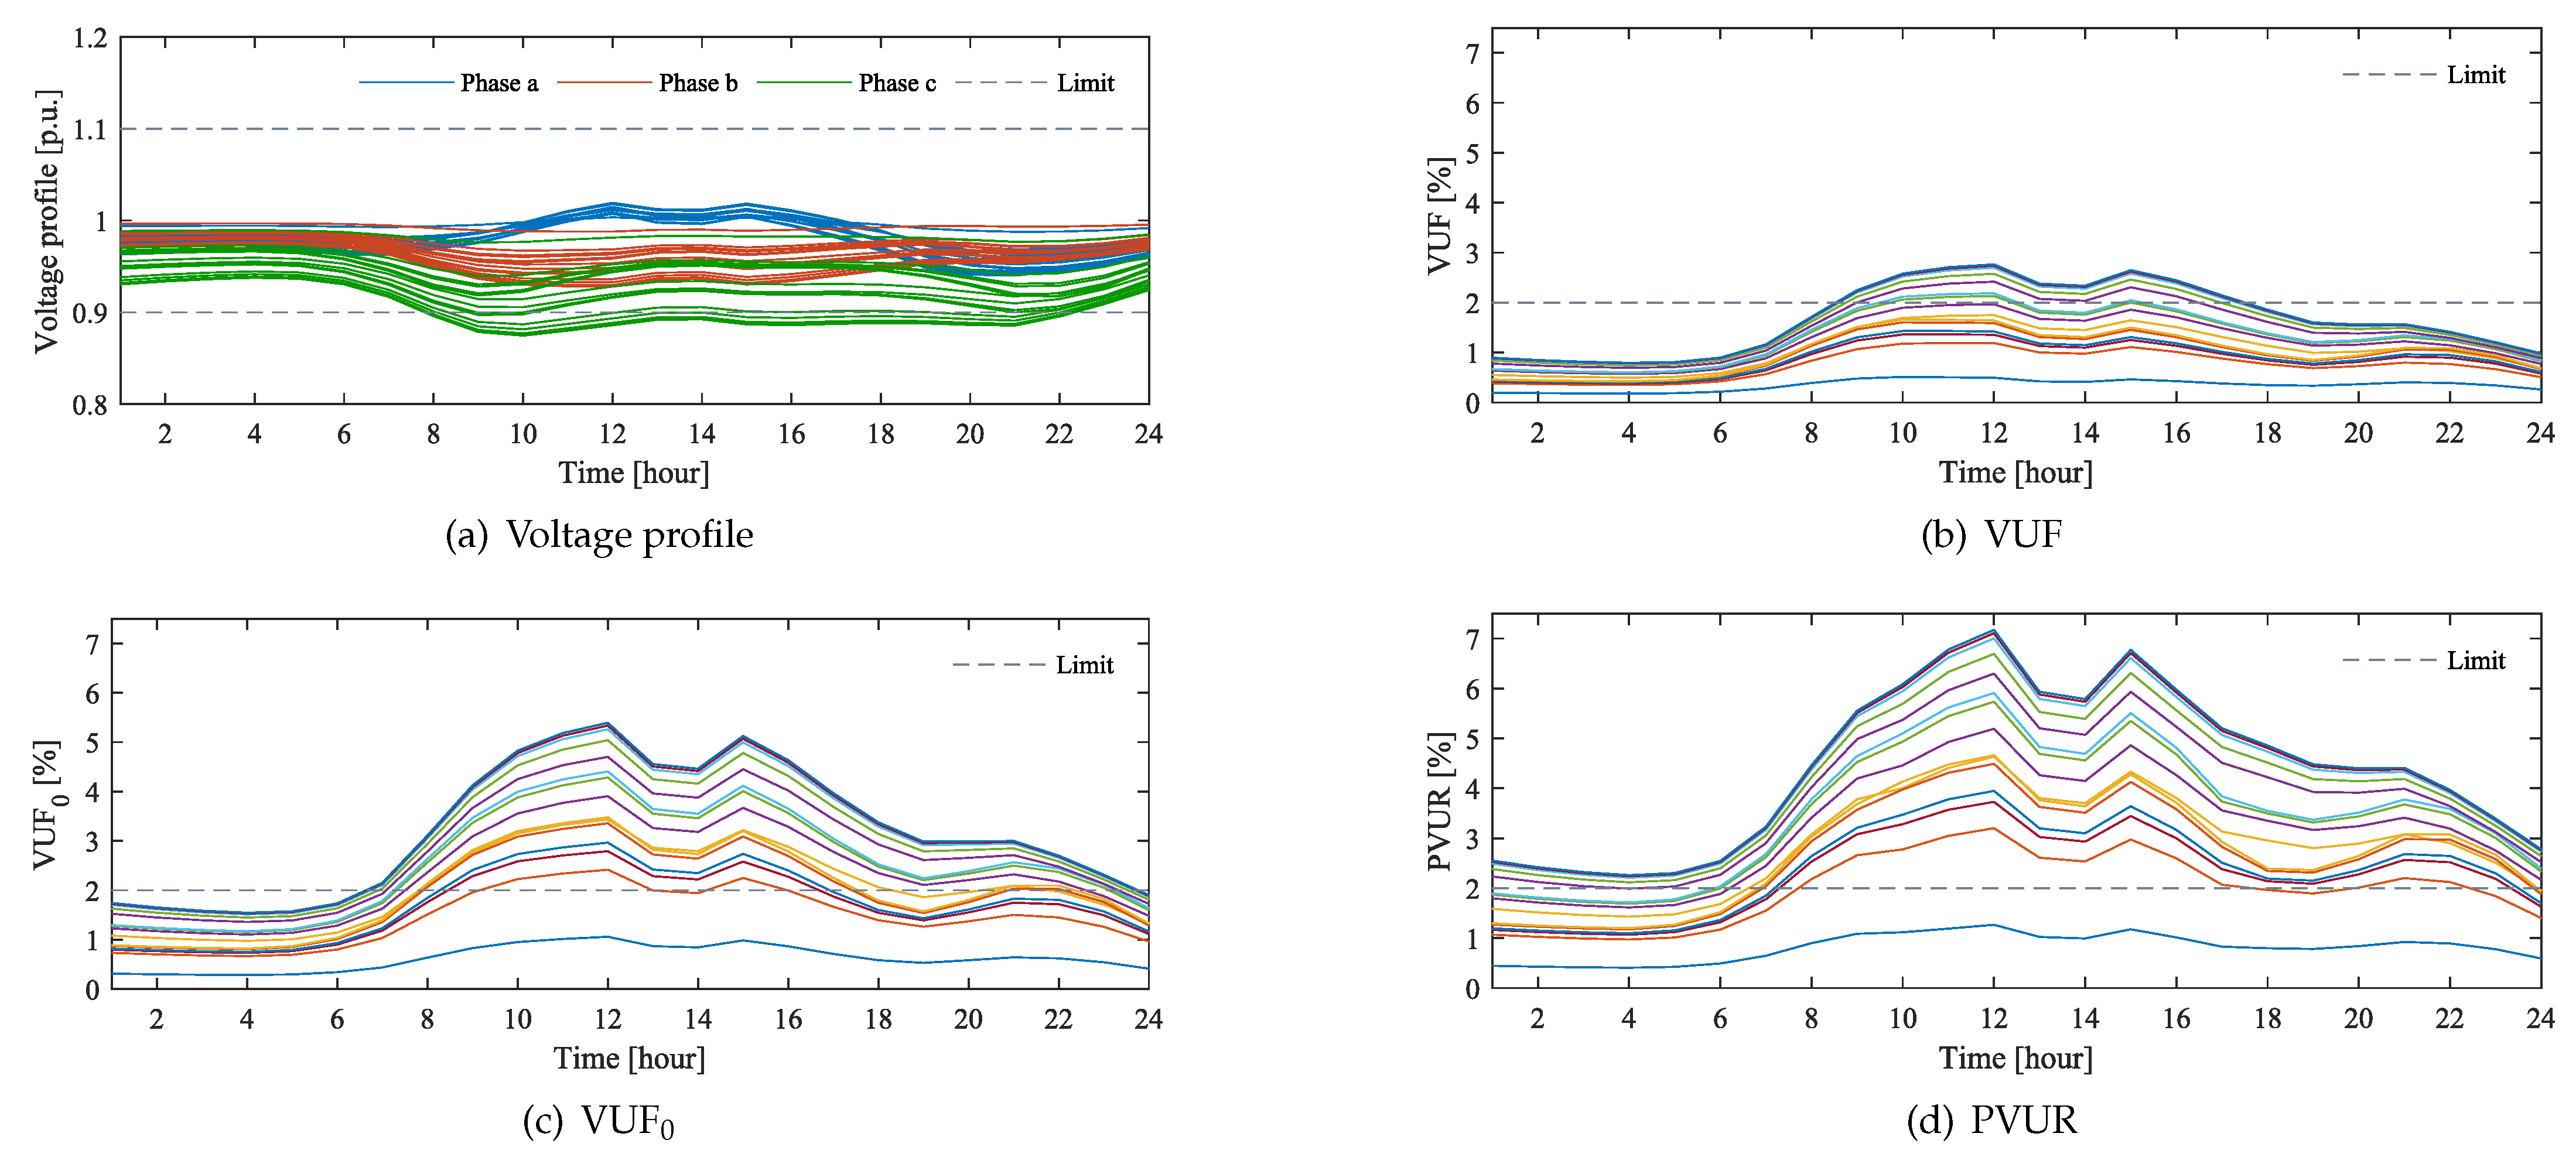
In this subsection, we discusss the simulation results of a base case and five cases that represent different formulations. The cases presented in this paper are listed below:
  • Base case
  • Case 1: minimize VUF
  • Case 2: minimize sum of all voltage unbalance metrics
  • Case 3: minimize losses
  • Case 4: minimize losses with voltage unbalance penalty
  • Case 5: minimize losses with voltage unbalance and tap operation penalty
Each of the cases solved each of the five optimization problems presented in Section 3. The optimization problem solutions are compared perspective of three different unbalance metrics, voltage deviations, network losses, and tap operations described in Section 2. In all cases, the voltage deviation rate is limited to VD lim = 10 % ; in Cases 4 and 5, the voltage unbalance limits are set to VUF lim = VUF 0 , lim = PVUF lim = 2 % ; in Case 5, the number of tap operations per day is limited as T lim = 5 . The results of unbalances, losses, and the number of tap operations for all cases is summarized in Table 1. Figure 4, Figure 5, Figure 6, Figure 7, Figure 8 and Figure 9 illustrates voltage profile, unbalance metrics, and tap operation for each case.
The simulation result for the Base case is shown in Figure 4, where no control devices are installed. In the Base case, there are critical voltage drops in phase c, and each unbalance metric during the day is much higher than the limits.
Figure 5 illustrates the solution for Case 1. In this case, the total VUF is minimized, and the VUF satisfies the constraint value for all-day. From Table 1, the VUF of Case 1 is the smallest among the cases in both maximum and total values. Furthermore, no voltage violation occurred. However, we observe that the maximum values of VUF 0 and PVUR are above 2%. This result implies that an optimization considering only specific metrics may violate the other metrics’ limits. Figure 6 illustrates the solution for Case 2. This case minimizes the total of VUF, VUF 0 , and PVUR for a day. We observe from Figure 6 and Table 1 that all unbalance metrics are less than 2% for all-day. On the other hand, Case 3 solved the optimization problem with the objective of loss minimization. The solution for Case 3 is shown in Figure 7. Note that unbalance compensation is not considered in Case 3. Table 1 shows that the total loss is the smallest among the cases. From Figure 7, we observe that all unbalance metrics considerably improves even though they are not taken into account. It seems to have occurred due to the concentration of the voltage of each phase near the upper limit. In addition, VUF is within 2% for all buses, but other metrics exceed 2% for few buses. It shows that loss minimization can significantly reduce the unbalance metrics, but unacceptable unbalance may remain depending on the network conditions. Therefore, the unbalance metrics should be explicitly monitored and incorporated in the optimization problem. In Case 4, the penalty constraint for voltage unbalance was added to the formulation of Case 3. Figure 8 illustrates the solution for Case 4. Figure 8 and Table 1 show that all unbalance metrics are below 2% for all-day, in exchange for a slight increase in losses than Case 3. Compared to Case 2, the total loss in Case 4 improves about 500 kWh, while the maximum values of all unbalance metrics are below 2%. This result shows that voltage unbalance and losses can be improved simultaneously by formulating an appropriate optimization problem. The formulations up to Cases 1–4 do not take into account the improvement of tap operations. Hence, the solutions of Cases 1–4 show the excessive or unbalanced operation of the 3 ϕ SVR and LRT taps. For example, in Case 3 and Case 4, only 3 ϕ SVR installed on line 3–4 operates intensively in the early morning hours. Moreover, Table 1 shows that the total number of tap operations per day is very high in Cases 1–4. In Case 5, the penalty constraints for the improvement of tap operations were added to the formulation of Case 4. Figure 9 illustrates the solution of Case 5. Similar to Case 4, the maximum values of all unbalance metrics are less than 2% throughout the day. Compared to Case 4, there is a slight increase in losses, but the taps of all devices are operated evenly. In addition, the taps in all phases of devices operate five times or less per day. The results of Case 5 show that introducing 3 ϕ SVRs and proper formulation can improve multiple issues such as voltage unbalances, voltage deviations, network losses, and tap operations simultaneously.

5. Conclusions

This paper aimed to verify the voltage unbalance compensation by optimal tap operation scheduling of 3 ϕ SVRs and LRT. In the formulations of the optimization problems, multiple voltage unbalance metrics as well as network losses, voltage deviations, and cooperative tap operations were considered. In order to investigate the mutual influence between voltage unbalance and these issues, five optimization problems were formulated. The case study showed that minimizing only VUF does not satisfy the VUF 0 and PVUR limits. It implies the need for comprehensive consideration of multiple voltage unbalance metrics. The results obtained when minimizing losses subject to the voltage unbalance constraints showed that it is possible to obtain a low losses solution without violating any voltage unbalance metrics. Furthermore, the results obtained in the final formulation demonstrated that it is possible to significantly improve the network losses and tap operations while satisfying the voltage unbalance and deviation limits. Therefore, we conclude that with an appropriate formulation, 3 ϕ SVR and LRT can be properly coordinated to compensate for voltage unbalance while taking other issues into account.
Because this paper focused on the unbalance compensation using 3 ϕ SVRs and LRT, active and reactive power supports by distributed energy resources are omitted. However, the integrated control of these will significantly improve voltage unbalances even if more severe unbalanced conditions, and it is our future work in progress.

Author Contributions

Conceptualization, A.N. and T.S.; methodology, A.N.; software, A.N.; validation, A.N., R.S. and T.S.; formal analysis, N.K., A.M.H. and H.T.; investigation, A.N.; resources, R.S.; data curation, A.N.; writing—original draft preparation, A.N.; writing—review and editing, T.K.; visualization, N.K., A.M.H., and H.T.; supervision, T.K. and T.S.; project administration, T.S. All authors have read and agreed to the published version of the manuscript.

Funding

This research received no external funding.

Conflicts of Interest

The authors declare no conflict of interest.

References

  1. Biryulin, V.I.; Kudelina, D.V.; Larin, O.M. Electricity Quality Problems in the 0.4 kV City Electric Networks. In Proceedings of the 2020 International Conference on Industrial Engineering, Applications and Manufacturing (ICIEAM), Sochi, Russia, 18–22 May 2020; pp. 1–6. [Google Scholar] [CrossRef]
  2. Ma, K.; Fang, L.; Kong, W. Review of distribution network phase unbalance: Scale, causes, consequences, solutions, and future research directions. CSEE J. Power Energy Syst. 2020, 6, 479–488. [Google Scholar] [CrossRef]
  3. Shahnia, F.; Majumder, R.; Ghosh, A.; Ledwich, G.; Zare, F. Voltage imbalance analysis in residential low voltage distribution networks with rooftop PVs. Electr. Power Syst. Res. 2011, 81, 1805–1814. [Google Scholar] [CrossRef]
  4. Schwanz, D.; Moller, F.; Ronnberg, S.K.; Meyer, J.; Bollen, M.H. Stochastic Assessment of Voltage Unbalance Due to Single-Phase-Connected Solar Power. IEEE Trans. Power Deliv. 2017, 32, 852–861. [Google Scholar] [CrossRef]
  5. Jabalameli, N.; Masoum, M.A.; Deilami, S. Optimal online charging of plug-in electric vehicles considering voltage unbalance factor. In Proceedings of the IEEE Power and Energy Society General Meeting, Portland, OR, USA, 5–9 August 2018; IEEE Computer Society: Washington, DC, USA, 2018; pp. 1–5. [Google Scholar] [CrossRef]
  6. Helm, S.; Hauer, I.; Wolter, M.; Wenge, C.; Balischewski, S.; Komarnicki, P. Impact of unbalanced electric vehicle charging on low-voltage grids. In Proceedings of the 2020 IEEE PES Innovative Smart Grid Technologies Europe (ISGT-Europe), Delft, The Netherlands, 26–28 October 2020; Institute of Electrical and Electronics Engineers (IEEE): New York, NY, USA, 2020; pp. 665–669. [Google Scholar] [CrossRef]
  7. Li, C.; Disfani, V.R.; Haghi, H.V.; Kleissl, J. Optimal Voltage Regulation of Unbalanced Distribution Networks with Coordination of OLTC and PV Generation. In Proceedings of the 2019 IEEE Power & Energy Society General Meeting (PESGM); Institute of Electrical and Electronics Engineers (IEEE): New York, NY, USA, 2019; pp. 1–5. [Google Scholar] [CrossRef] [Green Version]
  8. De Araujo, L.R.; Penido, D.R.R.; Carneiro, S.; Pereira, J.L.R. Optimal unbalanced capacitor placement in distribution systems for voltage control and energy losses minimization. Electr. Power Syst. Res. 2018, 154, 110–121. [Google Scholar] [CrossRef]
  9. Othman, M.M.; El-Khattam, W.; Hegazy, Y.G.; Abdelaziz, A.Y. Optimal placement and sizing of voltage controlled distributed generators in unbalanced distribution networks using supervised firefly algorithm. Int. J. Electr. Power Energy Syst. 2016, 82, 105–113. [Google Scholar] [CrossRef]
  10. Dahal, S.; Salehfar, H. Impact of distributed generators in the power loss and voltage profile of three phase unbalanced distribution network. Int. J. Electr. Power Energy Syst. 2016, 77, 256–262. [Google Scholar] [CrossRef]
  11. IEC 6100-2-2, EMC Part 2-2: Environment—Compatibility Levels for Low-Frequency Conducted Disturbances and Signalling in Public Low-Voltage Power Supply Systems. 2002. Available online: https://webstore.iec.ch/publication/4133 (accessed on 20 May 2021).
  12. IEEE. IEEE Recommended Practice for Electric Power Distribution for Industrial Plants. In IEEE Std 141-1993; IEEE: New York, NY, USA, 1994; pp. 1–768. [Google Scholar] [CrossRef]
  13. NEMA. NEMA Standard for motors and generators. In NEMA Standard MG1; NEMA: Arlington, VA, USA, 1993. [Google Scholar]
  14. Carpinelli, G.; Mottola, F.; Proto, D.; Varilone, P. Minimizing unbalances in low-voltage microgrids: Optimal scheduling of distributed resources. Appl. Energy 2017, 191, 170–182. [Google Scholar] [CrossRef]
  15. Girigoudar, K.; Roald, L.A. On the impact of different voltage unbalance metrics in distribution system optimization. Electr. Power Syst. Res. 2020, 189, 106656. [Google Scholar] [CrossRef]
  16. Shigenobu, R.; Nakadomari, A.; Hong, Y.Y.; Mandal, P.; Takahashi, H.; Senjyu, T. Optimization of voltage unbalance compensation by smart inverter. Energies 2020, 13, 4623. [Google Scholar] [CrossRef]
  17. Rahman, M.M.; Arefi, A.; Shafiullah, G.M.; Hettiwatte, S. A new approach to voltage management in unbalanced low voltage networks using demand response and OLTC considering consumer preference. Int. J. Electr. Power Energy Syst. 2018, 99, 11–27. [Google Scholar] [CrossRef]
  18. Bedawy, A.; Yorino, N.; Mahmoud, K. Management of voltage regulators in unbalanced distribution networks using voltage/tap sensitivity analysis. In Proceedings of the 2018 International Conference on Innovative Trends in Computer Engineering, ITCE 2018, Aswan, Egypt, 19–21 February 2018; IEEE: New York, NY, USA, 2018; pp. 363–367. [Google Scholar] [CrossRef]
  19. Hu, J.; Marinelli, M.; Coppo, M.; Zecchino, A.; Bindner, H.W. Coordinated voltage control of a decoupled three-phase on-load tap changer transformer and photovoltaic inverters for managing unbalanced networks. Electr. Power Syst. Res. 2016, 131, 264–274. [Google Scholar] [CrossRef] [Green Version]
  20. Zhang, Y.; Srivastava, A. Voltage Control Strategy for Energy Storage System in Sustainable Distribution System Operation. Energies 2021, 14, 832. [Google Scholar] [CrossRef]
  21. Glover, F. Tabu Search―Part I. ORSA J. Comput. 1989, 1, 190–206. [Google Scholar] [CrossRef] [Green Version]
  22. Shigenobu, R.; Noorzad, A.S.; Yona, A.; Senjyu, T. Multi-objective optimisation of step voltage regulator operation and optimal placement for distribution systems design using linkage combination update-non-dominated sorting genetic algorithm-II. IET Gener. Transm. Distrib. 2018, 12, 20–30. [Google Scholar] [CrossRef]
Figure 1. Flowchart of the applied tabu search.
Energies 14 02997 g001
Figure 2. The configuration of the distribution system model; 3 ϕ SVRs are installed on line 1–2 and line 3–4.
Energies 14 02997 g002
Figure 3. Load profile of each area and PV output; the load profiles is extended as three-phase unbalanced loads by decreasing 20% in phase b and increasing 20% in phase c. PV is installed only in phase a.
Energies 14 02997 g003
Figure 4. Simulation result of Base case; the different colors in (bd) refer to different buses. There is a critical voltage drop in phase c, and each unbalance metric during the day is much higher than the limit.
Energies 14 02997 g004
Figure 5. Simulation result of Case 1: minimize VUF; the different colors in (bd) refer to different buses. The VUF satisfies the constraint value for all-day, but the maximum values of VUF 0 and PVUR are above 2%.
Energies 14 02997 g005
Figure 6. Simulation result of Case 2: minimize sum of all voltage unbalance metrics; the different colors in (bd) refer to different buses. All unbalance metrics are less than 2% for all-day.
Energies 14 02997 g006
Figure 7. Simulation result of Case 3: minimize losses; the different colors in (bd) refer to different buses. All unbalance metrics considerably improves even though they are not taken into account; VUF is within 2% for all buses, but other metrics exceed 2% for few buses.
Energies 14 02997 g007
Figure 8. Simulation result of Case 4: minimize losses with voltage unbalance penalty; the different colors in (bd) refer to different buses. Similar to Case 2, all unbalance metrics are less than 2% for all-day.
Energies 14 02997 g008
Figure 9. Simulation result of Case 5: minimize losses with voltage unbalance and tap operation penalty; the different colors in (bd) refer to different buses. All unbalance metrics are less than 2% for all-day while the taps of all devices are operated evenly.
Energies 14 02997 g009
Table 1. Simulation results of unbalances, losses, and tap operations for all cases; the smallest values are shown in bold, and overlimit values are shaded.
Base CaseCase 1Case 2Case 3Case 4Case 5
Max tap count-383915195
Total tap count-236169668423
Max loss (kWh)422.93412.31406.87328.36328.36328.79
Total loss (kWh)629157145244470847364860
Max VUF (%)2.76460.45751.56341.71741.58471.5282
Total VUF 42970241183199174
Max VUF 0 (%)5.39322.93441.61602.23151.90951.7794
Total VUF 0 821423186304264290
Max PVUR (%)7.17222.82151.27132.56341.76141.7868
Total PVUR1133405155293252253
Publisher’s Note: MDPI stays neutral with regard to jurisdictional claims in published maps and institutional affiliations.

