
Thermal Characterization of Recycled Materials for Building Insulation
by
 , and
, and
Arnas Majumder
1, 
Laura Canale
2,
Costantino Carlo Mastino
3, 
Antonio Pacitto
2,
Andrea Frattolillo
3 and
and
Marco Dell’Isola
2,*
1
Department of Civil Engineering, University of Salerno, Via Giovanni Paolo II 132, 84084 Fisciano, Italy
2
Department of Civil and Mechanical Engineering, University of Cassino and South Lazio, 03043 Cassino, Italy
3
Department of Civil and Environmental Engineering, University of Cagliari, 09123 Cagliari, Italy
*
Author to whom correspondence should be addressed.
Energies 2021, 14(12), 3564; https://0-doi-org.brum.beds.ac.uk/10.3390/en14123564
Submission received: 17 May 2021
/
Revised: 7 June 2021
/
Accepted: 9 June 2021
/
Published: 15 June 2021
(This article belongs to the Special Issue Building Energy Management: Materials, Modeling, and Components)
Abstract
:The building sector is known to have a significant environmental impact, considering that it is the largest contributor to global greenhouse gas emissions of around 36% and is also responsible for about 40% of global energy consumption. Of this, about 50% takes place during the building operational phase, while around 10–20% is consumed in materials manufacturing, transport and building construction, maintenance, and demolition. Increasing the necessity of reducing the environmental impact of buildings has led to enhancing not only the thermal performances of building materials, but also the environmental sustainability of their production chains and waste prevention. As a consequence, novel thermo-insulating building materials or products have been developed by using both locally produced natural and waste/recycled materials that are able to provide good thermal performances while also having a lower environmental impact. In this context, the aim of this work is to provide a detailed analysis for the thermal characterization of recycled materials for building insulation. To this end, the thermal behavior of different materials representing industrial residual or wastes collected or recycled using Sardinian zero-km locally available raw materials was investigated, namely: (1) plasters with recycled materials; (2) plasters with natural fibers; and (3) building insulation materials with natural fibers. Results indicate that the investigated materials were able to improve not only the energy performances but also the environmental comfort in both new and in existing buildings. In particular, plasters and mortars with recycled materials and with natural fibers showed, respectively, values of thermal conductivity (at 20 °C) lower than 0.475 and 0.272 W/(m⋅K), while that of building materials with natural fibers was always lower than 0.162 W/(m⋅K) with lower values for compounds with recycled materials (0.107 W/(m⋅K)). Further developments are underway to analyze the mechanical properties of these materials.
1. Introduction
In the past few years, in both developed and developing countries, there is growing attention to the concepts of sustainability and energy-saving. This constant and increasing awareness is due to the fact that several issues like global warming, natural resources depletion, deforestation, and ozone layer depletion are threatening the livability and existence of the majority of species on earth [1,2]. In light of these vulnerabilities, it is quite clear that to preserve the global environment and the planet itself, crucial urgent interventions are needed. To enable global pollution mitigation, decisions have to be taken into account including several aspects such as lifestyle changes, energy consumption patterns, resource distribution, and energy efficiency production [1,3]. It is well known that the building sector is the largest contributor to global greenhouse gas (GHG) emissions (around 36% in the European Union) [4,5,6], of which over 80% take place during the building operational phase [7]. Furthermore, the building sector is responsible for about 40% of global energy consumption and the major part (about 50%) is principally due to residential and commercial buildings meeting various energy needs such as heating, ventilation, air conditioning (HVAC), and water heating [8]. A smaller percentage, around 10–20%, of energy is consumed in other activities such as (i) the manufacturing of building materials; (ii) transport of building materials from production plants to building sites; (iii) construction of the building; (iv) operation of the facilities (“operational” energy); and (v) end-life demolition activities [9,10].
In light of this, the European Union (EU) has already committed itself to strongly reducing the energy consumption of new and existing buildings [11]. Among all possible actions, the insulation of new and existing buildings plays a key role, since it is well known that good thermal insulation of the building could lead to saving about 65% of the energy consumption [12,13,14,15]. As highlighted in [16,17], most of the insulating materials are made mainly from natural and man-made synthetic (organic and inorganic) fibers and several studies have investigated the thermo-physical properties of such materials. Their “best” thermal conductivity was found to range from 0.015 W/(m⋅K) for aerogel panels to 0.100 W/(m⋅K) for recycled rubbers, as also shown in [18] and [19]. On the other hand, in recent years, increasing attention has been paid not only to energy efficiency, but also to the ecological and environmental impacts and overall sustainability of buildings and building materials. Indeed, recently, the EU introduced the Renovation Wave Strategy (RWS) with the objective to improve the energy performance of buildings through higher energy and resource efficiency, which is to be achieved by doubling the renovation rate in the next 10 years [20]. Among the lead actions, the RWS emphasizes the need to expand the market for sustainable construction products and services including the integration of new materials and nature-based solutions, material reuse, and recovery targets. Thus, major attention is being given not only to shifting from synthetic materials to natural/biological ones [1], but also to exploiting the use of waste and recycled materials for insulation purposes. Among the latter, recycled glass fiber, recycled PET, asphalt mixtures with recycled materials [21,22], recycled rubber, and recycled textile fiber (e.g., jute fiber recovered from old jute bags [23]) have been investigated in different studies, showing that their thermal conductivity is quite in line with one or the other above-mentioned materials, varying from 0.031 to 0.140 W/(m⋅K). Considering conventional insulating materials (e.g., synthetic, sheep wool, glass wood, cellulose, hemp, jute etc.) or uncommon ones (e.g., recycled glass fiber, recycled PET, recycled textile etc.), these are sold in panel format or in rolls for installation [24]. These formats can present some technical difficulties in their implementation such as encumbrance, because the insulation is applied externally as a separate layer to the load-bearing structure, and then buffered on the outside with an additional brick lining. Thus, there is growing interest in novel building/insulating materials made by mixing materials of biological origin (e.g., hemp, date palm fiber, oil palm fiber, cork, etc.) or recycled waste materials (e.g., recycled PET) with typical binding materials (e.g., lime, cement, clay, etc.), which would allow insulating plasters with easy applicability and reduced encumbrance to be obtained. In this context, El Azhary et al. [25] mixed straw at various proportions with clay and studied the thermal properties of the resulting material; Benmansour et al. [26] investigated the mortar’s thermo-mechanical behavior (cement and sand at various proportions) reinforced with two different sizes and mixtures of date palm fibers. Hempcrete (lime and hemp concrete) was manufactured by Elfordy et al. [27] and the thermo-mechanical properties of the same were evaluated. Valenza et al. [28] created a cement matrix by using washed and un-washed Sicilian sheep wool (waste product) cut into three different sizes and percentage and studied the samples’ thermal insulation and mechanical properties. As mentioned in Raut and Gomez [29], in Malaysia, oil palm waste is recognized as a problem for the local environment; therefore, the authors evaluated the possibility of using industrial residuals like oil palm and fly ash as a binder along with cement and oil palm fiber as a reinforcing material. The applicability of jute fiber mainly focused on its use for reinforced concrete, as shown in Zakaria et al. [30]. The application of jute fiber is shown in Ferrandez-García et al. [23], where the fibers were recovered from end-life transportation jute bags to prepare thermo-mechanical panels. An interesting solution, not only from a thermophysical point of view, but also from the eco-sustainability one, is lightweight concrete with recycled-PET aggregates (recycled polyethene terephthalate) for which a thermal conductivity of 0.034 W/(m⋅K) was found in [31,32,33,34].
In this context, it is clear that both recycled and natural materials, derived from local industrial and/or agricultural wastes, could play a major role in the construction sector, being able not only to provide good energy performances if integrated into traditional building materials, but also meeting the need for eco-sustainability and waste minimization. Their impact could be even higher in isolated regions and islands, taking on an even more significant economic value. This study falls under the regional project PLES (Local Products for Sustainable Construction) of the region of Sardinia (Central Italy), whose main goal is to promote the local construction market and help make it self-sufficient in terms of newer, innovative, and sustainable building materials. The aim of this work was to provide a detailed analysis for the thermal characterization of locally sourced (i.e., at 0-km) recycled materials for building insulation. To this end, the thermal behavior of different materials representing industrial residual or wastes, collected or recycled using Sardinian zero-km locally available raw materials, was investigated, namely: (i) plaster with natural fibers; (ii) plasters with recycled materials; and (iii) thermo-insulating building materials with natural fibers. As a further insight, in order to estimate the possible energy savings obtainable with the use of the above-mentioned materials replacing traditional plasters, a numerical simulation was carried out on a case-study building in different scenarios, for different climatic conditions and for different reference stratigraphies: a typical building built in the 1980s and those whose elements (e.g., plaster, brickwork, thermal insulation) offer the maximum allowed U-values, according to local regulations.
2. Materials and Methods
2.1. Sample Materials
The materials investigated within this paper were obtained by mixing typical binding materials of the Sardinian subsoil, specifically lime putty, opus signum, and raw clay, and insulating materials represented by natural waste products or agricultural by-products normally destined for landfill. A total of twelve nature-based thermal insulation specimens were realized using different binding as well as insulating materials and using sand (3 μm diameter) as the aggregate (Table 1).
Referring to Table 1, the wool fibers were collected from mattress stuffing, couches, and chairs padding. The fibers were washed, dried and sanitized to remove the impurities and finally manually cut to obtain the desired length. The hemp shives were collected and pealed directly from the hemp stalks, not processed or combed. They represent a huge production of agricultural waste that, according to current legislation, should be disposed of in landfills or incinerators. The jute fiber was collected from recycled jute bags, traditionally used to carry and store potatoes, cereals, coffee, etc. The broken bags were chopped into small pieces and later washed to remove the dust, treated, and combed to make the fiber suitable for the preparation of samples. The opus signinum was obtained from crushed tiles, no longer usable for their primary covering function, and which would otherwise be sent to landfill sites. The calcium hydrated lime used as the binder was class CL 80-S according to EN 459-1:2015 [35]. The clay was collected from local extraction in central Sardinia by removing sediments with a steel mesh sieve and water.
The twelve samples realized and consequently analyzed can be classified into three different groups depending on whether the mixtures are intended for preparation with natural fibers or recycled materials: (i) plaster with natural fibers; (ii) plaster with recycled materials; and (iii) building-insulation materials; such samples are presented in Table 2.
In Table 2, the discarded samples are also shown. Samples S01 and S04 were sheep wool mixed with lime putty as the binder and sand and calcium carbonate as aggregates; moreover, S01 also used opus signinum as a binder. S02 and S03 used hemp shives mixed with lime putty (also opus signinum in S02) as the binder, but no aggregates were used for these last two. The water was added accordingly and based on the guidance provided by a local artisan from his work experience.
2.2. Sample Preparation and Conditioning
The first four samples (from S01 to S04) were prepared using wood casting molds (i.e., samples from S01 to S04). After preparing the grout, the samples were kept to mature and dry naturally. Following the total maturation period, the first samples (see S02 and S03 in Table 3) showed brittleness when touched; this happened because of the higher fiber concentration than the mixture’s binder. In contrast, a high binder content to fibers (S01 and S04 in Table 3) led to big cracks on the surfaces with time. These problems are easily dealt with the deposition of further filling mortar, but it is clear that these situations are not acceptable for thermal conductivity tests.
Indeed, as highlighted in [26,27,28,29], the fiber size and percentage in the mixture (binder and fiber) directly influence the strength and the thermal conductivity of any building material, therefore, particular attention was paid while preparing the succeeding samples. Taking into account the experience gained during the preparation of the first samples (S01 from S04), the authors tried to improve the homogeneity of the mixture by slow manual mixing to avoid air trapping and poured the mixture into 100 × 100 mm2 and 300 × 300 mm2 wooden molds, with various thicknesses from 5 to 100 mm.
The grout was prepared following UNI EN 1015-2 [36] and the consistency of the mixture was verified using the shaking table tests UNI EN 1015-3 [37].
After the grout’s workability condition was proven, the wooden molds were first half filled with the mixture and 25 strokes were applied with a stick with the aim to distribute the mixture uniformly and to also remove any air bubbles from inside according to [37]. The molds were completely filled, and another 25 strokes were applied and then the upper surface was levelled. Thereafter, the sample was left inside the mold and placed inside a plastic bag for two days. After two days, the samples were taken out of the mold and re-placed inside another plastic bag for five days, which was done to provide a quasi-stable condition during the sample’s maturation. After seven days from the date of casting, the samples were put outside to dry naturally, in a dedicated room with controlled temperature and humidity (20 °C, 60%). The progressive weight reduction of each sample was measured regularly for a period of 28 days.
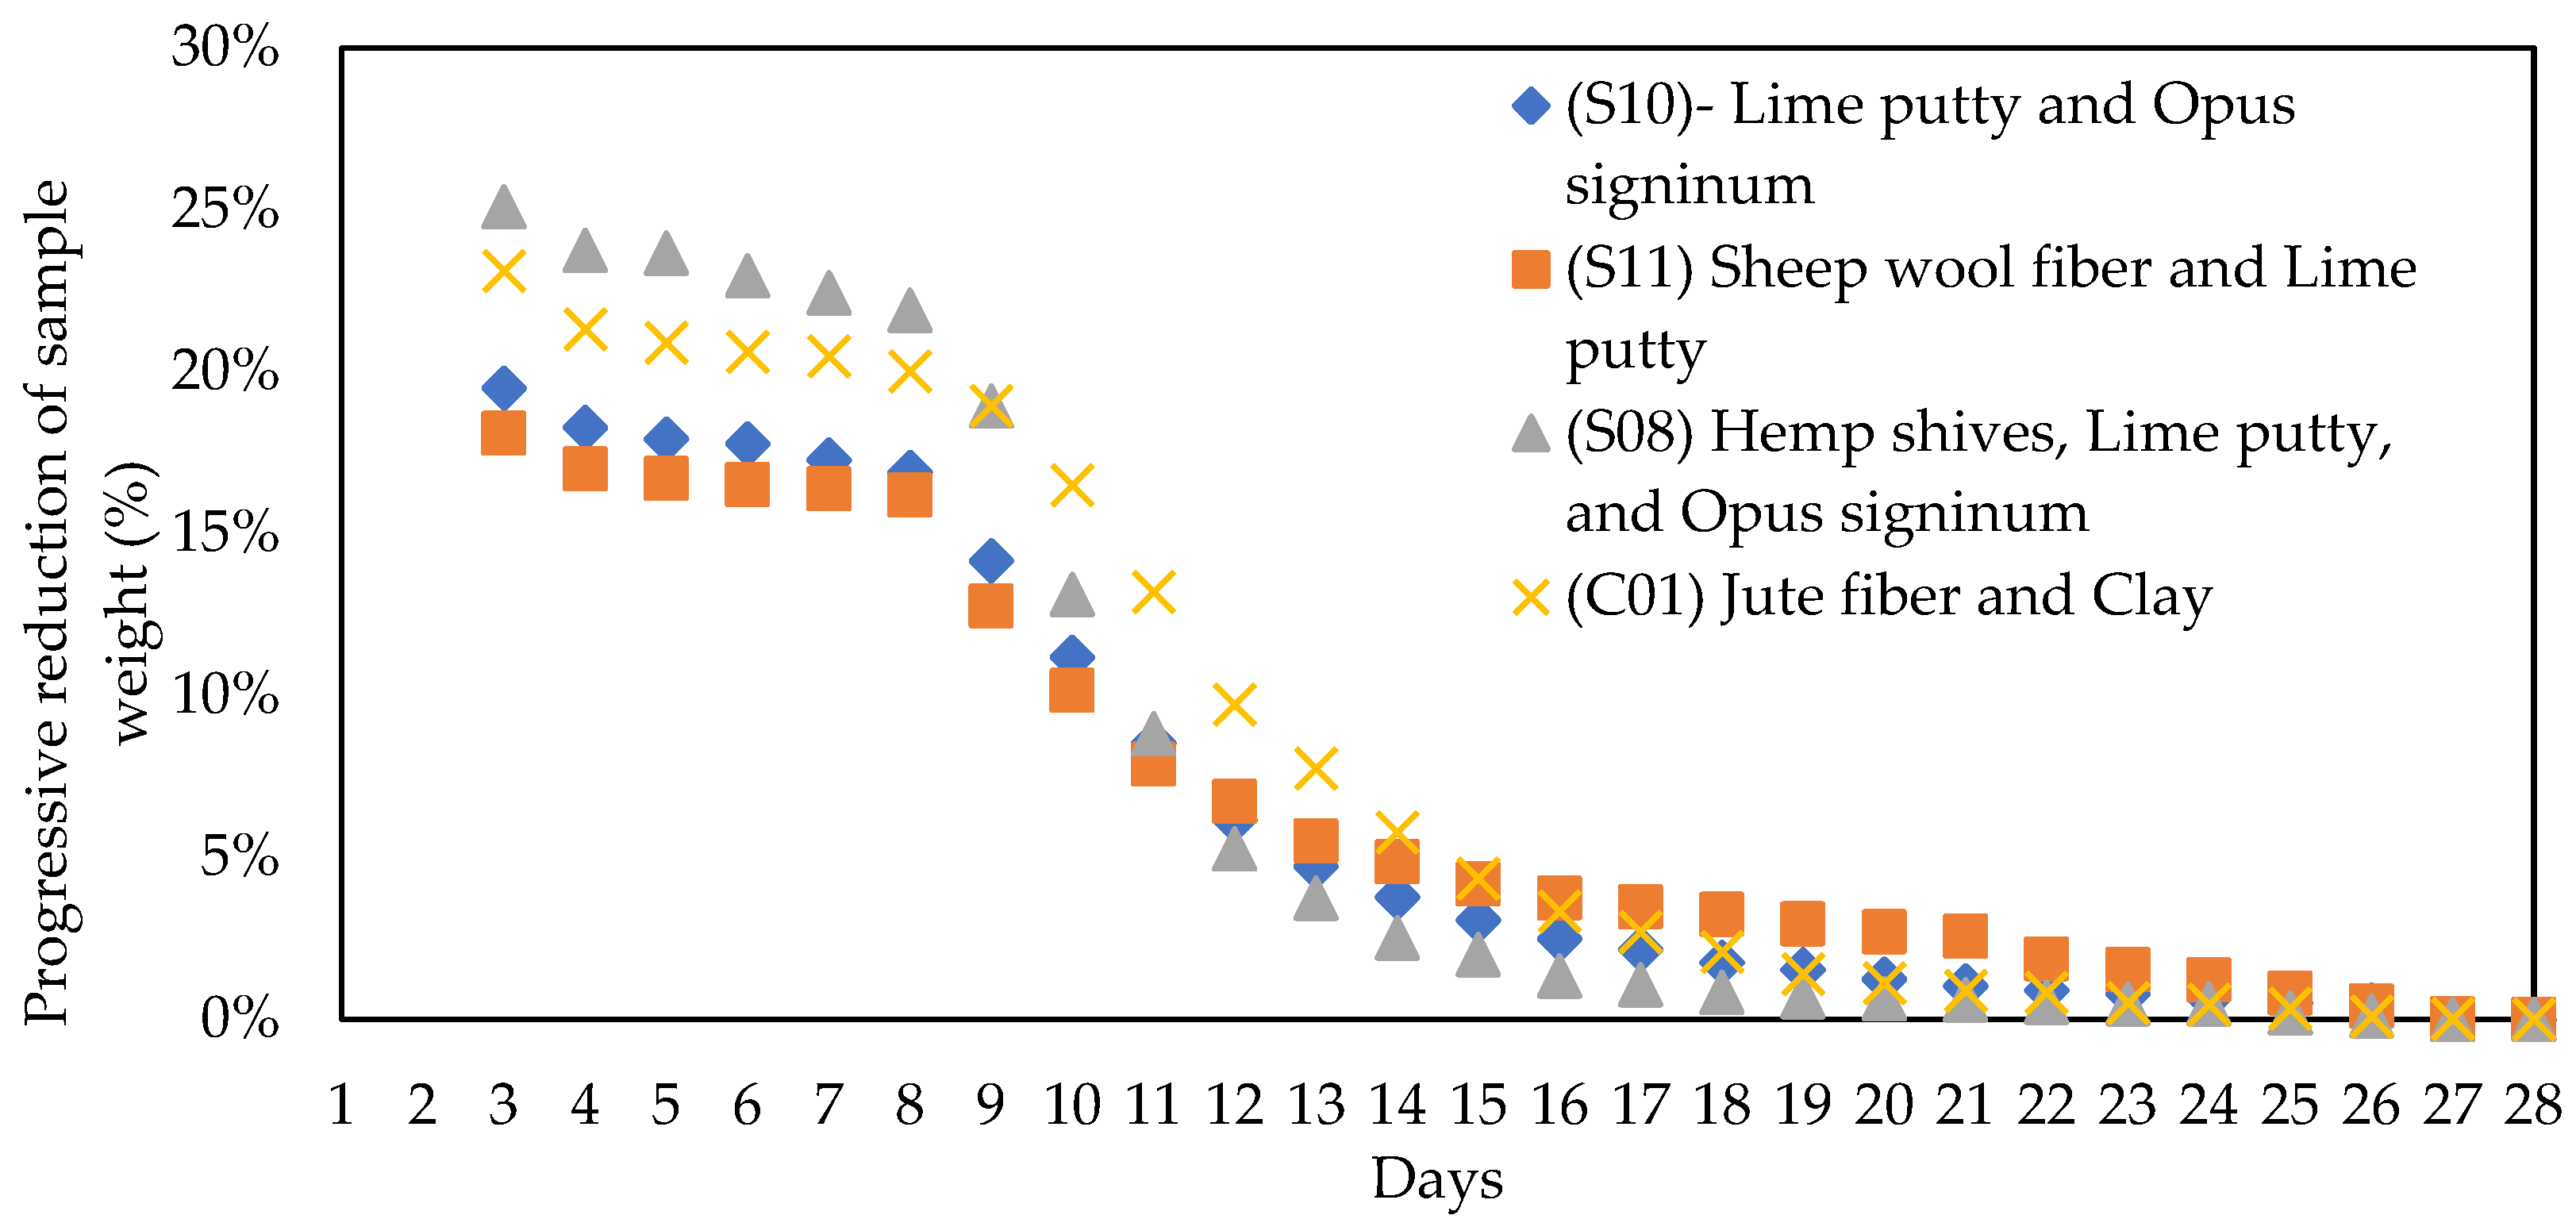
To show an example of the drying phase, Figure 1 shows the trend of the progressive weight reduction of four samples (C01, S08, S10, S11), each representative of a given sample category. During the sample’s maturation (i.e., from the third to the eighth day), a controlled daily reduction of not more than 0.6% in all the samples’ mass was observed (Figure 1). In the following period, from the eighth to the fourteenth day, during which the samples were naturally dried, a rapid daily reduction of just under 3% was observed. For the remaining days, the decrease in weight was on average less than 0.2% daily.
The residual moisture from the samples was removed before conducting the thermal conductivity tests, by drying them in oven at constant temperature (i.e., at about 40 °C), according to UNI EN-12667 [38]. During this period, the sample mass was measured hourly. The final stability conditions were considered reached when the last 5 readings remained within ±0.1 g.
For all the samples, the thermal conductivity tests were conducted only at the end of the drying process. For three samples, additional thermal conductivity measurements were carried out at regular intervals during the total drying period, to observe the variation in thermal conductivity value with respect to the moisture content.
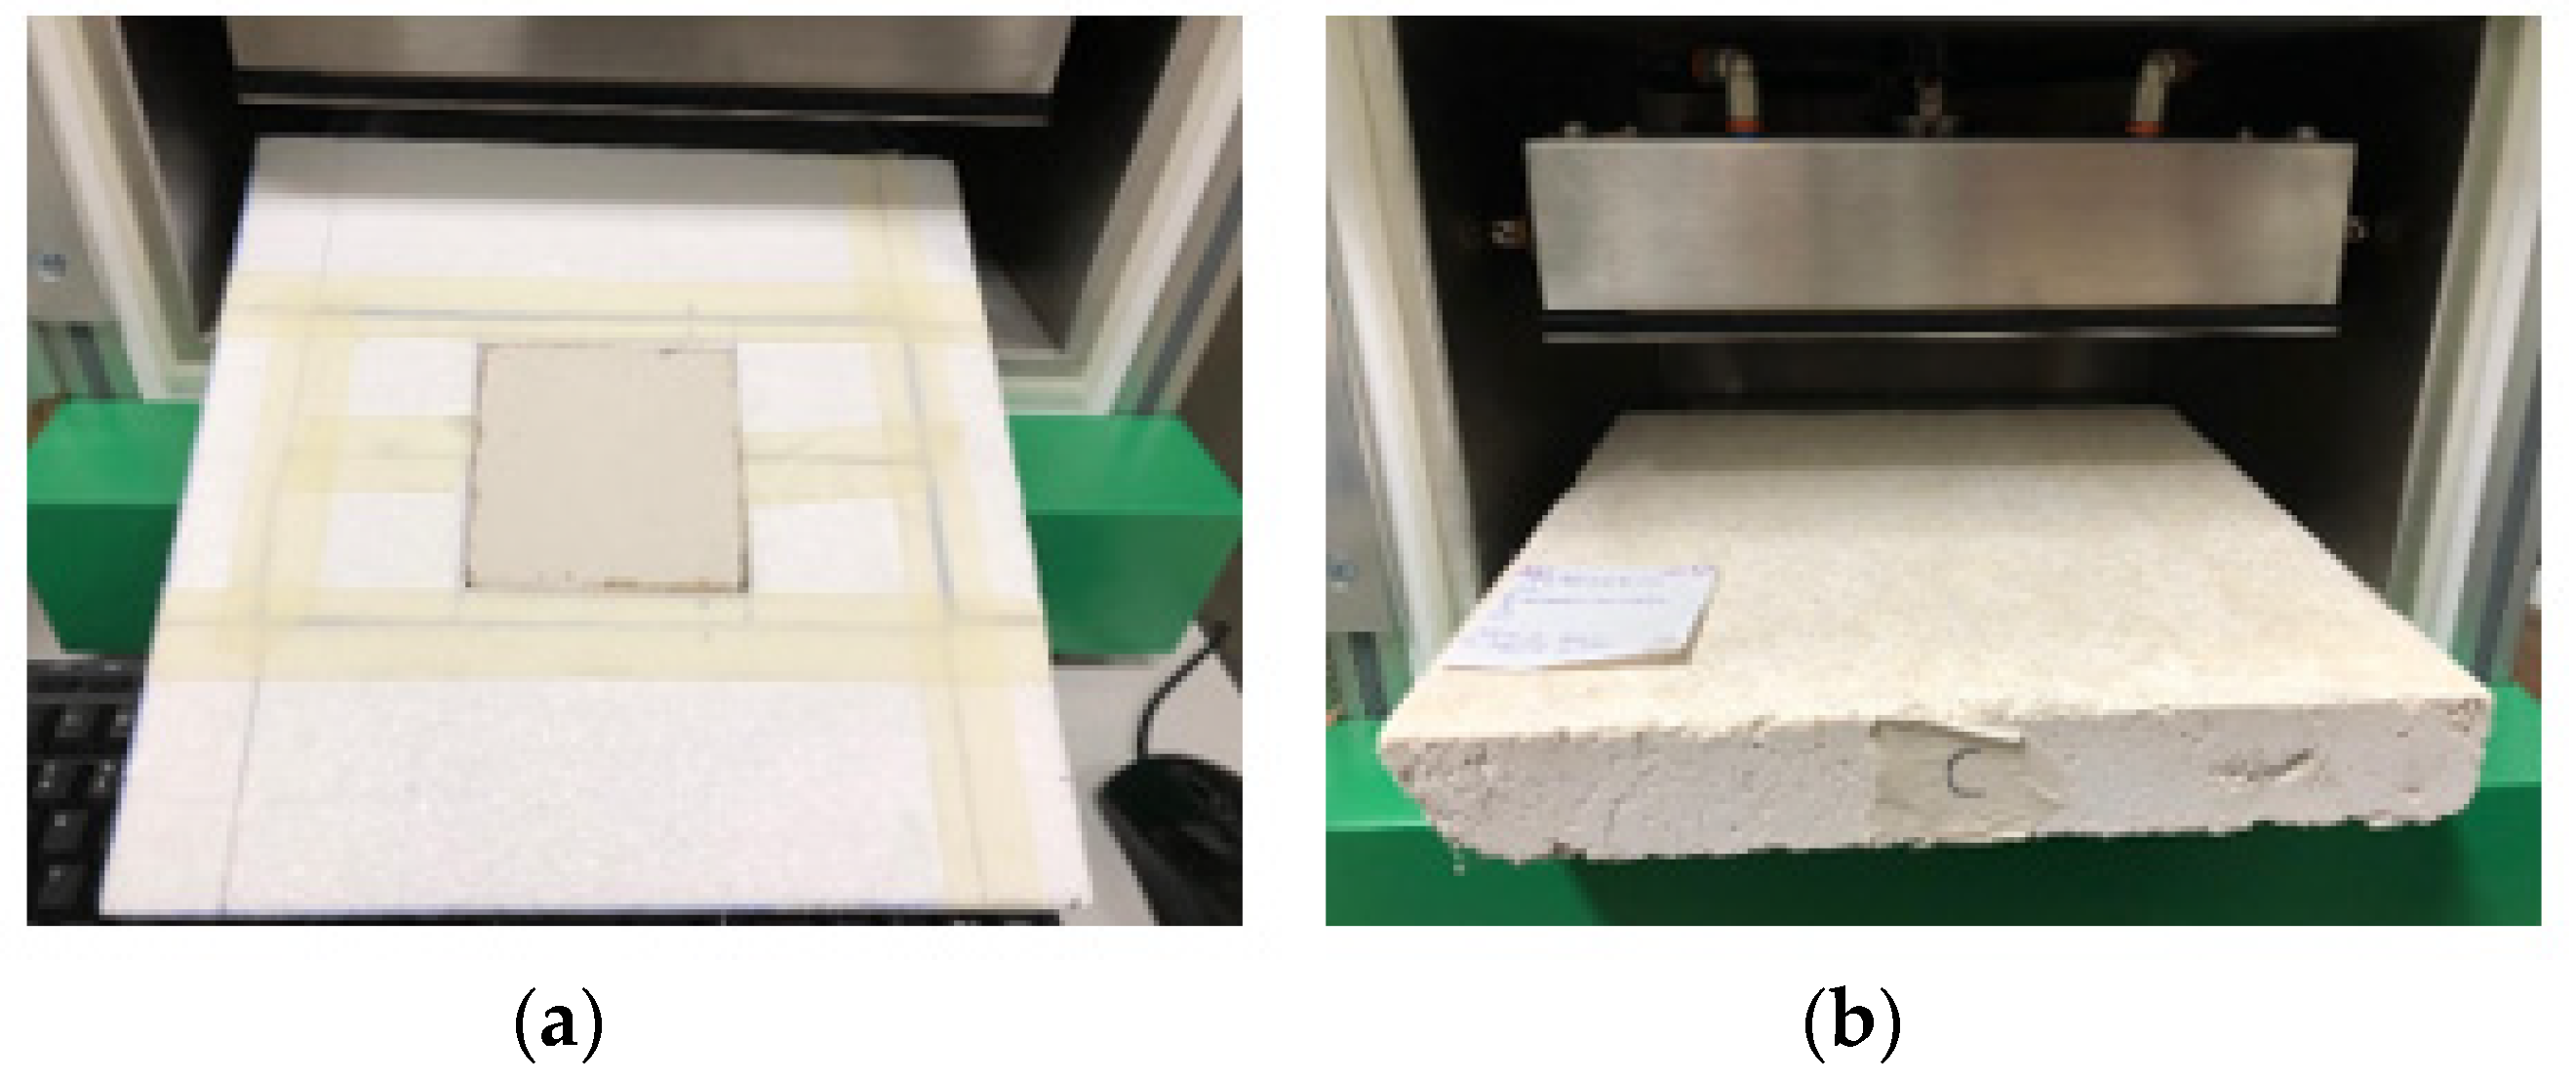
In order to minimize the error induced by the sample surface roughness, (Figure 2) when it was not possible to intervene mechanically by abrasion, the use of a thermal conductive film of grease (Thermigrease TG-20014) was applied.
2.3. Thermal Conductance Measurement
The thermal conductivity tests were conducted by using a thermal conductivity measuring device TURUS TCA 300 (ISO 8301 [39] and DIN EN 1946-3 [40]) and the measuring parameters (sample thickness, plates temperature difference, mean sample temperature, etc.) were set before each test. The heat flow meter (HFM) method was used (according to [39,40]) to determine the thermal conductivity values. The instrument was capable of measuring the value for a different range of specimens and was equipped with one testing chamber to measure, a control system, and an internal single board touchscreen computer. The testing chamber was equipped with a fixed plate and a mobile top plate. The top plate could be adjusted based on the specimen thickness from 5 to 100 mm, as specified by the manufacturer (EN 1946-2 [41]). Either plate could be set as hot or cold plates. Both hot and cold plates had a workable surface area equal to 300 × 300 mm, whereas the net surface area of 100 × 100 mm of the central part of each plate was the active sample measuring zone. The active zones were equipped with one heat flux sensor per plate, and the HFM were arranged symmetrically and placed at the center of the surface of the hot and cold plates, respectively (Figure 3).
Each HFM and the plates had their own protection against the heat loss due to lateral heat flux. Four Peltier devices were used on each side to maintain the temperatures of both plates and the dissipating heat was extracted with the help of a liquid coolant running inside the external loop connected to a mini-chiller. Two thermal resistances (PT 1000) of Class DIN A with a maximum error of 0.08 K (typically better) at 0 °C are presented to measure the temperature at the center of each plate and the values were used for controlling the Peltier devices and other purposes. The cool and hot plate temperature ranges (min/max) were −20/+60 °C and −10/+70 °C, respectively, and depending on the specimen thickness (5–100 mm), the measured thermal conductivity of the samples could range from 0.002 to 1.0 W/(m⋅K).
The air temperature and humidity close to the samples were measured with the datalogger Tinytag Ultra 2. The measurement range is from −40 to 85 °C, and from 0 to 95% UR. The measurements were acquired at 1 min intervals. The thermal conductivity measurement was conducted in steady state conditions, based on self-adjusted temperatures of the plates, which depend on the desired sample mean temperature and plate temperature difference. Based on the measured heat fluxes by the hot and cold plates, the thermal conductivity () value was calculated by the heat flow meter instrument according to Equation (1).
where is the heat flux (W/m2); S is the sample thickness (m); tH and tC are, respectively, the hot plate and cold plate temperatures (°C).
All tests had a duration equal to 300 minutes, much longer than the time required to achieve the steady state conditions. These were considered reached when the fluctuations of the thermal flow through the sample were contained within the resolution of the instrument, which generally occurred in an interval between 180 and 240 minutes, depending on the moisture content of the sample. The samples were characterized at an average temperature of 10 °C, 20 °C, and 30 °C, according to UNI EN 12939 [42], always maintaining a temperature difference between the hot and cold surfaces equal to 20 °C. In order to guarantee a one-dimensional flow through the samples having a surface less than 300 × 300 mm2, expanded polystyrene (EPS) protective insulation was used (Figure 4) as an uncontrolled thermal guard, thus minimizing the heat losses at the edges.
3. The Case-Study Building
In order to estimate the possible energy savings obtainable with the use of the aforementioned materials and the measured conductivity and thermal capacity values when replacing traditional elements, a numerical simulation was carried out according to the dynamic hourly method described in the technical standard ISO 52016 [43]. In particular, simulations were conducted using the dynamic hourly simulation model implemented in the commercial software Thermolog®. The average hourly data (external air temperature, specific humidity, solar radiation, wind speed, and direction) and the real conditions of the use of the building were used as input data, specifying for each month the number of actual days and hours of air conditioning system operation.
The case study proposed for the analysis consists of a multistorey terraced building for residential use (Figure 5), characterized by a light envelope with opaque walls consisting of 1.5 cm external lime and cement plaster, perforated bricks with thermal resistance 0.31 m2K/W, and internal lime and gypsum plaster. The opaque walls make up 46% of the dispersing surface and are exposed in the E–W direction.
The purpose of the simulation goes beyond obtaining a high energy class or in any case, a well-defined savings rate, as it is aimed exclusively at verifying the potential energy savings achievable and its correlation with the reference climatic conditions. For this reason, replacement of traditional plaster in case 1, using plaster with recycled materials (case 2), or natural fibers (cases 3–5) was simulated, as detailed in Table 4. The results of the first five cases were also compared with the corresponding values obtained from case 6, in which the authors simulated an application of thermal insulation panels in sintered expanded polystyrene (EPS) on the opaque walls, in order to meet strict national regulations on the opaque building envelope [44]. The suitable thickness of the EPS layer is the function of the climatic reference condition: 8 cm for Cagliari (Urif = 0.33 W/m2K), 7.5 cm for Palermo (Urif = 0.35 W/m2K), and 13 cm for Bolzano (Urif = 0.22 W/m2K).
Finally, in order to evaluate the extent to which plasters with lower thermal conductivity can actually affect the buildings envelope, the simulations were repeated assuming their use on walls whose elements (e.g., plaster, brickwork, thermal insulation) offer the maximum allowed U-values according to local regulations.
4. Results and Discussion
4.1. Thermal Characterization of the Analyzed Material
In Table 5, the thermal conductivity at three different temperatures (10, 20, and 30 °C) for the different analyzed samples and the reference values available in the literature are reported to allow for comparison. In particular, it is possible to notice how the use of recycled material (with the tested densities) allows for plasters to be obtained with conductivity (@20 °C) between 0.430–0.475 W/(m⋅K), much better than the average values of traditional plasters using gypsum and/or lime (higher than 0.7 W/(m⋅K)). The use of sheep wool inside lime putty allows for a decrease in thermal conductivity from 46% to 62% when thistle fibers are added.
The same fibers guarantee a reduction in the thermal conductivity of the lime putty and opus signinum blend equal to 37% and 66%, respectively. In particular, the thermal conductivity was between 0.146–0.272 W/(m⋅K). It should be noted that these reductions were obtained with only 3–4% of sheep wool and thistle fiber in the total mixture when compared to 13% of fibers used by Valenza et al. [25]. Additionally, the use of natural fibers inside building materials allows for conductivity values to be obtained always below 0.162 W/(m⋅K) (@20 °C), with lower values for compounds with recycled materials (0.107 W/(m⋅K)). In any case, the measured conductivity was always lower than the ones available in the literature (Elfordy et al. [24]; El Azhary et al. [29]) for analogous materials. Finally, it seems that hemp fibers guarantee slightly higher performances (−14%) than the jute ones but, in this regard, the authors will deepen the results through a future test campaign dedicated exclusively to the use of jute in building materials.
The results obtained for average temperatures (10 and 30 °C) of the specimens different to the traditional ones also showed the same trends. Based on these results, it is possible to hypothesize with sufficient accuracy an almost linear dependence of thermal conductivity with temperature, with a general slope coefficient between 0.0006–0.0014 W/(m⋅K).
4.2. Influence of the Moisture Content
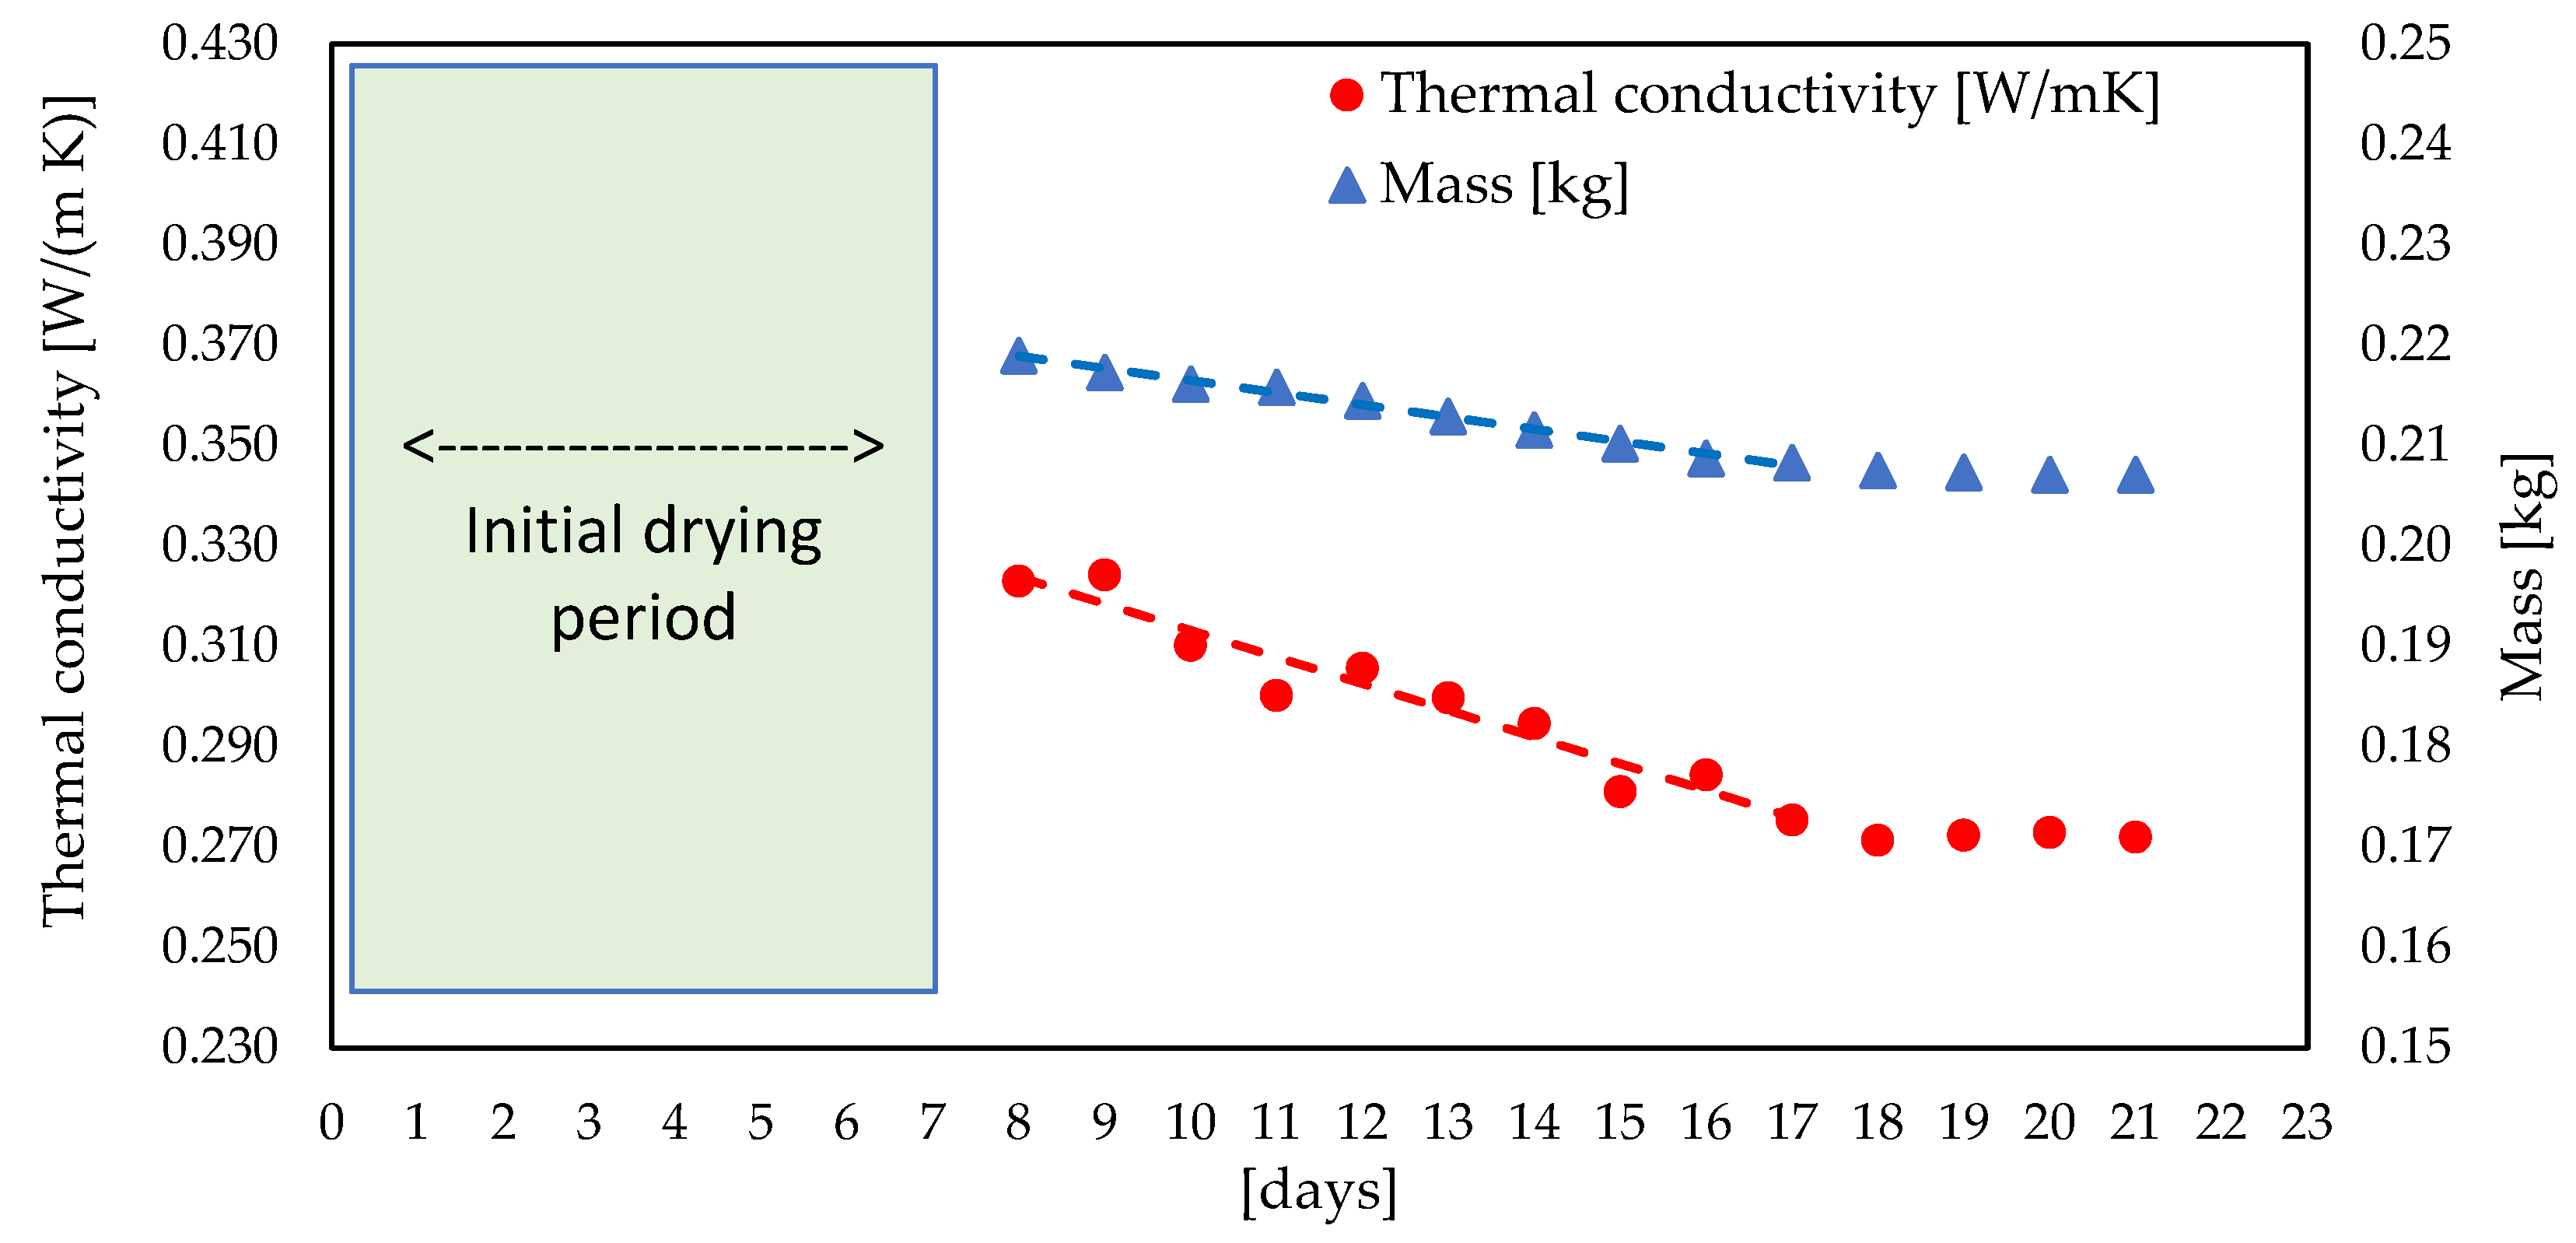
In order to verify the influence of the moisture content on the analyzed materials, repeated measurements of the thermal conductivity were carried out on three samples during their entire drying period. For example, in Figure 6, the decrease in weight (in blue) and the contextual measurement of thermal conductivity (in red) for sample S14 is reported. The measurements were started after an initial drying period of seven days as above-mentioned, and stopped when the variations in mass of the sample were less than the measurement uncertainty for a period of at least 48 hours. In all tests, the conductivity decreased as the drying of the sample progressed, showing an average conductivity decrease of 16.3% against a mass decrease on average close to 5.5%.
4.3. Energy Performance Analysis Applied to the Case Study
Table 6 shows the results obtained for the case study building. In particular, the different “transmission heat loss coefficient” (Htr) values and the corresponding useful “thermal energy requirements” EPH,nd (for winter air conditioning) and EPC,nd (for summer air conditioning) are represented. Within the table, both absolute values and relative percentage differences with respect to case 1 are shown to allow for an immediate comparison between the analyzed solutions for two different semi-continental (Bolzano) and Mediterranean climatic conditions (Cagliari e Palermo).
As already mentioned, the aim was not to obtain a high energy class or a well-defined savings rate, but to verify the potential energy savings achievable and its correlation with the reference climatic conditions. It is possible to note how the addition of natural fibers always led to an improvement in the performance characteristics of the building envelope. Due to the reduced thickness of the material considered (1.5 cm), the reduction in the Htr coefficient could be quantified between 2.6% and 7.6%, respectively, for the use of opus signinum (case 2) and hemp (case 5) in the mixture. With these thicknesses, their effect was an order of magnitude lower than that obtained in case 6, where the legal requirements were fulfilled with an EPS thermal coat of an appropriate thickness. In this last case, in all three reference climatic conditions, there was an improvement in EPHn,d equal to or greater than 23%, even if for Bolzano, the addition of a thermal coating involved a slight increase in the thermal energy requirements needed for summer air conditioning. With similar percentages, the useful thermal energy requirements for heating also decreased in quantities ranging from 3% for Cagliari (with the use of opus signinum) and 8.4% for Palermo (with the use of hemp and clay). On the other hand, it should be noted that the light structure and the low thermal capacity of the analyzed materials did not entail equally significant variations in the energy requirements for summer air conditioning. Where appreciable (Palermo and Cagliari), this was variable in modest percentages (Palermo) or even increased for the city of Cagliari from 3.4% to 10.2%. Finally, Table 7 shows the comparisons in terms of EPH,nd when recycled materials (cases from 2 to 5) are used on walls whose elements (e.g., plaster, brickwork, thermal insulation) already offer the maximum allowed U-values according to local regulations. Case 1 is the reference one where traditional plaster was used. As expected, the influence of plasters with recycled materials on walls that already meet the regulatory requirements was negligible (<1%) in both analyzed climates. However, it is important to underline that when the materials analyzed in this paper and the traditional ones were compared, the real innovative and rewarding aspect is not represented by the achievable energy saving (it cannot be otherwise, given the thicknesses used), but in the possibility of using locally produced natural and waste/recycled products with a lower environmental impact. In order to reinforce this peculiarity, the authors integrated the study with a life cycle assessment (LCA) in order to evaluate the environmental footprint along their entire life cycle.
5. Conclusions
In this paper, the authors report the results of an experimental investigation on innovative materials characterized by the use of locally produced natural and waste/recycled products that are able to provide good thermal performances while also having a lower environmental impact.
A total of twelve samples were prepared using Sardinian zero-km locally available raw materials: wool fibers from mattress stuffing, couches, and chair padding; hemp shives directly from the hemp stalks; jute fiber from recycled jute bags; opus signinum from crushed tiles, and clay from local extraction in central Sardinia. The use of recycled materials allowed us to obtain plasters with a conductivity (@20 °C) about 32% lower than traditional plasters using gypsum and/or lime. The use of natural fibers (sheep wool and thistle fibers) inside lime putty allowed for a decrease in thermal conductivity of up to 62%.
By means of a numerical simulation, it was possible to verify that the addition of natural fibers always leads to an improvement in the energy performance of the building envelope during the winter season compared to traditional plaster. The positive effect induced by their use obviously decreases in percentage on already performing walls until it almost disappears for walls that comply with the current stringent regulatory requirements for new buildings. On the other hand, significant decrease in installation and in the environmental costs associated with their production could still make their use more suitable for new and existing buildings.
Finally, the use of jute inside building elements to realize insulating panels, even if not with the same performances obtained with the hemp shivers, shows promising results, with conductivity values always lower than 0.162 W/(m⋅K). In this regard, more accurate values could be highlighted at the end of the experimental campaign that the authors will carry out on specific products made with the use of jute fibers.
Author Contributions
Study conception and design: A.F. and M.D.; Acquisition, analysis, and interpretation of data: A.M. and C.C.M.; Drafting of manuscript: A.M., A.F., A.P. and L.C.; Critical revision: all authors. All authors have read and agreed to the published version of the manuscript.
Funding
This work has been developed under the projects “PLES”, financed with funds “POR FESR 2014/2020—ASSE PRIORITARIO I “RICERCA SCIENTIFICA, SVILUPPO TECNOLOGICO E INNOVAZIONE” (grant number F21B17000750005).
Institutional Review Board Statement
Not applicable.
Informed Consent Statement
Not applicable.
Acknowledgments
Authors would like to acknowledge the support of Costanzo Salis for providing the raw materials.
Conflicts of Interest
The authors declare no conflict of interest.
References
- Moussa, T.; Maalouf, C.; Ingrao, C.; Scrucca, F.; Costantine, G.; Asdrubali, F. Bio-based and recycled-waste materials in buildings: A study of energy performance of hemp-lime concrete and recycled-polyethylene terephthalate façades for office facilities in France and Italy. Sci. Technol. Built Environ. 2018, 24, 492–501. [Google Scholar] [CrossRef]
- Filippín, C. Benchmarking the Energy Efficiency and Greenhouse Gases Emissions of School Buildings in Central Argentina. Build Environ. 2000, 35, 407–414. [Google Scholar] [CrossRef]
- Cabeza, L.F.; Rincón, L.; Vilariño, V.; Pérez, G.; Castell, A. Life cycle assessment (LCA) and life cycle energy analysis (LCEA) of buildings and the building sector: A review. Renew. Sustain. Energy Rev. 2014, 29, 394–416. [Google Scholar] [CrossRef]
- Pardo, N.; Thiel, C. Evaluation of several measures to improve the energy efficiency and CO2 emission in the European single-family houses. Energy Build. 2012, 49, 619–630. [Google Scholar] [CrossRef]
- Hadded, A.; Benltoufa, S.; Fayala, F.; Jemni, A. Thermo physical characterisation of recycled textile materials used for building insulating. J. Build. Eng. 2015, 5, 34–40. [Google Scholar] [CrossRef]
- Zhan, J.; Liu, W.; Wu, F.; Li, Z.; Wang, C. Life cycle energy consumption and greenhouse gas emissions of urban residential buildings in Guangzhou city. J. Clean. Prod. 2018, 194, 318–326. [Google Scholar] [CrossRef]
- World Resource Institute. Green House Protocol, Policy and Action Standard Commercial and Residential Buildings Sector Guidance Draft. 2015. Available online: https://ghgprotocol.org/sites/default/files/standards_supporting/Buildings%20-%20Additional%20Guidance.pdf (accessed on 25 April 2021).
- Pohoryles, D.A.; Maduta, C.; Bournas, D.A.; Kouris, L.A. Energy Performance of Existing Residential Buildings in Europe: A Novel Approach Combining Energy with Seismic Retrofitting. Energy Build. 2020, 223, 110024. [Google Scholar] [CrossRef]
- Junnila, S. The Environmental Impact of an Office Building throughout Its Life Cycle; Helsinki University of Technology: Espoo, Finland, 2004; ISBN 951-22-7285-7. [Google Scholar]
- Suzuki, M.; Oka, T. Estimation of life cycle energy consumption and CO2 emission of office buildings in Japan. Energy Build. 1998, 28, 33–41. [Google Scholar] [CrossRef]
- European Commission. Nearly Zero-Energy Buildings. 2014. Available online: https://ec.europa.eu/energy/topics/energy-efficiency/energy-efficient-buildings/nearly-zero-energy-buildings_en (accessed on 25 April 2021).
- Blom, I.; Itard, L.; Meijer, A. LCA-based environmental assessment of the use and maintenance of heating and ventilation systems in Dutch dwellings. Build Environ. 2010, 45, 2362–2372. [Google Scholar] [CrossRef]
- Joelsson, A.; Gustavsson, L. District Heating and Energy Efficiency in Detached Houses of Differing Size and Construction. Appl. Energy 2009, 86, 126–134. [Google Scholar] [CrossRef]
- Nemry, F.; Uihlein, A.; Colodel, C.M.; Wetzel, C.; Braune, A.; Wittstock, B.; Hasan, I.; Kreißig, J.; Gallon, N.; Niemeier, S.; et al. Options to reduce the environmental impacts of residential buildings in the European Union—Potential and costs. Energy Build. 2010, 42, 976–984. [Google Scholar] [CrossRef]
- Widén, J.; Nilsson, A.M.; Wäckelgård, E. A combined Markov-chain and bottom-up approach to modelling of domestic lighting demand. Energy Build. 2009, 41, 1001–1012. [Google Scholar] [CrossRef]
- Majumder, A.; Stochino, F.; Fraternali, F.; Martinelli, E. Seismic and Thermal Retrofitting of Masonry Buildings with Fiber Reinforced Composite Systems: A State of the Art Review. Int. J. Struct. Glass Adv. 2021, 5, 41–67. [Google Scholar] [CrossRef]
- Saba, N.; Paridah, T.; Mohammad, J. A Review on Potentiality of Nano Filler/Natural Fiber Filled Polymer Hybrid Composites. Polymers 2014, 6, 2247–2273. [Google Scholar] [CrossRef]
- Schiavoni, S.; Bianchi, F.; Asdrubali, F. Insulation materials for the building sector: A review and comparative analysis. Renew. Sustain. Energy Rev. 2016, 62, 988–1011. [Google Scholar] [CrossRef]
- Italian National Unification. UNI 10351: 2015 Building Materials and Products—Thermo Hygrometric Properties—Procedure for Choosing Project Values; UNI: Milan, Italy, 2015. (In Italian) [Google Scholar]
- European Commission—Renovation Wave: Doubling the Renovation Rate to cut Emissions, Boost Recovery and Reduce Energy Poverty. 14 October 2020. Available online: https://ec.europa.eu/commission/presscorner/detail/en/IP_20_1835 (accessed on 25 April 2021).
- You, L.; Jin, D.; Guo, S.; Wang, J.; Dai, Q.; You, Z. Leaching evaluation and performance assessments of asphalt mixtures with recycled cathode ray tube glass: A preliminary study. J. Clean. Prod. 2021, 279, 123716. [Google Scholar] [CrossRef]
- Asadi, S.; Hassan, M.; Beheshti, A.; Berryman, C. Quantification of residential energy consumption reduction using glass-modified asphalt shingle. J. Archit. Eng. 2015, 21, B4015003. [Google Scholar] [CrossRef]
- Ferrandez-García, M.T.; Ferrandez-Garcia, C.E.; Garcia-Ortuño, T.; Ferrandez-Garcia, A.; Ferrandez-Villena, M. Study of Waste Jute Fiber Panels (Corchorus capsularis L.) Agglomerated with Portland cement and Starch. Polymers 2020, 12, 599. [Google Scholar] [CrossRef] [Green Version]
- Liu, K.; Fu, C.; Xu, P.; Li, S.; Huang, M. An eco-friendliness inductive asphalt mixture comprising waste steel shavings and waste ferrites. J. Clean. Prod. 2021, 283, 124639. [Google Scholar] [CrossRef]
- El Azhary, K.; Chihab, Y.; Mansour, M.; Laaroussi, N.; Garoum, M. Energy efficiency and thermal properties of the composite material clay-straw. Energy Procedia 2017, 141, 160–164. [Google Scholar] [CrossRef]
- Benmansour, N.; Boudjemaa, A.; Abdelkader, G.; Abdelhak, K.; Aberrahim, B. Thermal and Mechanical Performance of Natural Mortar Reinforced with Date Palm Fibers for Use as Insulating Materials in Building. Energy Build. 2014, 81, 98–104. [Google Scholar] [CrossRef]
- Elfordy, S.; Lucas, F.; Tancret, F.; Scudeller, Y.; Goudet, L. Mechanical and Thermal Properties of Lime and Hemp Concrete (‘hempcrete’) Manufactured by a Projection Process. Constr. Build Mater. 2008, 22, 2116–2123. [Google Scholar] [CrossRef]
- Valenza, A.; Fiore, V.; Nicolosi, A.; Rizzo, G.; Scaccianoce, G.; Di Bella, G. Effect of sheep wool fibers on thermal-insulation and mechanical properties of cement matrix. Acad. J. Civ. Eng. 2015, 33, 40–45. [Google Scholar] [CrossRef]
- Raut, A.N.; Gomez, C.P. Thermal and Mechanical Performance of Oil Palm Fiber Reinforced Mortar Utilizing Palm Oil Fly Ash as a Complementary Binder. Constr. Build Mater. 2016, 126, 476–483. [Google Scholar] [CrossRef]
- Zakaria, M.; Ahmed, M.; Hoque, M.M.; Islam, S. Scope of using jute fiber for the reinforcement of concrete material. Text. Cloth. Sustain. 2017, 2, 1–10. [Google Scholar] [CrossRef] [Green Version]
- Mazhoud, B.; Viel, M.; Collet, F.; Phelipot-Mardelé, A.; Lanos, C.; Prétot, S. Is Hemp Lime Concrete a Mix of Hemp and Lime? Acad. J. Civ. Eng. 2017, 35, 422–431. [Google Scholar] [CrossRef]
- Collet, F.; Sylvie, P. Thermal Conductivity of Hemp Concretes: Variation with Formulation, Density and Water Content. Constr. Build Mater. 2014, 65, 612–619. [Google Scholar] [CrossRef] [Green Version]
- Prétot, S.; Collet, F.; Garnier, C. Life cycle assessment of a hemp concrete wall: Impact of thickness and coating. Build. Environ. 2014, 72, 223–231. [Google Scholar] [CrossRef] [Green Version]
- Arnaud, L.; Gourlay, E. Experimental Study of Parameters Influencing Mechanical Properties of Hemp Concretes. Constr. Build Mater. 2012, 28, 50–56. [Google Scholar] [CrossRef]
- European Committee for Standardization. Building lime. In Definitions, Specifications and Conformity Criteria; EN 459-1:2015; CEN: Brussels, Belgium, 2015. [Google Scholar]
- Italian National Unification. Methods of Test for Mortar for Masonry—Part 2: Bulk Sampling of Mortars and Preparation of Test Mortars; UNI EN 1015-2:2007; UNI: Milan, Italy, 2007. [Google Scholar]
- Italian National Unification. Methods of Test for Mortar for Masonry—Part 3: Determination of Consistence of Fresh Mortar (by Flow Table); UNI EN 1015-3:2007; UNI: Milan, Italy, 2007. [Google Scholar]
- Italian National Unification. Thermal Performance of Building Materials and Products-Determination of Thermal Resistance by Means of Guarded Hot Plate and Heat Flow Meter Methods-Products of High and Medium Thermal Resistance; UNI EN 12667: 2002; UNI: Milan, Italy, 2002. [Google Scholar]
- International Organization for Standardization. Thermal Insulation—Determination of Steady-State Thermal Resistance and Related Properties—Heat Flow Meter Apparatus; ISO 8301:1991; ISO: Geneva, Switzerland, 1991. [Google Scholar]
- European Committee for Standardization. Thermal Performance of Building Products and Components—Specific Criteria for the Assessment of Laboratories Measuring Heat Transfer Properties—Part 3: Measurements by the Guarded Heat Flow Meter Method; EN 1946-3; CEN: Brussels, Belgium, 1999. [Google Scholar]
- European Committee for Standardization. Thermal Performance of Building Products and Components—Specific Criteria for the Assessment of Laboratories Measuring Heat Transfer Properties—Part 2: Measurements by Guarded Hot Plate Method; EN 1946-2:1999; CEN: Brussels, Belgium, 1999. [Google Scholar]
- Italian National Unification. Thermal Performance of Building Materials and Products—Determination of Thermal Resistance by Means of the Hot Plate with Guard Ring and the Heat Flow Meter Method—Thick Products with High and Medium Thermal Resistance; UNI EN 12939:2002; UNI: Milan, Italy, 2002. [Google Scholar]
- Italian National Unification. Energy Performance of Buildings—Energy Needs for Heating and Cooling, Internal Temperatures and Sensible and Latent Heat Loads—Part 1: Calculation Procedures; UNI EN ISO 52016-1:2018; UNI: Milan, Italy, 2018. [Google Scholar]
- Interministerial Decree—Application of the Methodologies for Calculating Energy Performance and Defining the Prescriptions and Minimum Requirements for Buildings; Italian Ministry of Economic Development: Rome, Italy, 2015.
Figure 1.
Example of the progressive weight reduction trend of four samples for the different typologies of materials taken into account (C01, S08, S10, S11) during the drying phase (28 days).
Figure 1.
Example of the progressive weight reduction trend of four samples for the different typologies of materials taken into account (C01, S08, S10, S11) during the drying phase (28 days).

Figure 2.
Sample S05 (100 × 100 mm2), with sheep wool, thistle fibres and lime putty. The sample is showed without (a) and with (b) thermally conductive grease.
Figure 2.
Sample S05 (100 × 100 mm2), with sheep wool, thistle fibres and lime putty. The sample is showed without (a) and with (b) thermally conductive grease.

Figure 3.
Schematic diagram and the concept of heat flow and temperatures in TAURUS TAC300.

Figure 4.
Example of the application of the expanded polystyrene (EPS) to a sample (S05) with 100 × 100 mm2 dimensions (a), and example of a sample (S10) with a surface equal to 300 × 300 mm2 (b).
Figure 4.
Example of the application of the expanded polystyrene (EPS) to a sample (S05) with 100 × 100 mm2 dimensions (a), and example of a sample (S10) with a surface equal to 300 × 300 mm2 (b).

Figure 5.
The multi-storey building used for numerical simulation and related solar paths.

Figure 6.
Effect of water content on thermal conductivity.


Table 1.
Ingredients involved in the samples’ realization.
| Binding Elements | Aggregating Material | Strengthening and Insulating Materials | |
|---|---|---|---|
| Lime | Sand | Sheep wool fibre | 3 cm (±2 mm) long |
| Opus signinum | Thistle fibre | 1 cm (±2 mm) long | |
| Clay | Hemp shives | 1 cm (±2 mm) long | |
| Jute fibre | 1 cm (±2 mm) long | ||
Table 2.
Details of the analysed samples.
| Group | Sample Id. Number and Dimensions | Samples | Materials Used | Sample Composition Dry Weight [%] | Water to Binder Ratio [%] | Density [kg/m3] |
|---|---|---|---|---|---|---|
| Plaster with Recycled Materials | S13 |  | Lime putty | 44% | 32% | 1684.46 |
| (300 × 300 mm2) | Sand | 45% | ||||
| Calcium carbonate | 11% | |||||
| S10 |  | Lime putty & Opus signinum | 44% | 32% | 1793.1 | |
| (300 × 300 mm2) | Sand | 45% | ||||
| Calcium carbonate | 11% | |||||
| S12 |  | Lime putty | 41.50% | 33% | 1793.1 | |
| (300 × 300 mm2) | Opus signinum | 18.50% | ||||
| Sand | 40% | |||||
| S09 |  | Opus signinum | 44% | 32% | 1659.58 | |
| (300 × 300 mm2) | Sand | 45% | ||||
| Calcium carbonate | 11% | |||||
| Plaster with Natural Fibres | S14 |  | Sheep wool fibre | 3% | 39% | 1390.91 |
| Lime putty | 16% | |||||
| (300 × 300 mm2) | Opus signinum | 36% | ||||
| Sand | 35% | |||||
| Calcium carbonate | 9% | |||||
| S11 |  | Sheep wool fibre | 4% | 39% | 1114.61 | |
| Lime putty | 43% | |||||
| (300 × 300 mm2) | Sand | 42% | ||||
| Calcium carbonate | 11% | |||||
| S06 |  | Sheep Wool & Thistle fibres | 3% | 39% | 1101.48 | |
| Lime putty | 16% | |||||
| Opus signinum | 36% | |||||
| (100 × 100 mm2) | Sand | 35% | ||||
| Calcium carbonate | 9% | |||||
| S05 |  | Sheep Wool & Thistle fibres | 4% | 36% | 1206.06 | |
| Lime putty | 43% | |||||
| (100 × 100 mm2) | Sand | 42% | ||||
| Calcium Carbonate | 11% | |||||
| Building Insulation Materials with Natural Fibres | S08 |  | Hemp shives | 50.50% | 39% | 489.94 |
| (300 × 300 mm2) | Lime putty | 42.20% | ||||
| Opus signinum | 7.30% | |||||
| S07 |  | Hemp shives | 55% | 39% | 459.06 | |
| (300 × 300 mm2) | Lime putty | 45% | ||||
| C02 |  | Hemp shives | 30% | 39% | 436.6 | |
| (100 × 100 mm2) | Clay | 70% | ||||
| C01 (100 × 100 mm2) |  | Jute fibre Clay | 21% 79% | 39% | 807.41 |
Table 3.
Discarded samples, prepared at the first attempt.
| Sample Id. Number and Dimensions | Samples | Materials Used |
|---|---|---|
| S04 |  | Sheep wool and Lime putty |
| (100 × 100 mm2) | ||
| S03 |  | Hemp shives and Lime putty |
| (100 × 100 mm2) | ||
| S02 |  | Hemp shives, lime putty and opus signinum |
| (100 × 100 mm2) | ||
| S01 |  | Sheep wool, lime putty and opus signinum |
| (100 × 100 mm2) |
Table 4.
Description of the different cases of study object of the simulation to evaluate the possible energy savings.
Table 4.
Description of the different cases of study object of the simulation to evaluate the possible energy savings.
| Description | Thickness (cm) | |
|---|---|---|
| Case 1 | Opaque building envelope dispersing towards the outside with traditional plaster (lime and cement plaster) | 1.5 |
| Case 2 | Replacement of traditional plaster, using plaster with recycled materials (Opus signinum and lime putty), same specification as samples S9, S10, S12 and S13 (Table 2) | 1.5 |
| Case 3 | Replacement of traditional plaster, using plaster made up with natural fibres (sheep’s wool fibres, lime putty and opus signinum), same specification as samples S11 and S14 (Table 2) | 1.5 |
| Case 4 | Replacement of traditional plaster, using plaster made up with natural fibres (sheep wool and thistle fibres), lime putty and opus signum), same specification as samples S5 and S6 (Table 2) | 1.5 |
| Case 5 | Replacement of traditional plaster with building materials with natural fibres (hemp shives and clay), same specification as of samples C01 and C02 (Table 2) + 1.5 cm of clay plaster | 1.5 + 3 |
| Case 6 | Adding thermal insulation panel in sintered expanded polystyrene (EPS) in order to meet strict national regulations on the opaque building envelope | variable |
Table 5.
Thermal conductivity of the mortar, plastering and insulation materials.
| Samples Tested | Reference Values in the Literature | ||||||
|---|---|---|---|---|---|---|---|
| Sample | Composition | Thermal Conductivity [W/(m·K)] | Materials Used | Thermal Conductivity [W/(m·K)] | Ref. | ||
| @10 °C | @20 °C | @30 °C | @20 °C | ||||
| Thermo-Insulating Natural Plaster with Recycled Materials | Traditional Plasters | ||||||
| S09 | Opus signinum paste | 0.458 | 0.464 | 0.471 | Pure gypsum plaster | 0.70 | [19] |
| S10 | Lime putty and Opus signinum | 0.463 | 0.469 | 0.476 | |||
| S13 | Lime putty | 0.470 | 0.475 | 0.479 | Lime & gypsum plaster | 0.90 | [19] |
| S12 | Lime putty and Opus signinum | 0.425 | 0.430 | 0.436 | |||
| Thermo-Insulating Retrofitting Plaster with Natural Fibres | Plasters and Mortars with Natural Fibres | ||||||
| S05 | Sheep Wool + Thistle fibres and Lime putty | 0.172 | 0.180 | 0.188 | Sicilian sheep wool (washed and unwashed) + Cement | 0.09–0.11 (with 46% wool 1–20 mm) | [28] |
| S06 | Sheep Wool + Thistle fibres, Lime putty and Opus signinum | 0.139 | 0.146 | 0.153 | |||
| S11 | Sheep wool and Lime putty | 0.248 | 0.257 | 0.266 | 0.15–0.25 (with 13% wool 1–20 mm) | ||
| S14 | Sheep Wool, Lime putty and Opus signinum | 0.265 | 0.272 | 0.280 | |||
| Building Insulation Materials with Natural Fibres | Building Materials with Natural Fibres | ||||||
| S07 | Hemp shives and Lime putty | 0.096 | 0.109 | 0.122 | Lime and hemp concrete (‘‘hempcrete’’) | 0.179–0.485 | [27] |
| S08 | Hemp shives, Lime putty, and Opus signinum | 0.093 | 0.107 | 0.121 | |||
| C01 | Hemp shives and clay | 0.124 | 0.139 | 0.151 | Straw and clay | 0.260–0.508 | [25] |
Table 6.
Transmission heat loss coefficient and useful thermal energy requirements for different materials and reference climatic conditions.
Table 6.
Transmission heat loss coefficient and useful thermal energy requirements for different materials and reference climatic conditions.
| Case 1 | Case 2 | Case 3 | Case 4 | Case 5 | Case 6 | |
|---|---|---|---|---|---|---|
| Htr [W/K] | 302.03 | 294.24 | 294.24 | 288.56 | 279.07 | 259.73 |
| (%) | −2.6% | −2.6% | −4.5% | −7.6% | −14.0% | |
| Cagliari | ||||||
| EPH,nd [kWh/m2] | 83.10 | 80.62 | 78.8 | 76.61 | 78.10 | 64.04 |
| (%) | −3.0% | −5.2% | −7.8% | −6.0% | −22.9% | |
| EPC,nd [kWh/m2] | 5.51 | 5.70 | 5.90 | 6.07 | 5.95 | 5.84 |
| (%) | 3.4% | 7.1% | 10.2% | 8.0% | 6.0% | |
| Bolzano | ||||||
| EPH,nd [kWh/m2] | 172.70 | 167.79 | 164.20 | 159.89 | 162.83 | 130.69 |
| (%) | −2.8% | −4.9% | −7.4% | −5.7% | −24.3% | |
| EPC,nd [kWh/m2] | - | - | - | - | - | 0.11 |
| (%) | - | - | - | - | - | |
| Palermo | ||||||
| EPH,nd [kWh/m2] | 54.27 | 52.53 | 51.26 | 49.73 | 50.77 | 41.15 |
| (%) | −3.2% | −5.5% | −8.4% | −6.4% | −24.2% | |
| EPC,nd [kWh/m2] | 22.53 | 22.48 | 22.44 | 22.41 | 22.43 | 22.30 |
| (%) | −0.2% | −0.4% | −0.5% | −0.4% | −1.0% |
Table 7.
Useful thermal energy requirements EPH,nd on walls that already meet the regulatory requirements.
Table 7.
Useful thermal energy requirements EPH,nd on walls that already meet the regulatory requirements.
| Reference Case | Case 2 | Case 3 | Case 4 | Case 5 | ||
|---|---|---|---|---|---|---|
| Cagliari | EPH,nd [kWh/m2] | 64.04 | 64 | 63.95 | 63.88 | 63.47 |
| (%) | −0.1% | −0.1% | −0.2% | −0.9% | ||
| Bolzano | EPH,nd [kWh/m2] | 130.38 | 131.53 | 130.36 | 130.29 | 129.82 |
| (%) | 0.90% | 0% | −0.1% | −0.4% | ||
| Palermo | EPH,nd [kWh/m2] | 41.21 | 41.19 | 41.15 | 41.09 | 40.93 |
| (%) | 0.00% | −0.1% | −0.3% | −0.7% |
Publisher’s Note: MDPI stays neutral with regard to jurisdictional claims in published maps and institutional affiliations. |
© 2021 by the authors. Licensee MDPI, Basel, Switzerland. This article is an open access article distributed under the terms and conditions of the Creative Commons Attribution (CC BY) license (https://creativecommons.org/licenses/by/4.0/).
Share and Cite
MDPI and ACS Style
Majumder, A.; Canale, L.; Mastino, C.C.; Pacitto, A.; Frattolillo, A.; Dell’Isola, M. Thermal Characterization of Recycled Materials for Building Insulation. Energies 2021, 14, 3564. https://0-doi-org.brum.beds.ac.uk/10.3390/en14123564
AMA Style
Majumder A, Canale L, Mastino CC, Pacitto A, Frattolillo A, Dell’Isola M. Thermal Characterization of Recycled Materials for Building Insulation. Energies. 2021; 14(12):3564. https://0-doi-org.brum.beds.ac.uk/10.3390/en14123564
Chicago/Turabian StyleMajumder, Arnas, Laura Canale, Costantino Carlo Mastino, Antonio Pacitto, Andrea Frattolillo, and Marco Dell’Isola. 2021. "Thermal Characterization of Recycled Materials for Building Insulation" Energies 14, no. 12: 3564. https://0-doi-org.brum.beds.ac.uk/10.3390/en14123564
Note that from the first issue of 2016, this journal uses article numbers instead of page numbers. See further details here.