
An Empirical Study of How Household Energy Consumption Is Affected by Co-Owning Different Technological Means to Produce Renewable Energy and the Production Purpose


Abstract
:1. Introduction
2. Literature Review
| • Non-owners | People who are not involved with RE; |
| • Solar-owners | People who (co-)own a solar energy power plant; |
| • Wind-owners | People who (co-)own a wind turbine; |
| • Biogas-owners | People who (co-)own a biogas power plant. |
3. Methodology
3.1. Deliberations on Data Collection
3.2. Deliberations on Measurement
I am willing to…
… use household appliances (e.g., washing machine, dishwasher, etc.) mainly when the share of electricity from renewable sources in the grid is very high.
… recharge electrical devices (e.g., laptop) mainly when the share of electricity from renewable sources in the grid is very high.
… recharge electrical means of transportation (e.g., electric car/scooter/bike) mainly when the share of electricity from renewable sources in the grid is very high.
3.3. Deliberations on the Sample
3.4. Deliberations on the Model Specification
4. Results and Hypothesis Testing
4.1. Comparison According to Type of Renewable Energy Source
Summary H1–H6
4.2. Comparison According to the Usage Possibilities within (Co-)Owners of Solar Power Plants
| • Non-owners | People who are not involved with RE; |
| • Solar-consumers | People who (co-)own solar installations and solely |
| consume produced RE; | |
| • Solar-consellers | People who (co-)own solar installations and consume |
| as well as sell RE at the same time; | |
| • Solar-sellers | People who (co-)own solar installations and solely sell |
| produced RE. |
Summary H7–H12
5. Discussion
6. Conclusions
Author Contributions
Funding
Institutional Review Board Statement
Informed Consent Statement
Acknowledgments
Conflicts of Interest
Abbreviations
| ATT | Average Treatment Effect on the Treated |
| chi2 | Chi square |
| Coef. | Coefficients |
| Conf. | Confidence |
| Cons | Constant |
| DSM | demand side management |
| EE | energy efficiency |
| H | Hypothesis |
| Max | Maximum value |
| Min | Minimum value |
| NGO | non-governmental organization |
| OBS | observations |
| Prob | probability |
| PSM | propensity score matching |
| PV | photovoltaic |
| R2 | R square |
| RE | renewable energy |
| REC | Renewable Energy Communities |
| RED II | Renewable Energy Directive II |
| RES | renewable energy source |
| SCORE | Supporting Consumer Ownership in Renewable Energies |
| Std.Dev. | Standard Deviation |
| vRES | volatile renewable energy sources |
Appendix A. Questionnaire Flow

Appendix B. Questionnaire Screenshots and Translation


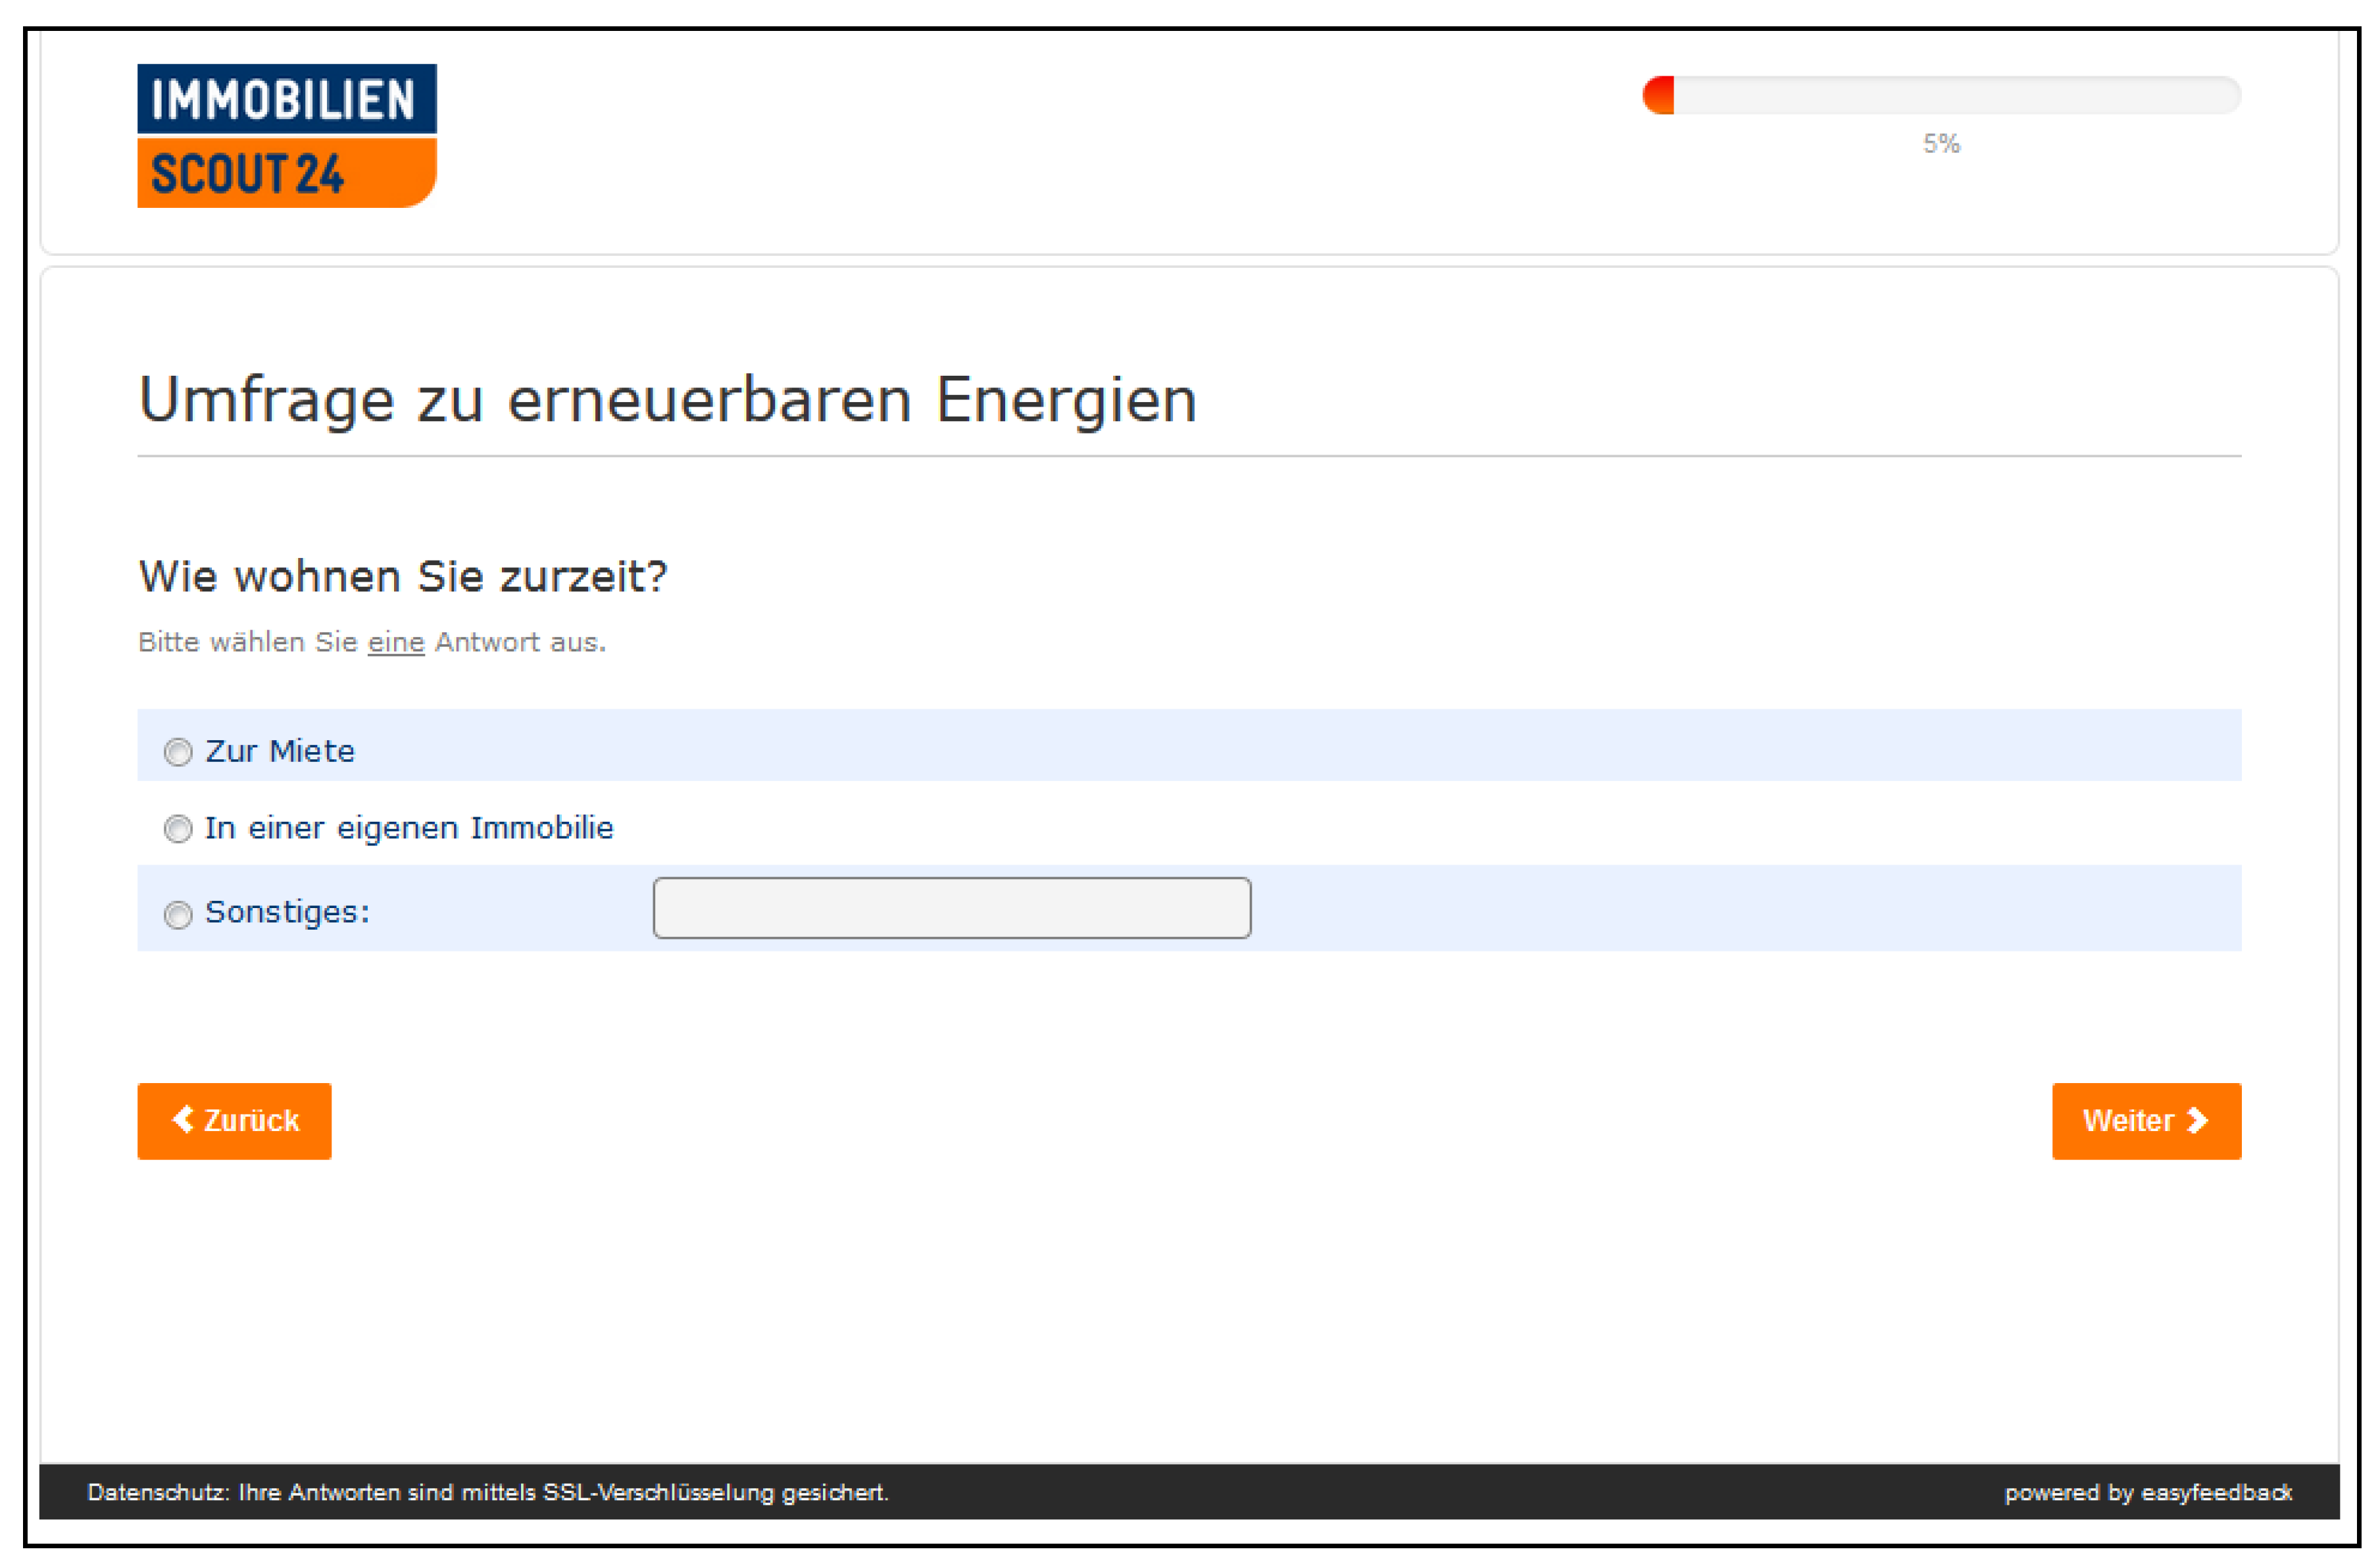
- Rental.
- In your own property.
- Other:

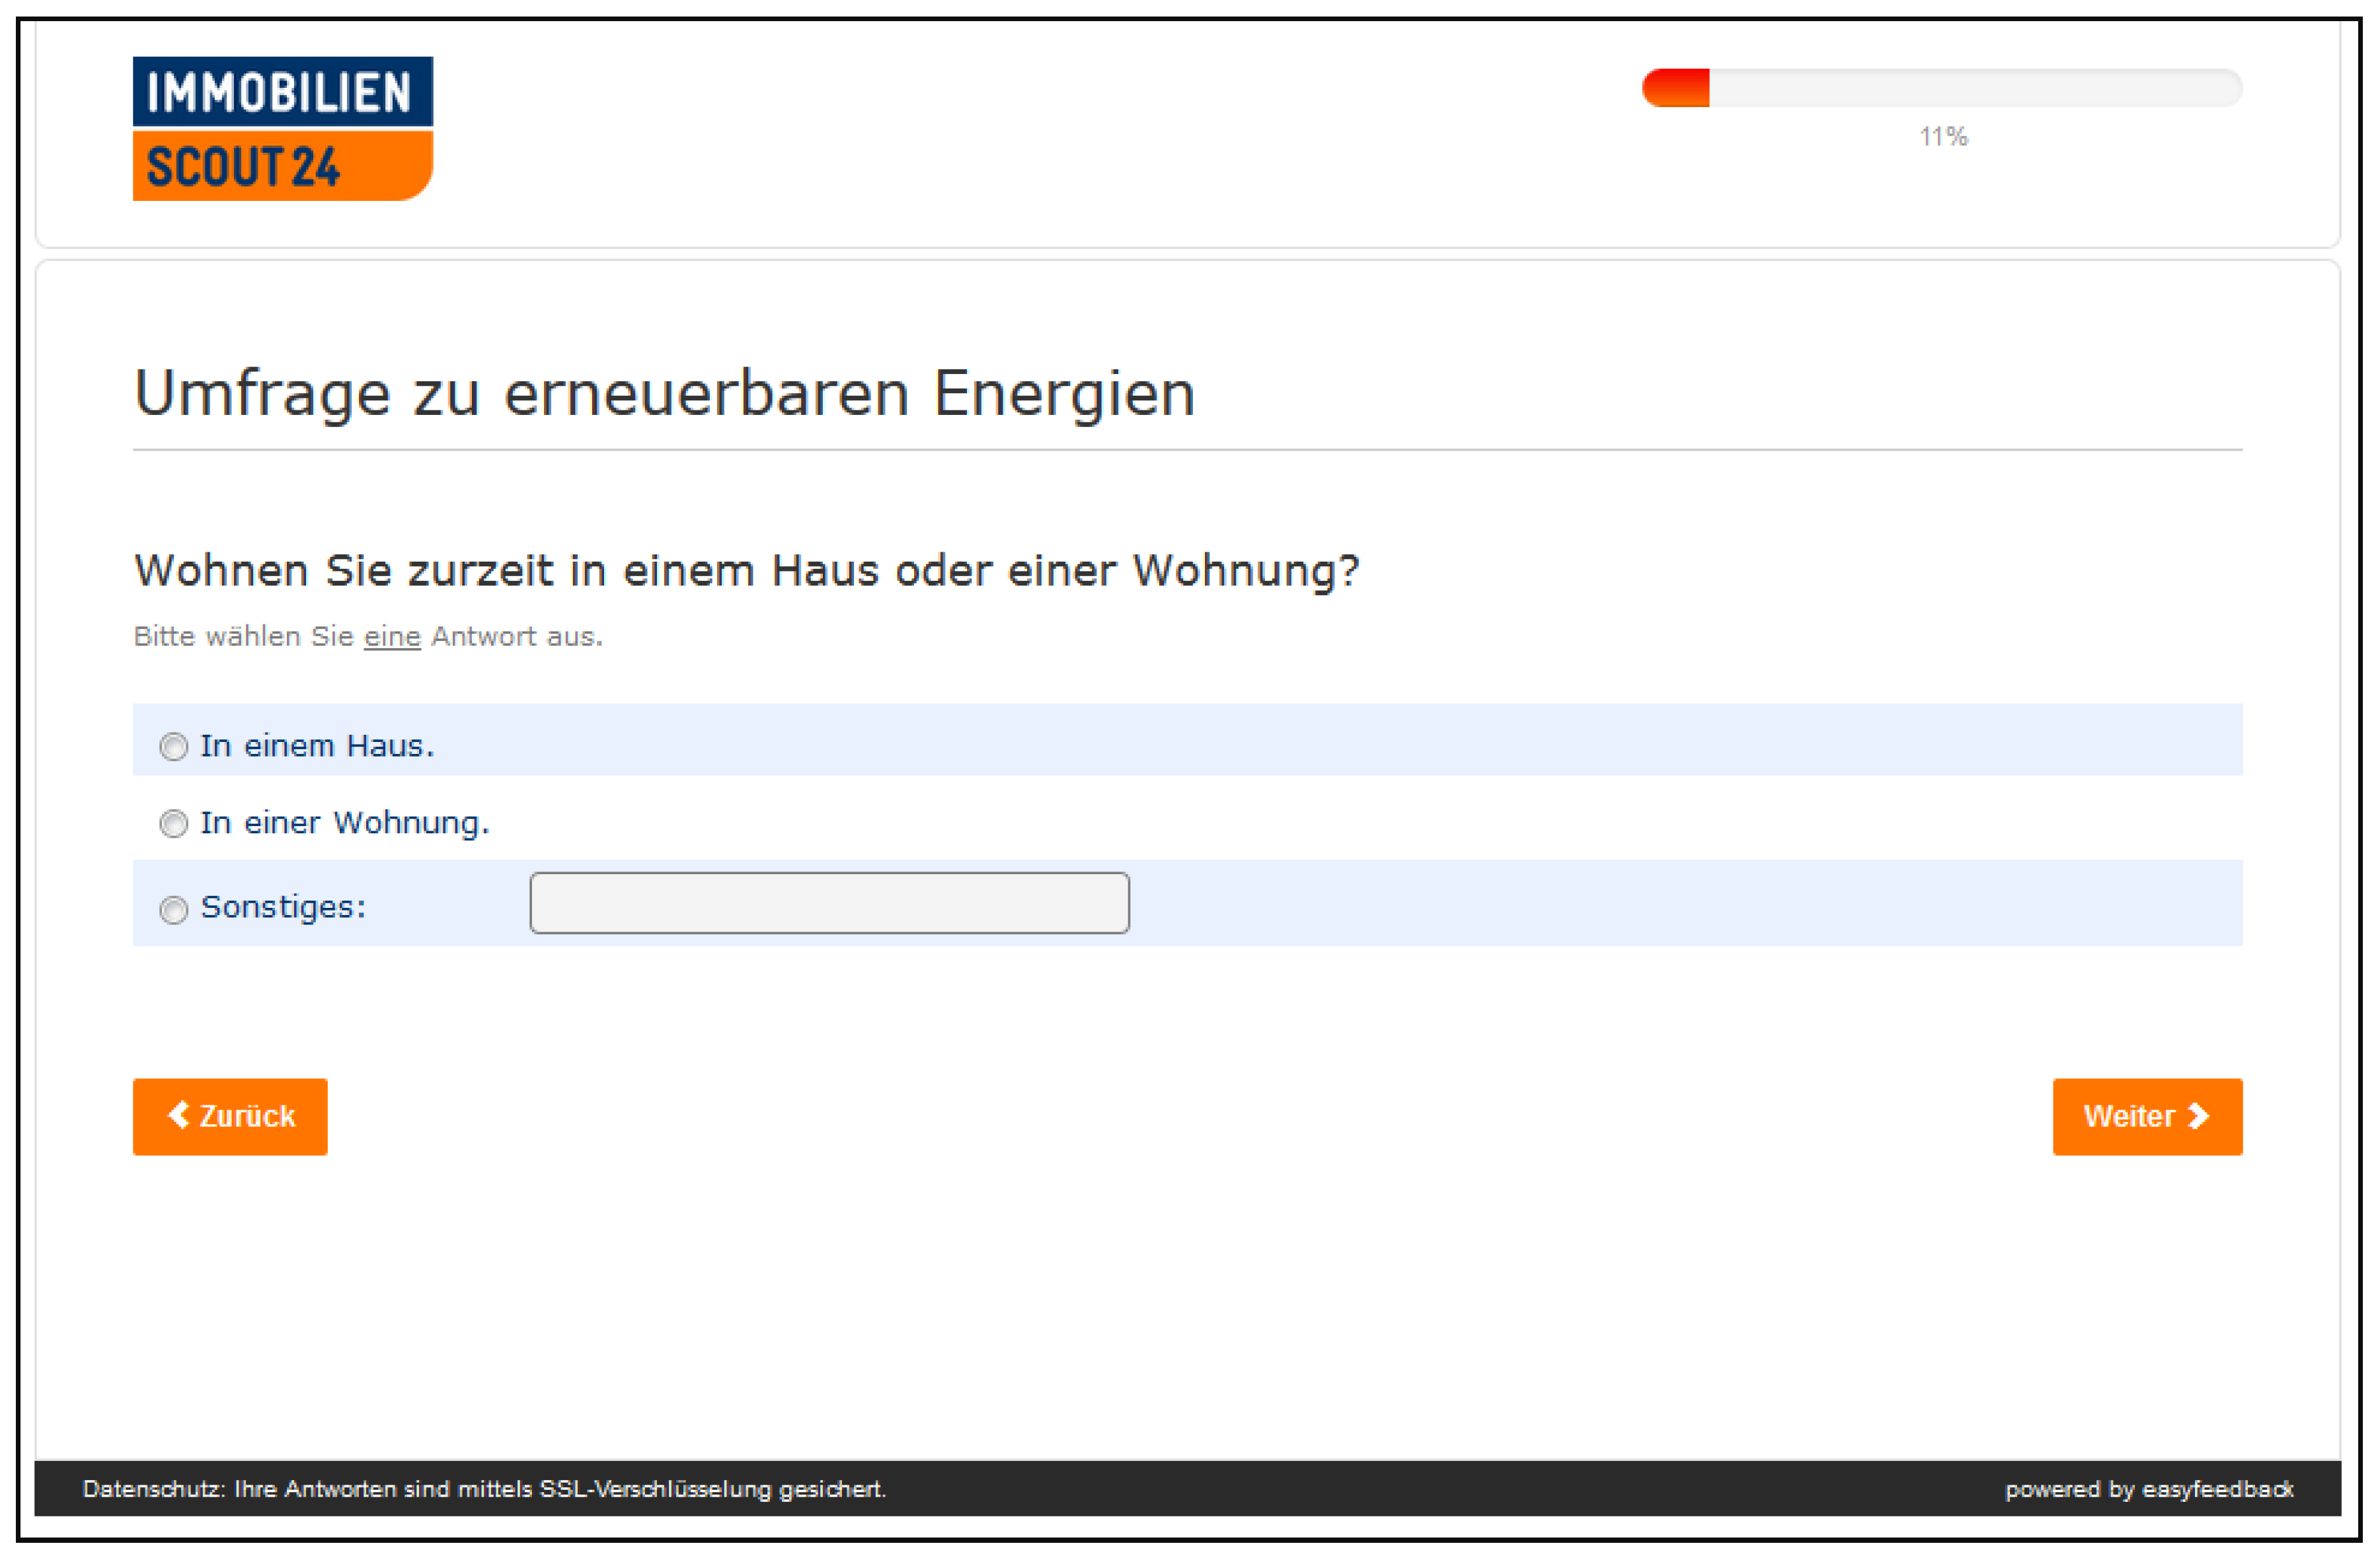
- In a House.
- In a flat.
- Other:

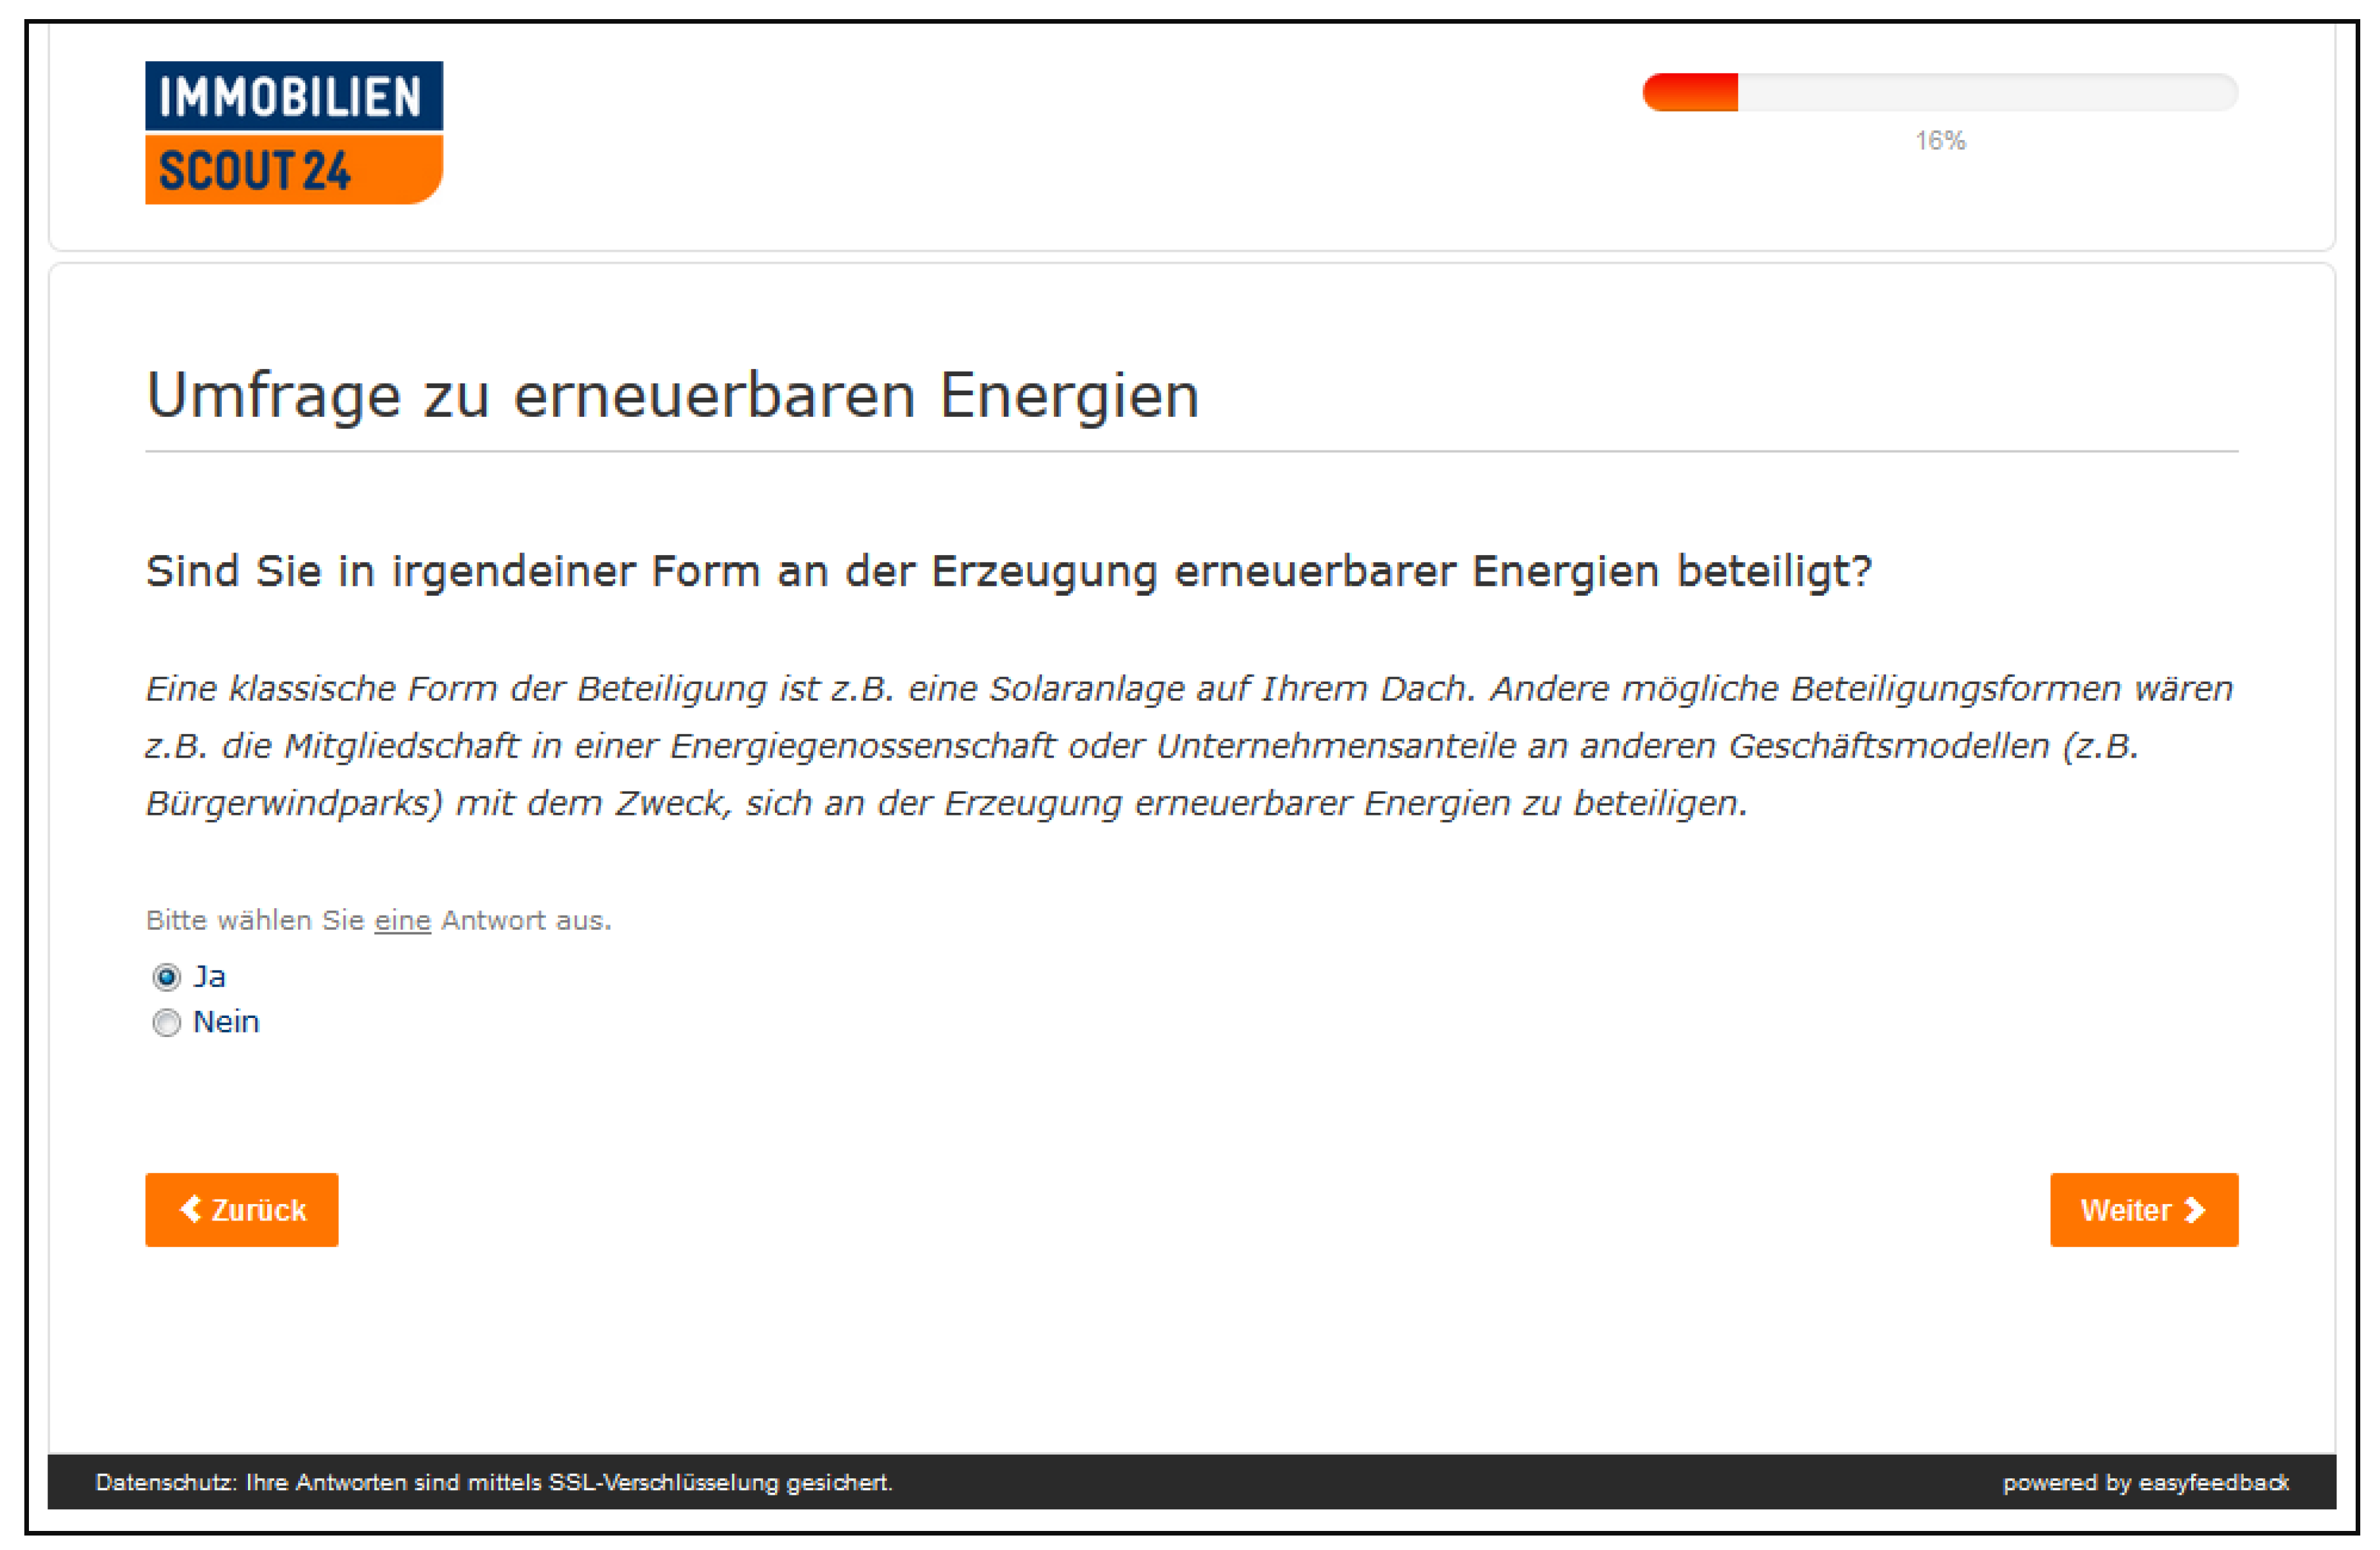
- Yes.
- No.

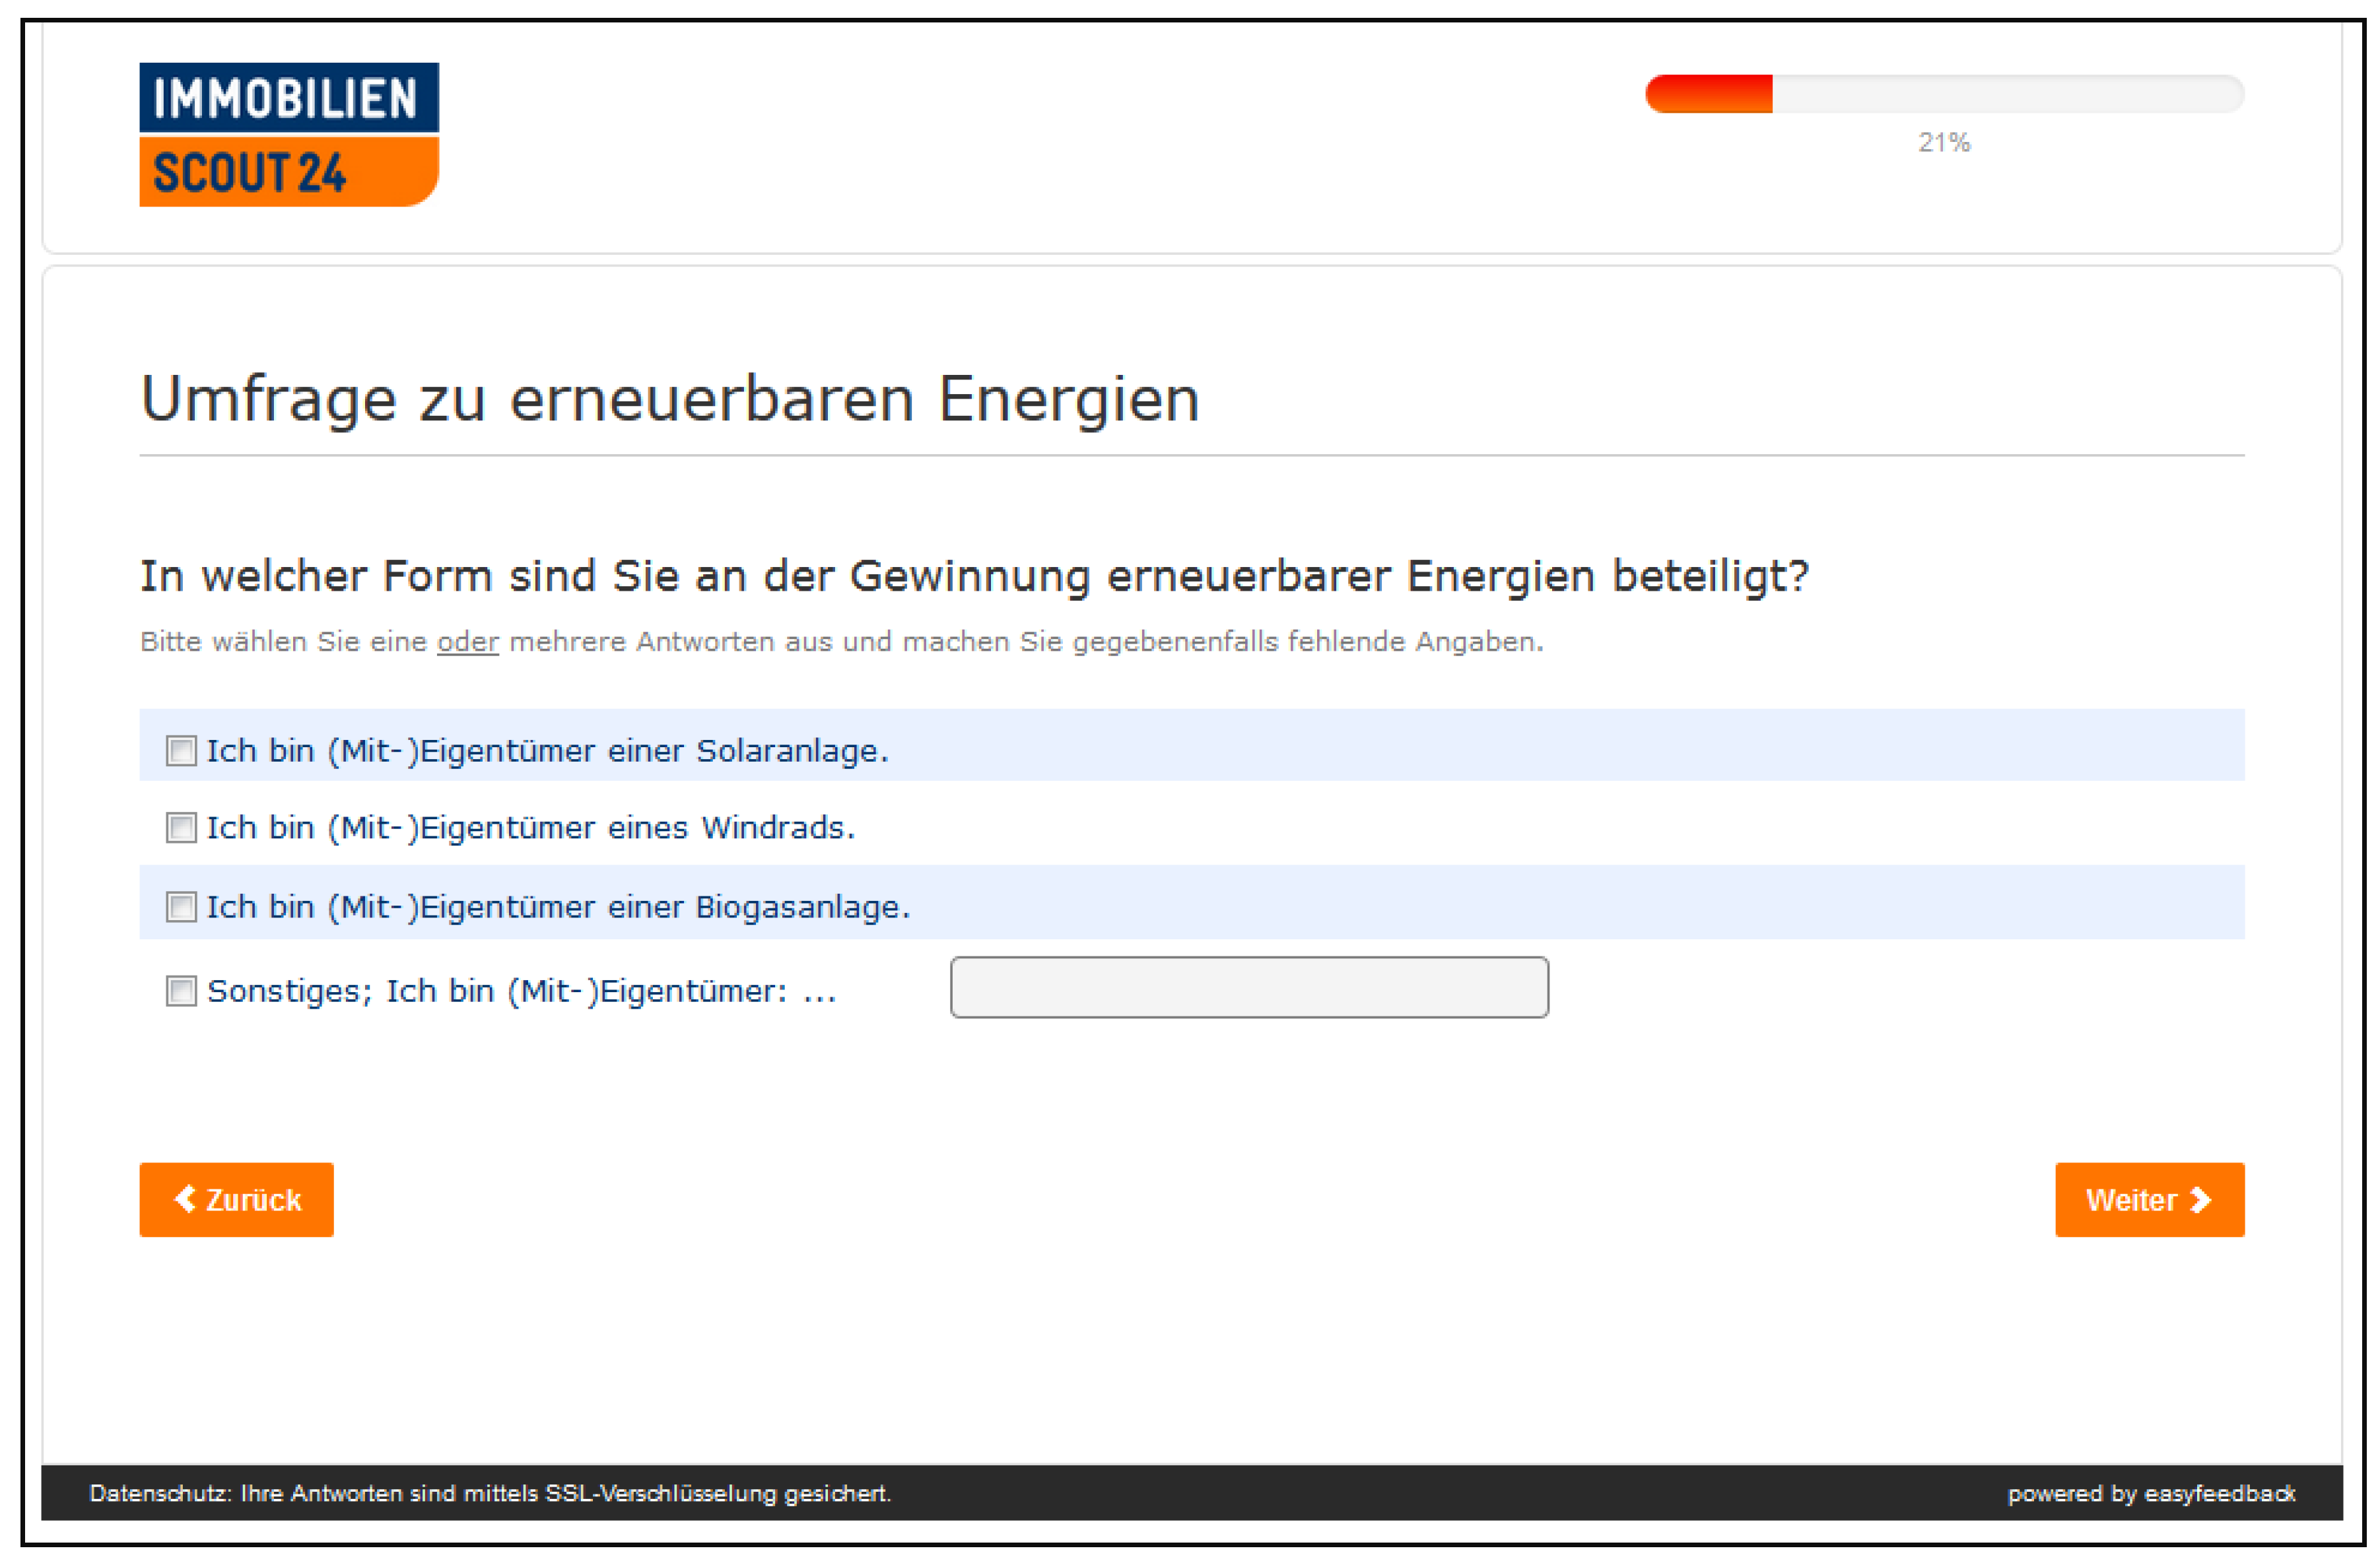
- I am (co-)owner of a solar power plant.
- I am (co-)owner of a wind turbine.
- I am (co-)owner of a biogas power plant
- I am (co-)owner of a: [user input]

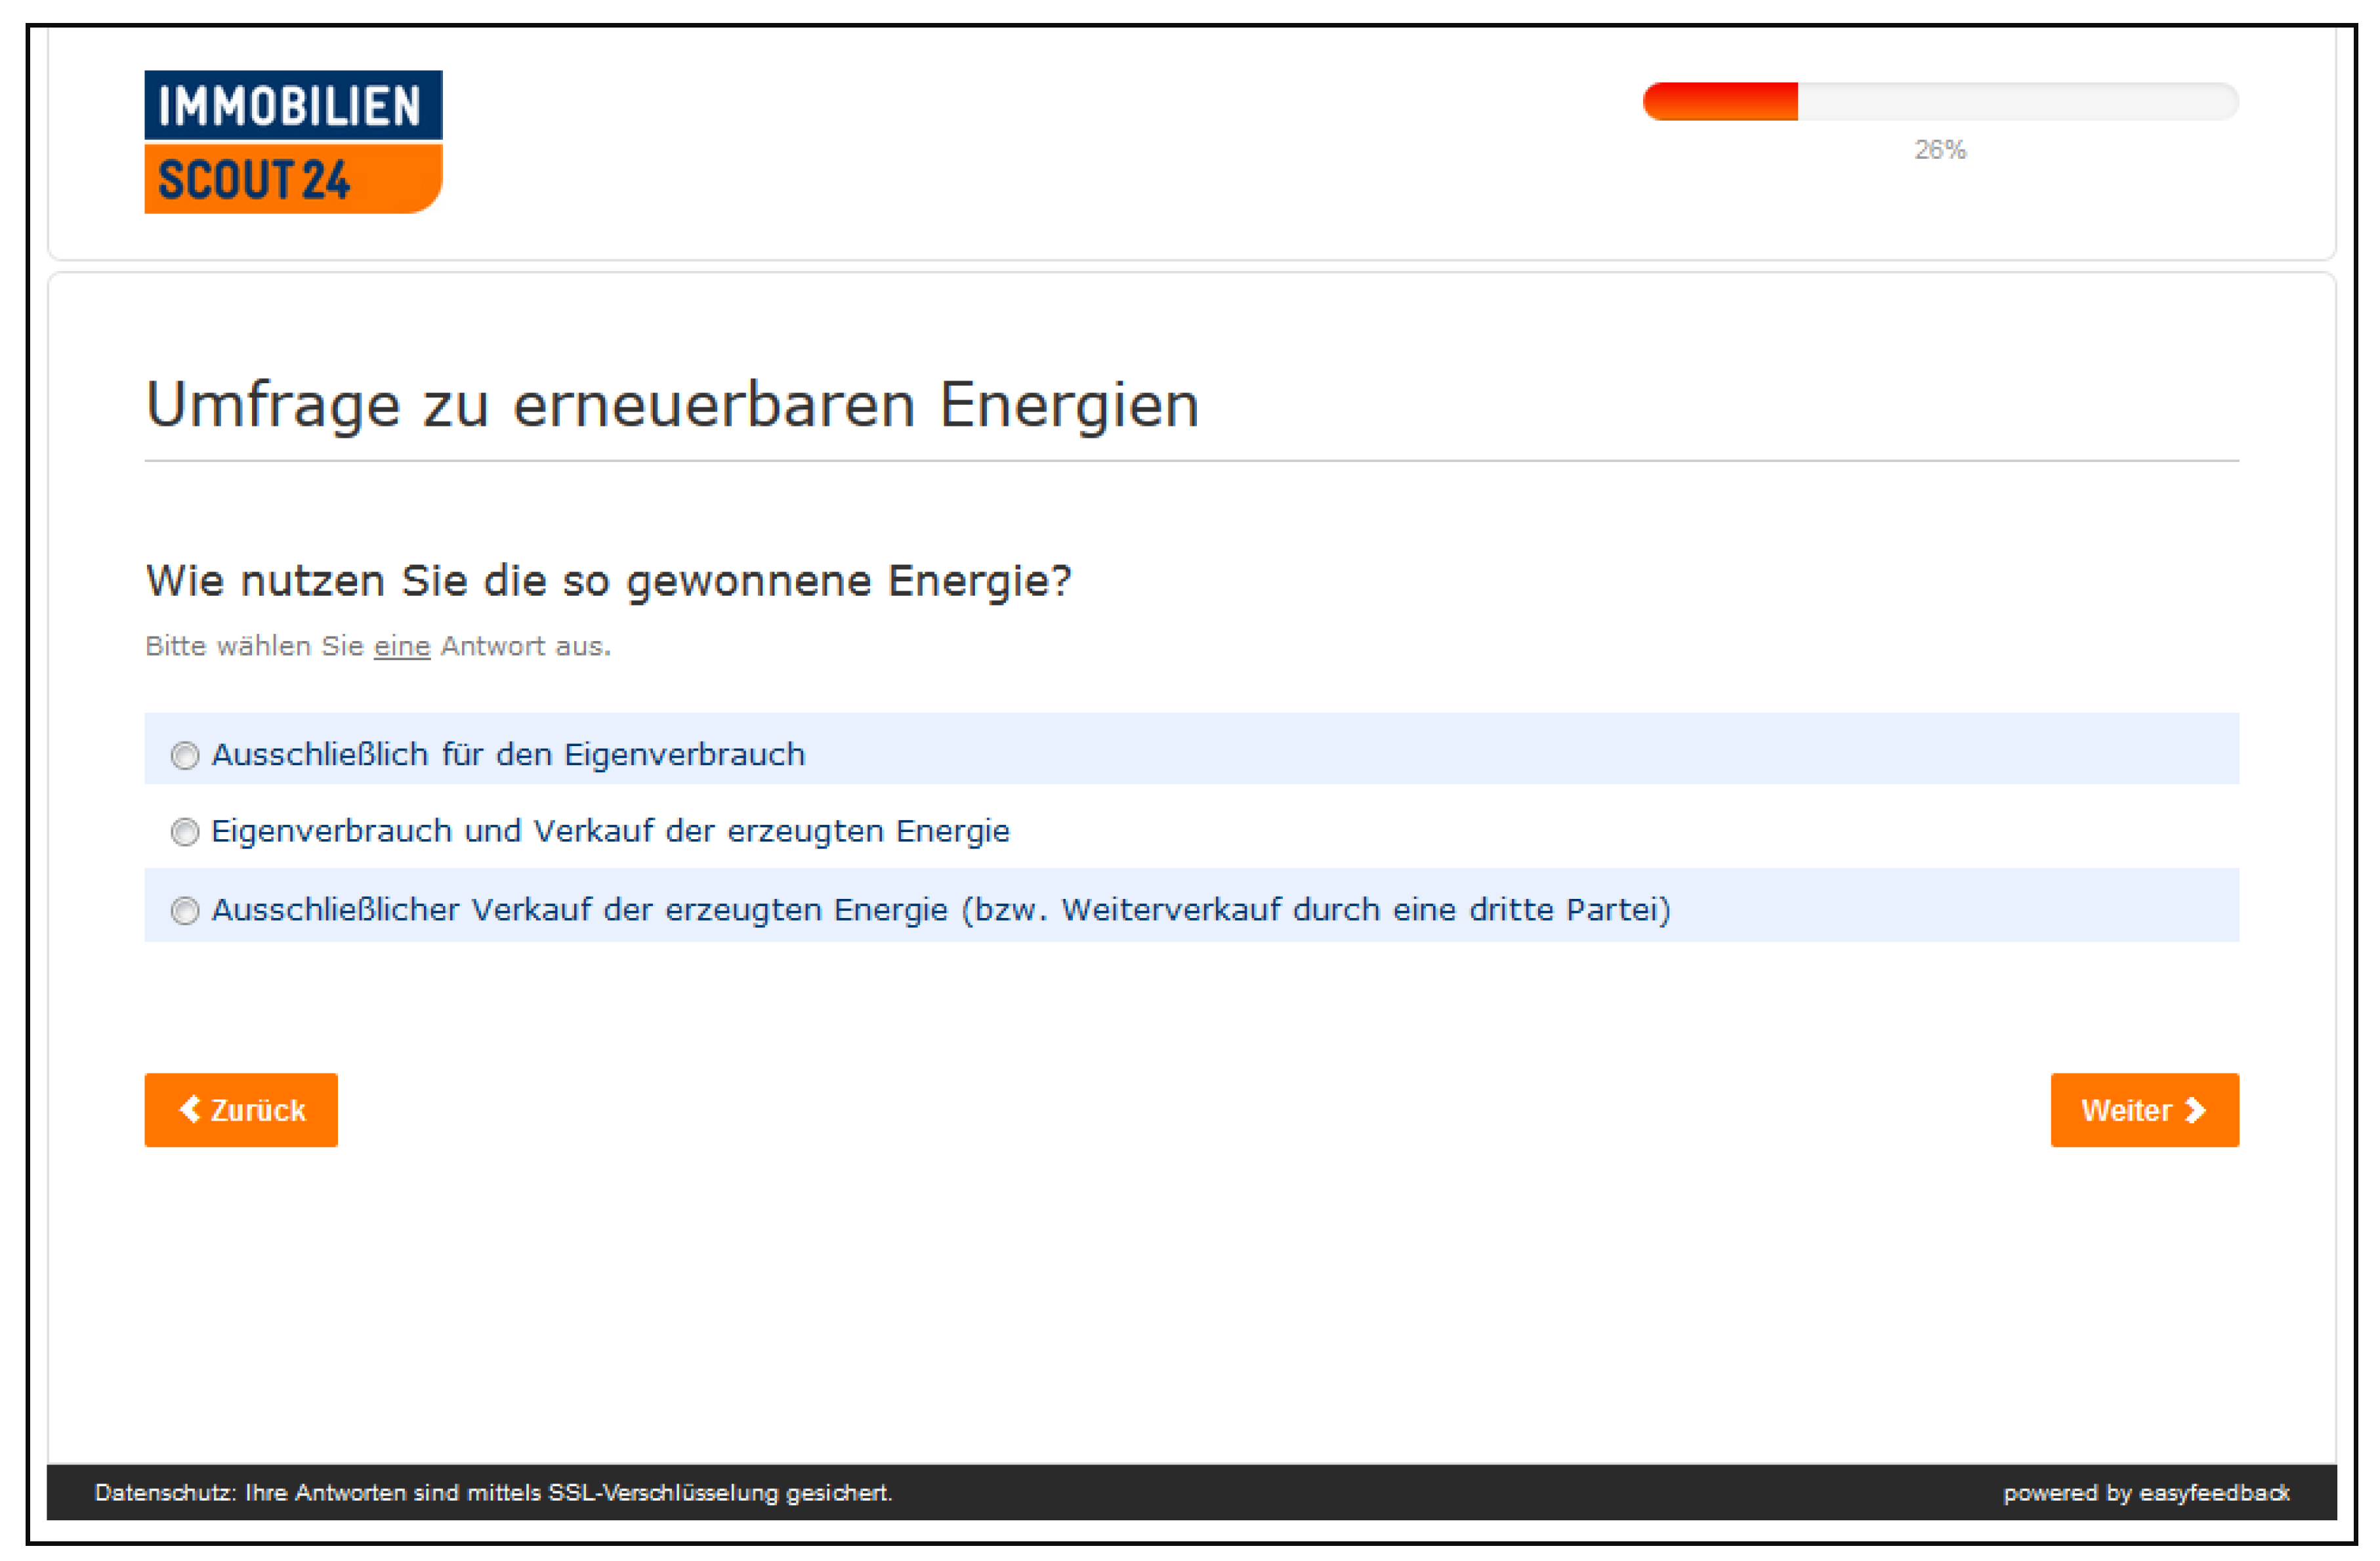
- Solely for own consumption
- Own consumption and sale of the generated energy
- Solely sale of the generated energy (e.g., through a third party)

- Attractive alternative to classic investment opportunities
- Low entry barriers (e.g., participation with small amounts of money possible or low formal effort)
- Reduction of energy costs
- (Partial) independence from electricity price developments
- Contribution to regional value creation/strengthening of regional economy
- Contribution to environmental protection
- Limitation of the market power of large energy suppliers
- Spatial proximity to a project in connection with renewable energies
- Desire to participate in shaping (local) energy policy
- Positive experiences of relatives/acquaintances with projects of this kind
- Other:

- … use household appliances (e.g., washing machine, dishwasher, etc.) mainly when the share of electricity from renewable sources in the grid is very high.
- … recharge electrical devices (e.g., laptop) mainly when the share of electricity from renewable sources in the grid is very high.
- … recharge electrical means of transportation (e.g., electric car/scooter/bike) mainly when the share of electricity from renewable sources in the grid is very high.

- …to use my household electrical appliances (washing machine, dishwasher, etc.) mainly during production peaks.
- …to charge my electrical devices (e.g., laptop) mainly during production peaks.
- …to charge my electronic means of transportation (electric car, e-bike, e-scooter etc.) mainly during production peaks.

- …use my household electrical appliances (washing machine, dishwasher, etc.) mainly during production peaks.
- …charge my electrical devices (e.g., laptop) mainly during production peaks
- …charge my electronic means of transportation (electric car, e-bike, e-scooter etc.) mainly during production peaks.

- High (installation) costs
- Data protection concerns
- Insufficient coordination with other consumers/insufficient network infrastructure
- Insufficient information about the added value of smart meter deployment (e.g., cost savings, energy efficiency potential)
- I do not know
- Other:

- Detailed display of consumption, amount of electricity produced and electricity costs
- Facilitation of billing processes (e.g., remote reading by suppliers)
- Flexibilization of billing schemes (e.g., monthly billing)
- Analysis of own consumption data/creation of a consumption profile
- (Anonymized comparisons with other users as benchmarking
- Possibility of automatic/remote controlled switching on of household appliances depending on production fluctuations (or in absence, e.g., during vacation time)
- I do not know
- Other:

- Male
- Female
- Yes under 500 euro/month
- Yes between 500 and 1000 euro net/month
- Yes between 1001 and 2000 euro net/month
- Yes between 2001 and 3000 euro net/month
- Yes between 3001 and 4000 euro net/month
- Yes between 4001 and 5000 euro net/month
- Yes over 5000 euro net/month
- No
- Prefer not to say


Appendix C

| Variable | Obs | Mean | Std.Dev. | Min | Max |
|---|---|---|---|---|---|
| participation | 2074 | 1.873 | 0.333 | 1 | 2 |
| usage | 264 | 1.693 | 0.823 | 1 | 3 |
| group | 2074 | 0.143 | 0.4 | 0 | 3 |
| age | 1978 | 4.616 | 1.416 | 1 | 7 |
| income | 1855 | 4.698 | 1.61 | 1 | 8 |
| education | 1934 | 3.56 | 1.472 | 1 | 6 |
| population | 1913 | 3.832 | 1.626 | 1 | 6 |
| gender | 1954 | 0.403 | 0.491 | 0 | 1 |
| df_household | 1994 | 3.483 | 1.391 | 1 | 5 |
| df_electrical | 2006 | 3.061 | 1.481 | 1 | 5 |
| df_transport | 1700 | 3.439 | 1.482 | 1 | 5 |
| participation | 2074 | 1.873 | 0.333 | 1 | 2 |

Appendix D
| Generated Sample | 2143 |
| Participants with else option | −50 |
| Cases with contradictory answers | −7 |
| (co-)owners of more than one installation | −12 |
| Remaining sample | 2074 |
| Participation | Coef. | Std. Err | z-Value | p-Value | [95% Conf. Interval] |
|---|---|---|---|---|---|
| gender | −0.3719166 | 0.1514672 | −2.46 | 0.014 | −0.6687869 −0.0750463 |
| age | 0.1806668 | 0.0652584 | 2.77 | 0.006 | 0.0527627 0.3085708 |
| income | 0.1312171 | 0.0581692 | 2.26 | 0.024 | 0.0172075 0.2452267 |
| education | 0.1018039 | 0.0646431 | 1.57 | 0.115 | −0.0248943 0.2285022 |
| population | −0.2589355 | 0.0633851 | −4.09 | 0.000 | −0.383168 −0.1347029 |
| _cons | −1.851322 | 0.0873159 | −21.20 | 0.000 | −2.022459 −1.680186 |
References
- International Energy Agency. Renewables 2018: Market Analysis and Forecast from 2018 to 2023. 2019. Available online: https://www.iea.org/renewables2018/power/ (accessed on 3 June 2021).
- Muruganantham, B.; Gnanadass, R.; Padhy, N.P. Challenges with renewable energy sources and storage in practical distribution systems. Renew. Sustain. Energy Rev. 2017, 73, 125–134. [Google Scholar] [CrossRef]
- Da Graça Carvalho, M. EU energy and climate change strategy. Energy 2012, 40, 19–22. [Google Scholar] [CrossRef]
- Larsson, S.; Fantazzini, D.; Davidsson, S.; Kullander, S.; Höök, M. Review-ing electricity production cost assessments. Renew. Sustain. Energy Rev. 2014, 30, 170–183. [Google Scholar] [CrossRef] [Green Version]
- Aust, B.; Morscher, C. Negative Strompreise in Deutschland. Wirtschaftsdienst 2017, 97, 304–306. [Google Scholar] [CrossRef] [Green Version]
- Kubli, M.; Loock, M.; Wüstenhagen, R. The flexible prosumer: Measuring the willingness to co-create distributed flexibility. Energy Policy 2018, 114, 540–548. [Google Scholar] [CrossRef]
- Roth, L.; Lowitzsch, J.; Yildiz, Ö.; Hashani, A. Does (Co-)ownership in renewables matter for an electricity consumer’s demand flexibility? Empirical evidence from Germany. Energy Res. Soc. Sci. 2018, 46, 169–182. [Google Scholar] [CrossRef]
- Belu, R. Fundamentals and Source Characteristics of Renewable energy Systems; CRC Press: Raton, NM, USA, 2019. [Google Scholar]
- Strielkowski, W.; Lisin, E.; Astachova, E. Economic sustainability of energy systems and prices in the EU. Entrep. Sustain. Issues 2017, 4, 591–600. [Google Scholar] [CrossRef] [Green Version]
- Dudin, M.N.; Frolova, E.E.; Protopopova, O.V.; Mamedov, A.A.; Odintsov, S.V. Study of innovative technologies in the energy industry: Nontraditional and renewable energy sources. Entrep. Sustain. Issues 2019, 6, 1704–1713. [Google Scholar] [CrossRef]
- Dunkelberg, H.; Heidrich, T.; Weiß, T.; Hesselbach, J. Energy demand flexibilization of industrial consumers. J. Simul. 2020, 14, 53–63. [Google Scholar] [CrossRef]
- Kuzemko, C.; Mitchell, C.; Lockwood, M.; Hoggett, R. Policies, politics and demand side innovations: The untold story of Germany’s energy transition. Energy Res. Soc. Sci. 2017, 28, 58–67. [Google Scholar] [CrossRef]
- Shariatzadeh, F.; Mandal, P.; Srivastava, A.K. Demand response for sus-tainable energy systems: A review, application and implementation strategy. Renew. Sustain. Energy Rev. 2015, 45, 343–350. [Google Scholar] [CrossRef]
- Shen, B.; Ghatikar, G.; Lei, Z.; Li, J.; Wikler, G.; Martin, P. The role of regulatory reforms, market changes, and technology development to make demand response a viable resource in meeting energy challenges. Appl. Energy 2014, 130, 814–823. [Google Scholar] [CrossRef]
- Valdes, J.; Poque González, A.B.; Ramirez Camargo, L.; Valin Fenández, M.; Masip Macia, Y.; Dorner, W. Industry, flexibility, and demand response: Applying German energy transition lessons in Chile. Energy Res. Soc. Sci. 2019, 54, 12–25. [Google Scholar] [CrossRef]
- Siano, P. Demand response and smart grids—A survey. Renew. Sustain. Energy Rev. 2014, 30, 461–478. [Google Scholar] [CrossRef]
- Tristán, A.; Heuberger, F.; Sauer, A. A Methodology to Systematically Identify and Characterize Energy Flexibility Measures in Industrial Systems. Energies 2020, 13, 5887. [Google Scholar] [CrossRef]
- Sundt, S.; Rehdanz, K.; Meyerhoff, J. Consumers’ Willingness to Accept Time-of-Use Tariffs for Shifting Electricity Demand. Energies 2020, 13, 1895. [Google Scholar] [CrossRef]
- Gottwalt, S.; Ketter, W.; Block, C.; Collins, J.; Weinhardt, C. Demand side management—A simulation of household behavior under variable prices. Energy Policy 2011, 39, 8163–8174. [Google Scholar] [CrossRef]
- Dütschke, E.; Paetz, A.G. Dynamic electricity pricing—Which programs do consumers prefer? Energy Policy 2013, 59, 226–234. [Google Scholar] [CrossRef] [Green Version]
- Stelmach, G.; Zanocco, C.; Flora, J.; Rajagopal, R.; Boudet, H.S. Exploring household energy rules and activities during peak demand to better determine potential responsiveness to time-of-use pricing. Energy Policy 2020, 144, 111608. [Google Scholar] [CrossRef]
- Lund, P.D.; Lindgren, J.; Mikkola, J.; Salpakari, J. Review of energy system flexibility measures to enable high levels of variable renewable electricity. Renew. Sustain. Energy Rev. 2015, 45, 785–807. [Google Scholar] [CrossRef] [Green Version]
- Abbas, A.O.; Chowdhury, B.H. Using customer-side resources for market-based transmission and distribution level grid services—A review. Int. J. Electr. Power Energy Syst. 2021, 125, 106480. [Google Scholar] [CrossRef]
- Azarova, V.; Cohen, J.J.; Kollmann, A.; Reichl, J. Reducing household electricity consumption during evening peak demand times: Evidence from a field experiment. Energy Policy 2020, 144, 111657. [Google Scholar] [CrossRef]
- Podbregar, I.; Filipović, S.; Radovanović, M.; Mirković Isaeva, O.; Šprajc, P. Electricity Prices and Consumer Behavior, Case Study Serbia—Randomized Control Trials Method. Energies 2021, 14, 591. [Google Scholar] [CrossRef]
- Nasr, A.K.; Kashan, M.K.; Maleki, A.; Jafari, N.; Hashemi, H. Assessment of Barriers to Renewable Energy Development Using Stakeholders Approach. Entrep. Sustain. Issues 2020, 7, 2526–2541. [Google Scholar]
- Yu, Y.; Guo, J. Identifying electricity-saving potential in rural China: Empirical evidence from a household survey. Energy Policy 2016, 94, 1–9. [Google Scholar] [CrossRef]
- Whittle, C.; Jones, C.R.; While, A. Empowering householders: Identifying predictors of intentions to use a home energy management system in the United Kingdom. Energy Policy 2020, 139, 111343. [Google Scholar] [CrossRef]
- Gołębiowska, B.; Bartczak, A.; Budziński, W. Impact of social comparison on preferences for Demand Side Management in Poland. Energy Policy 2021, 149, 112024. [Google Scholar] [CrossRef]
- Frederiks, E.R.; Stenner, K.; Hobman, E.V. Household energy use: Applying behavioural economics to understand consumer decision-making and behaviour. Renew. Sustain. Energy Rev. 2015, 41, 1385–1394. [Google Scholar] [CrossRef] [Green Version]
- Genys, D.; Krikštolaitis, R. Clusterization of public perception of nuclear energy in relation to changing political priorities. Insights Reg. Dev. 2020, 2, 750–764. [Google Scholar] [CrossRef]
- Gołębiowska, B.; Bartczak, A.; Czajkowski, M. Energy Demand Management and Social Norms. Energies 2020, 13, 3779. [Google Scholar] [CrossRef]
- Rommel, J.; Radtke, J.; Von Jorck, G.; Mey, F.; Yildiz, Ö. Community renewable energy at a crossroads: A think piece on degrowth, technology, and the democratization of the German energy system. J. Clean. Prod. 2018, 197, 1746–1753. [Google Scholar] [CrossRef]
- Yildiz, Ö. Financing renewable energy infrastructures via financial citizen participation–The case of Germany. Renew. Energy 2014, 68, 677–685. [Google Scholar] [CrossRef]
- Yildiz, Ö.; Sagebiel, J. Consumer (Co-)Ownership and Behaviour: Economic Experiments as a Tool for Analysis. In Energy Transition; Lowitzsch, J., Ed.; Springer International Publishing: Cham, Swizterland, 2019; pp. 99–112. [Google Scholar]
- Anda, M.; Temmen, J. Smart metering for residential energy efficiency: The use of community based social marketing for behavioural change and smart grid intro-duction. Renew. Energy 2014, 67, 119–127. [Google Scholar] [CrossRef]
- Hoppe, T.; Coenen, F.H.; Bekendam, M.T. Renewable energy cooperatives as a stimulating factor in household energy savings. Energies 2019, 12, 1188. [Google Scholar] [CrossRef] [Green Version]
- Goulden, M.; Bedwell, B.; Rennick-Egglestone, S.; Rodden, T.; Spence, A. Smart grids, smart users? The role of the user in demand side management. Energy Res. Soc. Sci. 2014, 2, 21–29. [Google Scholar] [CrossRef]
- Ellabban, O.; Abu-Rub, H.; Blaabjerg, F. Renewable energy resources: Cur-rent status, future prospects and their enabling technology. Renew. Sustain. Energy Rev. 2014, 39, 748–764. [Google Scholar] [CrossRef]
- Jacobsson, S.; Johnson, A. The diffusion of renewable energy technology: An analytical framework and key issues for research. Energy Policy 2000, 28, 625–640. [Google Scholar] [CrossRef] [Green Version]
- Immobilien Scout GmbH Unternehmen. 2020. Available online: http://www.immobilienscout24.de/unternehmen/immobilienscout24.html (accessed on 14 April 2020).
- Weiß, J.; Dunkelberg, E.; Gossen, M.; Großmann, D. Bedeutung regional-ökonomischer Faktoren für die Entscheidung von Eigenheimbesitzern. Okol. Wirtsch. Fachz. 2016, 31, 45. [Google Scholar] [CrossRef] [Green Version]
- Edwards, P.; Cooper, R.; Roberts, I.; Frost, C. Meta-analysis of randomised trials of monetary incentives and response to mailed questionnaires. J. Epidemiol. Community Health 2005, 59, 987–999. [Google Scholar] [CrossRef]
- Young, B.; Bedford, L.; das Nair, R.; Gallant, S.; Littleford, R.; Robertson JF, R.; Schembri, S.; Sullivan, F.M.; Vedhara, K.; Kendrick, D. Unconditional and conditional monetary incentives to in-crease response to mailed questionnaires: A ran-domized controlled study within a trial (SWAT). J. Eval. Clin. Pract. 2020, 26, 893–902. [Google Scholar] [CrossRef]
- Nulty, D.D. The adequacy of response rates to online and paper surveys: What can be done? Assess. Eval. High. Educ. 2008, 33, 301–314. [Google Scholar] [CrossRef] [Green Version]
- Petchenik, J.; Watermolen, D.J. A Cautionary Note on Using the Internet to Survey Recent Hunter Education Graduates. Hum. Dimens. Wildl. 2011, 16, 216–218. [Google Scholar] [CrossRef]
- Sax, L.J.; Gilmartin, S.K.; Bryant, A.N. Assessing response rates and non-response bias in web and paper surveys. Res. High. Educ. 2003, 44, 409–432. [Google Scholar] [CrossRef]
- Burns, A.C.; Bush, R.F.; Sinha, N. Marketing Research; Pearson: Boston, MA, USA, 2014. [Google Scholar]
- Firth, S.; Lomas, K.; Wright, A.; Wall, R. Identifying trends in the use of domestic appliances from household electricity consumption measurements. Energy Build. 2008, 40, 926–936. [Google Scholar] [CrossRef] [Green Version]
- Naus, J.; van Vliet, B.J.; Hendriksen, A. Households as change agents in a Dutch smart energy transition: On power, privacy and participation. Energy Res. Soc. Sci. 2015, 9, 125–136. [Google Scholar] [CrossRef]
- Moser, C. The role of perceived control over appliances in the acceptance of electricity load-shifting programmes. Energy Effic. 2017, 10, 1115–1127. [Google Scholar] [CrossRef]
- Pallonetto, F.; Oxizidis, S.; Milano, F.; Finn, D. The effect of time-of-use tariffs on the demand response flexibility of an all-electric smart-grid-ready dwelling. Energy Build. 2016, 128, 56–67. [Google Scholar] [CrossRef]
- Austin, P.C.; Jembere, N.; Chiu, M. Propensity score matching and complex surveys. Stat. Methods Med. Res. 2018, 27, 1240–1257. [Google Scholar] [CrossRef]
- Dugoff, E.H.; Schuler, M.; Stuart, E.A. Generalizing observational study results: Applying propensity score methods to complex surveys. Health Serv. Res. 2014, 49, 284–303. [Google Scholar] [CrossRef]
- Frippiat, D.; Marquis, N.; Wiles-Portier, E. Web Surveys in the Social Sciences: An Overview. Population 2010, 65, 285. [Google Scholar] [CrossRef]
- Schonlau, M.; Couper, M.P. Options for Conducting Web Surveys. Stat. Sci. 2017, 32, 279–292. [Google Scholar] [CrossRef]
- Valliant, R.; Dever, J.A. Estimating Propensity Adjustments for Volunteer Web Surveys. Sociol. Methods Res. 2011, 40, 105–137. [Google Scholar] [CrossRef]
- Rosenbaum, P.R.; Rubin, D.B. Constructing a Control Group Using Multivariate Matched Sampling Methods That Incorporate the Propensity Score. Am. Stat. 1985, 39, 33–38. [Google Scholar]
- Neukrug, E.; Fawcett, R.C. Essentials of Testing and Assessment: A Practical Guide to Counselors, Social Workers, and Psychologists, 3rd ed.; Cengage Learning: Stanford, CT, USA, 2015. [Google Scholar]
- Desgagné, A.; Castilloux, A.-M.; Angers, J.-F.; Le Lorier, J. The Use of the Bootstrap Statistical Method for the Pharmacoeconomic Cost Analysis of Skewed Data. Pharmacoeconomics 1998, 13, 487–497. [Google Scholar] [CrossRef]
- Diebold, F.X.; Chen, C. Testing structural stability with endogenous break-point: A size comparison of analytic and bootstrap procedures. J. Econom. 1996, 70, 221–241. [Google Scholar] [CrossRef]
- Hall, P.; Horowitz, J.L. Bootstrap Critical Values for Tests Based on Generalized-Method-of-Moments Estimators. Econometrica 1996, 64, 891. [Google Scholar] [CrossRef]
- Klein, S.J.; Coffey, S. Building a sustainable energy future, one community at a time. Renew. Sustain. Energy Rev. 2016, 60, 867–880. [Google Scholar] [CrossRef] [Green Version]
- van der Schoor, T.; Scholtens, B. The power of friends and neighbors: A review of community energy research. Curr. Opin. Environ. Sustain. 2019, 39, 71–80. [Google Scholar] [CrossRef]
- Von Wirth, T.; Gislason, L.; Seidl, R. Distributed energy systems on a neighbourhood scale: Reviewing drivers of and barriers to social acceptance. Renew. Sustain. Energy Rev. 2018, 82, 2618–2628. [Google Scholar] [CrossRef]
- Holstenkamp, L.; Kahla, F. What are community energy companies trying to accomplish? An empirical investigation of investment motives in the German case. Energy Policy 2016, 97, 112–122. [Google Scholar] [CrossRef]
- Hanke, F.; Lowitzsch, J. Empowering Vulnerable Consumers to Join Renewable Energy Communities—Towards an Inclusive Design of the Clean Energy Package. Energies 2020, 13, 1615. [Google Scholar] [CrossRef] [Green Version]
- Freiman, J.A.; Chalmers, T.C.; Smith, H.; Kuebler, R.R. The Importance of Beta, the Type II Error and Sample Size in the Design and Interpretation of the Ran-domized Control Trial. N. Engl. J. Med. 1978, 299, 690–694. [Google Scholar] [CrossRef] [PubMed]
- Zimmerman, D.W. Inflation of Type I Error Rates by Unequal Variances Associated with Parametric, Nonparametric, and Rank-Transformation Tests. Psicológica 2004, 25, 103–133. [Google Scholar]
- Hesterberg, T. Bootstrap Methods and Permutation Tests; W.H. Freeman and Company: New York, NY, USA, 2003. [Google Scholar]
- Manly, B.F.J. Randomization, Bootstrap and Monte Carlo Methods in Biology, 3rd ed.; Chapman & Hall/CRC: London, UK, 2007. [Google Scholar]
| Dimension | Group | OBS | Mean | ATT | t-Value | p-Value |
|---|---|---|---|---|---|---|
| Usage of household appliances | Treated | 218 | 3.612 1 | 0.231 ** | 1.722 | 0.043 |
| Controls | 670 | 3.382 | ||||
| Charging electrical appliances | Treated | 218 | 3.114 | 0.060 | 0.402 | 0.344 |
| Controls | 671 | 3.054 | ||||
| Charging electrical means of transportation | Treated | 218 | 3.489 | 0.084 | 0.548 | 0.292 |
| Controls | 572 | 3.405 |
| Dimension | Group | OBS | Mean | ATT | t-Value | p-Value |
|---|---|---|---|---|---|---|
| Usage of household appliances | Treated | 20 | 3.850 | 0.210 | 0.511 | 0.305 |
| Controls | 92 | 3.640 | ||||
| Charging electrical appliances | Treated | 20 | 3.350 | 0.362 | 0.781 | 0.218 |
| Controls | 92 | 2.988 | ||||
| Charging electrical means of transportation | Treated | 20 | 3.400 | 0.140 | 0.335 | 0.369 |
| Controls | 82 | 3.260 |
| Dimension | Group | OBS | Mean | ATT | t-Value | p-Value |
|---|---|---|---|---|---|---|
| Usage of household appliances | Treated | 5 | 3.400 | −0.408 | −0.379 | 0.354 |
| Controls | 17 | 3.808 | ||||
| Charging electrical appliances | Treated | 5 | 3.000 | −0.092 | −0.084 | 0.467 |
| Controls | 17 | 3.092 | ||||
| Charging electrical means of transportation | Treated | 5 | 3.200 | −0.667 | −0.641 | 0.265 |
| Controls | 15 | 3.867 |
| Dimension | Group | OBS | Mean | ATT | t-Value | p-Value |
|---|---|---|---|---|---|---|
| Usage of household appliances | Treated | 218 | 3.077 | −0.864 | −1.129 | 0.130 |
| Controls | 18 | 3.941 | ||||
| Charging electrical appliances | Treated | 218 | 3.096 | −0.600 | −0.765 | 0.223 |
| Controls | 18 | 3.696 | ||||
| Charging electrical means of transportation | Treated | 218 | 3.149 | −0.266 | −0.351 | 0.363 |
| Controls | 14 | 3.415 |
| Dimension | Group | OBS | Mean | ATT | t-Value | p-Value |
|---|---|---|---|---|---|---|
| Usage of household appliances | Treated | 218 | 3.000 | −2.000 *** | −5.806 | <0.001 1 |
| Controls | 1 | 5.000 | ||||
| Charging electrical appliances | Treated | 218 | 4.000 | −1.000 ** | 2.201 | 0.014 |
| Controls | 1 | 3.000 | ||||
| Charging electrical means of transportation 2 | Treated | 218 | - | - | - | - |
| Controls | 1 | 3.000 |
| Dimension | Group | OBS | Mean | ATT | t-Value | p-Value |
|---|---|---|---|---|---|---|
| Usage of household appliances | Treated | 20 | - | - | - | - |
| Controls | - | - | ||||
| Charging electrical appliances | Treated | 20 | - | - | - | - |
| Controls | - | - | ||||
| Charging electrical means of transportation | Treated | 20 | - | - | - | - |
| Controls | - | - |
| Dimension | Group | OBS | Mean | ATT | t-Value | p-Value |
|---|---|---|---|---|---|---|
| Usage of household appliances | Treated | 128 | 3.347 | −0.034 | −0.191 | 0.424 |
| Controls | 509 | 3.381 | ||||
| Charging electrical appliances | Treated | 128 | 2.976 | −0.120 | −0.674 | 0.250 |
| Controls | 510 | 3.096 | ||||
| Charging electrical means of transportation | Treated | 128 | 3.386 | −0.011 | −0.057 | 0.477 |
| Controls | 442 | 3.397 |
| Dimension | Group | OBS | Mean | ATT | t-Value | p-Value |
|---|---|---|---|---|---|---|
| Usage of household appliances | Treated | 47 | 4.130 | 0.909 *** | 3.545 | <0.001 |
| Controls | 191 | 3.222 | ||||
| Charging electrical appliances | Treated | 47 | 3.356 | 0.442 | 1.459 | 0.073 |
| Controls | 194 | 2.914 | ||||
| Charging electrical means of transportation | Treated | 47 | 3.538 | 0.370 | 1.085 | 0.140 |
| Controls | 162 | 3.169 |
| Dimension | Group | OBS | Mean | ATT | t-Value | p-Value |
|---|---|---|---|---|---|---|
| Usage of household appliances | Treated | 43 | 3.810 | 0.193 | 0.671 | 0.251 |
| Controls | 188 | 3.616 | ||||
| Charging electrical appliances | Treated | 43 | 3.262 | 0.136 | 0.382 | 0.351 |
| Controls | 187 | 3.126 | ||||
| Charging electrical means of transportation | Treated | 43 | 3.722 | 0.244 | 0.784 | 0.217 |
| Controls | 165 | 3.478 |
| Dimension | Group | OBS | Mean | ATT | t-Value | p-Value |
|---|---|---|---|---|---|---|
| Usage of household appliances | Treated | 47 | 4.100 | 1.242 *** | 2.786 | 0.003 |
| Controls | 39 | 2.858 | ||||
| Charging electrical appliances | Treated | 47 | 3.410 | 0.685 | 1.461 | 0.074 |
| Controls | 40 | 2.725 | ||||
| Charging electrical means of transportation | Treated | 47 | 3.412 | 0.584 | 1.051 | 0.148 |
| Controls | 32 | 2.828 |
| Dimension | Group | OBS | Mean | ATT | t-Value | p-Value |
|---|---|---|---|---|---|---|
| Usage of household appliances | Treated | 47 | 4.118 | 0.479 | 0.604 | 0.274 |
| Controls | 16 | 3.639 | ||||
| Charging electrical appliances | Treated | 47 | 3.125 | −0.153 | −0.218 | 0.414 |
| Controls | 16 | 3.278 | ||||
| Charging electrical means of transportation | Treated | 47 | 3.714 | 0.214 | 0.297 | 0.384 |
| Controls | 13 | 3.500 |
| Dimension | Group | OBS | Mean | ATT | t-Value | p-Value |
|---|---|---|---|---|---|---|
| Usage of household appliances | Treated | 43 | 3.800 | 0.028 | 0.057 | 0.477 |
| Controls | 23 | 3.772 | ||||
| Charging electrical appliances | Treated | 43 | 3.300 | −0.267 | −0.461 | 0.323 |
| Controls | 24 | 3.567 | ||||
| Charging electrical means of transportation | Treated | 43 | 3.706 | −0.161 | −0.249 | 0.402 |
| Controls | 16 | 3.867 |
Publisher’s Note: MDPI stays neutral with regard to jurisdictional claims in published maps and institutional affiliations. |
© 2021 by the authors. Licensee MDPI, Basel, Switzerland. This article is an open access article distributed under the terms and conditions of the Creative Commons Attribution (CC BY) license (https://creativecommons.org/licenses/by/4.0/).
Share and Cite
Roth, L.; Lowitzsch, J.; Yildiz, Ö. An Empirical Study of How Household Energy Consumption Is Affected by Co-Owning Different Technological Means to Produce Renewable Energy and the Production Purpose. Energies 2021, 14, 3996. https://0-doi-org.brum.beds.ac.uk/10.3390/en14133996
Roth L, Lowitzsch J, Yildiz Ö. An Empirical Study of How Household Energy Consumption Is Affected by Co-Owning Different Technological Means to Produce Renewable Energy and the Production Purpose. Energies. 2021; 14(13):3996. https://0-doi-org.brum.beds.ac.uk/10.3390/en14133996
Chicago/Turabian StyleRoth, Lucas, Jens Lowitzsch, and Özgür Yildiz. 2021. "An Empirical Study of How Household Energy Consumption Is Affected by Co-Owning Different Technological Means to Produce Renewable Energy and the Production Purpose" Energies 14, no. 13: 3996. https://0-doi-org.brum.beds.ac.uk/10.3390/en14133996