
Heterogeneous Impacts of Extreme Climate Risks on Global Energy Consumption Transition: An International Comparative Study


1
School of Economics, Hunan Agricultural University, Changsha 410128, China
2
School of Finance, Guangdong University of Finance & Economics, Guangzhou 510320, China
3
Collaborative Innovation Development Center of Pearl River Delta Science & Technology Finance Industry, Guangdong University of Finance & Economics, Guangzhou 510320, China
4
School of Business, Xiangtan University, Xiangtan 411105, China
5
School of Economics and Management, Hunan Institute of Technology, Hengyang 421001, China
*
Author to whom correspondence should be addressed.
Energies 2021, 14(14), 4189; https://0-doi-org.brum.beds.ac.uk/10.3390/en14144189
Submission received: 24 June 2021
/
Revised: 6 July 2021
/
Accepted: 9 July 2021
/
Published: 11 July 2021
(This article belongs to the Special Issue Accelerating the Digital Economy, Energy Consumption through Blockchain Technology, and Sustainable Development)
Abstract
:In response to the uncertainty of extreme climate change, energy consumption structure has been actively adjusted globally. Based on panel data of 101 countries or regions from 2006 to 2019, a panel data model with fixed effects is used to analyze the heterogeneous impacts of extreme climate risks on global consumption transition. The results show that extreme climate change has promoted the transition of the energy structure, reduced the consumption of fossil energy, and increased the consumption of renewable energy. Meanwhile, there are heterogeneous impacts of extreme climate change risks on the energy transition when different countries suffering from extreme weather conditions. Areas with high levels of economic development and coastal countries are more inclined to respond to climate change through energy transition. It is further confirmed that, under the impact of business cycle and oil price fluctuations, economic recession and falling oil prices will strengthen the correlation between climate risk and the global energy transition, and governments need to pay more attention to the impact of climate risks.
1. Introduction
Climate change has become one of the most pressing global challenges over the past decade. So far, many ecosystems are susceptible to climate change. Climate change not only has a direct impact on agricultural output, natural resources, human health and other socio-economic benefits, it also has an indirect impact on manufacturing, energy production, transportation and other economic activities, such as services [1]. Previous studies of climate-related factors affecting the socio-economic behaviors usually depend on using a single indicator to reflect climate change. For instance, the change in temperature or the change in carbon emissions or duration of sunshine is widely used in related studies [2,3], which cannot fully capture the economic losses caused by climate risks. The climate risk index of different countries constructed by the Germanwatch can well describe the extent of losses due to extreme climate events (floods, droughts, tornados, hurricanes, etc.). This provides data support for this study to test the relationship between extreme climate risks and energy consumption transition.
Since the burning of fossil fuels releases a large amount of greenhouse gases (GHGs) into the environment, especially carbon dioxide, which causes severe environmental problems, the transition of energy consumption has become an important way to reduce environmental pollution and carbon dioxide emissions. In this regard, the Kyoto Protocol, signed in 1997, established greenhouse-gas-emission targets, and the fundamental purpose of this agreement was to reduce GHGs worldwide. At the 21st United Nations Climate Change Conference held in Paris in 2015, the first global emission reduction agreement covering nearly 200 countries and regions was reached, namely, the Paris Agreement, marking a historic and important step in the global response to climate change. After signing the Kyoto Protocol, in order to achieve the goal of reducing carbon emissions, countries began to adopt more renewable energy to promote energy consumption transition. After years of theoretical exploration and practice from all walks of life, the use of renewable energy is considered to be the main applicable solution to deal with climate change and alleviate global warming. Only through the energy consumption transition can the difficulties of tackling climate change be overcome. Gielen et al. [4] have pointed out that two-thirds of the world’s total energy demand would be met by renewable energy by 2050, which might significantly reduce greenhouse gas emissions. However, affected by economic development needs, energy supply and government governance, the progress of energy consumption transition in different countries is not the same [5,6], and the quantitative risks of climate change factors on energy consumption transition are rarely considered. Therefore, this paper takes climate risks as the main factor to test their impact on energy consumption transition and their heterogeneous impacts across different countries.
The motivation for the transition of energy consumption has aroused widespread concern in the socio-economic field. First, on the demand side, economic development, urbanization and industrialization are the main causes of energy consumption transition [7,8,9,10,11,12]. Second, on the supply side, energy-supply constraints affect energy consumption transition behavior [13]. In addition, trade has become an important factor in energy consumption transition by influencing energy supply [14,15], and low-cost renewable power supply is the key driving force of energy consumption transition. Third, fluctuations in international energy prices and unexpected external shocks worldwide, such as the financial crisis, also affect the energy consumption transition process.
The impact of climate risks has gradually become a research issue of concern in various fields. First, the influential effect of climate change on economic outputs has been extensively analyzed. From a macroeconomic perspective, economic losses caused by severe weather conditions have been quantified and analyzed [16,17,18,19]. From a microeconomic perspective, it has been confirmed that corporate performance is significantly affected by climate risks, which can reduce the economic efficiency of corporate assets and earnings management to a large extent [20,21] and increase the possibility of corporate debt defaults [22]. Second, the energy consumption structure affected by climate risks has attracted increasing attention from governments and academic world. The impacts of climate change on research and the development of energy technologies [23], energy transition preferences [24] and global energy consumption [6] have been analyzed. In addition, there are some studies that introduce climate change into energy economic systems [25,26]. Third, in recent years, climate risks have become a focus in the financial field. Climate change has become a component of financial risks [27], which in turn affects the stability of the financial system [28,29,30], thereby affecting energy efficiency [31].
Therefore, the panel data of 101 countries or regions from 2006 to 2019 is used to analyze the heterogeneous impacts of extreme climate risks on the global consumption transition in our study. This study makes contributions to the existing research from the following aspects.
First, cross-country evidence on the impact of extreme climate risks on energy consumption transition is presented in our study, enriching the research on climate risks as external incentives for energy structure transition. The existing literature on energy consumption transition mainly focuses on the driving factors of energy supply and demand, such as funding growth, urbanization and industrialization. However, one of the external factors influencing energy consumption transition is discussed and analyzed, that is extreme climate risks. Although climate risks have received great attention from international organizations and governments worldwide, most studies mainly use climate risks as the research background for qualitative analysis due to the limitation of historical data [6,23]. Changes in external incentives such as extreme weather risks may cause changes in countries’ energy consumption transition behaviors.
Second, the role of government governance in regulating the relationship between climate risk and energy consumption transition has been analyzed. The empirical results show that the higher the country’s governance quality, the more conducive it is to promote renewable energy consumption and energy consumption transition. The possible reason is that governments with high levels of governance can promptly introduce measures to compensate for the negative impact of climate risks on energy consumption transition.
Third, our study helps analyze international differences in the impact of climate risks on energy consumption transition as well as the heterogeneous effects when affected by external shocks, proposing corresponding countermeasures. The results show that countries with abundant energy resources are more conducive to the development of renewable energy due to short-term climate risks; countries with insufficient energy resources are affected by long-term climate risks, and energy consumption transition behavior is stronger. An interesting conclusion is that the transition of energy consumption is more significantly affected by climate risks in countries with lower levels of economic development. In addition, economic recession and falling oil prices play important roles in affecting the relationship between climate risks and energy consumption transition. These conclusions are conducive to exploring differentiated policy recommendations.
The rest of this paper is organized as follows. Section 2 reviews relevant literature and proposes hypotheses. Section 3 focuses on the model specification and data sources. Section 4 interprets and discusses the empirical results, including the main results and heterogeneous effects with other tests. Conclusions and policy implications are summarized in Section 5.
2. Literature Review and Hypothesis Formulation
2.1. Climate Risk and Energy Consumption Transition
Currently, energy sustainability and climate change are complex challenges that plague the world [32,33]. The greenhouse effect and other phenomena caused by climate change are closely related with the process of energy transfer and conversion [34]. Puttick and Tucker-Raymond [35] used a visual programming environment to link energy consumption with the greenhouse effect and global warming and found a strong correlation between energy consumption and climate change. Fuss et al. [36] and McCollum et al. [37] confirmed that new energy technologies would make a significant contribution to controlling greenhouse gases at appropriate levels, and the usage of low-carbon energy would be the main direction for energy consumption. Mikellidou et al. [38] paid attention to the impact of extreme weather events on energy infrastructure, in order to make recommendation to improve the ability of energy infrastructure to adapt and recover from climate change. In addition, there is relatively sufficient evidence that temperature rise has important negative effects on electricity and renewable energy [39]. Cian and Wing [6] studied the heterogeneous relationship between global warming and the energy consumption of countries with different levels of economic development, and found that climate change had different impacts on energy consumption in tropical and temperate regions. There are heterogeneous effects of climate change across countries with different levels of economic development. Affected by climate change, energy demand in most low-income countries and middle-income countries is growing rapidly, while the incidence of increased energy demand in countries with high levels of economic development is falling. Especially in countries with low and high levels of economic development, even if affected by climate change, the incidence of increased energy consumption is still as high as 96% and 85%, respectively. These factors make climate change likely to exacerbate energy poverty [6].
Therefore, we propose the following competing hypotheses:
H1a.
Climate risk has a positive impact on energy consumption transition (which implies a positive correlation).
H1b.
Climate risk has a negative impact on energy consumption transition (which implies a negative correlation).
2.2. The Moderating Role of Governance Quality
Alleviating energy poverty and addressing climate change have become important political issues. Many developing countries have put forward a number of initiatives and policies to solve the problem of energy shortage. The popularization of new energy can improve energy efficiency to the current European standards, which can not only save approximately 15% of energy consumption but also significantly alleviate the greenhouse effect caused by excessive carbon emissions [40]. The Paris Agreement is a milestone in addressing climate change globally, which not only regards climate change as an environmental issue or as a development issue, but also as a challenge that fundamentally changes global society. Feasible solutions are provided by the Paris Agreement when countries around the world are facing various problems in the transition of energy consumption [41]. Schaffrin et al. [42] emphasized the important role of transnational governance in tackling climate change, which was supported by Andonova et al. [43]. National energy policies also play a critical part in ensuring energy security and mitigating the negative impact of climate change [44], especially in reducing dependence on imported crude oil. However, Tjernström and Tietenberg [45] also pointed out that, when confronted with the threat and adverse consequences of climate change, countries had completely different responses, which ultimately would affect the country-level energy consumption structure.
Based on these different points of view, the moderating role of governance quality on the relationship between climate risk and energy consumption transition needs to be tested. Therefore, the hypothesis H2 is expressed as follows:
H2a.
In countries with high levels of governance quality, the impact of climate risk on energy consumption transition is weakened.
H2b.
In countries with high levels of governance quality, the impact of climate risk on energy consumption transition is strengthened.
3. Methodology and Data
3.1. Model Specification
First, considering the estimation bias caused by omitted variables at the individual level and that time-invariant variables should be excluded, we construct a spatial panel model with fixed effects:
where subscripts and represent country and year, respectively. is the measurement of the transition of energy consumption of country in year , which is represented by the proportion of renewable energy consumption in the total initial energy consumption. The larger the value is, the higher the transition degree from energy consumption to renewable energy consumption. represents the climate risk index (CRI) score, of country in year , which is calculated and released by Germanwatch in the Global Climate Risk Index Report (GCRIR) every two years. It should be noted that a lower climate risk score in the GCRIR leads to a higher ranking in levels of climate risks. Therefore, in order to clarify the meaning of this indicator, we multiply the CRI score by −1, consistent with Huang et al. [20] and Ding et al. [21]. In this way, the higher CRI used in our study reflects the higher level of climate risks. In addition, the GCRIR also provides the cumulative climate risk index for the previous 20 years. We use this index to study the continuous impact of long-term climate change () on the transition of energy consumption structure. The coefficient of can explain the impact of extreme climate risks in the past 20 years on the current energy consumption transition, reflecting the long-term effects of climate risks. Meanwhile, the index is normalized and multiplied by −1.
A set of country-level control variables is introduced into Equation (1). (1) Economic growth () is represented by the natural logarithm of the actual GDP per capita. In the long run, the relationship between economic growth and renewable energy consumption will reach a dynamic equilibrium [46], and economic activities affect changes in energy consumption structure [7,8]. (2) Urbanization () is represented by the proportion of the urban population in the total population. The process of urbanization is inseparable from energy consumption. With the acceleration of urbanization, energy demand has increased substantially, leading to drastic changes in energy consumption structure. Generally speaking, an increase in urban density would lead to a reduction in energy consumption, in favor of energy consumption transition [9,10]. (3) Industrial structure () is represented by the proportion of industrial value added in the GDP. Industrial restructuring provides great potential for energy conservation and emission reduction, and industrialization would increase energy consumption in the long term [11,12,47]. (4) Trade activity () is represented by the proportion of trade scale in the GDP, which summarizes the trading activities of goods and services between countries or regions. It can reflect the importance of technology diffusion to improve energy efficiency through foreign direct investment, which would have an impact on the transition of energy consumption [14,15,48].
In addition, the quality of governance () is introduced in the model, which is a composite index measured and calculated by the Worldwide Governance Indicators (WGI).
The interaction term of and is introduced into Equation (1), and a panel data model with conditional benefits is constructed:
For in-depth study the moderating effects of governance quality on climate risk and energy consumption transition, we introduce six classification indicators of WGI into the model in the empirical study, which are voice and accountability (), political stability and absence of violence (), government effectiveness (), regulatory quality (), rule of law (), and control of corruption () [49]. When the coefficient is positive, it indicates that the government has a high level of management and can strengthen the relationship between climate risk and energy consumption transition; otherwise, the negative coefficient indicates that government management would weaken the relationship between climate risk and energy consumption transition.
3.2. Data Sources
In our study, the country-level data from 2006 to 2019 is adopted, including 101 countries/regions worldwide. The data we use to conduct empirical study are mainly from the following databases.
First of all, the original CRI scores are from the Global Climate Risk Index Report, which is calculated and released by Germanwatch (Germanwatch, the Global Climate Risk Index Report, https://germanwatch.org/en/cri, accessed on 10 June 2021). The CRI ranks countries or regions affected by extreme weather events and can be used to analyze the socio-economic impact of climate risks at the country level. The CRI index has been released every two years since 2008. By the time this paper is finished, the CRI date up to 2019 has been released and from 2000 to 2019 was taken into account. The index directly shows the frequency and vulnerability of countries or regions facing extreme weather events. Countries or regions can refer to this index to prepare in advance for more frequent and severe weather conditions [50,51]. Besides, the country-level energy consumption data come from the BP Statistical Review of World Energy, which can be well matched with CRI data. The raw data used to calculate country-level control variables are from the World Bank WDI Database. The initial indicators include GDP in hundred million U.S. dollars, urban population in ten thousand people, total population in ten thousand people, industrial added value in hundred million U.S. dollars, and the amount of import and export in hundred million U.S. dollars. Table 1 reports more details. Data used to represent the quality of governance are from Worldwide Governance Indicators (Worldwide Governance Indicators, http://info.worldbank.org/governance/wgi/, access on 10 June 2021).
After merging the above databases, we obtained a panel dataset of maximum 1388 country-year observations from 101 countries/regions from 2006 to 2019.
3.3. Variable Description
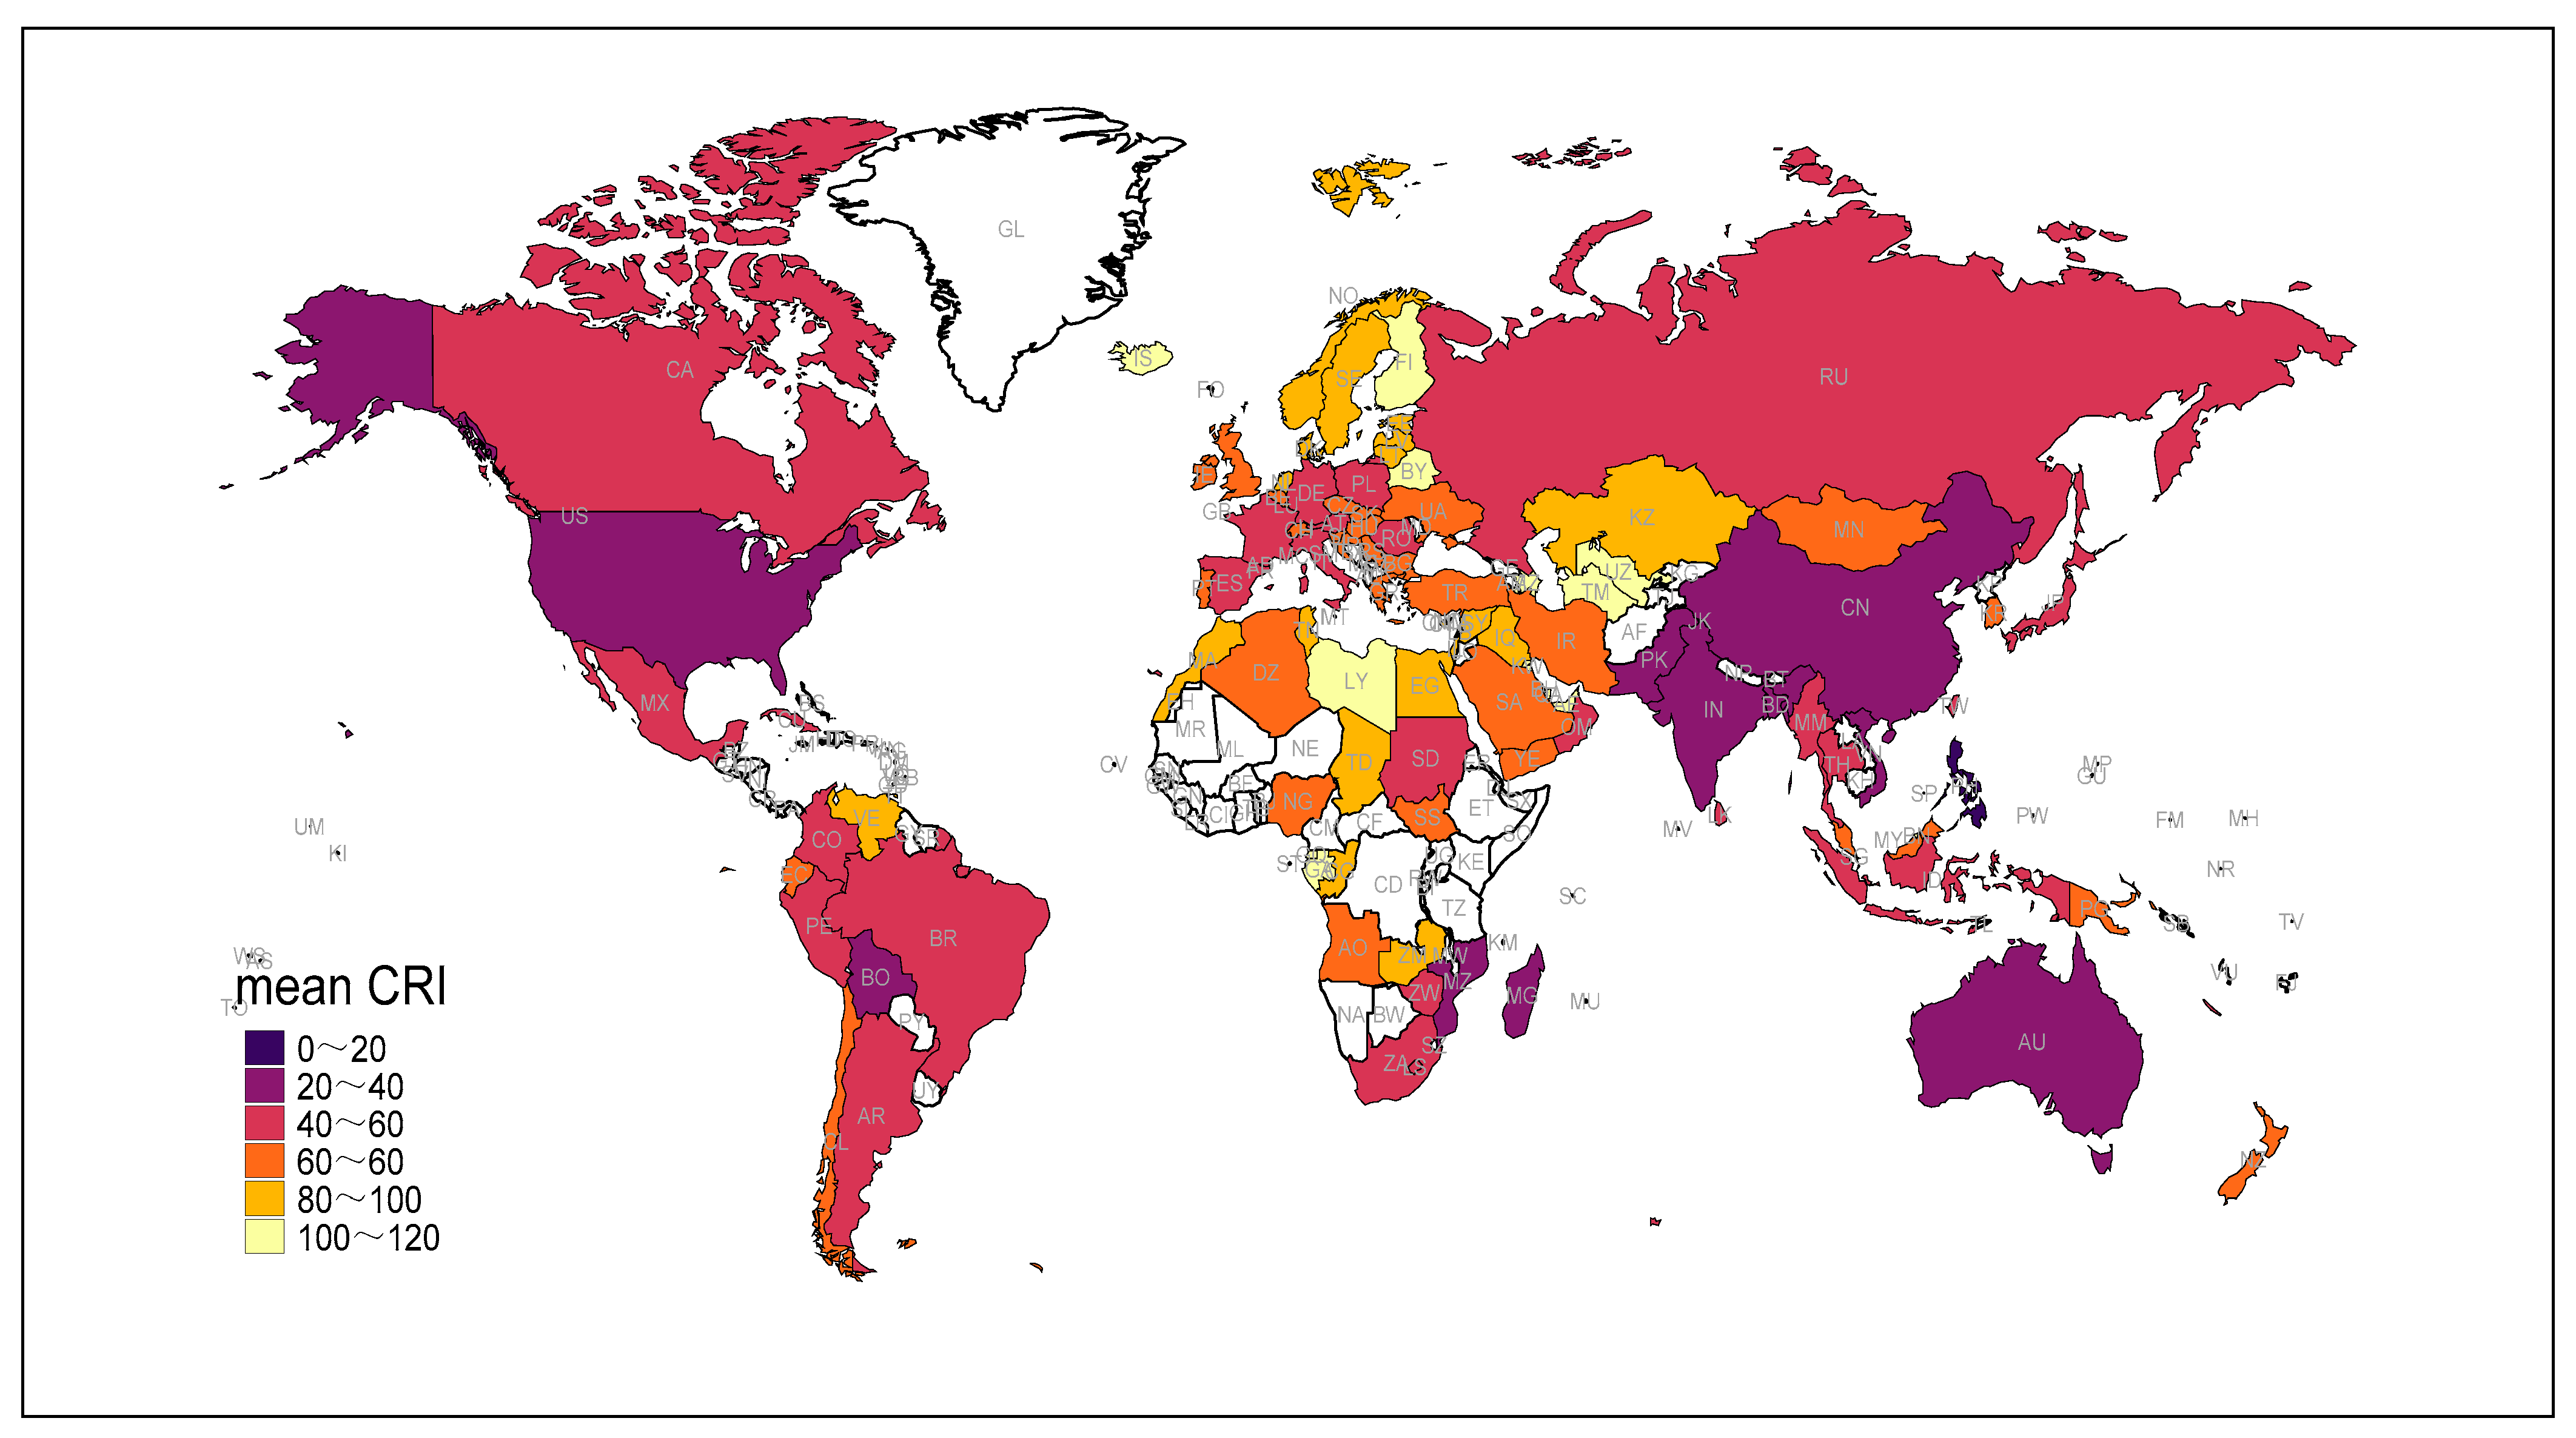
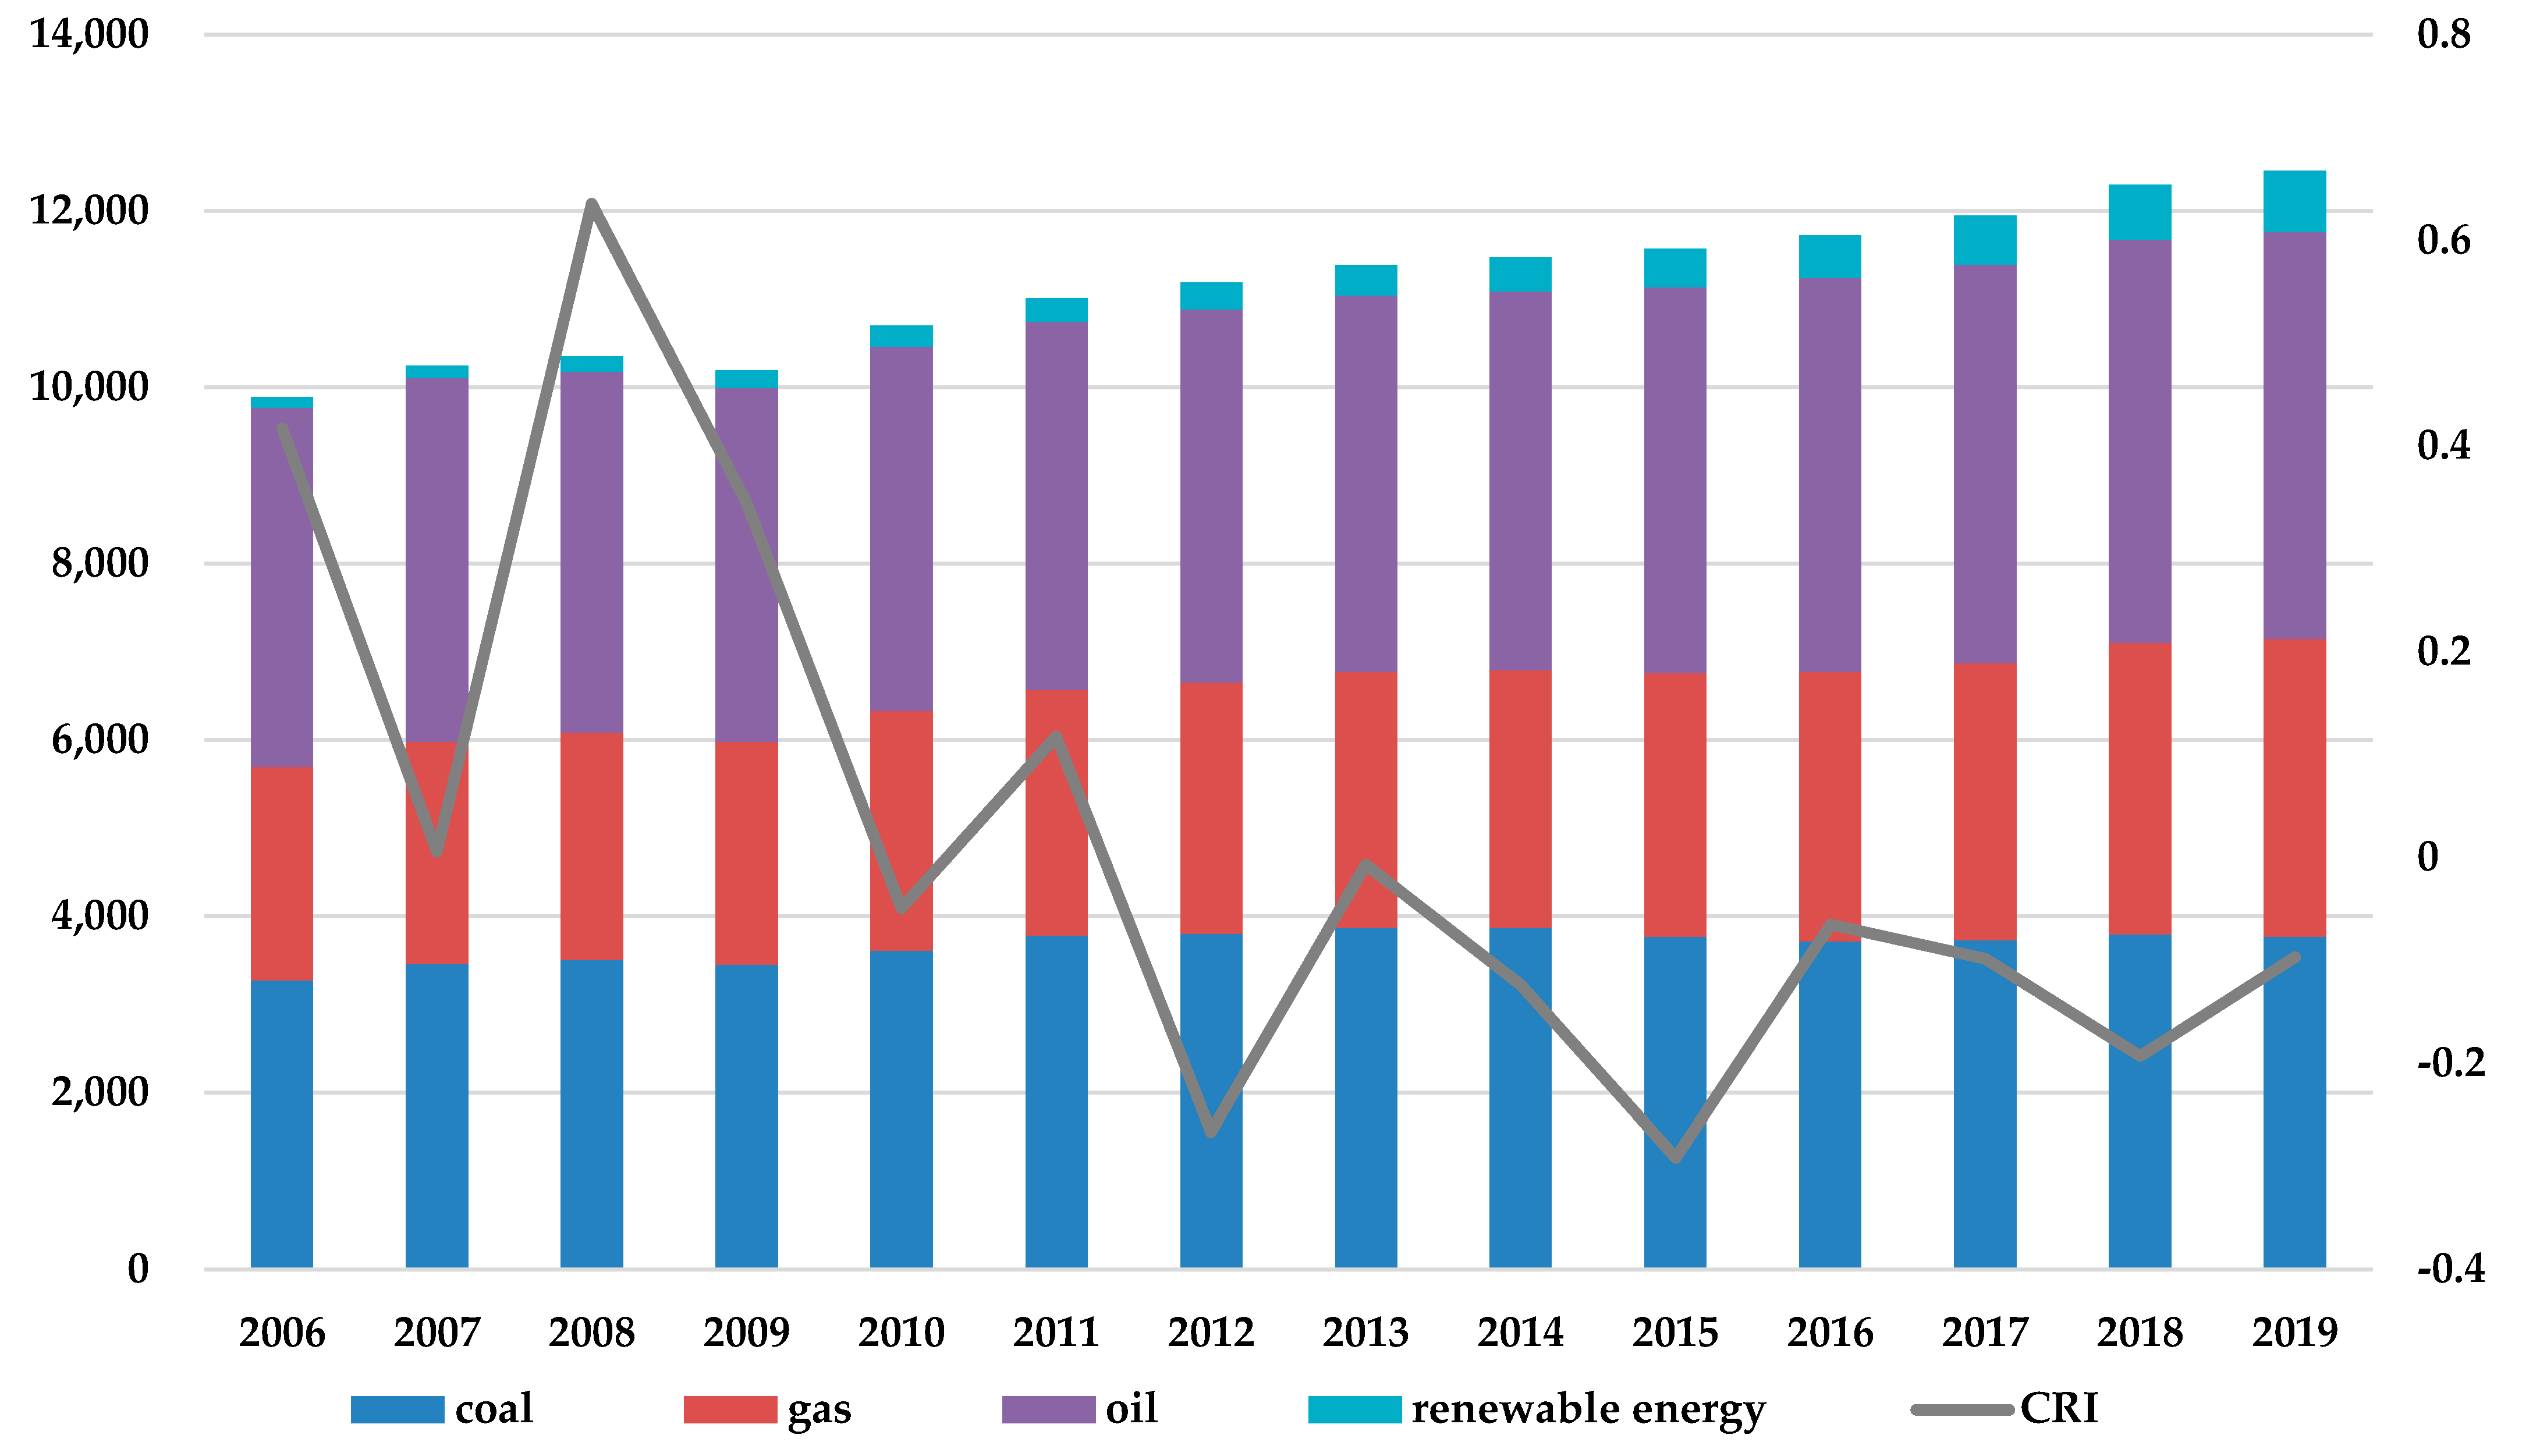
Figure 1 reports the sample distribution of the mean of the climate risk index for each country. It can be seen that during the sample period, there were higher climate risks in coastal countries or Pacific Rim countries, such as Australia, India, the United States, and China. To better capture the changes in climate risk and energy consumption structure over time, changes in energy consumption structure compared with the mean of the climate risk index from 2006 to 2019 can be found in Figure 2. As we can see, the climate risks are changing year by year, with the highest risk in 2008 and the lowest risk in 2015. At the same time, the total energy consumption increased gradually; however, the energy consumption structure has undergone profound changes.
Descriptive statistics are summarized in Table 2. The mean of ECT is very close to 0, indicating that the share of global renewable energy consumption remains low, and the energy structure transition is urgently needed. Generally speaking, the information contained in these statistics is basically similar to previous research reports [52,53]. Since the mean of the standardized CRI is zero, it is difficult to observe the overall level of climate risks. Here, we perform descriptive statistics on the original data, from which can be drawn that the average of the climate risk index is 69.216, while the mean of the long-term cumulative climate risk index for the previous 20 years (CRI_long) is 86.829. Note that the higher the score, the lower the damage caused by climate risks. The long-term climate risk score is higher than the short-term climate risk due to the time smoothing effect. Additionally, the results of the ADF-Fisher test show that variables are stable, and regression analysis can be performed.
The Pearson correlations matrix is reported in Table 3. It can be seen that climate risk is negatively correlated with energy consumption transition. This negative correlation is consistent with our prediction that it is associated with a higher share of renewable energy consumption in countries suffering from more frequent and severe weather events. As shown in Table 3, most of the control variables are significantly correlated. However, there is no correlation coefficient between the ECT and each control variable whose absolute value is higher than 0.5. In other words, this degree of multicollinearity between variables does not lead to serious estimation bias.
4. Empirical Results
4.1. Main Results
4.1.1. The Effect of Climate Risk on the Transition of Energy Consumption Structure
The estimation results of the impact of climate risk on energy consumption transition are reported in Table 4. Both short-term and long-term climate risks have significantly promoted the transition of energy consumption. In columns (1) and (4), both short-term (current) and long-term climate risks have a significant positive impact on energy consumption transition, without controlling for any country-level factors; the coefficient of CRI is significantly positive at the 1% level, which is consistent with the hypothesis H1a, indicating that climate risk has promoted the country’s energy consumption transition. In columns (2) and (5), the coefficients of CRI and CRI_long are significantly positive with country-level control variables fixed, which means that the hypothesis H1a is further verified and that the robustness of the results is confirmed. This paper concludes that climate risk can promote the transition of energy consumption, enriching the empirical evidence of the mechanism of climate risk on the energy transition proposed in previous studies [4]. Besides, comparing the impact of short-term and long-term climate risks on energy consumption transition, the promotion effect of long-term climate risk is higher than the impact of short-term climate risk on energy consumption transition. In other words, the impact of climate risk on the energy consumption transition would exist for a long time, and countries/regions with long-term climate risks are more inclined to consume renewable energy. In order to observe the dynamic effects of climate change on energy consumption transition, the first-order lag of short-term climate risks (CRI(-1) ) and the first-order lag of long-term climate risks (CRI_long(-1) ) are introduced into the model, respectively. The estimation results are reported in columns (3) and (6). The results show that the coefficients of short-term and long-term CRI are significantly positive, further indicating that the impact of climate risk on energy consumption transition is long-term and dynamic.
In columns (2) and (5), the estimated coefficients of the control variables are consistent with those expected in our theoretical analysis. In order to simplify the analysis, we only discuss the estimated coefficients of the control variables in column (2). The coefficient of Lnpgpd is significantly positive at the 1% level, meaning that energy consumption transition is inseparable from economic development. Countries with higher GDP per capita are more willing to consume renewable energy, but that does not mean that the larger the economic scale, the stronger their energy consumption transition behavior is. This issue will be discussed in the next section. The coefficients of urbanr, indusr and trader are significantly negative at the 1% level, showing that countries with high levels of urbanization, industrialization and foreign trade are more inclined to use non-renewable resources for development. In general, our estimation results on control variables are consistent with previous studies [9,14].
In addition, we also focus on the impact of climate risk on fossil energy consumption in order to verify the robustness of the previous conclusions from the opposite side of the problem. We take the natural logarithm of fossil energy consumption to avoid the possible heteroscedasticity. The specific estimation results are shown in Table 5. On the whole, both short-term climate risk and long-term climate risk have a negative impact on fossil energy consumption. The impacts of short-term and long-term climate risk on the consumption of crude oil, coal and natural gas are significant at the 1% level. When the extreme climate risk is high, the consumption of fossil energy would be reduced accordingly, which would bring more uncertainty to the excessive consumption of fossil energy. At the same time, the long-term impact of climate risk is more prominent. Having been affected by extreme weather conditions for a long time, countries or regions are more willing to reduce fossil energy consumption and decrease climate risks through promoting energy consumption transition. It can be seen that climate risks will promote the transformation of energy consumption by reducing fossil energy consumption.
4.1.2. Moderating Effect of Governance Quality
The interaction term CRI × GOV is introduced into Equation (2) to study the governance quality on the relationship between climate risk and energy consumption transition. The six sub-indexes of GOV and their interaction term with CRI are introduced into the model. As we can see from Table 6. The coefficients of CRI × pve, CRI × rle and CRI × cce are significantly negative, while the coefficients of CRI × vae, CRI × gee and CRI × rqe are insignificantly negative, indicating that for companies operating in countries with higher governance quality, the effect of climate risk in promoting the transition of energy consumption has been weakened. There are consistent effects no matter where the governance quality is reflected in the six aspects, vae, pve, gee, rqe, rle and cce (See Section 3.1 for details). Therefore, the hypothesis H2a is confirmed.
The results further show that, for countries with high levels of governance quality, the positive correlation between climate risk and energy consumption transition is not strong. A reasonable explanation is that in countries with better governance, it is easier to transform the energy consumption structure for the purpose of comprehensive economic and social development, rather than for climate risk considerations. In these countries, taking the sustainable economic development into account, there are more motivations to promote the energy consumption transition, while reducing the promotion effect of short-term climate risks on energy consumption transition.
Specifically, in countries which can maintain political stability and ensure low incidence of violence, the governments are better at formulating priority energy policy measures, rather than waiting for extreme climates to help change the energy consumption structure. In countries with high regulatory governance, the government has the ability to adopt efficient energy policies and regulations, which can more easily help them maintain the diversity of energy consumption, thereby weakening the link between climate risk and energy consumption. In countries with sound legal systems, the public trusts and abides by social rules, and enterprises can fulfill their environmental responsibilities without having to learn from extreme climate risks. In countries with a strong ability to control corruption, the government can better consider the needs of stakeholders when formulating energy transition policies, ensuring the regional balance and sustainability of energy policies, and reducing the potential negative impacts of climate risk on policy formulation. From the perspective of the direct effect of governance quality on the transition of energy consumption, countries with higher public governance can significantly increase the proportion of renewable energy in initial energy consumption. In the transition of energy consumption, the central government should perform more environmental responsibilities.
4.2. Additional Analysis
4.2.1. Dealing with Endogeneity
Potential endogeneity due to reverse causality or simultaneity may question our identification strategy. The instrumental variable method is adopted to estimate our baseline model to address the possible endogeneity [20,54]. Based on the study of Lawless and Seitz [55], we use the coastline length (lncoastline) as an instrumental variable, because coastlines are highly correlated with losses caused by extreme weather events (climate risks). On the one hand, coastal areas suffer from more frequent extreme weather conditions due to their geographic characteristics, and are more likely to generate climate risks; on the other hand, there is large population in coastal areas generally, and extreme weather events are more likely to bring more serious losses to coastal areas. In addition, this variable is not related to our dependent variable (energy consumption transition). We obtain the coastline length of the sample countries from the ChartsBin (Data source: ChartsBin, http://chartsbin.com/, accessed on 10 July 2021) and take the natural logarithm of the coastline length. In the first stage, we regress the climate risk of coastline length and incorporate the fitted value of climate risk into the second stage of regression.
As shown in columns (1) and (3) of Table 7, the estimation results of the short-term and long-term climate risks are regressed respectively in the first stage, and the coefficients of lncoastline are significantly positive. The estimation results of the second stage are reported in columns (2) and (4). The coefficients of CRI and CRI_long are significantly positive and higher than the estimated coefficients in Table 4. Therefore, after controlling potential endogenous problems, our main empirical results remain robust, and that the climate risk can promote the transition of energy consumption is further confirmed.
4.2.2. Tests of Heterogeneous Effects
We construct sub-samples to analyze the heterogeneous impact of climate risk on energy consumption transition. First, the sub-samples of resource-rich and resource-poor countries are constructed, considering that the energy resources endowment of a country directly affects the energy consumption structure. In different regions, there is diversity in characteristics and changing trends of energy consumption [56], and the active sustainable energy policy may be implemented in countries with abundant fossil energy resources [57]. Second, we construct sub-samples of countries with high levels of economic development and countries with low levels of economic development, with consideration of the huge challenge balancing economic development and energy consumption. As the economy grows and the energy structure becomes more balanced, there is a tendency for countries to consume renewable energy. However, some studies found that economic development would not reduce the consumption of fossil energy [58].
Based on the median of the production of fossil energy (crude oil, coal, natural gas), the sub-samples above the median are resource-rich countries, and the sub-samples below the median are resource-poor countries. The estimation results of each group are shown in columns (1)–(4) of panel A in Table 8. In resource-rich countries, the coefficient of short-term CRI is significantly positive, which is consistent with the conclusion of Yüksel [57]. However, as for countries or regions that lack resources, the driving force for energy consumption transition is not sufficient when facing short-term climate risks, which may bring difficulties to the development of renewable resources in the short-term due to energy insufficiency. On the other hand, the coefficients of CRI_long are significantly positive for both countries with abundant resources and countries that lack resources. The long-term climate risks have a more profound impact on the energy consumption transition of resource-poor countries, since the long-term development of renewable energy is an important way to deal with climate change and achieve sustainable development when facing resource scarcity.
Additionally, based on the median of the GDP per capita, the sub-samples above the median are the countries with high levels of economic development, and the sub-samples below the median are the countries with low levels of economic development. The estimation results of each group are shown in columns (5)–(8) of panel B in Table 8. The coefficients of CRI show that climate risk significantly promotes the transition of energy consumption in low-income countries, and the effects are not significant in countries with high levels of economic development. A possible explanation is that the developed countries might not reduce the consumption of fossil energy when developing renewable energy [58], where renewable energy accounts for a relatively low proportion of total energy consumption. Among the sub-samples of countries with low levels of economic development, countries that have been highly affected by extreme weather for a long time are more willing to choose renewable energy consumption.
4.2.3. Tests of External Shocks
The impact of climate risk on energy consumption transition may be changed by external shocks. First, we consider the impact of business cycle fluctuations on the relationship between climate risk and energy consumption transition. There is a time-varying relationship between business cycle fluctuations and energy consumption. Studies have found that clean energy consumption is procyclical in developed and developing economies, but it is non-cyclical in the OPEC [59]. There is no doubt that business cycle fluctuations would affect the transition of energy consumption [60]. Second, we also study the relationship between climate risk and energy consumption transition affected by oil price fluctuations. A sharp drop or a surge in oil prices and long-term price instability both have an impact on energy consumption, renewable energy investment and programs, and economic growth [61]. That oil price rises sharply with steeply fluctuations can significantly increase energy consumption and exert an inhibitory impact on economic growth [62]. Obviously, a surge in oil prices results in fewer negative effects on the consumption of new energy [63].
To test the impact of business cycle fluctuations on the relationship between climate risk and energy consumption transition, we divide the sample into two stages, namely, the economic boom period and the economic recession period. According to the National Bureau of Economic Research’s definition and classification of business cycles, the global economy has entered a recession since 2009. Therefore, we define the period before 2009 as the economic boom period and the period after that as the economic recession period. The estimation results of each period are shown in columns (1)–(4) of panel A in Table 9. According to the coefficients of CRI, it can be seen that the climate risk is not significantly related to the transition of energy consumption in the economic boom period. Economic growth can make up for the loss caused by climate risk when the economy goes up, while also consuming a large amount of fossil energy, resulting in the insignificant energy consumption transition. During the economic recession, the increase in climate risk can significantly promote the transition of energy consumption. This may be due to the procyclical effect of fossil energy consumption [59], which has caused changes in the energy structure. Besides, numerous industrial policies and environmental regulations have been adopted to cope with the economic recession, which might stimulate the consumption of renewable energy.
Additionally, with reference to Jaffe [64]’s division of oil price fluctuation cycles, global oil prices increased in 2006–2008, 2011–2013, and 2016–2018, and we define these years as the oil-price-rise period. The remaining years are defined as the oil-price-fall period. The estimation results of the impact of oil price fluctuations are shown in columns (5)–(8) of panel B in Table 9. It should be pointed out that the positive correlation between climate risk and energy consumption transition is not affected by fluctuations in oil price, which is consistent with the conclusion of Sadorsky [63]. However, the impact of falling oil prices would promote the positive impact of climate risk on energy consumption transition. Affected by the decline in oil prices, countries faced with increasing threats to energy security have to seek renewable energy as a supplement, further causing oil price fluctuations.
5. Conclusions
To address the risks induced by extreme climate events, such as floods, heat waves, and long-term droughts, countries, regions and international organizations are paying increasing attention to energy consumption behavior. Under unfavorable weather, the cost of traditional fossil energy consumption has risen, further aggravating the frequency of extreme weather events. There is little literature that conducts empirical analysis on the relationship between climate risks and energy consumption transition. Therefore, the annual country-level data of 101 countries from 2006 to 2019 are sorted and used to study the impact of extreme climate risks on the transition of energy consumption in our study, and the following conclusions are drawn: First, countries faced with higher climate risks are more likely to develop renewable energy sources for energy consumption transition, especially those countries faced with long-term extreme climate risks. Second, levels of national governance quality can weaken the promotion effect of climate risks on the transition of energy consumption. Third, the results of heterogeneity tests show that the relationship between climate risks and energy consumption transition is more significant in countries with rich resources and low levels of economic development. In addition, the relationship between climate risks and energy consumption transition is more significant when affected by economic recession and falling oil price fluctuations. We use the instrumental variable method to deal with potential endogenous problems, further confirming that our findings are robust.
Our study provides first-hand evidence for proposing policies to address climate change and energy transition. First of all, the formulation of energy policies must balance the relationship between economic development and the outcomes of climate change. Especially under the influence of extreme climate risks, the promotion of renewable energy consumption should be accelerated. Second of all, improving national governance quality can alleviate the negative impact of climate risks on energy consumption. This requires governments of all countries to actively participate in global climate risk management and jointly promote the transition of energy consumption. Additionally, global cooperation should be strengthened. Countries with rich resources and high levels of economic development make full use of their own advantages to cooperate with developing countries in promoting energy consumption transition, jointly promoting the research, development and use of renewable energy. Only in this way can all countries jointly deal with the shocks from economic cycles and oil price fluctuations to promote the energy consumption transition.
Author Contributions
Methodology, J.P., Y.Z. and K.M.; Software, Y.Z.; Validation, J.P.; Formal analysis, J.P., K.M. and Y.Z.; Writing—original draft preparation, J.P.; Writing—review and editing, J.P. and K.M. All authors have read and agreed to the published version of the manuscript.
Funding
This research is funded by the National Social Science Foundation of China (19AJY027).
Data Availability Statement
The data used in this study are available publicly, please refer to the corresponding author for further details.
Acknowledgments
The authors are grateful to reviewers and editors for helpful comments and suggestions.
Conflicts of Interest
The authors declare no conflict of interest.
References
- Arent, D.; Pless, J.; Mai, T.; Wiser, R.; Hand, M.; Baldwin, S.; Denholm, P. Implications of high renewable electricity penetration in the US for water use, greenhouse gas emissions, land-use, and materials supply. Appl. Energy 2014, 123, 368–377. [Google Scholar] [CrossRef]
- Hirshleifer, D.; Shumway, T. Good day sunshine: Stock returns and the weather. J. Financ. 2003, 58, 1009–1032. [Google Scholar] [CrossRef]
- Novy-Marx, R. Predicting anomaly performance with politics, the weather, global warming, sunspots, and the stars. J. Financ. Econ. 2014, 112, 137–146. [Google Scholar] [CrossRef]
- Gielen, D.; Boshell, F.; Saygin, D.; Bazilian, M.D.; Wagner, N.; Gorini, R. The role of renewable energy in the global energy transformation. Energy Strateg. Rev. 2019, 24, 38–50. [Google Scholar] [CrossRef]
- Zoundi, Z. CO2 emissions, renewable energy and the Environmental Kuznets Curve, a panel cointegration approach. Renew. Sust. Energ. Rev. 2017, 72, 1067–1075. [Google Scholar] [CrossRef]
- Cian, E.; Wing, I.S. Global energy consumption in a warming climate. Environ. Resour. Econ. 2019, 72, 365–410. [Google Scholar] [CrossRef]
- Salim, R.A.; Hassan, K.; Shafiei, S. Renewable and non-renewable energy consumption and economic activities: Further evidence from OECD countries. Energy Econ. 2014, 44, 350–360. [Google Scholar] [CrossRef] [Green Version]
- Mohsin, M.; Kamran, H.W.; Nawaz, M.A.; Hussain, M.S.; Dahri, A.S. Assessing the impact of transition from nonrenewable to renewable energy consumption on economic growth-environmental nexus from developing Asian economies. J. Environ. Manage. 2021, 284, 111999. [Google Scholar] [CrossRef] [PubMed]
- Liddle, B. Urban density and climate change: A STIRPAT analysis using city-level data. J. Transp. Geogr. 2013, 28, 22–29. [Google Scholar] [CrossRef] [Green Version]
- Liu, X.; Kong, H.; Zhang, S. Can urbanization, renewable energy, and economic growth make environment more eco-friendly in Northeast Asia? Renew. Energ. 2021, 169, 23–33. [Google Scholar] [CrossRef]
- Sadorsky, P. The effect of urbanization and industrialization on energy use in emerging economies: Implications for sustainable development. Am. J. Econ. Sociol. 2014, 73, 392–409. [Google Scholar] [CrossRef]
- Mi, Z.F.; Pan, S.Y.; Yu, H.; Wei, Y.M. Potential impacts of industrial structure on energy consumption and CO2 emission: A case study of Beijing. J. Clean. Prod. 2015, 103, 455–462. [Google Scholar] [CrossRef] [Green Version]
- Seck, G.S.; Hache, E.; Bonnet, C.; Simoën, M.; Carcanague, S. Copper at the crossroads: Assessment of the interactions between low-carbon energy transition and supply limitations. Resour. Conserv. Recycl. 2020, 163, 105072. [Google Scholar] [CrossRef] [PubMed]
- Topcu, M.; Payne, J.E. Further evidence on the trade-energy consumption nexus in OECD countries. Energy Policy 2018, 117, 160–165. [Google Scholar] [CrossRef]
- Yao, X.; Shah, W.U.H.; Yasmeen, R.; Zhang, Y.; Kamal, M.A.; Khan, A. The impact of trade on energy efficiency in the global value chain: A simultaneous equation approach. Sci. Total Environ. 2021, 765, 142759. [Google Scholar] [CrossRef]
- Diaz, D.; Moore, F. Quantifying the economic risks of climate change. Nat. Clim. Chang. 2017, 7, 774–782. [Google Scholar] [CrossRef]
- Hsiang, S.; Kopp, R.; Jina, A.; Rising, J.; Delgado, M.; Mohan, S.; Houser, T. Estimating economic damage from climate change in the United States. Science 2017, 356, 1362–1369. [Google Scholar] [CrossRef] [PubMed] [Green Version]
- Tol, R.S. The economic impacts of climate change. Rev. Environ. Econ. Policy 2018, 12, 4–25. [Google Scholar] [CrossRef] [Green Version]
- Andersson, M.; Morgan, J.; Baccianti, C. Climate Change and the Macro Economy. Occasional Paper Series, European Central Bank. 2020. Available online: https://www.ecb.europa.eu/pub/pdf/scpops/ecb.op243~2ce3c7c4e1.en.pdf? (accessed on 25 June 2021).
- Huang, H.H.; Kerstein, J.; Wang, C. The impact of climate risk on firm performance and financing choices: An international comparison. J. Int. Bus. Stud. 2018, 49, 633–656. [Google Scholar] [CrossRef]
- Ding, R.; Liu, M.; Wang, T.; Wu, Z. The impact of climate risk on earnings management: International evidence. J. Account. Public. Pol. 2021, 40, 106818. [Google Scholar] [CrossRef]
- Kim, Y.; Park, M.S. Pricing of seasoned equity offers and earnings management. J. Financ. Quant. Anal. 2005, 40, 435–463. [Google Scholar] [CrossRef] [Green Version]
- Baker, E.; Solak, S. Climate change and optimal energy technology R&D policy. Eur. J. Oper. Res. 2011, 213, 442–454. [Google Scholar]
- Chung, J.B.; Kim, E.S. Public perception of energy transition in Korea: Nuclear power, climate change, and party preference. Energy Policy 2018, 116, 137–144. [Google Scholar] [CrossRef]
- Price, J.; Keppo, I. Modelling to generate alternatives: A technique to explore uncertainty in energy-environment-economy models. Appl. Energy 2017, 195, 356–369. [Google Scholar] [CrossRef] [Green Version]
- Mei, H.; Li, Y.P.; Suo, C.; Ma, Y.; Lv, J. Analyzing the impact of climate change on energy-economy-carbon nexus system in China. Appl. Energy 2020, 262, 114568. [Google Scholar] [CrossRef]
- Pointner, W.; Ritzberger-Grünwald, D. Climate Change as a Risk to Financial Stability. Financial Stability Report, Oesterreichische Nationalbank. 2019. Available online: https://www.oenb.at/en/Publications/Financial-Market/Financial-Stability-Report/2019/financial-stability-report-38.html (accessed on 24 June 2021).
- Dafermos, Y.; Nikolaidi, M.; Galanis, G. Climate change, financial stability and monetary policy. Ecol. Econ. 2018, 152, 219–234. [Google Scholar] [CrossRef]
- Giuzio, M.; Krušec, D.; Levels, A.; Melo, A.S.; Mikkonen, K.; Radulova, P. Climate Change and Financial Stability. Financial Stability Review, European Central Bank. 2019. Available online: https://www.ecb.europa.eu//pub/financial-stability/fsr/special/html/ecb.fsrart201905_1~47cf778cc1.en.html (accessed on 25 June 2021).
- Monasterolo, I. Climate change and the financial system. Annu. Rev. Resour. Econ. 2020, 12, 299–320. [Google Scholar] [CrossRef]
- Zheng, Y.; Chen, S.; Wang, N. Does financial agglomeration enhance regional green economy development? Evidence from China. Green Finance 2020, 2, 173–196. [Google Scholar] [CrossRef]
- Stern, P.; Sovacool, B.; Dietz, T. Towards a science of climate and energy choices. Nat. Clim. Chang. 2016, 6, 547–555. [Google Scholar] [CrossRef]
- Porfiriev, B.N. The low-carbon development paradigm and climate change risk reduction strategy for the economy. Stud. Russian Econ. Dev. 2019, 30, 111–118. [Google Scholar] [CrossRef]
- Mittenzwei, D.; Bruckermann, T.; Nordine, J.; Harms, U. The energy concept and its relation to climate literacy. Eurasia J. Math. Sci. Technol. Educ. 2019, 15, em1703. [Google Scholar] [CrossRef]
- Puttick, G.; Tucker-Raymond, E. Building systems from scratch: An exploratory study of students learning about climate change. J. Sci. Educ. Technol. 2018, 27, 306–321. [Google Scholar] [CrossRef]
- Fuss, S.; Szolgayová, J.; Khabarov, N.; Obersteiner, M. Renewables and climate change mitigation: Irreversible energy investment under uncertainty and portfolio effects. Energy Policy 2012, 40, 59–68. [Google Scholar] [CrossRef]
- Mccollum, D.; Krey, V.; Kolp, P.; Yu, N.; Riahi, K. Transport electrification: A key element for energy system transformation and climate stabilization. Clim. Chang. 2014, 123, 651–664. [Google Scholar] [CrossRef]
- Mikellidou, C.V.; Shakou, L.M.; Boustras, G.; Dimopoulos, C. Energy critical infrastructures at risk from climate change: A state of the art review. Safety Sci. 2018, 110, 110–120. [Google Scholar] [CrossRef]
- Canales, F.A.; Jadwiszczak, P.; Jurasz, J.; Wdowikowski, M.; Ciapała, B.; Kaźmierczak, B. The impact of long-term changes in air temperature on renewable energy in Poland. Sci. Total Environ. 2020, 729, 138965. [Google Scholar] [CrossRef]
- Chakravarty, S.; Tavoni, M. Energy poverty alleviation and climate change mitigation: Is there a trade off? Energy Econ. 2013, 40, S67–S73. [Google Scholar] [CrossRef] [Green Version]
- Kinley, R. Climate change after Paris: From turning point to transformation. Clim. Policy 2017, 17, 9–15. [Google Scholar] [CrossRef]
- Schaffrin, A.; Sewerin, S.; Seubert, S. The innovativeness of national policy portfolios–climate policy change in Austria, Germany, and the UK. Environ. Polit. 2014, 23, 860–883. [Google Scholar] [CrossRef]
- Andonova, L.B.; Hale, T.N.; Roger, C.B. National policy and transnational governance of climate change: Substitutes or complements? Int. Stud. Quart. 2017, 61, 253–268. [Google Scholar] [CrossRef] [Green Version]
- Bang, G. Energy security and climate change concerns: Triggers for energy policy change in the United States? Energy Policy 2010, 38, 1645–1653. [Google Scholar] [CrossRef]
- Tjernström, E.; Tietenberg, T. Do differences in attitudes explain differences in national climate change policies? Ecol. Econ. 2008, 65, 315–324. [Google Scholar] [CrossRef]
- Apergis, N.; Payne, J.E. Renewable energy consumption and economic growth: Evidence from a panel of OECD countries. Energy Policy 2010, 38, 656–660. [Google Scholar] [CrossRef]
- Sadorsky, P. Do urbanization and industrialization affect energy intensity in developing countries? Energy Econ. 2013, 37, 52–59. [Google Scholar] [CrossRef]
- Tiba, S.; Frikha, M. Income, trade openness and energy interactions: Evidence from simultaneous equation modeling. Energy 2018, 147, 799–811. [Google Scholar] [CrossRef]
- Kaufmann, D.; Kraay, A.; Mastruzzi, M. The Worldwide Governance Indicators: Methodology and Analytical Issues1. Hague J. Rule Law 2011, 3, 220–246. [Google Scholar] [CrossRef]
- Harmeling, S. Global Climate Risk Index 2006: Weather-Related Loss Events and Their Impacts on Countries in 2004 and in a LongTerm Comparison. Germanwatch. 2006. Available online: https://germanwatch.org/sites/default/files/publication/2154.pdf (accessed on 24 June 2021).
- Kreft, S.; Eckstein, D. Global Climate Risk Index 2014: Who Suffers Most from Extreme Weather Events? Weather-Related Loss Events in 2012 and 1993 to 2012. Germanwatch. 2014. Available online: https://germanwatch.org/sites/default/files/publication/8551.pdf (accessed on 24 June 2021).
- Xu, X.; Wei, Z.; Ji, Q.; Wang, C.; Gao, G. Global renewable energy development: Influencing factors, trend predictions and countermeasures. Resour. Policy 2019, 63, 101470. [Google Scholar] [CrossRef]
- Harjanne, A.; Korhonen, J.M. Abandoning the concept of renewable energy. Energy Policy 2019, 127, 330–340. [Google Scholar] [CrossRef] [Green Version]
- Albouy, D.; Graf, W.; Kellogg, R.; Wolff, H. Climate amenities, climate change, and American quality of life. J. Assoc. Environ. Resour. Econ. 2016, 3, 205–246. [Google Scholar] [CrossRef] [Green Version]
- Lawless, A.S.; Seitz, R.D. Effects of shoreline stabilization and environmental variables on benthic infaunal communities in the Lynnhaven River System of Chesapeake Bay. J. Exp. Mar. Biol. Ecol. 2014, 457, 41–50. [Google Scholar] [CrossRef]
- Xia, Y.; Zhang, T.; Yu, M.; Pan, L. Regional Disparities and Transformation of Energy Consumption in China Based on a Hybrid Input-Output Analysis. Energies 2020, 13, 5287. [Google Scholar] [CrossRef]
- Yüksel, I. Energy production and sustainable energy policies in Turkey. Renew. Energ. 2010, 35, 1469–1476. [Google Scholar] [CrossRef]
- Alvarado, R.; Deng, Q.; Tillaguango, B.; Méndez, P.; Bravo, D.; Chamba, J.; Ahmad, M. Do economic development and human capital decrease non-renewable energy consumption? Evidence for OECD countries. Energy 2021, 215, 119147. [Google Scholar] [CrossRef]
- Narayan, P.K.; Narayan, S.; Smyth, R. Energy consumption at business cycle horizons: The case of the United States. Energy Econ. 2011, 33, 161–167. [Google Scholar] [CrossRef]
- Balcilar, M.; Ozdemir, Z.A.; Ozdemir, H.; Shahbaz, M. The renewable energy consumption and growth in the G-7 countries: Evidence from historical decomposition method. Renew. Energ. 2018, 126, 594–604. [Google Scholar] [CrossRef] [Green Version]
- Al-Maamary, H.M.; Kazem, H.A.; Chaichan, M.T. The impact of oil price fluctuations on common renewable energies in GCC countries. Renew. Sust. Energ. Rev. 2017, 75, 989–1007. [Google Scholar] [CrossRef]
- Haque, M.I. Oil price shocks and energy consumption in GCC countries: A system-GMM approach. Environ. Dev. Sustain. 2021, 23, 9336–9351. [Google Scholar] [CrossRef]
- Sadorsky, P. Renewable energy consumption, CO2 emissions and oil prices in the G7 countries. Energy Econ. 2009, 31, 456–462. [Google Scholar] [CrossRef]
- Jaffe, A.M. Geopolitics and the Oil Price Cycle-An Introduction. Econ. Energy Environ. Pol. 2020, 9, 1–10. [Google Scholar]
Figure 1.
The mean of the climate risk index for each country.

Figure 2.
Changes in energy consumption structure and climate risk index.


Table 1.
Variables and Data Sources.
| Variables | Calculation | Meaning | Data Sources |
|---|---|---|---|
| ECT | the proportion of renewable energy consumption in the total initial energy consumption | reflects the level of energy consumption transition | BP Statistical Review of World Energy |
| CRI | the current climate risk index score | reflects the short-term effects of climate risk | Germanwatch, the Global Climate Risk Index Report |
| CRI_long | the cumulative climate risk index for the previous 20 years | reflects the long-term effects of climate risk | Germanwatch, the Global Climate Risk Index Report |
| lnpgdp | the natural logarithm of the actual GDP per capita | reflects the level of economic development | World Bank WDI Database |
| urbanr | the proportion of urban population in the total population | reflects the level of urbanization | World Bank WDI Database |
| indusr | the proportion of industrial value-added in the GDP | reflects the level of industrialization | World Bank WDI Database |
| trader | the proportion of trade scale in the GDP | reflects the degree of trade activity | World Bank WDI Database |
Table 2.
Descriptive Statistics.
| Variables | Obs | Mean | Std. Dev. | Min | Max | ADF-Fisher Test |
|---|---|---|---|---|---|---|
| ECT | 1018 | 0.026 | 0.03 | 0 | 0.125 | 3.486 *** |
| CRI | 1313 | 69.216 | 31.585 | 1.83 | 126.17 | 14.126 *** |
| CRI_long | 1371 | 86.829 | 41.119 | 7.33 | 179.17 | 12.583 *** |
| lnpgdp | 1347 | 9.206 | 1.351 | 5.684 | 11.685 | 24.237 *** |
| urbanr | 1361 | 0.663 | 0.203 | 0.13 | 1 | 10.439 *** |
| indusr | 1321 | 0.313 | 0.134 | 0.01 | 0.878 | 8.777 *** |
| trader | 1300 | 0.919 | 0.608 | 0.002 | 4.426 | 16.997 *** |
Note: (1) The ADF-Fisher test is based on the augmented Dickey-Fuller test to perform Fisher-type unit-root test on each variable, which is used to describe whether the panel data is stable. The adjusted inv. chi-squared value is given in the last column; (2) *** p < 0.01.
Table 3.
Pearson correlation matrix.
| Variables | ECT | CRI | CRI_long | lnpgdp | Urbanr | Indusr | Trader |
|---|---|---|---|---|---|---|---|
| ECT | 1.000 | ||||||
| CRI | −0.093 *** | 1.000 | |||||
| CRI_long | −0.144 *** | 0.649 *** | 1.000 | ||||
| lnpgdp | 0.348 *** | 0.229 *** | 0.266 *** | 1.000 | |||
| urbanr | 0.145 *** | 0.256 *** | 0.338 *** | 0.780 *** | 1.000 | ||
| indusr | −0.42 2 *** | 0.184 *** | 0.327 *** | −0.026 | 0.050 * | 1.000 | |
| trader | −0.028 | 0.322 *** | 0.316 *** | 0.328 *** | 0.261 *** | −0.024 | 1.000 |
Notes: *** p < 0.01, * p < 0.1.
Table 4.
Estimation results of the effect of climate risk on energy consumption transition.
| (1) | (2) | (3) | (4) | (5) | (6) | |
|---|---|---|---|---|---|---|
| Variables | ECT | ECT | ECT | ECT | ECT | ECT |
| CRI | 0.459 *** | 0.332 *** | - | - | - | - |
| (0.099) | (0.094) | |||||
| CRI(-1) | - | - | 0.275 *** | - | - | - |
| (0.100) | ||||||
| CRI_long | - | - | - | 0.578 *** | 0.359 *** | - |
| (0.097) | (0.103) | |||||
| CRI_long(-1) | - | - | - | - | - | 0.357 *** |
| (0.109) | ||||||
| lnpgdp | - | 1.217 *** | 1.308 *** | - | 1.235 *** | 1.325 *** |
| (0.107) | (0.114) | (0.104) | (0.111) | |||
| urbanr | - | −2.725 *** | −3.012 *** | - | −2.534 *** | −2.788 *** |
| (0.678) | (0.721) | (0.679) | (0.715) | |||
| indusr | - | −8.480 *** | −9.172 *** | - | −7.793 *** | −8.402 *** |
| (0.730) | (0.775) | (0.731) | (0.771) | |||
| trader | - | −0.676 *** | −0.743 *** | - | −0.712 *** | −0.750 *** |
| (0.139) | (0.148) | (0.134) | (0.142) | |||
| Constant | 2.594 *** | −3.764 *** | −4.076 *** | 2.504 *** | −4.310 *** | −4.695 *** |
| (0.094) | (0.823) | (0.880) | (0.092) | (0.823) | (0.875) | |
| Observations | 974 | 933 | 859 | 1016 | 969 | 893 |
| R-squared | 0.090 | 0.359 | 0.362 | 0.106 | 0.361 | 0.366 |
| Country FE | Yes | Yes | Yes | Yes | Yes | Yes |
| Year FE | Yes | Yes | Yes | Yes | Yes | Yes |
Notes: (1) Standard errors are in parentheses; (2) *** p < 0.01; (3) The result of the Hausman test is , implying that the fixed-effects model is better for the empirical research of this study.
Table 5.
Estimation results of the effect of climate risk on fossil energy consumption.
| (1) | (2) | (3) | (4) | (5) | (6) | |
|---|---|---|---|---|---|---|
| Variables | Ln_Oil | Ln_Oil | Ln_Coal | Ln_Coal | Ln_Gas | Ln_Gas |
| CRI | −0.594 *** | - | −0.941 *** | - | −0.408 *** | - |
| (0.043) | (0.086) | (0.053) | ||||
| CRI_long | - | −0.626 *** | - | −0.831 *** | - | −0.501 *** |
| (0.048) | (0.097) | (0.057) | ||||
| lnpgdp | −0.008 | −0.041 | −0.117 | −0.159 | −0.068 | −0.121 ** |
| (0.049) | (0.049) | (0.098) | (0.098) | (0.059) | (0.058) | |
| urbanr | 2.610 *** | 3.164 *** | 0.834 | 1.368 ** | 2.134 *** | 2.863 *** |
| (0.314) | (0.324) | (0.619) | (0.640) | (0.399) | (0.401) | |
| indusr | 1.776 *** | 2.412 *** | −4.948 *** | −4.890 *** | 2.827 *** | 3.516 *** |
| (0.338) | (0.346) | (0.735) | (0.735) | (0.408) | (0.407) | |
| trader | −0.439 *** | −0.394 *** | −0.873 *** | −0.914 *** | −0.675 *** | −0.597 *** |
| (0.064) | (0.064) | (0.126) | (0.125) | (0.077) | (0.074) | |
| Constant | 0.818 ** | 0.546 | 3.690 *** | 3.864 *** | 1.055 ** | 0.739 |
| (0.401) | (0.412) | (0.812) | (0.827) | (0.477) | (0.476) | |
| Observations | 984 | 1022 | 943 | 980 | 944 | 980 |
| R-squared | 0.291 | 0.266 | 0.249 | 0.216 | 0.227 | 0.242 |
| Country FE | Yes | Yes | Yes | Yes | Yes | Yes |
| Year FE | Yes | Yes | Yes | Yes | Yes | Yes |
Notes: (1) Standard errors are in parentheses; (2) *** p < 0.01, ** p < 0.05. (2) The data of fossil energy consumption is from the BP Statistical Review of World Energy.
Table 6.
Estimation results of the moderating effect of governance quality.
| (1) | (2) | (3) | (4) | (5) | (6) | |
|---|---|---|---|---|---|---|
| Variables | ECT | ECT | ECT | ECT | ECT | ECT |
| CRI | 0.150 * | 0.313 *** | 0.297 *** | 0.199 ** | 0.280 *** | 0.289 *** |
| (0.090) | (0.094) | (0.103) | (0.097) | (0.095) | (0.094) | |
| vae | 1.547 *** | - | - | - | - | - |
| (0.141) | ||||||
| CRI × vae | −0.120 | - | - | - | - | - |
| (0.080) | ||||||
| pve | - | 0.614 *** | - | - | - | - |
| (0.148) | ||||||
| CRI × pve | - | −0.269 *** | - | - | - | - |
| (0.088) | ||||||
| gee | - | - | 0.809 *** | - | - | - |
| (0.202) | ||||||
| CRI × gee | - | - | −0.079 | - | - | - |
| (0.101) | ||||||
| rqe | - | - | - | 1.314 *** | - | - |
| (0.171) | ||||||
| CRI × rqe | - | - | - | −0.030 | - | - |
| (0.091) | ||||||
| rle | - | - | - | - | 1.122 *** | - |
| (0.176) | ||||||
| CRI × rle | - | - | - | - | −0.197 ** | - |
| (0.089) | ||||||
| cce | - | - | - | - | - | 0.989 *** |
| (0.165) | ||||||
| CRI × cce | - | - | - | - | - | −0.157 * |
| (0.087) | ||||||
| lnpgdp | 0.271 ** | 0.817 *** | 0.670 *** | 0.309 * | 0.321 * | 0.468 *** |
| (0.132) | (0.147) | (0.175) | (0.159) | (0.179) | (0.167) | |
| urbanr | −1.392 ** | −1.727 ** | −1.978 *** | −1.681 ** | −1.132 | −2.066 *** |
| (0.651) | (0.703) | (0.698) | (0.673) | (0.709) | (0.677) | |
| indusr | −1.383 | −8.062 *** | −6.999 *** | −5.646 *** | −6.207 *** | −6.512 *** |
| (0.929) | (0.727) | (0.802) | (0.793) | (0.785) | (0.777) | |
| trader | −0.538 *** | −0.971 *** | −0.866 *** | −0.977 *** | −0.949 *** | −0.931 *** |
| (0.136) | (0.151) | (0.151) | (0.147) | (0.145) | (0.148) | |
| Constant | 1.664 * | −0.607 | 0.164 | 2.887 ** | 2.707 ** | 2.129 |
| (0.925) | (1.187) | (1.313) | (1.199) | (1.331) | (1.311) | |
| Observations | 919 | 919 | 919 | 919 | 919 | 919 |
| R-squared | 0.438 | 0.374 | 0.370 | 0.399 | 0.391 | 0.387 |
| Country FE | Yes | Yes | Yes | Yes | Yes | Yes |
| Year FE | Yes | Yes | Yes | Yes | Yes | Yes |
Notes: (1) Standard errors are in parentheses; (2) *** p < 0.01, ** p < 0.05, * p < 0.1.
Table 7.
Estimation results of the endogeneity test.
| (1) | (2) | (3) | (4) | |
|---|---|---|---|---|
| Variables | 1st Stage | 2st Stage DV: ECT | 1st Stage | 2st Stage DV: ECT |
| CRI | - | 1.287 *** | - | - |
| (0.328) | ||||
| CRI_long | - | - | - | 2.700 *** |
| (0.743) | ||||
| lnpgdp | −0.090 ** | 1.288 *** | −0.083 ** | 1.430 *** |
| (0.040) | (0.127) | (0.036) | (0.152) | |
| urbanr | −0.905 *** | −1.787 ** | −1.29 8 *** | 0.438 |
| (0.247) | (0.833) | (0.224) | (1.305) | |
| indusr | −1.124 *** | −7.416 *** | −2.098 *** | −2.870 |
| (0.248) | (0.885) | (0.220) | (1.837) | |
| trader | −0.216 *** | −0.173 | −0.402 *** | 0.582 |
| (0.058) | (0.225) | (0.051) | (0.432) | |
| lncoastline | 0.175 *** | - | 0.088 *** | - |
| (0.018) | (0.016) | |||
| Constant | 0.450 | −4.472 *** | 1.994 *** | −9.666 *** |
| (0.339) | (1.138) | (0.308) | (2.278) | |
| Observations | 842 | 842 | 873 | 873 |
| R-squared | 0.298 | 0.282 | 0.357 | 0.026 |
| Country FE | Yes | Yes | Yes | Yes |
| Year FE | Yes | Yes | Yes | Yes |
Notes: (1) Standard errors are in parentheses; (2) *** p < 0.01, ** p < 0.05.
Table 8.
Estimation results of the heterogeneity test.
| Panel A Differential Impact of Energy Resource Scale | ||||
| (1) | (2) | (3) | (4) | |
| Variables | Resource-Rich | Resource-Rich | Resource-Poor | Resource-Poor |
| CRI | 0.376 *** | 0.126 | ||
| (0.121) | (0.141) | |||
| CRI_long | 0.290 ** | 0.347 ** | ||
| (0.141) | (0.145) | |||
| Control | Yes | Yes | Yes | Yes |
| Observations | 723 | 750 | 209 | 218 |
| R-squared | 0.323 | 0.321 | 0.545 | 0.564 |
| Country FE | Yes | Yes | Yes | Yes |
| Year FE | Yes | Yes | Yes | Yes |
| Panel B Differential impact of economic development scale | ||||
| (5) | (6) | (7) | (8) | |
| VARIABLES | economy-high | economy-high | Economy—low | economy-low |
| CRI | 0.192 | 0.576 *** | ||
| (0.155) | (0.102) | |||
| CRI _long | −0.078 | 0.724 *** | ||
| (0.161) | (0.111) | |||
| Control | Yes | Yes | Yes | Yes |
| Observations | 530 | 558 | 403 | 411 |
| R-squared | 0.342 | 0.343 | 0.205 | 0.226 |
| Country FE | Yes | Yes | Yes | Yes |
| Year FE | Yes | Yes | Yes | Yes |
Notes: (1) Standard errors in parentheses; (2) *** p < 0.01, ** p < 0.05.
Table 9.
Estimation results of the external impact test.
| Panel A the Impact of the Business Cycle | ||||
| (1) | (2) | (3) | (4) | |
| Variables | Economic Boom | Economic Boom | Economic Recession | Economic Recession |
| CRI | 0.092 | 0.342 *** | ||
| (0.184) | (0.107) | |||
| CRI _long | −0.013 | 0.399 *** | ||
| (0.190) | (0.120) | |||
| Control | Yes | Yes | Yes | Yes |
| Observations | 246 | 282 | 687 | 687 |
| R-squared | 0.189 | 0.207 | 0.393 | 0.393 |
| Country FE | Yes | Yes | Yes | Yes |
| Year FE | Yes | Yes | Yes | Yes |
| Panel B The impact of oil price fluctuations | ||||
| (5) | (6) | (7) | (8) | |
| VARIABLES | Oil prices rise | Oil prices rise | Oil prices fall | Oil prices fall |
| CRI | 0.275 ** | 0.436 *** | ||
| (0.114) | (0.165) | |||
| CRI _long | 0.353 *** | 0.360 ** | ||
| (0.127) | (0.176) | |||
| Control | Yes | Yes | Yes | Yes |
| Observations | 606 | 625 | 327 | 344 |
| R-squared | 0.352 | 0.358 | 0.373 | 0.365 |
| Country FE | Yes | Yes | Yes | Yes |
| Year FE | Yes | Yes | Yes | Yes |
Notes: (1) Standard errors are in parentheses; (2) *** p < 0.01, ** p < 0.05.
Publisher’s Note: MDPI stays neutral with regard to jurisdictional claims in published maps and institutional affiliations. |
© 2021 by the authors. Licensee MDPI, Basel, Switzerland. This article is an open access article distributed under the terms and conditions of the Creative Commons Attribution (CC BY) license (https://creativecommons.org/licenses/by/4.0/).
Share and Cite
MDPI and ACS Style
Peng, J.; Zheng, Y.; Mao, K. Heterogeneous Impacts of Extreme Climate Risks on Global Energy Consumption Transition: An International Comparative Study. Energies 2021, 14, 4189. https://0-doi-org.brum.beds.ac.uk/10.3390/en14144189
AMA Style
Peng J, Zheng Y, Mao K. Heterogeneous Impacts of Extreme Climate Risks on Global Energy Consumption Transition: An International Comparative Study. Energies. 2021; 14(14):4189. https://0-doi-org.brum.beds.ac.uk/10.3390/en14144189
Chicago/Turabian StylePeng, Jiaying, Yuhang Zheng, and Ke Mao. 2021. "Heterogeneous Impacts of Extreme Climate Risks on Global Energy Consumption Transition: An International Comparative Study" Energies 14, no. 14: 4189. https://0-doi-org.brum.beds.ac.uk/10.3390/en14144189
Note that from the first issue of 2016, this journal uses article numbers instead of page numbers. See further details here.