
A Regional Day-Ahead Rooftop Photovoltaic Generation Forecasting Model Considering Unauthorized Photovoltaic Installation


Gwangju Institute of Science and Technology (GIST), School of Integrated Technology, Gwangju 61005, Korea
*
Author to whom correspondence should be addressed.
Energies 2021, 14(14), 4256; https://0-doi-org.brum.beds.ac.uk/10.3390/en14144256
Submission received: 20 May 2021
/
Revised: 18 June 2021
/
Accepted: 12 July 2021
/
Published: 14 July 2021
(This article belongs to the Special Issue Solar and Wind Power and Energy Forecasting Ⅱ)
Abstract
:Rooftop photovoltaic (PV) systems are usually behind the meter and invisible to utilities and retailers and, thus, their power generation is not monitored. If a number of rooftop PV systems are installed, it transforms the net load pattern in power systems. Moreover, not only generation but also PV capacity information is invisible due to unauthorized PV installations, causing inaccuracies in regional PV generation forecasting. This study proposes a regional rooftop PV generation forecasting methodology by adding unauthorized PV capacity estimation. PV capacity estimation consists of two steps: detection of unauthorized PV generation and estimation capacity of detected PV. Finally, regional rooftop PV generation is predicted by considering unauthorized PV capacity through the support vector regression (SVR) and upscaling method. The results from a case study show that compared with estimation without unauthorized PV capacity, the proposed methodology reduces the normalized root mean square error (nRMSE) by 5.41% and the normalized mean absolute error (nMAE) by 2.95%, It can be concluded that regional rooftop PV generation forecasting accuracy is improved.
1. Introduction
1.1. Background and Motivation
In the past, fossil fuels were a key driving force for growth in the fields of technology, society and economy, and were used as the main energy source through the industrial revolution [1]. However, fossil fuels generate 65% of the annual carbon dioxide, which is known to cause global warming and causes air pollution [2,3]. In order to solve the problem caused by the use of fossil fuels, electricity is produced by renewable energy sources. According to the IRENA survey, the capacity of renewable energy utilities increased from 1329 GW to 2799 GW over the past 10 years, of which the supply of photovoltaic (PV) utilities increased from 73 GW to 713 GW [4].
Another reason for the increased supply of solar power facilities is the decline in the levelized cost of electricity (LCOE) [5], and renewable energy policies such as the feed-in-tariff (FiT) and renewable portfolio standard (RPS) [6]. In particular, rooftop PV increased rapidly due to factors such as a decrease in rooftop PV generation costs [7], incentive for roof PV installations, and reduction of house electricity bills [8,9]. However, the solar power output has the characteristic that the output is determined according to the amount of irradiance and the PV module temperature, which have intermittent characteristics. In the case of self-consumption, the power demand changes, and when the solar power facility is connected to the power grid system, the uncertainty in power supply increases.
When the uncertainty in the output of renewable energy increases, a supply-demand imbalance occurs, and when the difference between supply and demand becomes extremely large, frequency fluctuation occurs. Second, reverse currents flow within the distribution system. Lastly, system operation costs increase due to frequent two shifting for ancillary services [10]. In order to solve the problem of uncertainty of PV output, it is necessary to predict the amount of solar power generation. For about 10 years, research on predicting PV output has been conducted [11].
One of the important features of PV is that PV is distributed and installed in several areas because it can generate power wherever solar irradiance is provided. From the power system operator perspective, although the total sum of distributed PV power generation is an important value to balance supply and demand, there are practical difficulties in collecting accurate meteorological and PV output data for all regions.
Therefore, a lot of regional PV generation forecasting research has been studied to predict the integrated PV generation amounts of distributed resources by using limited data by the upscaling method [12,13,14,15,16,17,18,19,20,21,22,23,24,25,26].
In the upscaling method, the entire region is divided into sub-regions, a sample within the sub-region is determined from there to predict the amount of power generation, and then upscaling is performed for each sub-region. Here, the upscaling is to multiply by the upscaling factor after adding the predicted value of the sample power generation in the sub-region. Through the upscaling process, the amount of power generation in the sub-region is predicted. The solar power generation amount of the entire region is predicted by adding the forecast value of the generation amount of the sub-region.
Since 2014, unauthorized PV installations have occurred [27,28,29]. The first reason why unauthorized PV installation is occurring is because residents avoid the roof-type solar power installation fee, the second is not wanting to carry out obligations for solar power installation, and the last reason is the lack of awareness of the impact of unauthorized solar installations on the power system [27]. As unauthorized PV installations occur, deviations occur between the actual photovoltaic facility capacity and the photovoltaic facility capacity information known to the system operator. As unauthorized PV installation occurs, the actual PV capacity and the capacity known to the system operator are different.
This difference in PV capacity information leads to a prediction error of the solar power generation amount by region (reduces the prediction accuracy), and it becomes difficult to calculate the appropriate hosting capacity in the power system. In addition, overvoltage occurs in the power system, which not only threatens the safety of employees of the electric power utility, but also damages the facilities in the power system [30].
Unauthorized PV installation can cause various problems in terms of safety. It causes overvoltage and back-feeding which, if sustained, can damage transformers, voltage regulators, and customers’ appliances [30,31]. In addition to Cape Town, unregistered solar installations occur in California and Hawaii [32]. Arizona is charging new solar customers to prevent unregistered solar installations [33].
In order to compensate for the problems caused by the unauthorized PV installation, the process of detecting unauthorized PV installation and estimating the PV capacity should precede predicting the amount of solar power generation.
1.2. Literature Review
In this section, literature reviews are classified into three groups as shown in Table 1. Many single PV forecasting studies have been conducted in the past. However, single PV generation forecasting is less robust than regional PV generation forecasting. Single PV output has large variability due to meteorological factors. If the location where PV is installed is different, solar irradiance is also different; therefore, the PV generation pattern varies significantly depending on the PV location. However, regional PV generation is combined with several PV power generation sources; thus, the volatility is smaller than in single PV power generation and easier to forecast. In addition, missing and abnormal data occur because of malfunctions. This reduces the accuracy of single PV generation forecasting. Like PV capacity in a power system, regional PV generation has similar characteristics and trends; hence, PV generation forecasting in the region is valuable.
Regional PV output forecasting research targets at utility scale PV (above 100 kW) [12,13,14,15,16,17,18,19,20,21,22,23,24,25,26]. In [10], representative solar sites are forecast and scaled up them. Ref. [13] is similar [12] and considers this with snow. Refs. [14,15,16,18] reduce the data dimension by using principle component analysis (PCA) and forecast regional PV generation. Ref. [17] predicts representative solar site generation by using six machine learning method. In regional PV output forecasting of [17], superposition and upscaling methods are applied. Ref. [19] predicts single PV generation by numerical weather prediction and corrects prediction error by linear regression. Regional PV output forecasting in [19] is carried out by upscaling. Ref. [20] analyzes the effect on the regional PV generation forecasting accuracy by the number of representative solar sites. Refs. [21,22] employ a representative solar sites forecasting neural network (NN) model using weather and satellite data to predict regional PV generation by scaling them up. Ref. [23] is characterized by using the minimum redundancy maximum relevance (mRMR) criterion.
Among the regional PV output forecasting models, there are few regional behind the meter (BTM) PV forecasting models [28,34,35,36,37]. Ref. [28] selects representative solar sites using K-means clustering and PCA and uses various machine learning models to forecast single and regional rooftop PV generation. Likewise, [34] targets rooftop PV and uses a similar method, which selects representative solar sites. Unlike [28,34] uses fuzzy arithmetic. This helps to mitigate uncertainties of rooftop PV power. Ref. [35] estimates rooftop PV capacity using weather forecast data. By this method, rooftop PV generation is predicted in [35]. Ref. [38] considers not only the invisible PV but also the missing data problem by communication failure. Although [38] does not focus on regional PV, the proposed methodology is valuable when PV generation has missing data. Ref. [37] uses limited representative solar sites and weather forecast data to predict aggregated PV generation. Additionally, [37] uses the fuzzy arithmetic wavelet neural network (FAWNN) to correct PV generation data uncertainty.
Refs. [27,38,39,40] belong to group 3 in Table 1. Ref. [27] proposes three processes, including PV detection, PV identification, and PV capacity estimation. It has a limit that there must be data before and after the rooftop PV is installed. Ref. [38] uses random matrix theory to detect and estimate unauthorized PV. Ref. [39] proposes machine learning based unauthorized PV detection and estimation model trained net load data. It is available to detect and estimate accurately by utilizing difference between sunny days and rainy days. However, [40] estimates PV capacity without a detection process. Ref. [40] proposes an ensemble model PV capacity estimation with optimal net load pair.
1.3. Contributions
To handle the uncertainty of unauthorized PV installation, a PV detection and capacity estimation model is applied to the regional rooftop PV forecasting model in this study. The main contributions of this paper are summarized as follows.
Detection performance was improved by adding two detection features. The correlation between the featured and the presence or absence of unregistered solar installation was confirmed through the MIC, and it was confirmed that the new feature had a higher correlation than the existing feature. Refs. [35,36] did not investigate the effect of unregistered solar installation on the prediction accuracy of solar power generation, and this paper verified it through a case study.
1.4. Structure of This Study
The rest of the study is organized as follows: Section 2 describes the problem formulation and the overall framework of the proposed approach. In Section 3, details of unauthorized PV detection, unauthorized PV capacity estimation, and upscaling method for regional PV forecasting are presented. In Section 4, a case study is presented to verify the effectiveness of the proposed approach. Section 5 deals with model features analysis of considering the proposed approach. Section 6 contains the conclusion and highlights future work.
2. Problem Formulation of Unauthorized Photovoltaic (PV) Installation and Regional Rooftop PV Forecasting
2.1. Problem Statement
Assume that a home smart meter collects net load data hourly for several days. Here, D, D = {d|d = 1, 2,..., D} is the defined set of day and T, T = {t|t = 1, 2,..., T} is defined set of time slots. The net load on day d and time slot t is shown in Equation (1):
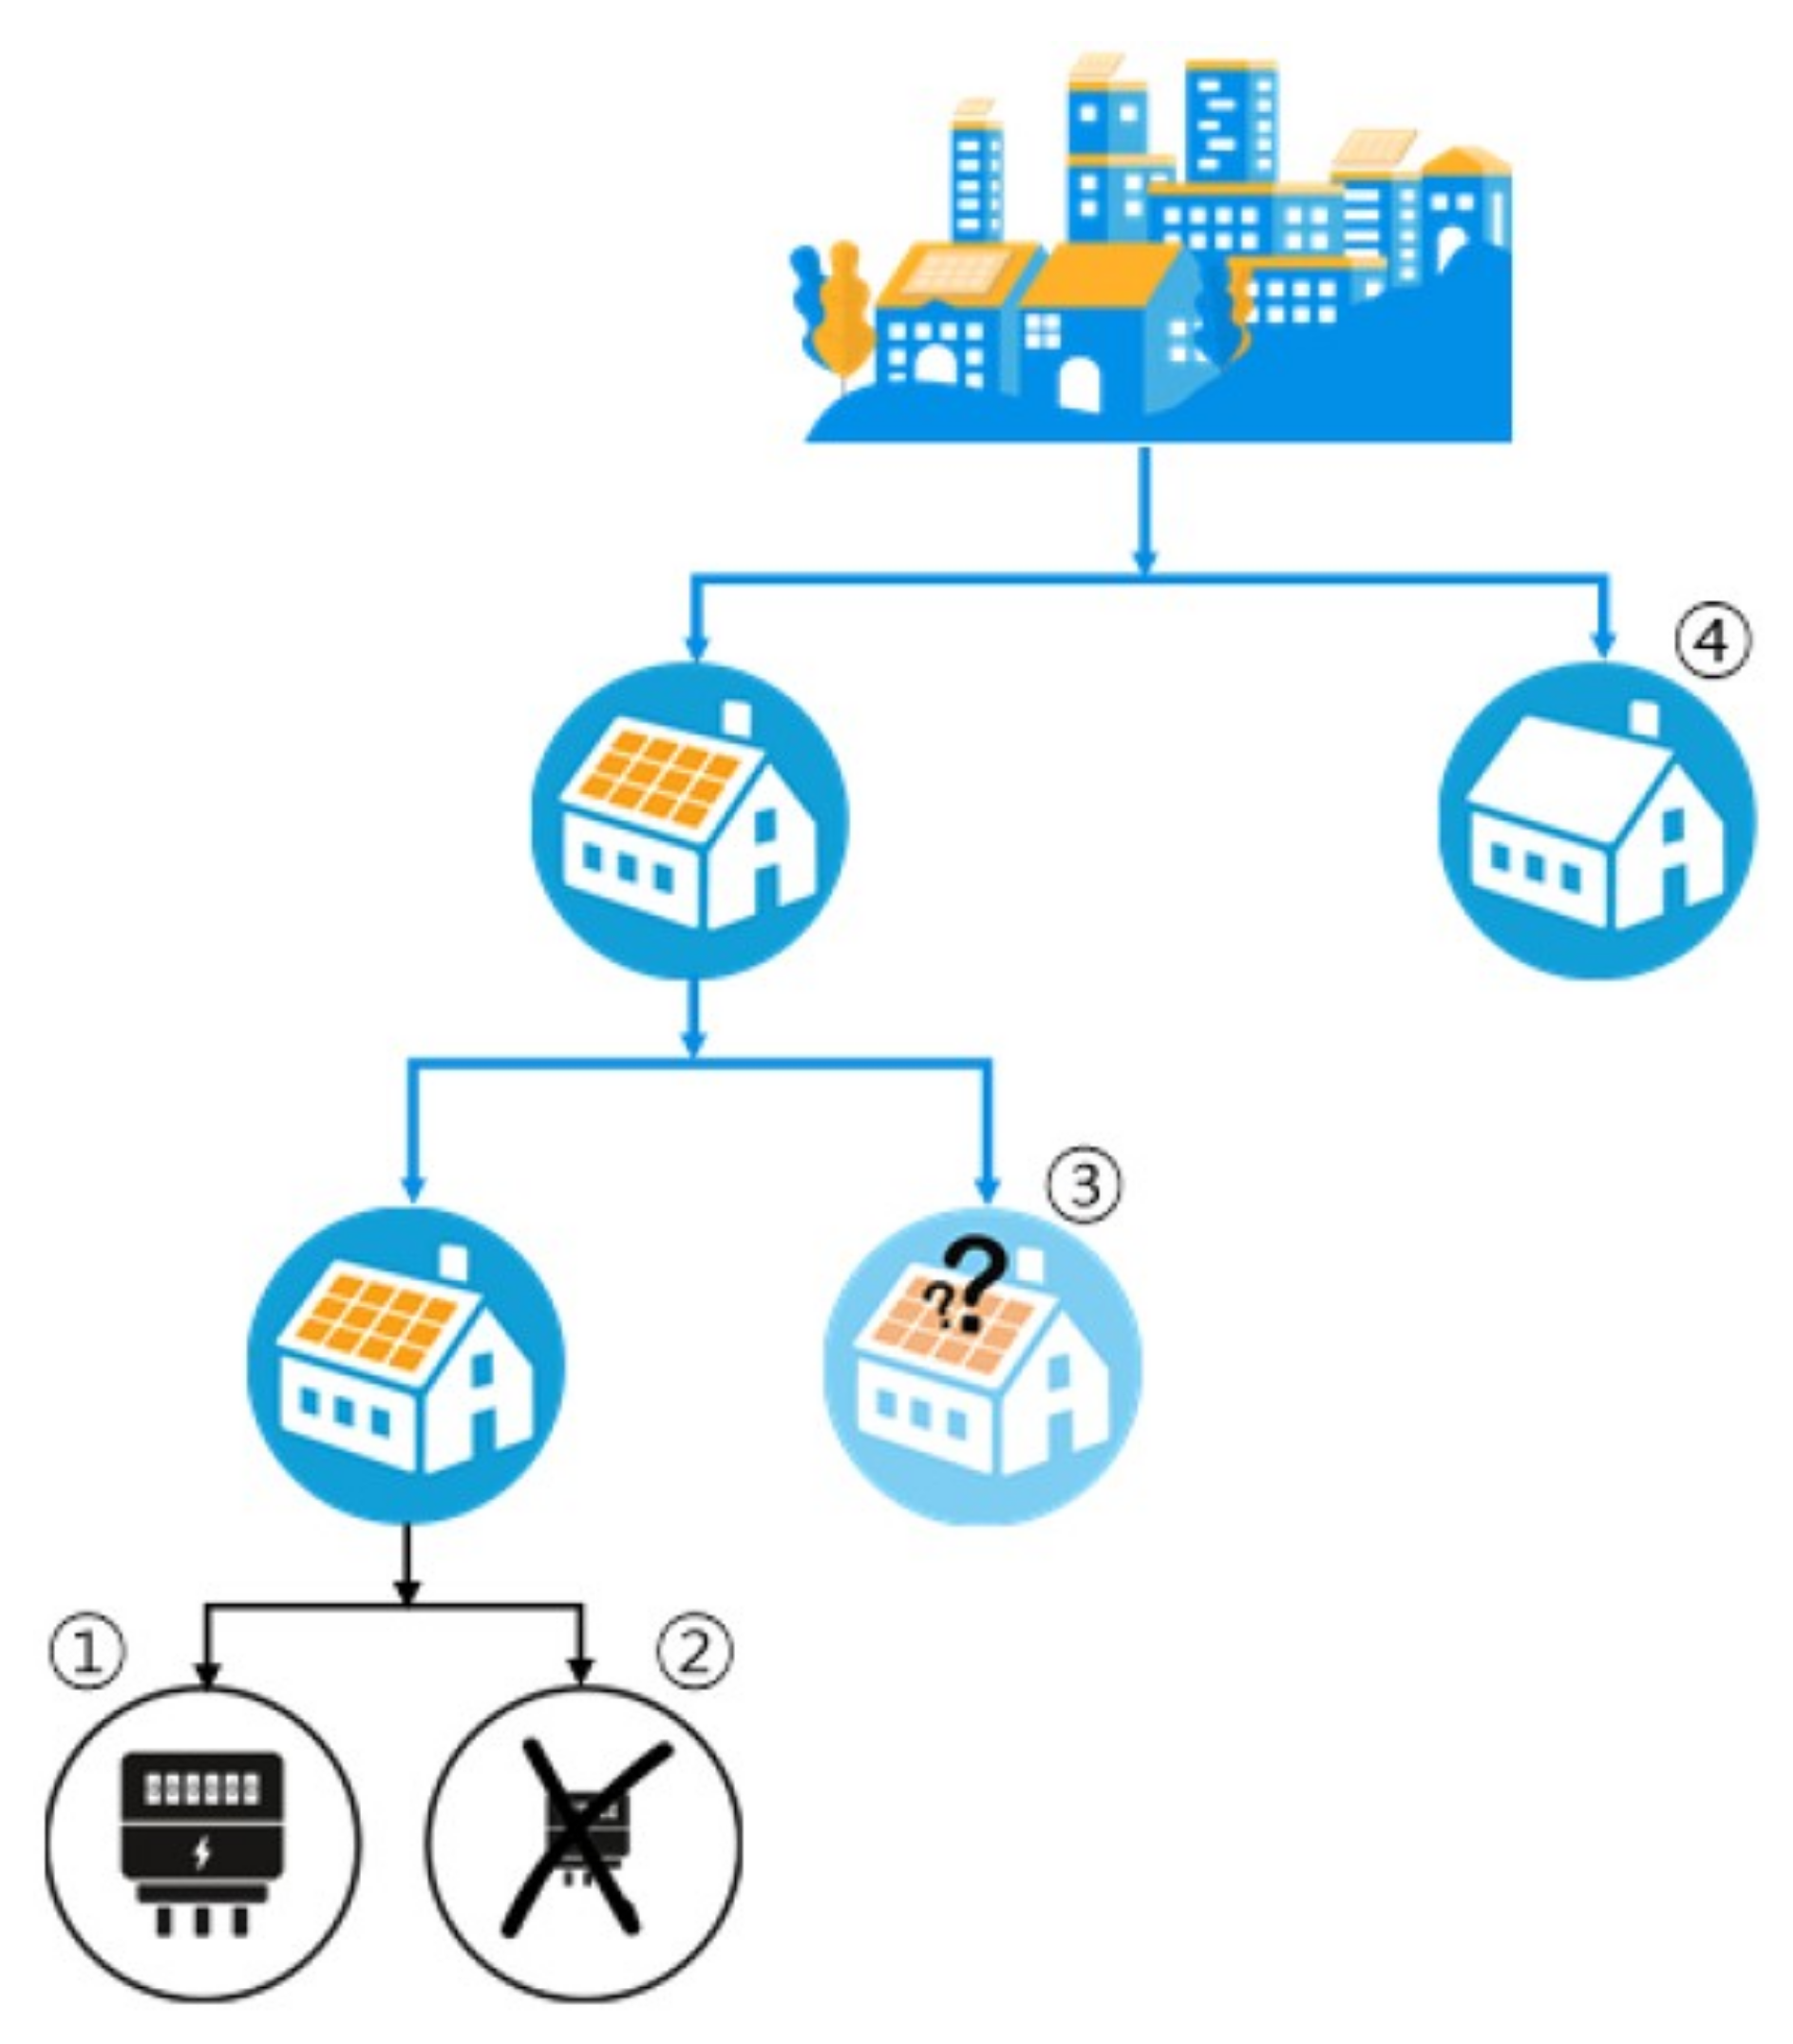
where NL(d, t), GL(d, t) and (d, t) are the net load (NL) power, gross load (GL) power and PV generation power on day d at time slot t. If a home has not installed rooftop PV, the PV generation power value is 0, i.e., PPV (d, t) = 0 ∀ d ∈ D, ∀ t ∈ T. For rooftop PV, the PV output power is BTM except at representative solar sites, implying that most rooftop PV power is not measured and collected. The home classification according to rooftop PV installation, rooftop PV authorization, and sub meter of PV power installation is shown in Figure 1 and Table 2.
NL(d, t) = GL(d, t) − PPV (d, t)
In Figure 1, , , , and denote home group 1, home group 2, home group 3, and home group 4. Also, H1, H2, H3, and H4 in Table 2 are same meanings. Representative solar sites are installed at homes in H1, and utility has information for rooftop PV systems installed at authorized homes (H1 and H2 in Table 2), including location, capacity, and installation date of the rooftop PV systems. However, the utility does not know which homes are without rooftop PV or have unauthorized rooftop PV. Finally, the PV output forecasting discussed in this study is hourly day-ahead forecasting. Therefore, the time interval measured is one hour.
The parameters required in the problem situation are defined as follows. denotes the number of home in entire region. It is equals to the sum of the number of home in H1, H2, H3 and H4 in Table 2. denotes the number of home with installed PV. is the sum of the number of homes in H1, H2 and H3 in Table 2. represents the ratio of the number of authorized PV homes among the home PVs installed. represents the ratio of the number of homes where PV generation data is measured and among the homes with installed authorized PV. In Figure 1, when the number of homes in H1, H2, H3 and H4 groups are , , , , respectively, , can be expressed as the following equations.
2.2. Framework of the Proposed Approach
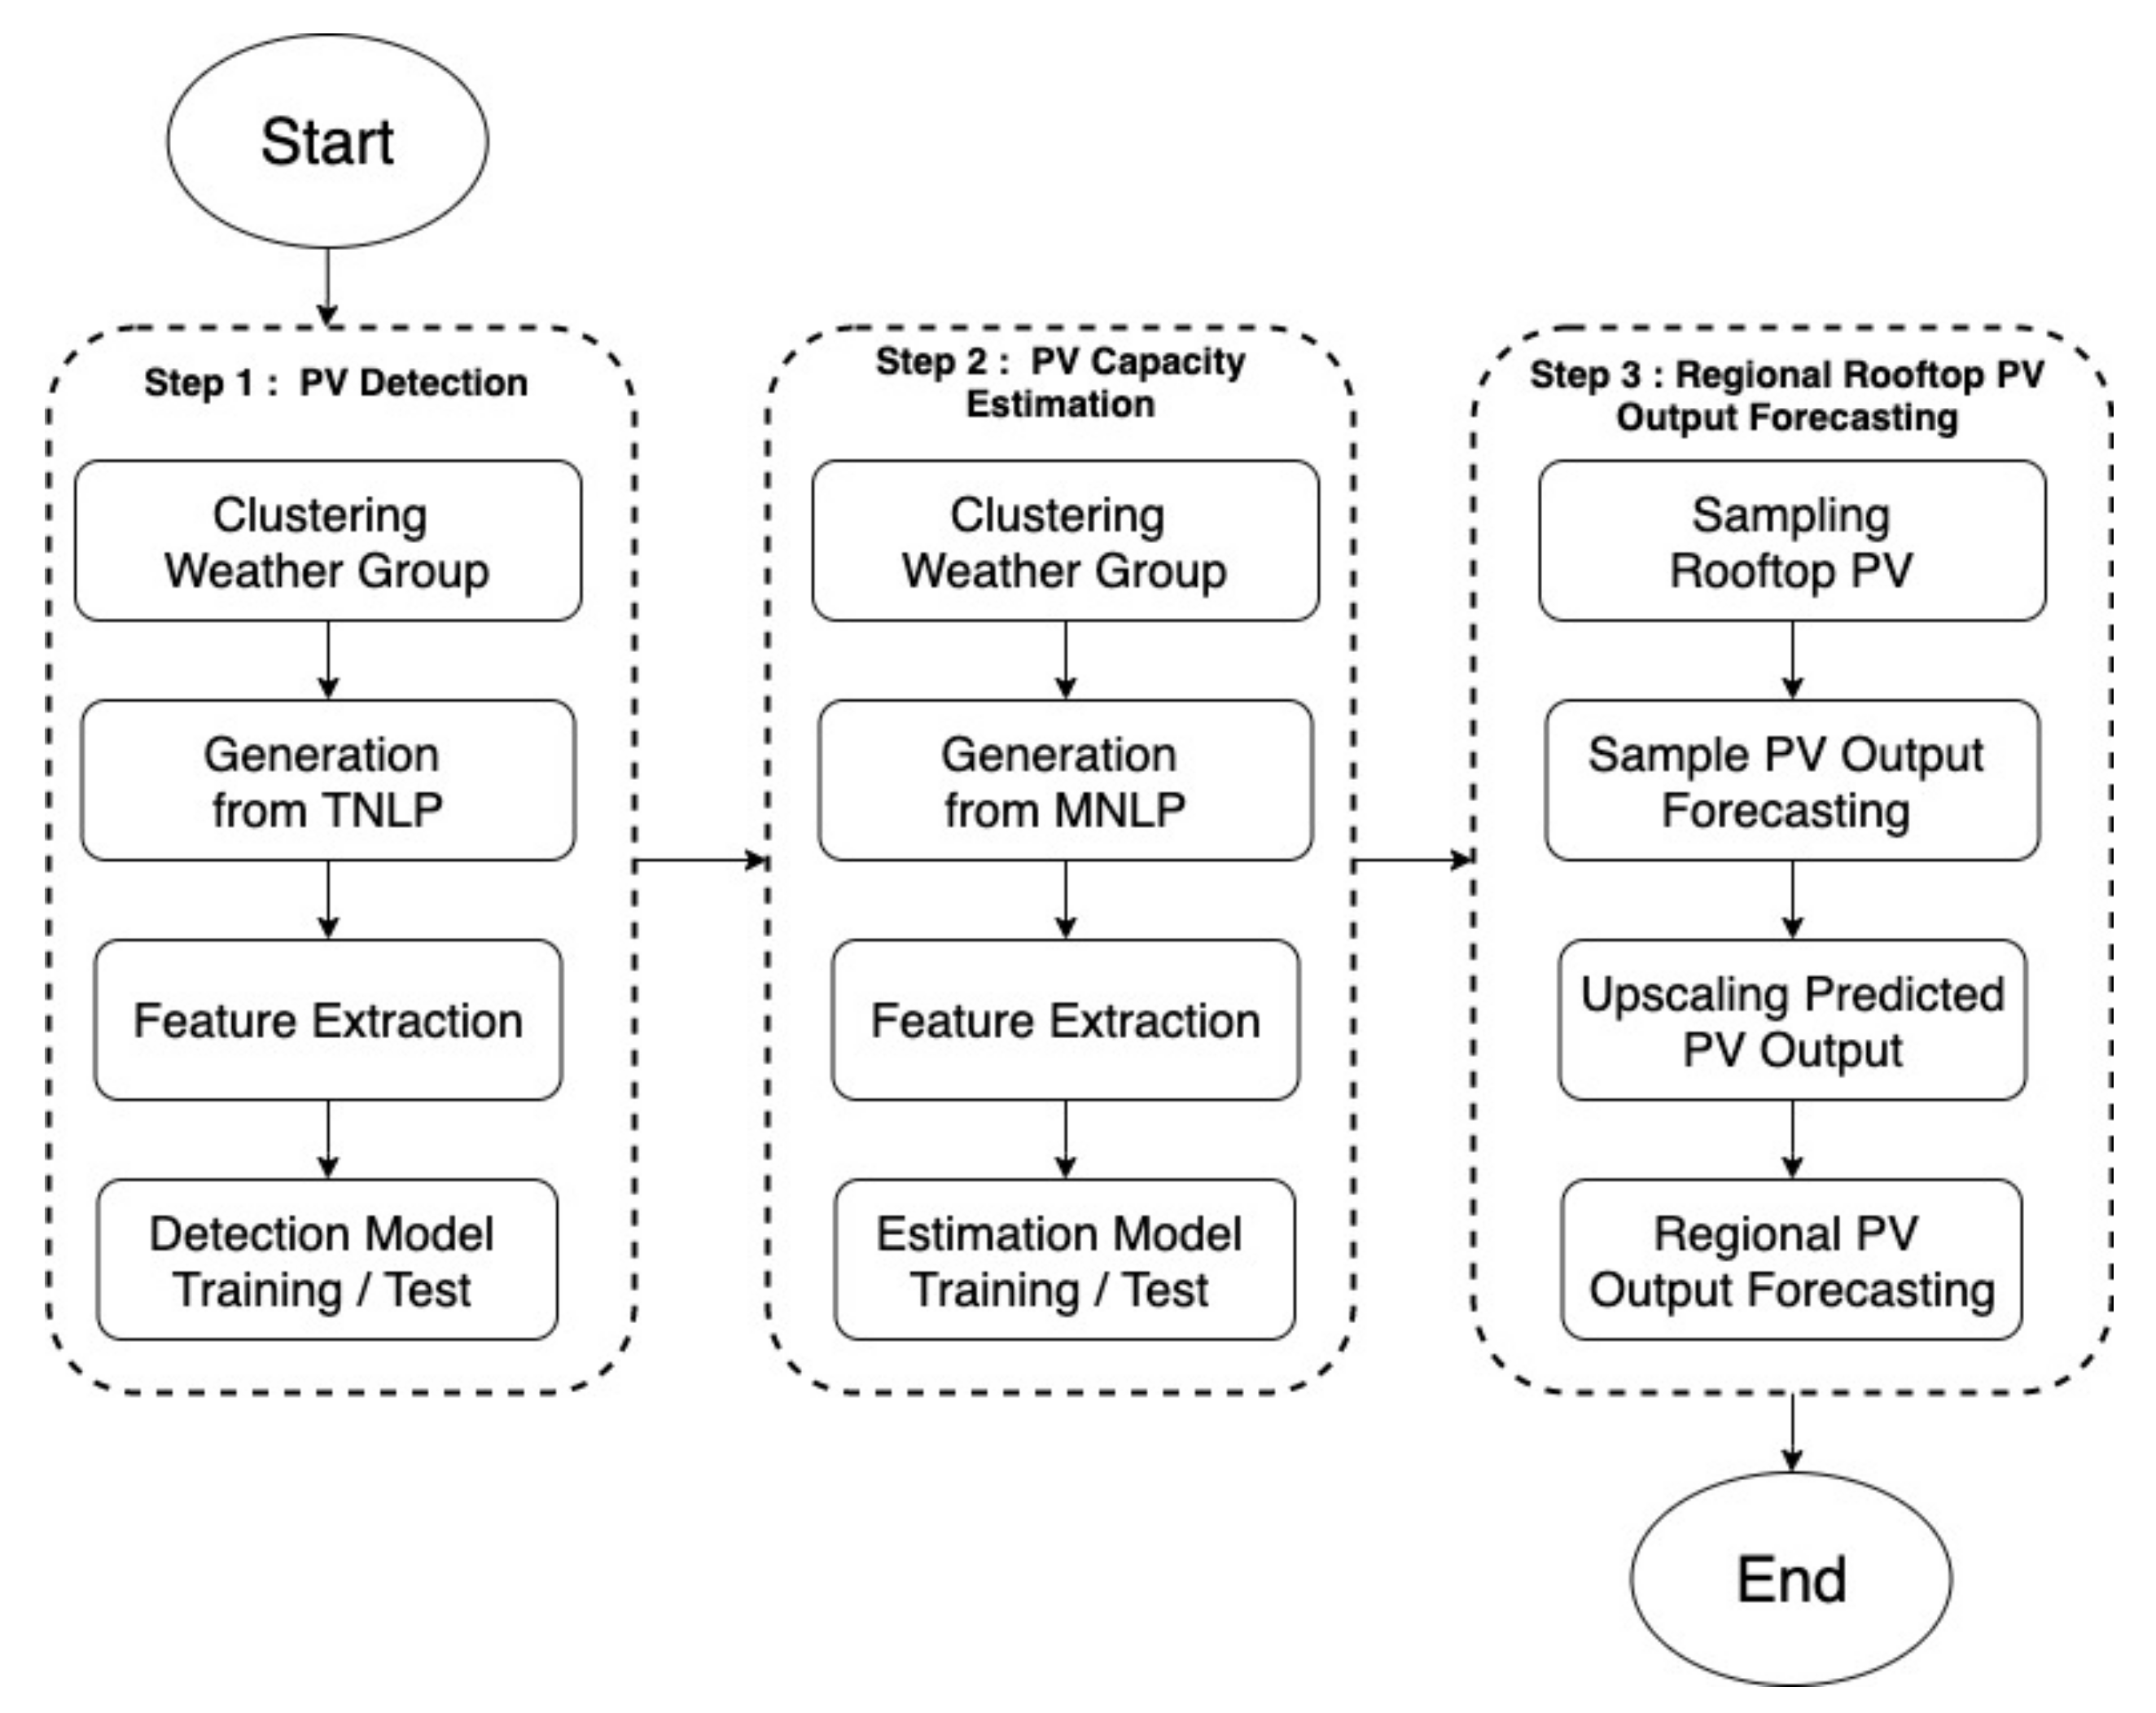
The framework of the proposed approach is shown in Figure 2. The proposed approach consists of three steps: unauthorized PV detection, unauthorized PV capacity estimation, and regional rooftop PV output forecasting.
Unauthorized PV detection is a process judging whether an unauthorized home belongs to group H3 or H4 in Figure 1. Unauthorized PV capacity estimation is a process to determine rooftop PV capacity of group H3 using data from groups H1 and H2 in Figure 1. Regional rooftop PV forecasting is a process to predict regional aggregated PV generation by scaling up PV generation of representative solar sites.
3. Proposed Methodology of Regional Rooftop PV Generation Forecasting
3.1. Unauthorized PV Detection Model
In this section, the details of processes consisting of the unauthorized PV detection model are handled. This model investigates whether PV is installed or not through net load data for unauthorized PV homes.
3.1.1. Four Weather Groups Clustering
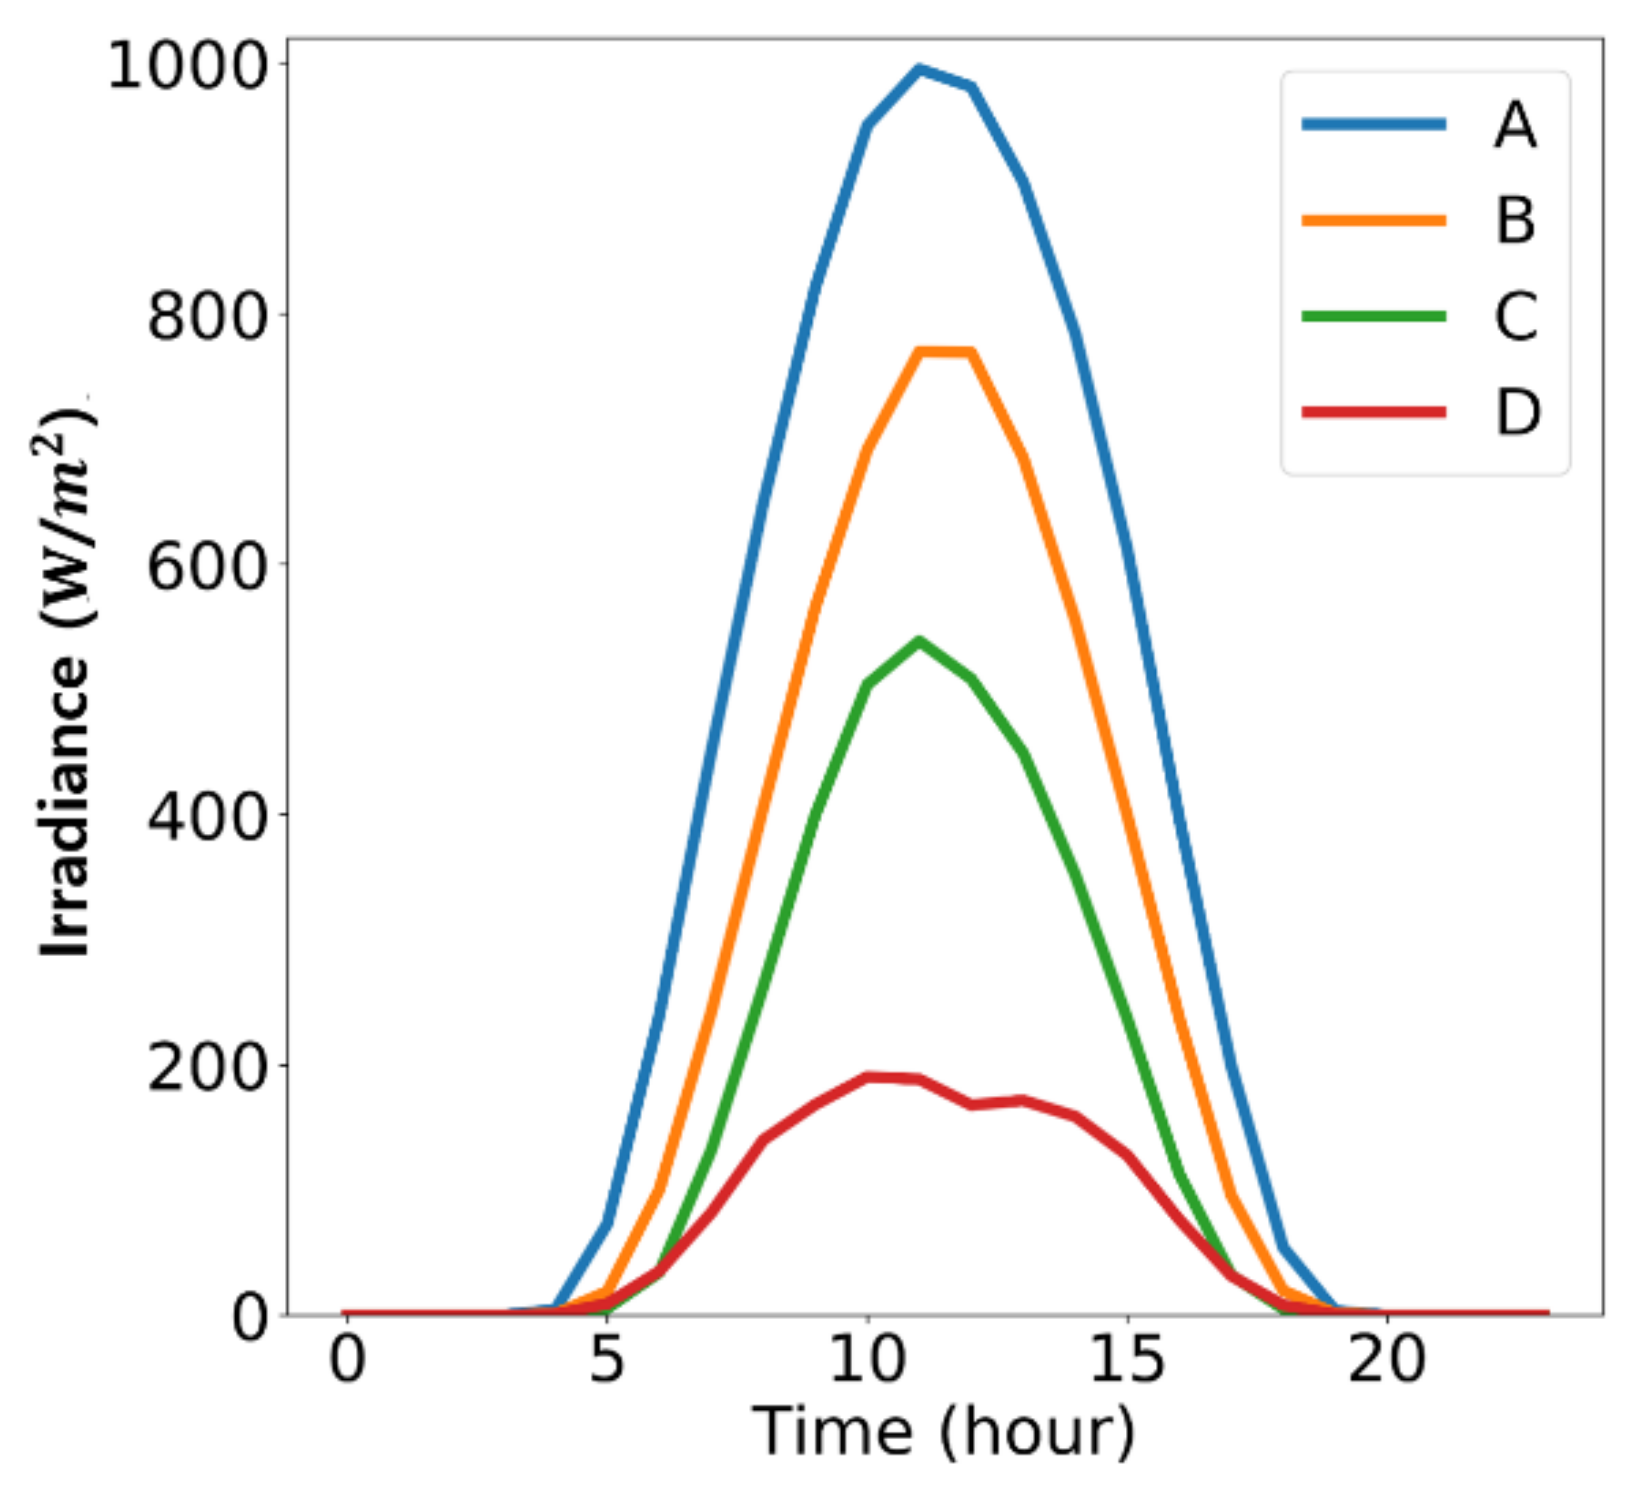
In this process, days are grouped by four weather groups (WG), denoted as A, B, C and D [35], representing sunny, cloudy, shower, and rainy days. In [35], WG is grouped by rooftop PV generation data. However, rooftop PV data cannot be obtained except for representative solar sites according to the assumptions in Section 2.1. Instead, solar irradiance data for a day is used to classify into WG. Using K-means clustering, WG is grouped by A–D. The average solar irradiance of each WG is shown in Figure 3. In Figure 3, A–D have same meaning in [35].
3.1.2. Generation Real and Virtual Typical Net Load Pattern and Minimum Net Load Pattern
To determine out PV or energy storage, the net load variation by meteorological factors must be confirmed. The typical net load pattern (TNLP) is created by averaging the net load of one home in the same WG. Formulation of TNLP is shown in [35]. Next, a virtual TNLP must be generated. In [35], all actual home load data are estimated through rooftop PV generation and NL data. They are used to train load data of homes without rooftop PV. In reality, however, most rooftop PV systems cannot be accounted for by PV generation data due to the BTM features. Additionally, the number of authorized homes is much lower than the number of unauthorized homes. To solve these problems, the method creates a virtual net load based on the bootstrap of actual load of representative solar sites where PV generation data can be obtained and then applied in the unauthorized PV detection process. The difference of A and D is used to detect unauthorized PV in this study. Thus, a virtual TNLP of A and D is created through real TNLP of A and D. Typical PV power (TPP) is defined as average PV power in a certain WG. Sam is the index of representative solar sites whose real-time PV generation is measured. N and indicate the number of virtual TNLP and PV included or not. The first step in Algorithm 1 is to extract the typical load pattern (TLP) from TNLP and TPP of representative solar sites. Next, the TLP is normalized to its maximum value. In the third step, a normalized TLP is chosen randomly from 0 to 23 h.
Subsequently, the normalized selected TLP is scaled up to the original size by the maximum TLP. If TNLP with rooftop PV is required, additional processes are needed. Similar to creating a virtual TLP, TPP is initially normalized by representative solar site capacity. Then, a random PV capacity from 1 kW to 10 kW, which covers the rooftop PV capacity range is applied. The virtual TPP is created by multiplying random PV capacity and normalized TPP. The virtual TNLP with rooftop PV is generated by subtracting virtual TLP and virtual TPP. The generation process of virtual net load is summarized as Algorithm 1. The minimum net load pattern (MNLP) means the smallest value for each time period among clustered net load values.
| Algorithm 1. Generation virtual TNLP |
| Input: , , Output: if then (t), (t) else (t), (t) End fordo ; for t = 0:23 do randomly select r (t) = (t); (t) = (t); End if then |
| randomly select PV capacity Else break; End End |
3.1.3. Feature Extraction Based on TNLP and MNLP
In this section, features are extracted from TNLP and MNLP to train the unauthorized PV detection model. In this study, six features are used to train the detection model. Six detection features are expressed following Equations (5)–(10).
In Equation (4), and is the start time and end time of the PV output. Additionally, is the time when TNLP is at the minimum. The specific values of these times are provided in Section 4.1. and indicate each concavity of TNLP of A and D. In Equation (5), shows the ratio of the summation of TNLP of A and D. If unauthorized PV is installed at home, is greater than one. In the opposite case, the value of is close to one. describes the concaveness of TNLP of A. Using the mathematical definition in (6), is calculated as the number of hours of solar power generation that satisfy the representative concave TNLP of A. The range of is from 0 to 1, and a value of close to 1 means the concaveness of TNLP of A. in (7) means relative concavity of TNLP of A to D [35]. It is fundamental to detect unauthorized PV by utilizing the fact that the TNLP of A is more concave than that of D. However, it is limited in its ability to detect unauthorized PV. This is because has a large value when the concavity of the TNLP of A is large, but has a large value even when the value of TNLP of D is small. Thus, means that concavity of TNLP of A is required as a feature in Equation (9). indicates the ratio of increase of TNLP of A and D between and . , final time, is the time when the PV generation becomes zero after the sun has completely set. If unauthorized PV is installed, becomes greater than 1 as the net load decreased due to solar output increases. In the opposite case, has a value close to 1.
Finally, in Equation (10) is the minimum value of TNLP when WG is A. Without a rooftop PV, is positive; however, is changed to zero or a negative value. This is because the peak of PV generation is during the daytime, while the peak of residential electricity load occurs later in the evening. Thus, is available to be used as a feature of unauthorized PV detection.
3.1.4. Training and Test of Unauthorized PV Detection Model
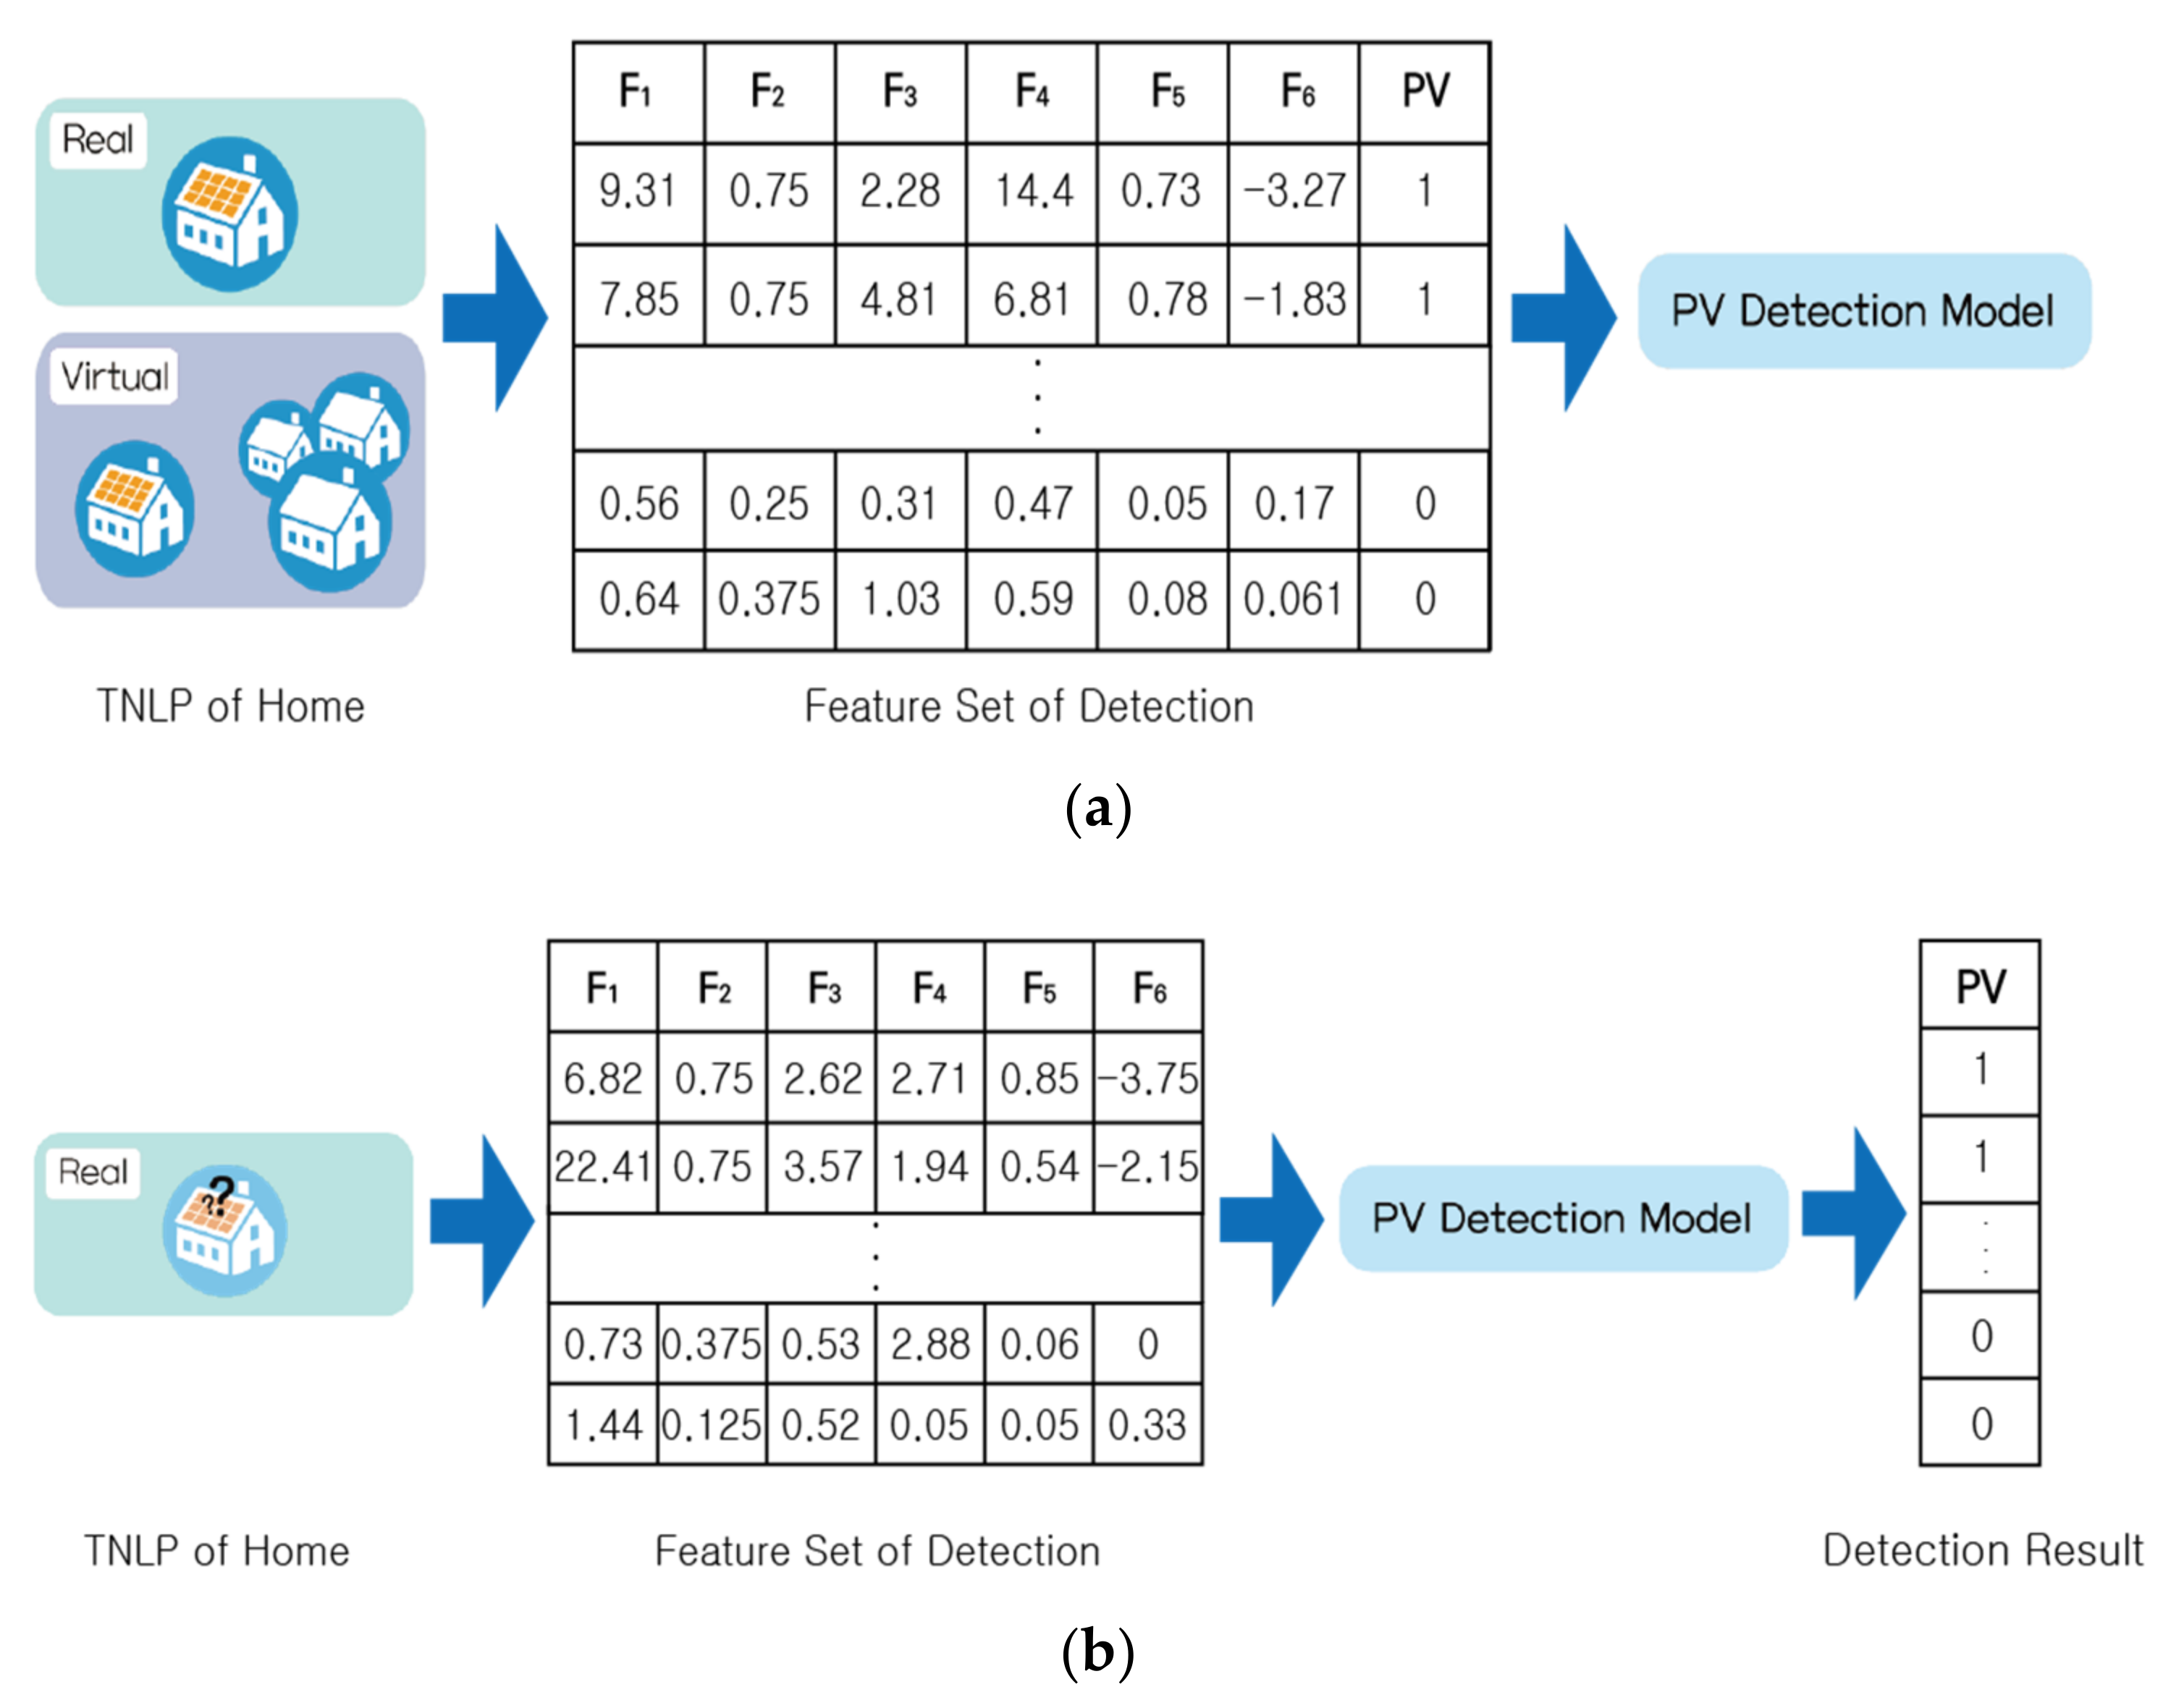
Processes of training and test for unauthorized PV detection are shown in Figure 4. Figure 4a shows the process that extracts features from TNLP of home and train the detection model with features. Both real and virtual TNLP are used to train the detection model. A multi-layer perceptron (MLP) is used as the detection model. Figure 4b shows the process to test the detection model with test features. Additionally, PV columns in the table in Figure 4 indicate PV installation status.
3.2. Unauthorized PV Capacity Estimation Model
In this section, the process to estimate the detected rooftop PV capacity of the model described in Section 3.1 is shown. This model is designed to determine how much unauthorized PV capacity is using net load data of homes.
3.2.1. Generation Virtual Net Load
The algorithm for generation of virtual NLP is similar to the method described in Section 3.1.2. However, the difference in the method described in Section 3.1.2 is the considered distribution of PV capacity, which is not uniform. In [41], the distribution of PV capacity is shown in Figure 5. There are many PVs with capacities of 1 kW to 2 kW, while very few PVs with a capacity of 3 kW or more are shown in Figure 5. This indicates that the training case with large PV capacity is difficult. Therefore, generating virtual data for the case with large PV capacity is needed. Generation details of the virtual MNLP algorithm are expressed in Algorithm 2. In Algorithm 2, GL of homes with installed representative solar sites is made by summing NL of homes with installed representative solar sites and PV power of representative solar sites. Next, PV capacity sections are divided by authorized PV capacity. Then, the distribution of the number of PVs in each PV capacity section is investigated. Here, additional NL data are required for each PV capacity section to make PV capacity distribution uniform by subtracting the number of PVs per PV capacity section from the maximum value. The average amount of representative solar site generation is determined by WG and then normalized to each representative solar site capacity. Subsequently, the PV capacity and one GL among home installed representative solar sites is randomly selected by the first PV capacity section. The virtual NL is generated by subtracting the PV capacity multiplied by normalized PV power generation from the GL of randomly selected homes. This process is repeated for each weather group.
| Algorithm 2. Generation virtual NL |
| Input: = [], , Output: Initialize for do for i = 1: do for j = 1:10 do if then else Continue; end end end for do end for do for do Select randomly PV capacity [1+(l−1)/10,1+l/10] Select randomly for WG = A:D do end end end |
3.2.2. Extracting Minimum Net Load Pattern (MNLP) for Four Weather Classes
After generating virtual NL, MNLP in WG A and D are extracted to create features of capacity estimation. MNLPA (t) and MNLPD (t) each denote MNLP in A and D of WG. They are shown in Equations (11) and (12). DA and DD in Equations (11) and (12) denote the set of days when the WG is A and the set of days when the WG is D, where d is the day index.
3.2.3. Extracting Features from MNLP
In unauthorized PV capacity estimation models, three features, , , and are used [35]. These features are expressed in Equations (13)–(15).
In [35], denotes minimum of MNLPA (t). It varies by PV output and GL values. If PV output is maximum or GL is minimum, it has negative values of significantly larger magnitude. It is available to estimate PV capacity using The second feature denotes difference of MNLPA (t) and MNLPD (t) during a day. So, is originally the sum of the difference of MNLPA (t) and MNLPD (t) for intermediate start time and end time of PV generation. However, it is difficult to recognize PV capacity when the PV capacity is small. Therefore, the sum of difference between MNLPA (t) and MNLPD (t) for intermediate start time and end time of PV generation is chosen as the third feature. In the testing process, the MNLP of a test home is used to extract three features and unauthorized PV capacity is estimated through three features.
3.2.4. Training and Test PV Capacity Estimation Model
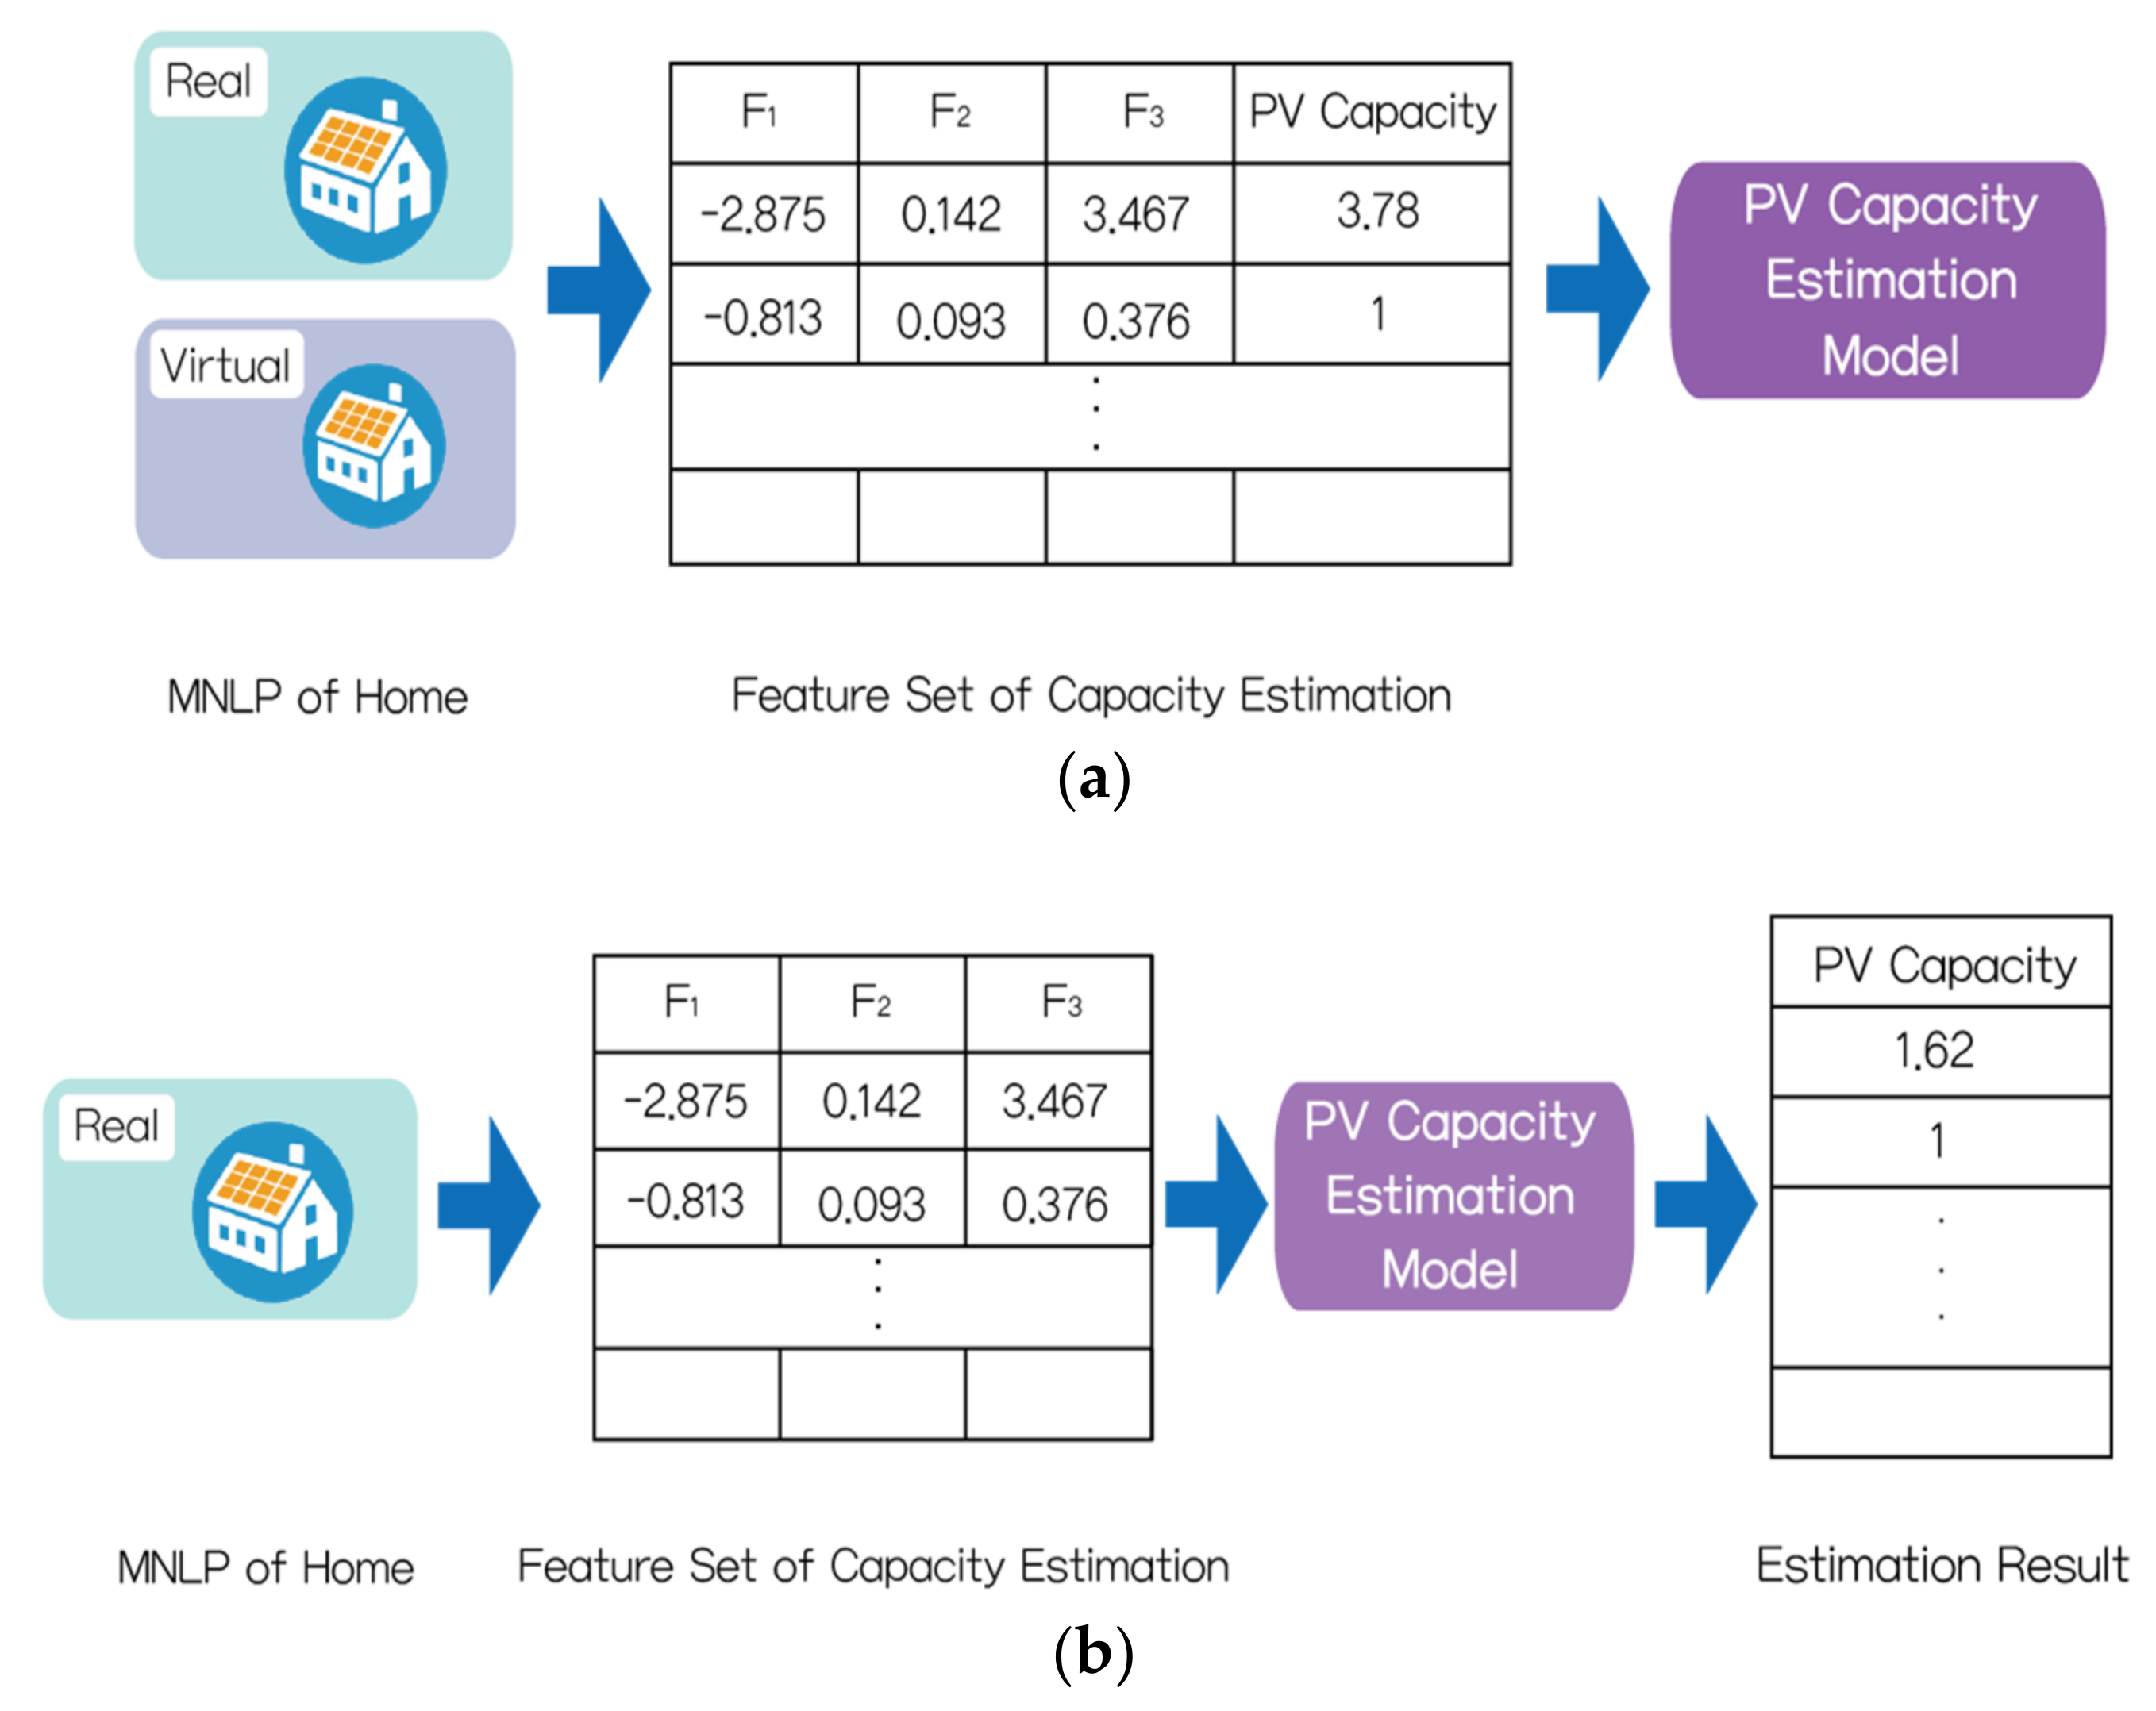
The overall process of capacity estimation is shown in Figure 6. MNLP is extracted from real and virtual from NL. Support vector regression (SVR) is used as a machine learning method of unauthorized PV capacity estimation model. Unauthorized PV capacity estimation model is trained with three features and authorized PV capacity. Hyper parameter optimization based on grid search is performed. Three features by MNLP are used to train the capacity estimation model.
3.3. Regional PV Forecasting Model
After unauthorized PV capacity is estimated, regional rooftop PV generation is predicted through upscaling method. In Section 3.3.1, representative solar sites (sample of rooftop PV) are determined by cluster (sub region). Then, the PV generation forecasting model of representative solar sites is trained and PV generation for the next day at representative solar sites is predicted. In Section 3.3.3, the predicted PV power is scaled up by the upscaling factor and aggregated for clustering. Finally, PV generation for the entire region is predicted by aggregating PV generation for clusters.
3.3.1. Clustering and Sampling of Rooftop PV
In this section, home-installed rooftop PVs are grouped by their location. To use the upscaling method, PV generation in regions must be similar. PV generation is affected by meteorological factors. The closer the distance between the two points, the more likely the weather conditions at the two points are similar. Thus, upscaling must be carried out between geographically close PVs. In this study, K-means clustering [42] is used as the clustering method for rooftop PV. Clustering of rooftop PV is expressed in Algorithm 3. The first step is to initialize the k-cluster center randomly. Next, location information of the rooftop is assigned to a k-cluster by the distance between the center and data. Rooftop PV is assigned to the cluster closest to the distance. Subsequently, the average data value is assigned as the new cluster center. If the cluster center is not changed, rooftop PV clustering is finished. Otherwise, calculation of the cluster center is iterated until it converges to a certain value. Then, representative solar sites are chosen for each cluster. For utility scale PV, there is no limit to the choice of representative solar sites because PV generation is measured. While rooftop PV generation is not measured due to the BTM feature, rooftop PV with sub meters installed to measured PV generation must be chosen. If there is no rooftop PV with a sub meter installed, some PV system must be installed with a sub meter. As rooftop PV systems with sub meters are selected as representative solar sites, the process of Section 3.3.1 is completed.
| Algorithm 3. Clustering of rooftop PV |
| Input: The number of cluster k Maximum number of iteration I Output: for all n PV k center of cluster C Randomly initialize C = for do // Assignment step for n = 1:N do end // Update step for do end end |
3.3.2. Individual Rooftop PV Generation Forecasting
In this section, individual rooftop PV generation of representative solar sites is predicted. First, feature normalization must occur. Normalization of features is shown in Equation (16).
In Equation (16), Factual, FMax, FMin and FNorm denote original feature, maximum of feature, minimum of feature, and normalized feature. Next, the individual rooftop PV generation model is constructed in Equation (17).
PPVind (t) is the predicted PV generation at time t; time resolution is one hour as described in Section 2.1. denote normalized one day ahead PV generation, normalized solar irradiance, normalized cloud cover, normalized precipitation, and normalized temperature. Finally, the test of individual PV generation forecasting is performed through the trained PV generation forecasting model.
3.3.3. Upscaling Sample Rooftop PV Generation by Cluster
In this section, rooftop PV generation in sub regions is predicted by the upscaling method. Sub region PV generation is calculated by scaling up predicted individual PV generation according to Equations (18) and (19).
In Equation (18), Pc,ind(t) denotes predicted individual generation ind th for the representative solar site at time t in cluster c. Nrep denotes the number of representative solar sites. ufc denotes upscaling factor of cluster c that corresponds to the scaled up coefficient of individual power generation. The PV generation of a cluster (or sub region) is made by multiplying each individual PV generation by the upscaling factor and aggregating them. Equation (19) shows how the upscaling factor is calculated. It is defined as the ratio of total rooftop PV capacity in the cluster to the sum of representative solar sites capacity.
3.3.4. Aggregating PV Generation of a Cluster
The PV generation for entire region is finally predicted by aggregating the predicted PV generation amount of a cluster (or sub region). It is shown in Equation (20).
In Equation (20), c denotes index of cluster. And denotes the number of clusters. The others, and denote each predicted PV generation of cluster and entire region.
4. Case Study
4.1. Experimental Data Description
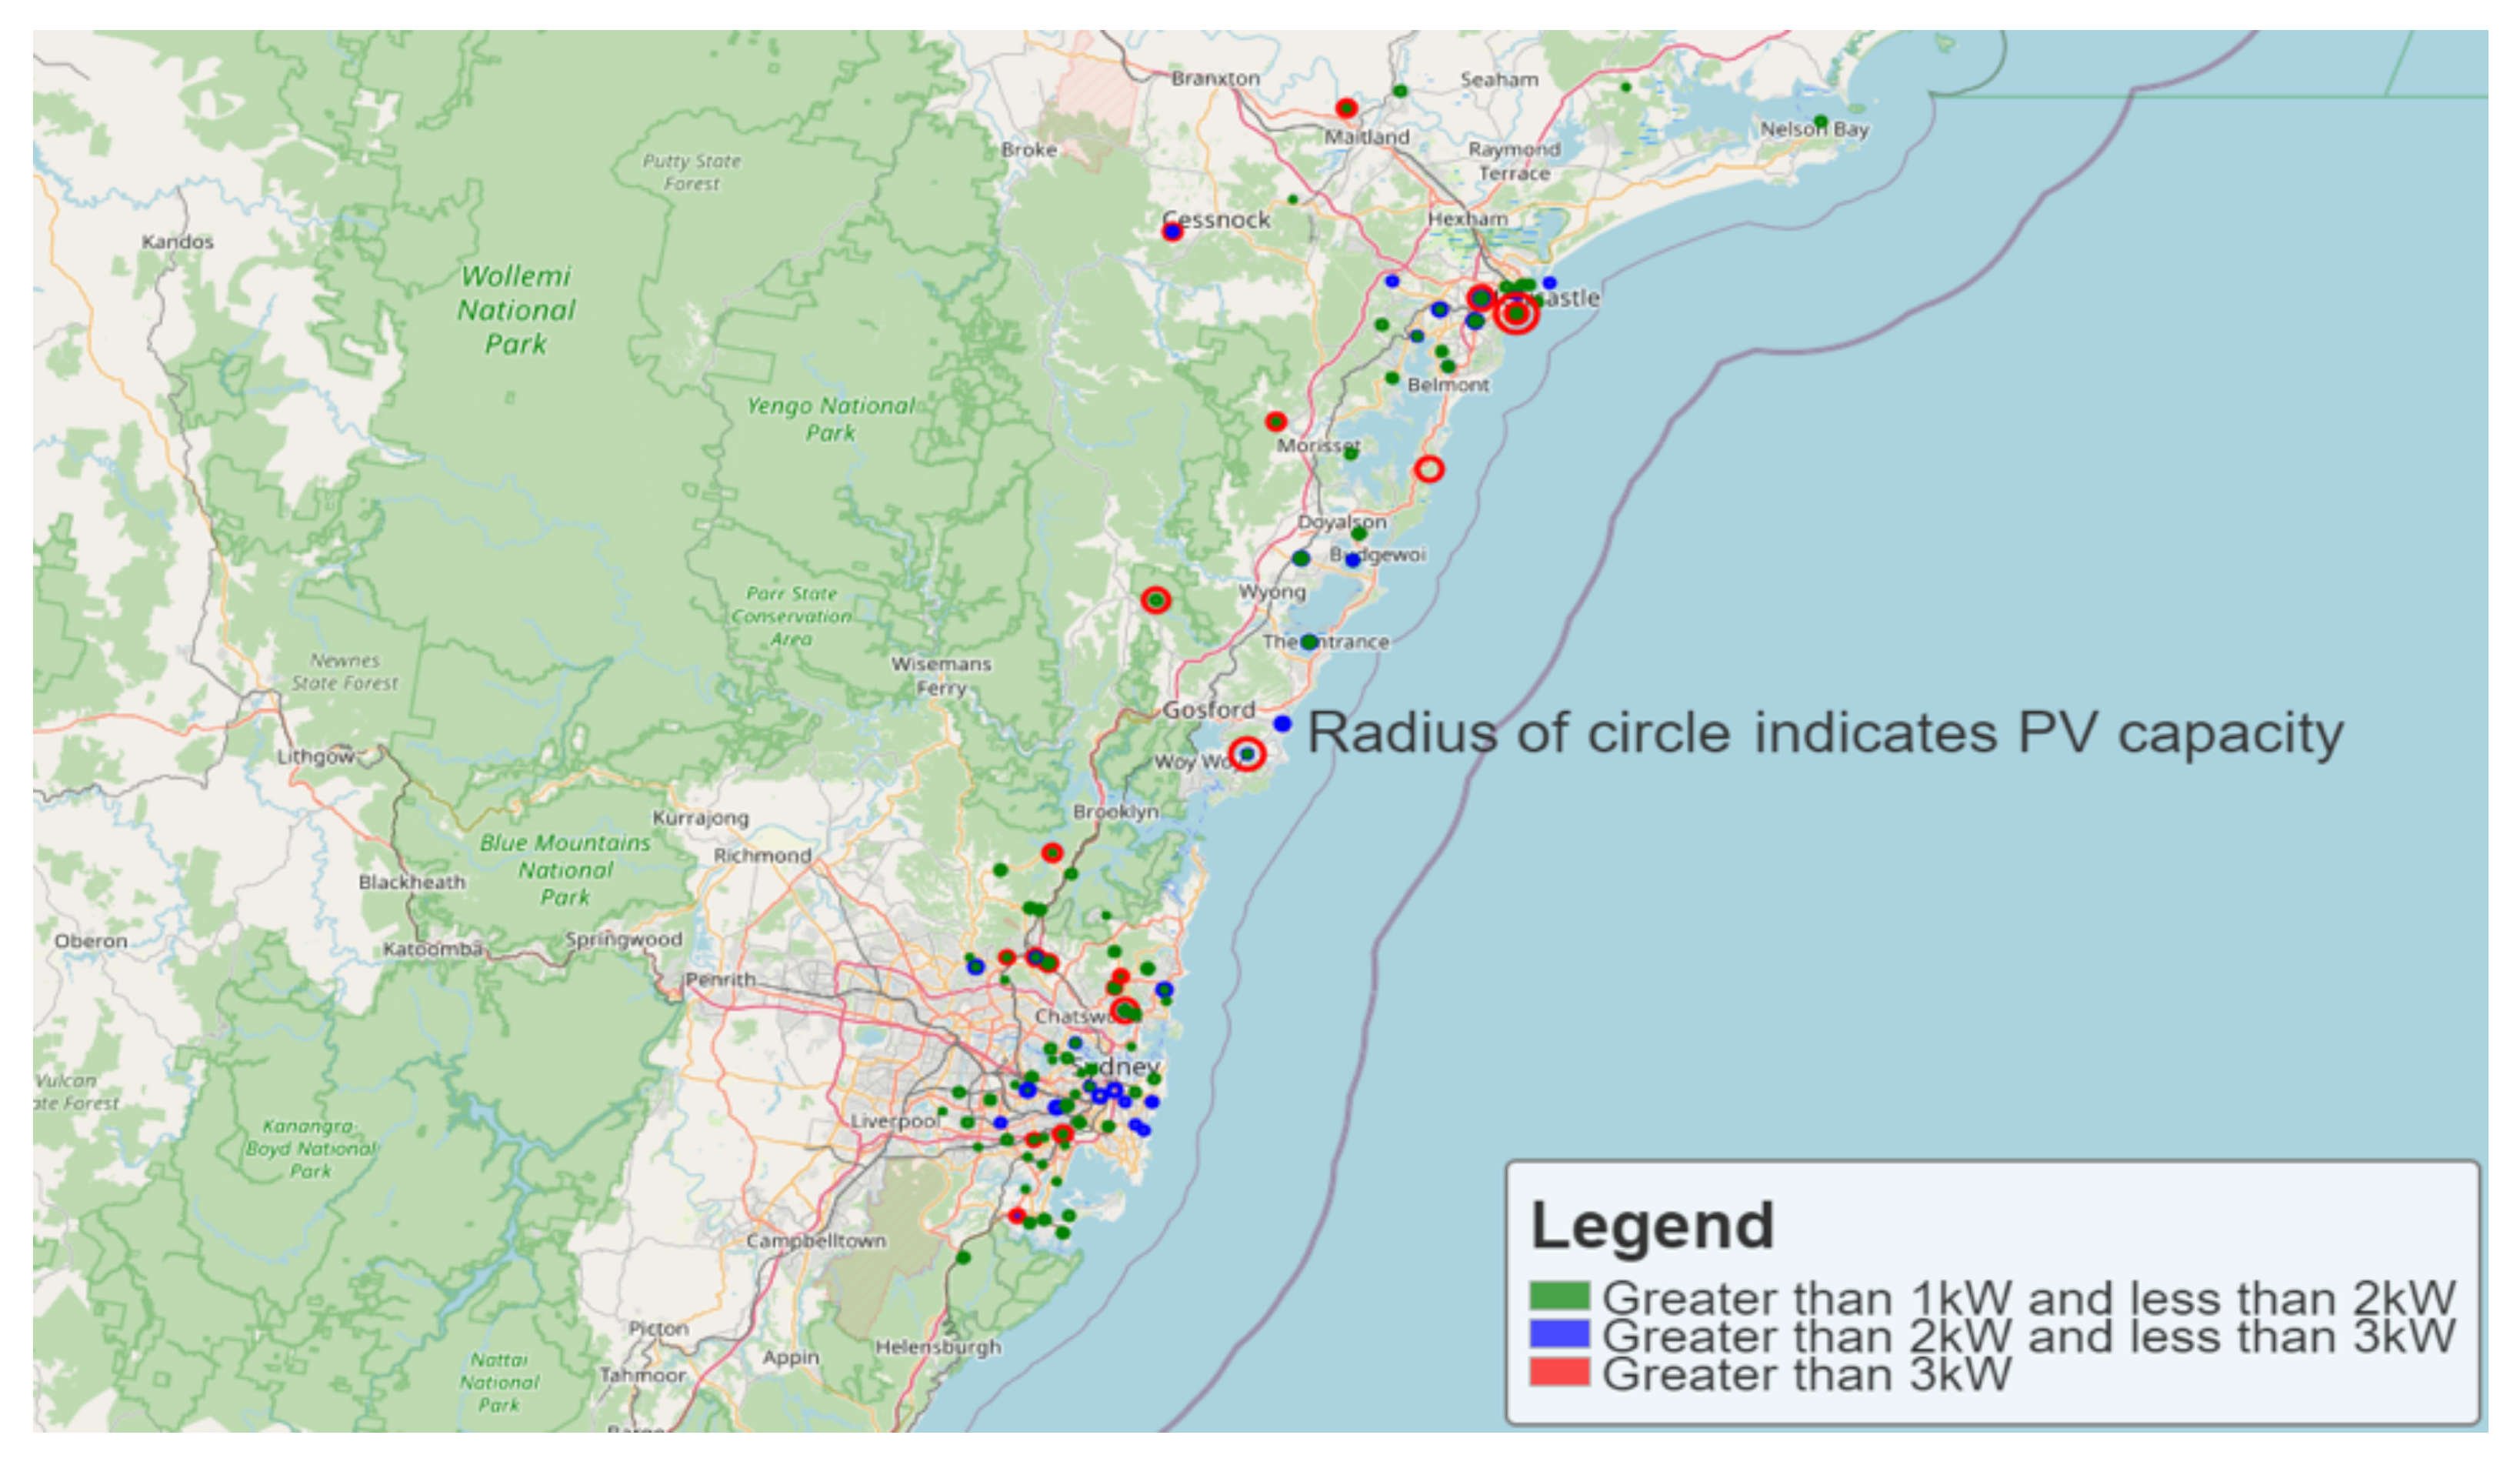
In order to verify performance of the proposed approach, generation data are collected from 300 rooftop PV of Ausgrid that is a power utility in Sydney, Australia. Historical data from 1 July 2010 to 30 June 2013 with the sampling interval of 1 h is chosen in this paper. PV generation and GL data from 1 July 2010 for one year were used for unauthorized PV detection and capacity estimation. PV generation data for two years since 1 July 2011 was used to predict regional rooftop PV generation. The installed capacity of rooftop PV is 504 kW. The geographic distribution of the home with rooftop PV is shown Figure 7.
In Figure 7, color indicates the range of capacity. In other words, green color indicates capacity range of 1 kW to less than 2 kW. Likewise, blue color indicates capacity range of 2 kW to less than 3 kW. Finally, red color indicates capacity range of 3 kW or more. Additionally, the larger the radius of the circle within same color, the larger the rooftop PV capacity. These data can be downloaded in website [41]. In addition to rooftop PV generation data, the weather forecast data are required. In the unauthorized rooftop PV detection and capacity estimation model, solar irradiance hourly data are needed. Solar irradiance forecast hourly data provided by [43] are used. In order to predict PV generation, weather forecast data such as temperature, cloud cover and precipitation are required. Ref. [44] provides hourly various weather forecast data like temperature, humidity, wind speed and cloud cover. Therefore, weather forecast data of [43,44] are used in this paper. In addition to data, parameters mentioned in Section 2.1, Section 3.1 and Section 3.2 are shown in Table 3.
According to [45], the rooftop PV installation penetration rate was approximately 20% in August 2019. Because NPV, the number of given home with rooftop PV was 300, all home in the region were 1500. is 0.5 (i.e., 50%), which means the ratio of home installed unauthorized rooftop PV of all rooftop PV. In other words, 150 homes are authorized and the other 150 homes are unauthorized in the case study. Finally, an important assumption in our work is that the number of systems is constant over 2 years. Because it is difficult to find this by complete enumeration, there are few papers on this. According to [29], identified unauthorized rooftop PV installation rate is about 50% in Cape Town, South Africa. Therefore, unauthorized rooftop PV installation rate is assumed 0.5 (i.e., 50%) based on [29]. , the ratio of the number of home PV generation data is measured and among the home installed authorized PV, is assumed 0.08 (8%). ts and te are assumed to be 9 and 16. This is because the period that PV generation mainly occurs is from 9 to 16.
4.2. Performance Metric
To evaluate the proposed detection, capacity estimation, and regional PV generation forecasting models, several performance metrics are used in this paper.
4.2.1. Unauthorized PV Detection Performance Metric
In this section, three accuracy metrics, PV accuracy (PA), non-PV accuracy (NPA), and overall accuracy (OA) are defined to evaluate unauthorized PV detection model. PA denotes the ratio of accurately classified homes of actual homes with rooftop PV. On the other hand, NPA denotes the ratio of accurately classified homes of actual homes without rooftop PV. OA denotes the ratio of accurately classified homes of all homes in the region. By using a confusion matrix, three metrics can be calculated. Confusion matrix, CM, is defined as Equation (21).
In Equation (16), denotes the number of states can be classified. In unauthorized PV detection, whether rooftop PV installed or not is two cases. In other words, − 1 is 1 because is 2. In terms of index in confusion matrix, zero indicates state rooftop PV is not installed. In contrast, one indicates state rooftop PV installed. The element of denotes the number of objects that actually comprise the state i but can be classified to the state j. The confusion matrix can be used to formulate the three accuracy metrics defined above. These are expressed in Equations (22)–(24).
4.2.2. Unauthorized PV Capacity Estimation Performance Metric
In this section, two accuracy metrics, mean absolute percentage error (MAPE) is defined in Equation (25) in order to evaluate the performance of the unauthorized PV capacity estimation.
In Equation (25), and represent the nth actual and predicted capacity of unauthorized rooftop PV.
4.2.3. Regional PV Generation Forecasting Performance Metric
In previous literature, normalized root mean squared error (nRMSE) and normalized mean absolute error (nMAE) were used as regional PV generation forecasting errors [10,11,12,14,17,21,22,23,24]. Two accuracy indicators are defined in Equations (26) and (27).
In this paper, above two indicators are used to evaluate regional rooftop PV generation forecasting performance.
4.3. Simulation Results
4.3.1. Unauthorized Rooftop PV Detection Results
As mentioned in Section 4.1, the unauthorized PV detection model is tested for 1350 home. It corresponds to the total number of homes excluding 150 homes with authorized PV. They consist of 150 homes with rooftop PV and 1200 homes without rooftop PV. If the predicted result and the actual configuration are the same, it can be said that the performance of the PV detection model is good. Detection simulation procedure is run for 100 rounds. Authorized homes are different each round. The unit of accuracy metric is percentage. The larger the value of the accuracy metric, the better the performance of the detection model. As mentioned in Section 3.1.4, MLP is used as unauthorized PV detection. MLP is a representative machine learning method utilized for classification or prediction, which is chosen to show a good performance in classification problems. The parameters of the MLP used the default parameters. The accuracy of detection is shown in Table 4 and Table 5.
In Table 4, the detection result by the method in [39] is shown. Best in column of Table 4 means best accuracy among 100 rounds. Worst in column means worst accuracy among 100 rounds. Average in column means average value of 100 rounds’ accuracy. The above description also applies to the columns in Table 5. In Table 5, detection result by proposed method in this paper is shown. By adding features used to train detection model, improved performance is identified in Table 5.
4.3.2. Unauthorized Rooftop PV Capacity Estimation Results
In this section, capacity for detected PV is estimated. Two cases of capacity estimation in [35] and in this paper are presented. Capacity estimation simulation is run for 100 rounds. Table 6 shows capacity estimation of [39] and the proposed method. Like Section 4.3.1, The best, worst, and average results in Table 6. By modifying the unauthorized PV detection model, capacity estimation performance is improved.
4.3.3. Regional Rooftop PV Generation Forecasting Results
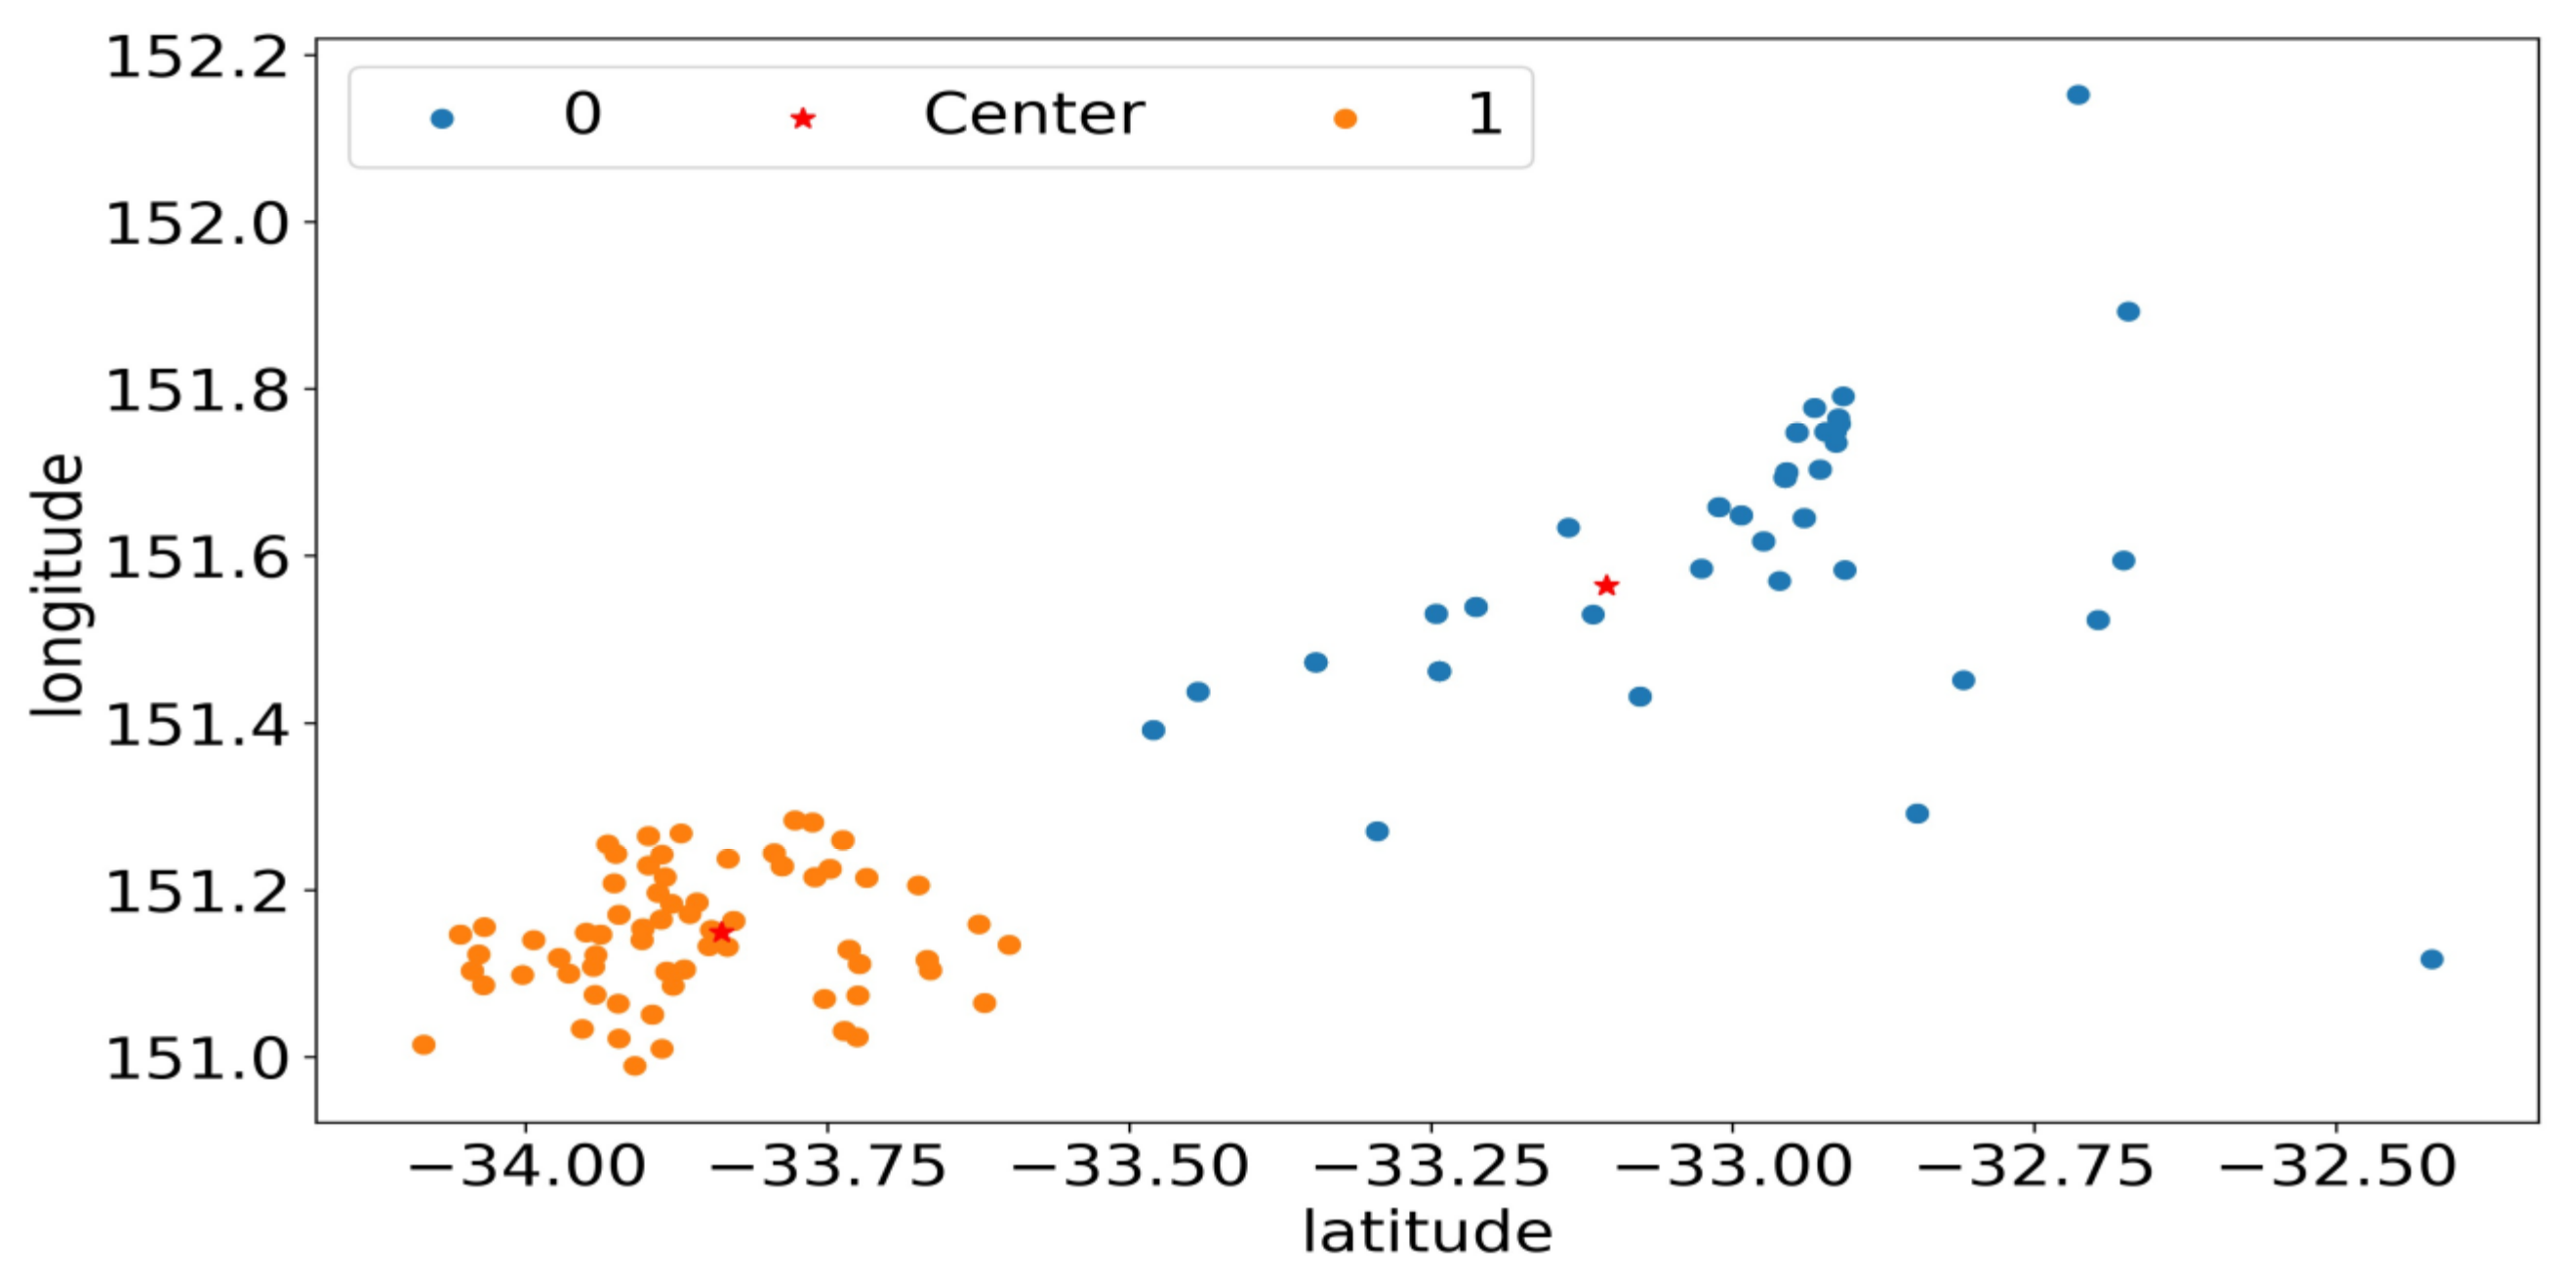
The result of clustering rooftop PV is shown Figure 8. Two is optimal value of the number of clusters in K-means clustering. It was decided by silhouette coefficient [38]. Next, six rooftop PVs are chosen as representative solar sites for each cluster. Then, individual rooftop hourly PV generation for the next day is predicted by the SVR model [16].
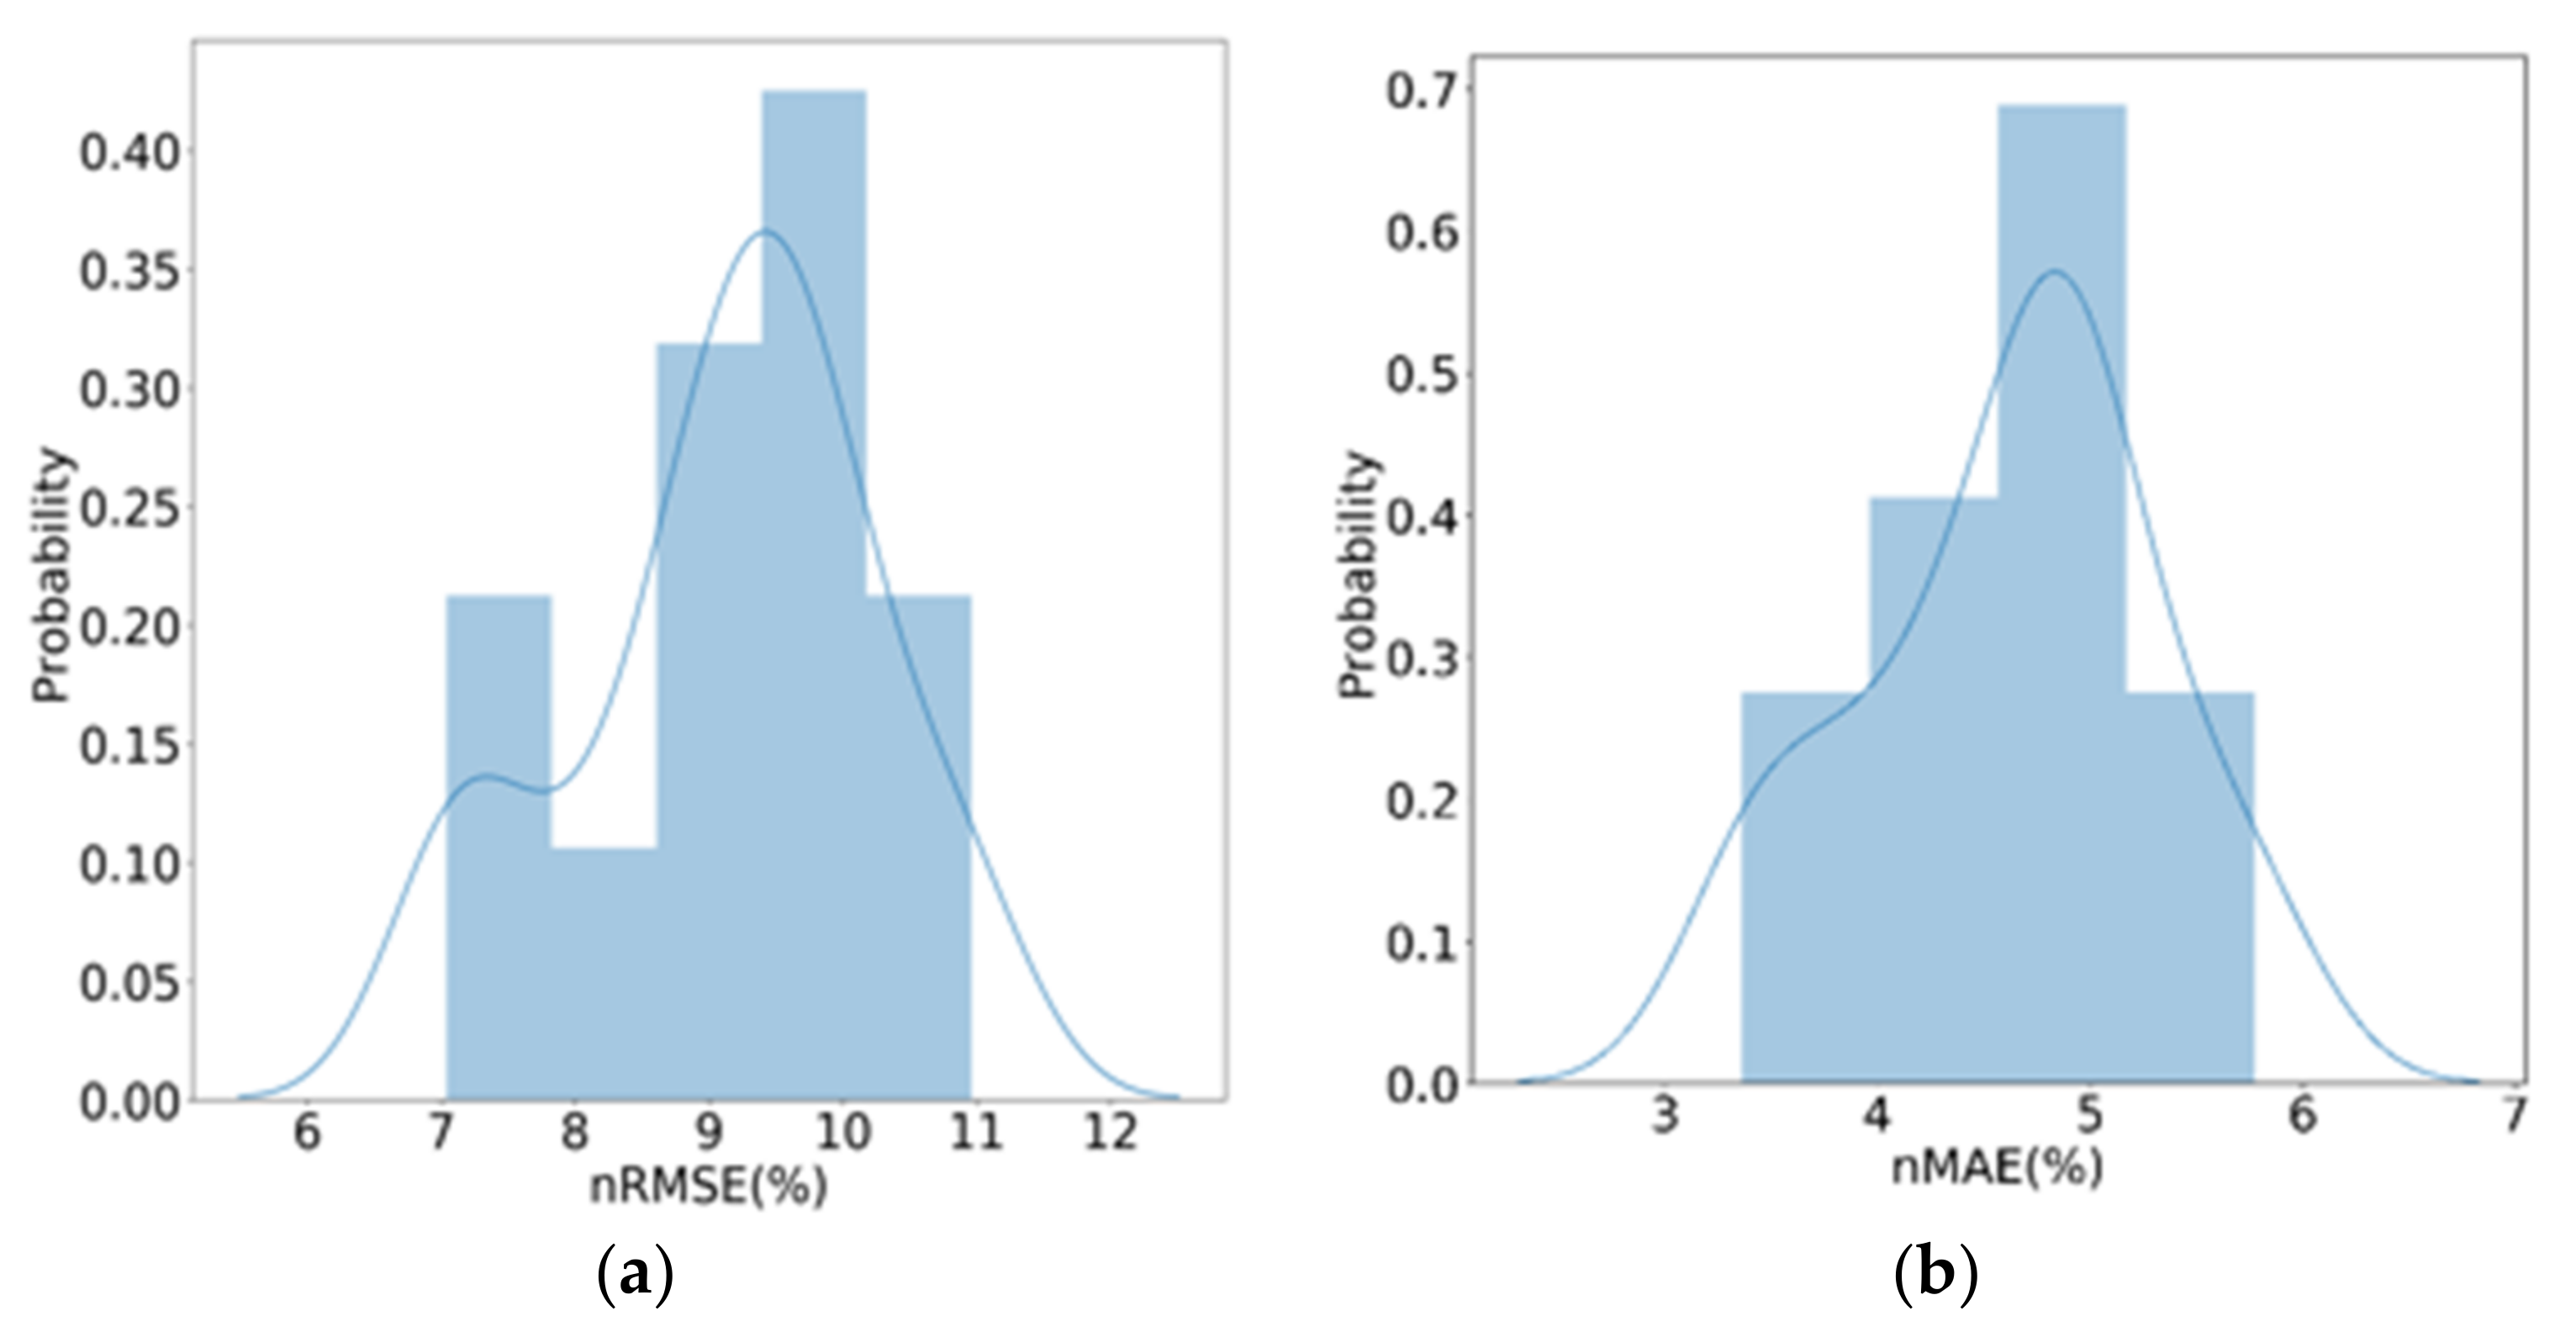
For detection and capacity estimation, PV generation forecasting runs 100 rounds by selecting the authorized PV and representative solar sites differently each time by random sampling. Two prediction accuracy metrics, nRMSE and nMAE, are used to evaluate the individual PV generation forecasting model. Distribution of individual PV generation forecasting is shown in Figure 9. PV power and weather forecast data for 2 years are used. Data from 1 July 2011 to 3 February 2013 (i.e., 584 days) are used to train PV generation forecasting model. Data after 4 February 2013 (i.e., 147 days) are used to test the trained PV generation forecasting model. Average of nRMSE and nMAE are 9.18% and 4.60%. Once individual PV generation forecasting is completed, regional PV generation is predicted through the upscaling method as mentioned in Section 3.3.3 and Section 3.3.4. The regional PV generation forecasting error is shown in Table 7. These errors are obtained as the average of the prediction errors of PV generation in each region calculated through 100 rounds simulations. The prediction result is shown in Table 7. The difference in estimation results in Table 6 and Table 7 is due to the distribution of solar energy facilities. In most areas, such as California, the solar capacity distribution is 1–3 kW [33]. However, in the case of [39], the detection was conducted on houses with 4–6 kW capacity. In the case of houses with large installation capacity, the net load pattern is clear, but detection is difficult because the characteristics of the net load pattern are not clear when solar energy is installed in houses with small installation capacity. Taking these features into account, we detect them, and this difference improves the estimation of the proposed method and the performance of predicting local-unit solar power generation.
Regional PV generation forecasting performance considering unauthorized PV detection and estimation much better than otherwise. This is because the uncertainty of the unauthorized PV capacity is reduced by detection and capacity estimation model.
These errors are obtained as the average of the prediction errors of PV generation in each region calculated through 100 simulations. The prediction result without detection and capacity estimation is shown in Table 7. In Table 7, Case 1 is a situation that does not consider unauthorized PV detection. Case 2 is a situation considering unauthorized PV detection in [39]. Case 3 is a situation considering unauthorized PV detection in this study.
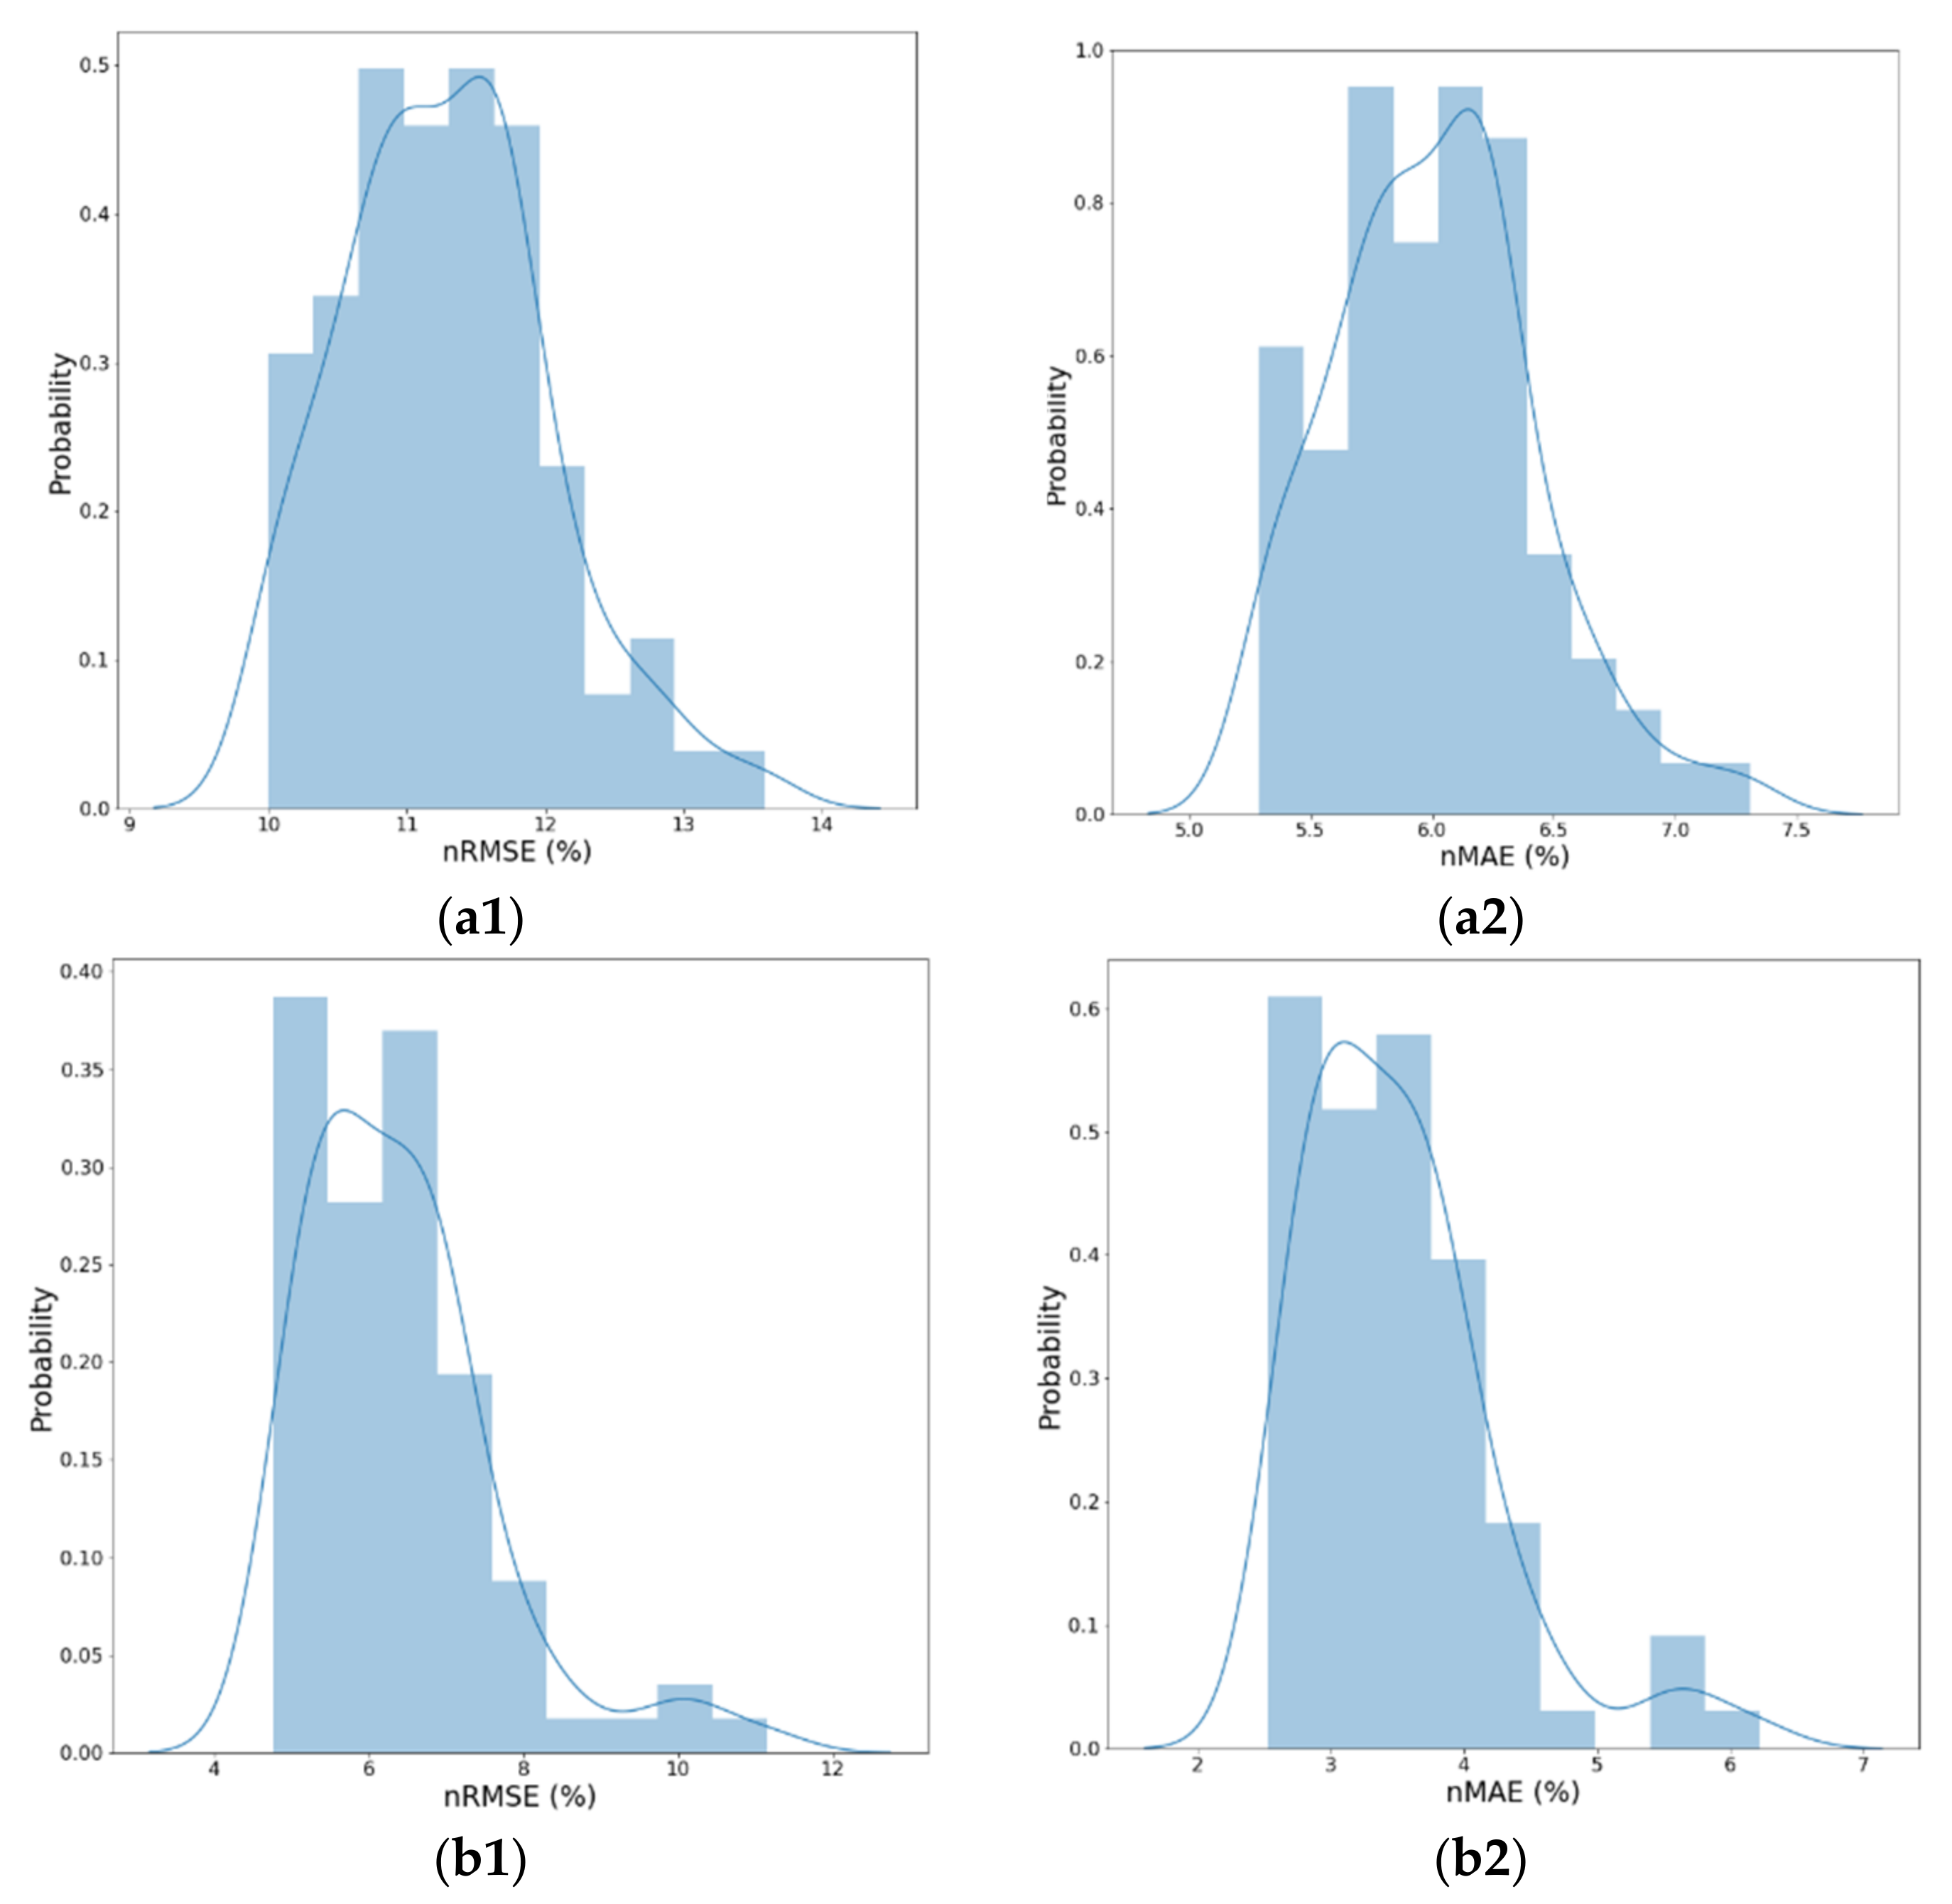
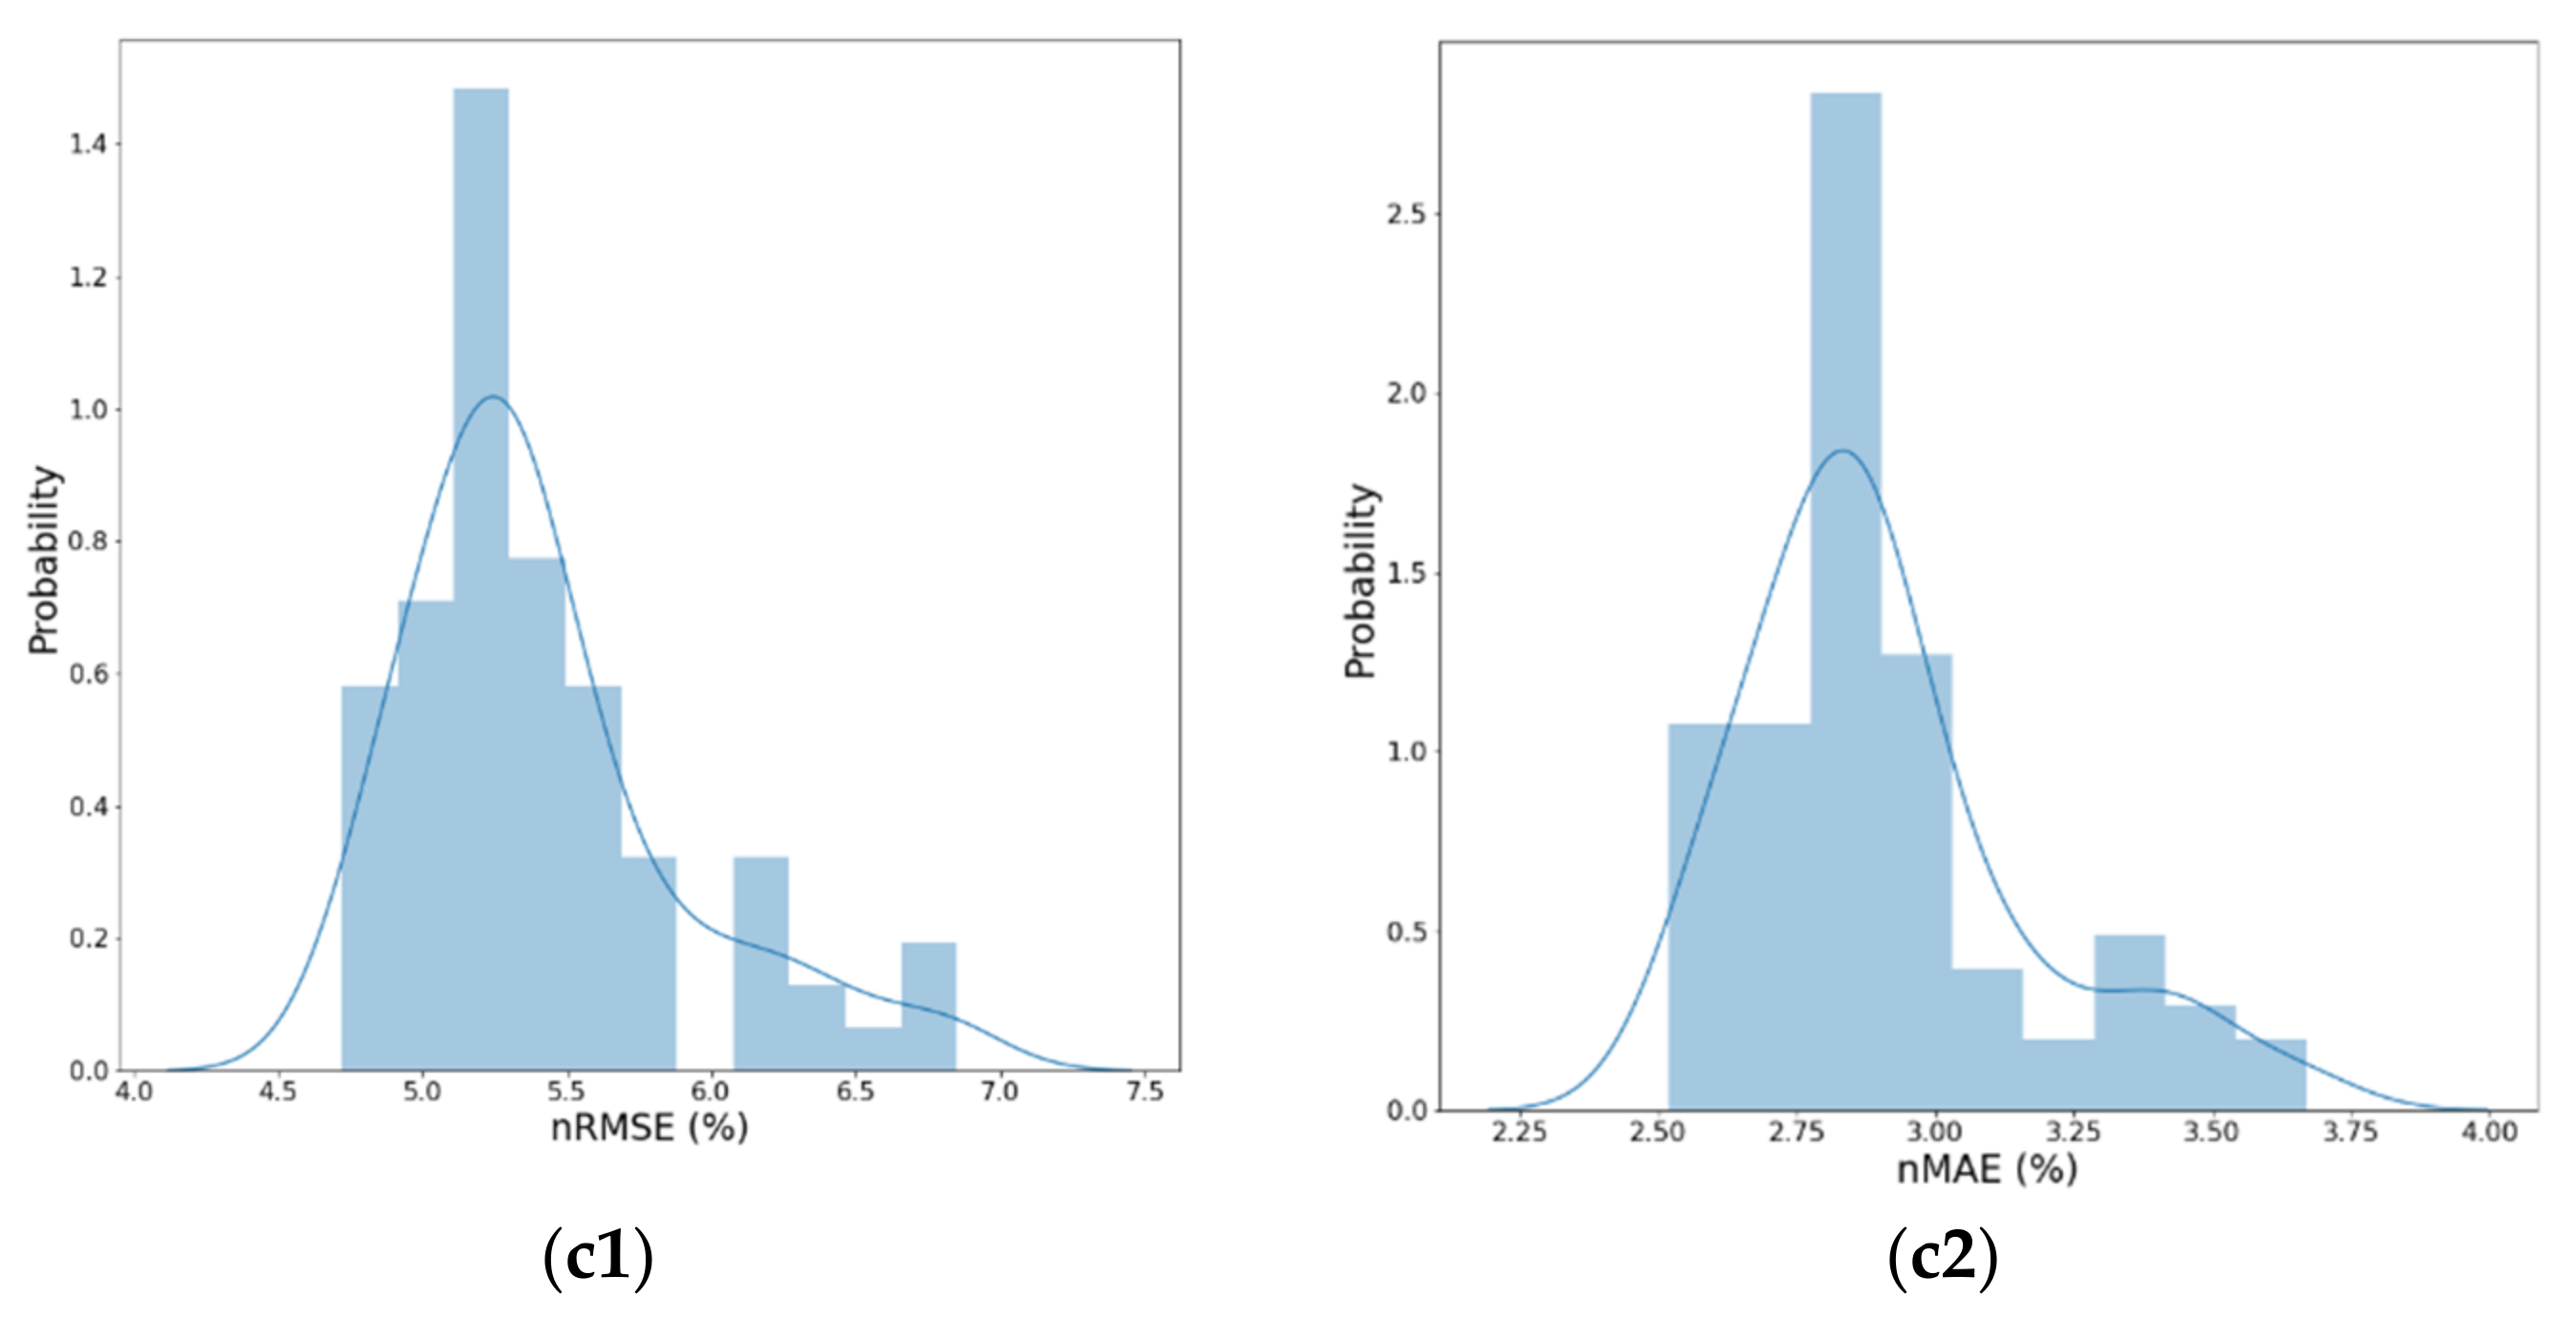
Also, distributions of regional solar power prediction are shown in Figure 10.
Figure 10(a1,b1,c1) represents the nRMSE distributions of Case 1, Case 2, and Case 3, respectively. The others (i.e., Figure 10(a2,b2,c2)) represent the nMAE distributions of Case 1, Case 2, and Case 3, respectively.
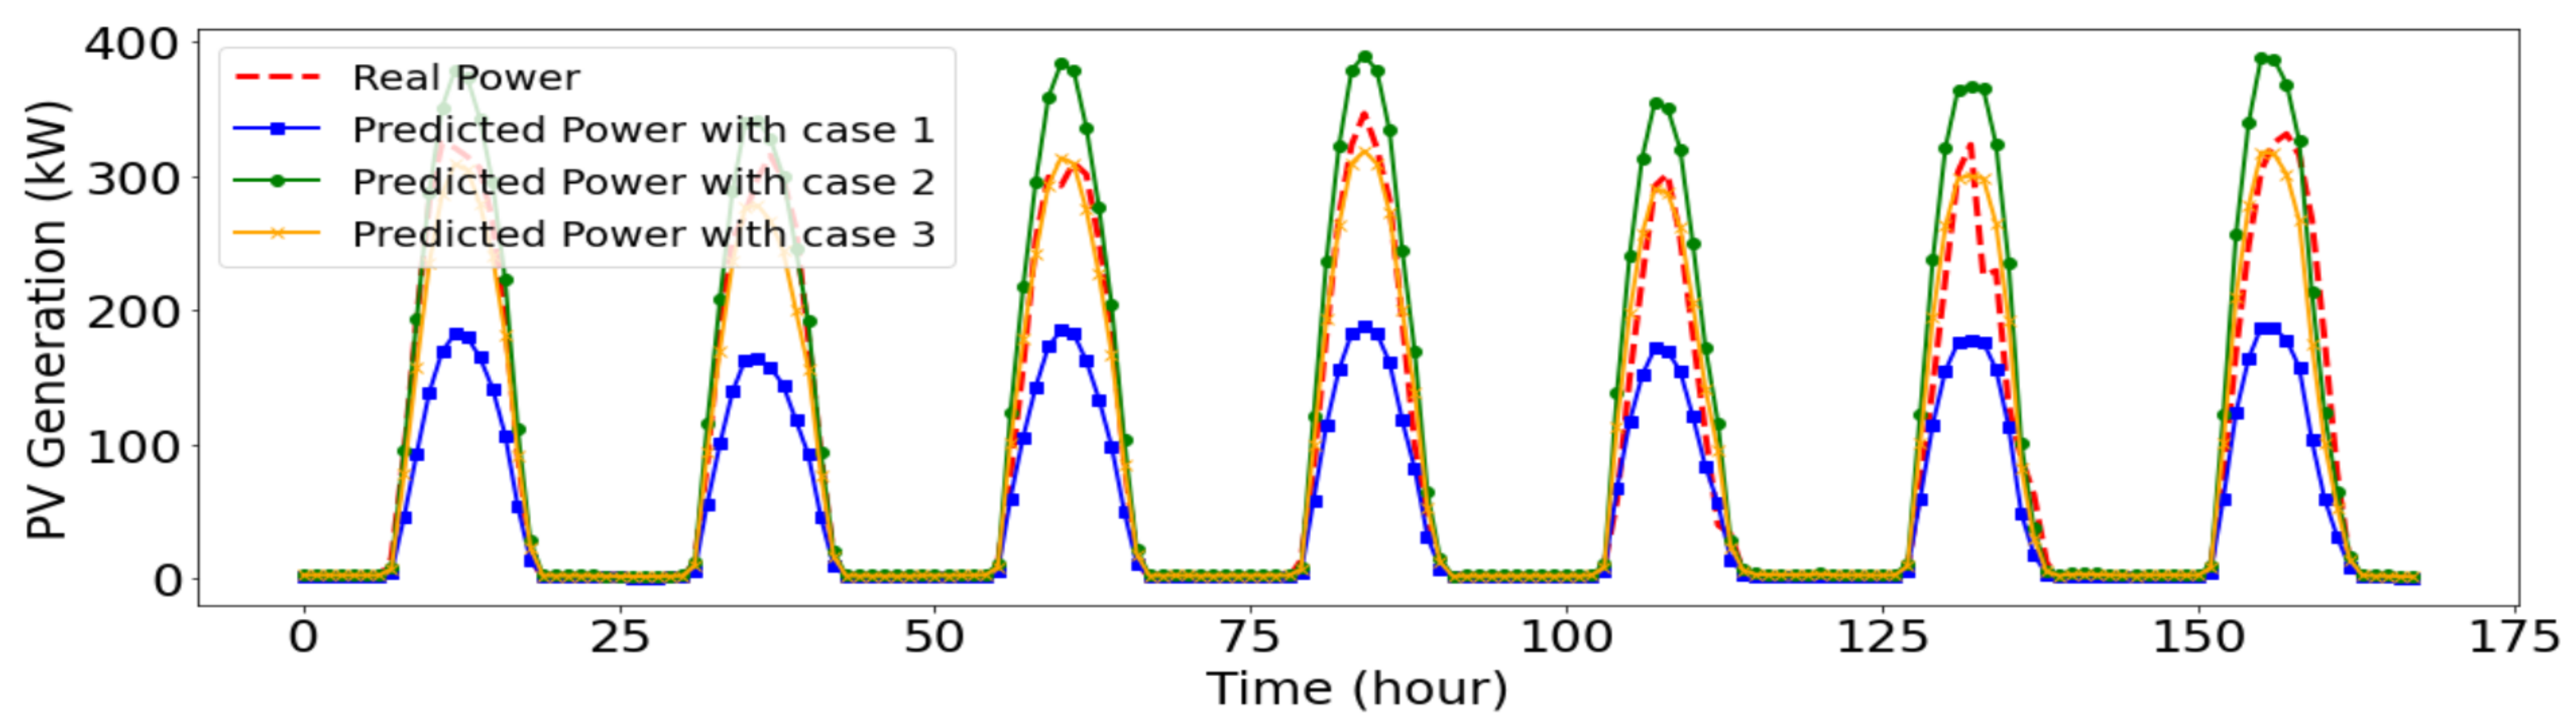
It is also possible to identify the effect through Figure 11. Case 1 is the regional PV output prediction situation without unauthorized PV detection and capacity estimation. On the other hand, Case 2 is the regional PV output prediction situation with unauthorized PV detection and capacity estimation in [35]. Case 3 is similar to Case 2. However, Case 3 is used to proposed the unauthorized detection method instead. Here, it is assumed that is 0.5 based on the Cape Town case [29]. In Case 1, where unauthorized PV detection is not considered, the prediction values differ from real generation values. Because the upscaling factor was obtained incorrectly only considering authorized PV installation. In Case 2, the upscaling factor error between real PV capacity and estimated could be reduced through unauthorized PV detection. Furthermore, it is possible to reduce the error in predicting the amount of solar power generation by adding a feature capable of discriminating unauthorized PV detection in the model in Case 3.
5. Discussion
5.1. Upscaling Factor Analysis
The upscaling factor is key to predicting accurate regional PV generation. In this section, upscaling factors with several situations are compared to highlight the importance of unauthorized PV detection and capacity estimation.
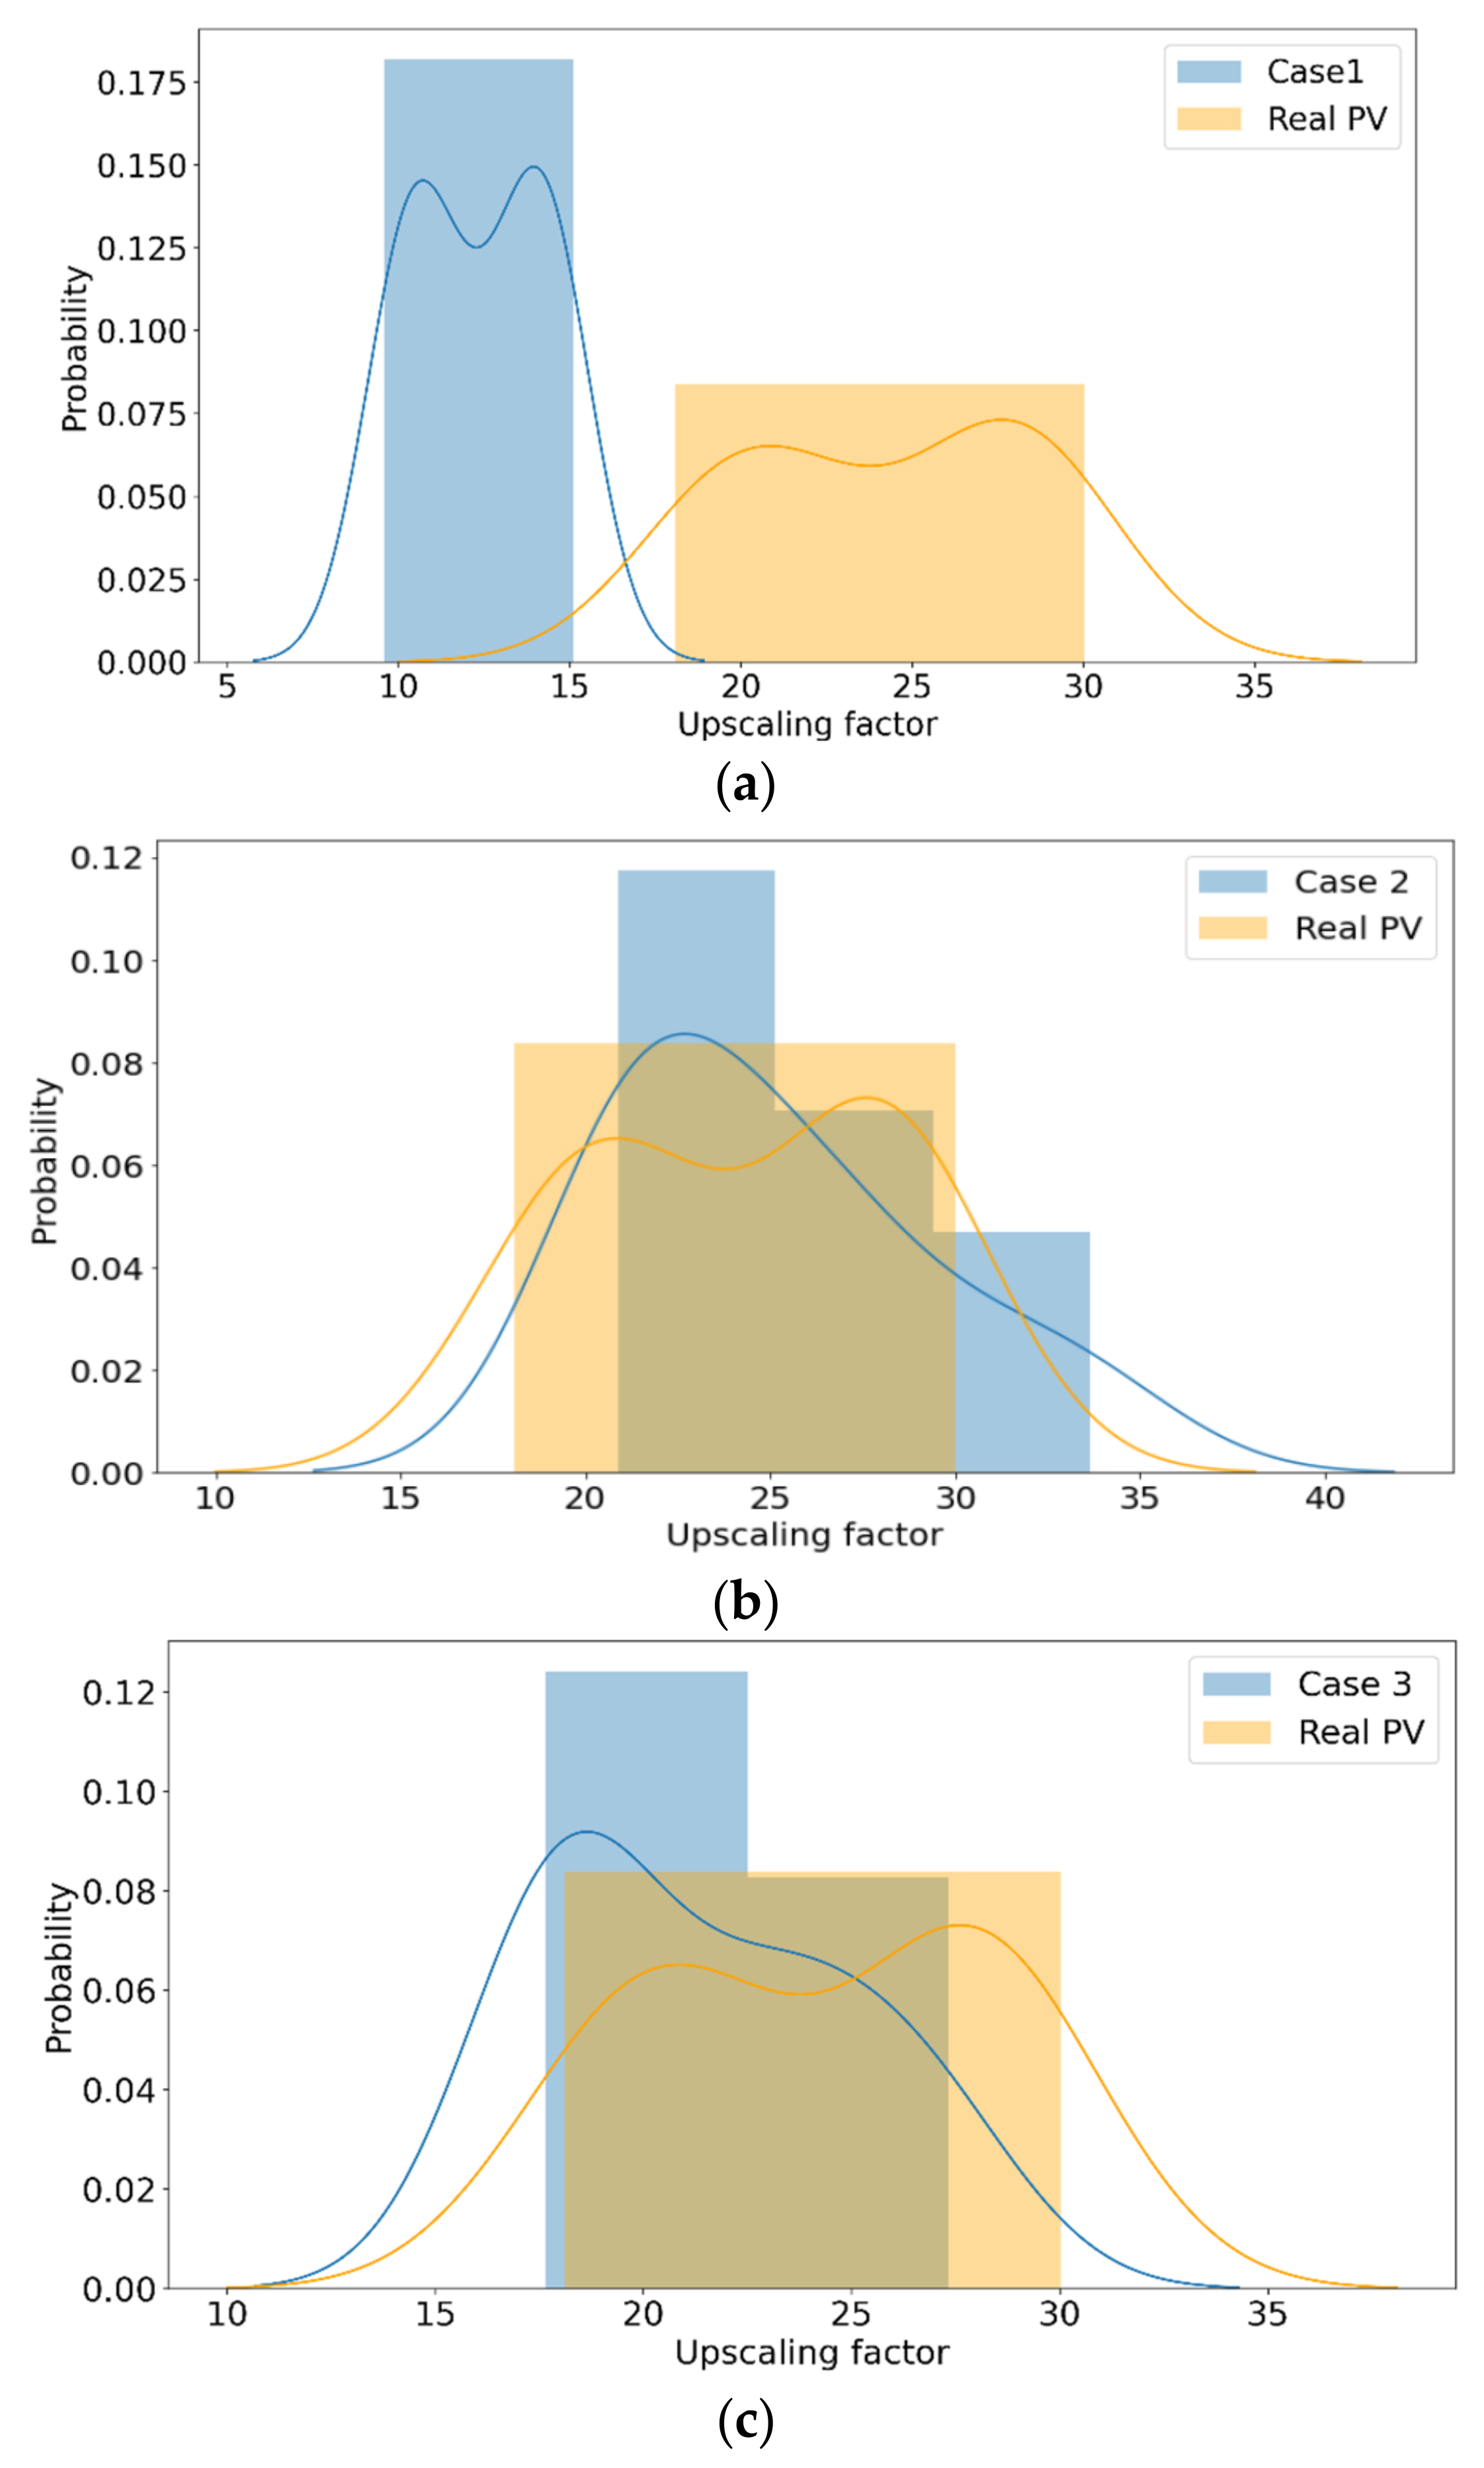
In this section, the upscaling factor distributions are covered in Figure 12. In Case 1, upscaling factor range between Case 1 and real values is differ significantly. It results in a large error in predicting regional PV output. On the other hand, the upscaling factor can be estimated similarly to the real value through unauthorized PV detection in Case 2. In addition, by improving the detection accuracy of unauthorized PV, Case 3 has a smaller upscaling factor error than Case 2. Through the improved unauthorized PV detection model in Figure 12, it is possible to improve the prediction of regional PV output.
5.2. Feature Correlation Analysis
In this section, analysis between features and results is discussed for detection. The maximal information coefficient (MIC) is used to analyze correlation between features and result for detection and capacity estimation [39]. MIC values of features are shown in Table 8. Through MIC values, and in this study have a stronger correlation in this study. Overall detection accuracy is improved due to the use of these features.
6. Conclusions
This study presents a new forecasting method for regional rooftop PV power generation. It aims to accurately forecast aggregated PV power of rooftop PV in the entire region under unauthorized PV installation. In the first step, an unauthorized PV detection model based on MLP by trained virtual TNLP and MNLP is proposed to detect whether rooftop PV is installed or not. In the second step, an unauthorized PV capacity estimation model dealing with the imbalance of PV capacity distribution through virtual NL generation based on a bootstrap approach is proposed. In the final step, regional rooftop PV generation forecasting based on an upscaling method considering unauthorized PV installation is proposed. A realistic dataset from Sydney (NSW, Australia) consisting of 300 residential customers with rooftop PV system was used to evaluate the performance of the proposed methodology. The results show that the proposed methodology has good overall performance compared with previous regional rooftop PV generation forecasting approaches. Furthermore, the impact of unauthorized PV detection and capacity estimation on the upscaling factor value is investigated. The results indicate that PV detection and capacity estimation reduce the upscaling factor error under unauthorized PV installation. Additionally, by analyzing proposed features for the detection model, the proposed methodology shows its effectiveness. In conclusion, the proposed methodology can contribute to accurate regional PV output forecasting. Future work possibilities are as follows:
- Investigating the impact of NL home-owned energy storage and electric vehicles on unauthorized PV detection performance.
- Exploring rooftop PV capacity uncertainty in addition to unauthorized PV installation. For example, there are rooftop PV faults and real-time rooftop PV penetration.
Author Contributions
T.K. conceived of the idea for the research and preformed the simulations as the first author. J.K. led and supervised the research and is the corresponding author. Both authors have read and agreed to the published version of the manuscript.
Funding
This research received no external funding.
Institutional Review Board Statement
Not applicable.
Informed Consent Statement
Not applicable.
Acknowledgments
This work was supported by the Korea Institute of Energy Technology Evaluation and Planning (KETEP) and the Ministry of Trade, Industry Energy (MOTIE) of the Republic of Korea (No. 20191210301930).
Conflicts of Interest
The authors declare no conflict of interest.
References
- Fossil Fuel. Available online: https://ourworldindata.org/fossil-fuels (accessed on 15 January 2020).
- Greenhouse Gas Emissions. Available online: https://www.epa.gov/ghgemissions/global-greenhouse-gas-emissions-data (accessed on 9 February 2019).
- The Sources and Solutions. Fossil Fuels. Available online: https://www.epa.gov/nutrientpollution/sources-and-solutions-fossil-fuels (accessed on 9 February 2020).
- Renewable Energy Statistics 2021. Available online: https://www.irena.org/publications/2021/March/Renewable-Capacity-Statistics-2021 (accessed on 2 November 2019).
- Improving Load Forecast with BTM Solar Forecast. Available online: https://www.pjm.com/-/media/committees-groups/committees/oc/20190514/20190514-item-20-improving-load-forecast-with-btm-solar-forecast.ashx (accessed on 9 June 2019).
- World Energy Issue Insight. Available online: http://www.keei.re.kr/keei/download/WEIS1702.pdf (accessed on 6 July 2020).
- PV Status Report. Available online: https://ec.europa.eu/jrc/sites/jrcsh/files/kjna29938enn_1.pdf (accessed on 9 February 2020).
- Katsanevakis, M.; Stewart, R.A.; Lu, J. Energy storage system utilisation to increase photovoltaic penetration in low voltage distribution feeders. J. Energy Storage 2017, 14, 329–347. [Google Scholar] [CrossRef]
- 7 Reasons Why You Should Use Solar Power. Available online: https://www.greenmatch.co.uk/blog/2014/07/7-reasons-why-you-should-use-solar-power (accessed on 12 April 2020).
- Niccolai, A.; Dolara, A.; Ogliari, E. Hybrid PV Power Forecasting Methods: A Comparison of Different Approaches. Energies 2021, 14, 451. [Google Scholar] [CrossRef]
- Antonanzas, J.; Osorio, N.; Escobar, R.; Urraca, R.; de Pison, F.M.; Antonanzas-Torres, F. Review of photovoltaic power forecasting. Sol. Energy 2016, 136, 78–111. [Google Scholar] [CrossRef]
- Lorenz, E.; Scheidsteger, T.; Hurka, J.; Heinemann, D.; Kurz, C. Regional PV power prediction for improved grid integration. Prog. Photovolt. Res. Appl. 2011, 19, 757–771. [Google Scholar] [CrossRef]
- Lorenz, E.; Heinemann, D.; Kurz, C. Local and regional photovoltaic power prediction for large scale grid integration: Assessment of a new algorithm for snow detection. Prog. Photovolt. Res. Appl. 2012, 20, 760–769. [Google Scholar] [CrossRef]
- Junior, J.G.d.S.F.; Oozeki, T.; Ohtake, H.; Shimose, K.I.; Takashima, T.; Ogimoto, K. Regional forecasts and smoothing effect of photovoltaic power generation in Japan: An approach with principal component analysis. Renew. Energy 2014, 68, 403–413. [Google Scholar] [CrossRef]
- Junior, J.; Oozeki, T.; Ohtake, H.; Shimose, K.; Takashima, T.; Ogimoto, K. Forecasting regional photovoltaic power generation-a comparison of strategies to obtain one-day-ahead data. Energy Procedia 2014, 57, 1337–1345. [Google Scholar] [CrossRef] [Green Version]
- Fonseca Junior, J.G.d.S.; Oozeki, T.; Ohtake, H.; Takashima, T.; Ogimoto, K. Regional forecasts of photovoltaic power generation according to different data availability scenarios: A study of four methods. Prog. Photovolt. Res. Appl. 2015, 23, 1203–1218. [Google Scholar] [CrossRef]
- Zamo, M.; Mestre, O.; Arbogast, P.; Pannekoucke, O. A benchmark of statistical regression methods for short-term forecasting of photovoltaic electricity production, part I: Deterministic forecast of hourly production. Sol. Energy 2014, 105, 792–803. [Google Scholar] [CrossRef]
- Davò, F.; Alessandrini, S.; Sperati, S.; Delle Monache, L.; Airoldi, D.; Vespucci, M.T. Post-processing techniques and principal component analysis for regional wind power and solar irradiance forecasting. Sol. Energy 2016, 134, 327–338. [Google Scholar] [CrossRef] [Green Version]
- Li, Y.; Sun, Q.; Lehman, B.; Lu, S.; Hamann, H.F.; Simmons, J.; Black, J. A machine-learning approach for regional photovoltaic power forecasting. In Proceedings of the 2016 IEEE Power and Energy Society General Meeting (PESGM), Boston, MA, USA, 17–21 July 2016; pp. 1–5. [Google Scholar]
- Saint-Drenan, Y.M.; Good, G.H.; Braun, M.; Freisinger, T. Analysis of the uncertainty in the estimates of regional PV power generation evaluated with the upscaling method. Sol. Energy 2016, 135, 536–550. [Google Scholar] [CrossRef] [Green Version]
- Pierro, M.; De Felice, M.; Maggioni, E.; Moser, D.; Perotto, A.; Spada, F.; Cornaro, C. Data-driven upscaling methods for regional photovoltaic power estimation and forecast using satellite and numerical weather prediction data. Sol. Energy 2017, 158, 1026–1038. [Google Scholar] [CrossRef]
- Pierro, M.; De Felice, M.; Maggioni, E.; Moser, D.; Perotto, A.; Spada, F.; Cornaro, C. A new approach for regional photovoltaic power estimation and forecast. In Proceedings of the 33rd European Photovoltaic Solar Energy Conference and Exhibition (EUPVSEC), Amsterdam, The Netherlands, 25–29 September 2017; pp. 25–29. [Google Scholar]
- Fu, L.; Yang, Y.; Yao, X.; Jiao, X.; Zhu, T. A Regional Photovoltaic Output Prediction Method Based on Hierarchical Clustering and the mRMR Criterion. Energies 2019, 12, 3817. [Google Scholar] [CrossRef] [Green Version]
- Koster, D.; Minette, F.; Braun, C.; O’Nagy, O. Short-term and regionalized photovoltaic power forecasting, enhanced by reference systems, on the example of Luxembourg. Renew. Energy 2019, 132, 455–470. [Google Scholar] [CrossRef]
- Saint-Drenan, Y.M.; Vogt, S.; Killinger, S.; Bright, J.M.; Fritz, R.; Potthast, R. Bayesian parameterisation of a regional photovoltaic model—Application to forecasting. Sol. Energy 2019, 188, 760–774. [Google Scholar] [CrossRef] [Green Version]
- Zhang, X.; Li, Y.; Lu, S.; Hamann, H.F.; Hodge, B.M.; Lehman, B. A solar time-based analog ensemble method for regional solar power forecasting. IEEE Trans. Sustain. Energy 2018, 10, 268–279. [Google Scholar] [CrossRef]
- Zhang, X.; Grijalva, S. A data-driven approach for detection and estimation of residential PV installations. IEEE Trans. Smart Grid 2016, 7, 2477–2485. [Google Scholar] [CrossRef]
- Shaker, H.; Zareipour, H.; Wood, D. A data-driven approach for estimating the power generation of invisible solar sites. IEEE Trans. Smart Grid 2015, 7, 2466–2476. [Google Scholar] [CrossRef]
- Dealing with Unregisterd and Unauthorized Systems. Available online: https://solar-support.org/files/299/dump (accessed on 27 January 2020).
- EPIC 1.21—Pilot Methods for Automatic Identification of Distributed Energy Resources (such as Solar PV) as they Interconnect to the Grid to Improve Safety & Reliability. Available online: https://www.pge.com/pge_global/common/pdfs/about-pge/environment/what-we-are-doing/electric-program-investment-charge/PGE-EPIC-Project-1.21.pdf (accessed on 3 March 2020).
- HECO Customers asked to Disconnect Unauthorized PV Systems. Available online: http://khon2.com/2014/09/05/heco-customers-asked-to-disconnect-unauthorizedpv-systems/ (accessed on 13 June 2021).
- Transient Over-Voltage Mitigation and Its Prevention in Secondary Distribution Networks with High PV-to-Load Ratio, Hawaii Electric Companies. Available online: https://www.hnei.hawaii.edu/wp-content/uploads/Transient-Over-Voltage-Mitigation-and-Prevention-In-Secondary-Distribution-Networks.pdf (accessed on 15 June 2021).
- California Solar Permitting Guidebook, Solar Permitting Work Group, The Governor’s Office of Planning and Research. Available online: https://www.buildingincalifornia.com/wp-content/uploads/2014/02/CaliforniaSolarPermittingGuidebook-2012.pdf (accessed on 15 June 2021).
- Shaker, H.; Zareipour, H.; Wood, D. Estimating power generation of invisible solar sites using publicly available data. IEEE Trans. Smart Grid 2016, 7, 2456–2465. [Google Scholar] [CrossRef]
- Wang, Y.; Zhang, N.; Chen, Q.; Kirschen, D.S.; Li, P.; Xia, Q. Data-driven probabilistic net load forecasting with high penetration of behind-the-meter PV. IEEE Trans. Power Syst. 2017, 33, 3255–3264. [Google Scholar] [CrossRef]
- Kapourchali, M.H.; Sepehry, M.; Aravinthan, V. Multivariate Spatio-temporal Solar Generation Forecasting: A Unified Approach to Deal with Communication Failure and Invisible Sites. IEEE Syst. J. 2018, 13, 1804–1812. [Google Scholar] [CrossRef]
- Shaker, H.; Manfre, D.; Zareipour, H. Forecasting the aggregated output of a large fleet of small behind-the-meter solar photovoltaic sites. Renew. Energy 2020, 147, 1861–1869. [Google Scholar] [CrossRef]
- He, X.; Qiu, R.C.; Chu, L.; Ai, Q.; Ling, Z.; Zhang, J. Invisible Units Detection and Estimation Based on Random Matrix Theory. IEEE Trans. Power Syst. 2019, 35, 1846–1855. [Google Scholar] [CrossRef] [Green Version]
- Wang, F.; Li, K.; Wang, X.; Jiang, L.; Ren, J.; Mi, Z.; Shafie-khah, M.; Catalão, J.P. A distributed PV system capacity estimation approach based on support vector machine with customer net load curve features. Energies 2018, 11, 1750. [Google Scholar] [CrossRef] [Green Version]
- Li, K.; Wang, F.; Mi, Z.; Fotuhi-Firuzabad, M.; Duic´, N.; Wang, T. Capacity and output power estimation approach of individual behind-the-meter distributed photovoltaic system for demand response baseline estimation. Appl. Energy 2019, 253, 113595. [Google Scholar] [CrossRef]
- Solar Home Electricity Data. Available online: https://www.ausgrid.com.au/Industry/Our-Research/Data-to-share/Solar-home-electricity-data (accessed on 21 October 2019).
- Yuan, C.; Yang, H. Research on K-value selection method of K-means clustering algorithm. J. Multidiscip. Sci. J. 2019, 2, 226–235. [Google Scholar] [CrossRef] [Green Version]
- PVlib, Python Solar Open Source Library. Available online: https://pvlib-python-dacoex.readthedocs.io/en/latest/index.html (accessed on 8 July 2019).
- Obtain Historical Weather Forecast Data in CSV Format Using Python. Available online: https://www.freecodecamp.org/news/obtain-historical-weather-forecast-data-in-csv-format-using-python/ (accessed on 16 September 2019).
- Home Solar Power in New South Wales. Available online: https://www.solarquotes.com.au/australia/solar-power-nsw/ (accessed on 2 February 2020).
Figure 1.
Home classification according to photovoltaic (PV) installation, authorization, and sub meter.
Figure 1.
Home classification according to photovoltaic (PV) installation, authorization, and sub meter.

Figure 2.
Framework of the proposed regional rooftop PV forecasting approach.

Figure 3.
Average solar irradiance by weather groups (WG).

Figure 4.
Process of unauthorized PV detection (a) training (b) test.

Figure 5.
PV capacity distribution histogram in [41].
Figure 5.
PV capacity distribution histogram in [41].

Figure 6.
Process of PV capacity estimation (a) training (b) test.

Figure 7.
Geographical distribution of rooftop PV in Australia.

Figure 8.
Result of rooftop PV in Australia clustering.

Figure 9.
Distribution of individual PV generation forecasting (a) nRMSE (b) nMAE.

Figure 10.
Regional PV output forecasting distributions; (a1) nRMSE of Case 1 (a2) nMAE of Case1 (b1) nRMSE of Case 2 (b2) nMAE of Case2 (c1) nRMSE of Case 3 (c2) nMAE of Case 3.
Figure 10.
Regional PV output forecasting distributions; (a1) nRMSE of Case 1 (a2) nMAE of Case1 (b1) nRMSE of Case 2 (b2) nMAE of Case2 (c1) nRMSE of Case 3 (c2) nMAE of Case 3.


Figure 11.
Regional PV generation forecasting results.

Figure 12.
Comparison of upscaling factor distribution (a) Case 1 (b) Case 2 (c) Case 3.


Table 1.
Literature reviews classification table.
| Literature Group | Research Subject | Reference |
|---|---|---|
| 1 | Regional utility scale photovoltaic (PV) forecasting | [12,13,14,15,16,17,18,19,20,21,22,23,24,25,26] |
| 2 | Regional behind the meter (BTM) PV forecasting | [28,34,35,36,37] |
| 3 | Unauthorized PV detection and PV capacity estimation | [27,38,39,40] |
Table 2.
Four home group for rooftop PV.
| Question | H1 | H2 | H3 | H4 |
|---|---|---|---|---|
| Is there a rooftop PV sub meter at home? | Yes | No | No | No |
| Is a rooftop PV at home authorized? | Yes | Yes | No | No |
| Is a rooftop PV installed at home? | Yes | Yes | Yes | No |
Table 3.
Parameters for case study.
| Parameters | Value | Parameters | Value |
|---|---|---|---|
| Nhome | 1500 | rSam | 0.08 |
| NPV | 300 | ts | 9 |
| rAu | 0.5 | te, tf | 16, 19 |
Table 4.
Unauthorized PV detection result by method in [39].
Table 4.
Unauthorized PV detection result by method in [39].
| Metric | Best | Average | Worst |
|---|---|---|---|
| PA | 96.00 | 90.69 | 77.33 |
| NPA | 99.67 | 96.58 | 89.67 |
| OA | 98.00 | 95.93 | 90.15 |
Table 5.
Unauthorized PV detection result by proposed method.
| Metric | Best | Average | Worst |
|---|---|---|---|
| PA | 100 | 99.81 | 96.67 |
| NPA | 98.33 | 97.02 | 95.67 |
| OA | 98.52 | 97.33 | 96.07 |
Table 6.
Unauthorized PV capacity estimation result by method.
| Study | Best (%) | Average (%) | Worst (%) |
|---|---|---|---|
| [35] | 66.00 | 92.79 | 113.00 |
| Proposed method | 34.00 | 44.21 | 63.00 |
Table 7.
Regional PV generation forecasting error without detection and capacity estimation.
| Error Metric (%) | Case 1 | Case 2 | Case 3 |
|---|---|---|---|
| Normalized Root Mean Square Error (nRMSE) | 11.29 | 6.41 | 5.41 |
| Normalized Mean Absolute Error (nMAE) | 6.01 | 3.52 | 2.95 |
Table 8.
Maximal information coefficient (MIC) of features for detection in this study.
| Feature | ||||||
|---|---|---|---|---|---|---|
| MIC value | 0.445 | 0.135 | 0.217 | 0.207 | 0.600 | 0.722 |
Publisher’s Note: MDPI stays neutral with regard to jurisdictional claims in published maps and institutional affiliations. |
© 2021 by the authors. Licensee MDPI, Basel, Switzerland. This article is an open access article distributed under the terms and conditions of the Creative Commons Attribution (CC BY) license (https://creativecommons.org/licenses/by/4.0/).
Share and Cite
MDPI and ACS Style
Kim, T.; Kim, J. A Regional Day-Ahead Rooftop Photovoltaic Generation Forecasting Model Considering Unauthorized Photovoltaic Installation. Energies 2021, 14, 4256. https://0-doi-org.brum.beds.ac.uk/10.3390/en14144256
AMA Style
Kim T, Kim J. A Regional Day-Ahead Rooftop Photovoltaic Generation Forecasting Model Considering Unauthorized Photovoltaic Installation. Energies. 2021; 14(14):4256. https://0-doi-org.brum.beds.ac.uk/10.3390/en14144256
Chicago/Turabian StyleKim, Taeyoung, and Jinho Kim. 2021. "A Regional Day-Ahead Rooftop Photovoltaic Generation Forecasting Model Considering Unauthorized Photovoltaic Installation" Energies 14, no. 14: 4256. https://0-doi-org.brum.beds.ac.uk/10.3390/en14144256
Note that from the first issue of 2016, this journal uses article numbers instead of page numbers. See further details here.