
Comprehensive Modeling and Control of Grid-Connected Hybrid Energy Sources Using MPPT Controller


1
Department of Electrical Engineering, Faculty of Engineering, South Valley University, Qena 83523, Egypt
2
Nuclear Researches Center, Reactors Department, Egyptian Atomic Energy Authority (EAEA), Cairo 11787, Egypt
3
Electrical Power Systems Department, Moscow Power Engineering Institute (MPEI), 111250 Moscow, Russia
4
National Center for Radiation Research and Technology (NCRRT), Egyptian Atomic Energy Authority (EAEA), Cairo 11787, Egypt
5
College of Engineering and Technology, American University of the Middle East, Egaila 15453, Kuwait
*
Authors to whom correspondence should be addressed.
Energies 2021, 14(16), 5142; https://0-doi-org.brum.beds.ac.uk/10.3390/en14165142
Submission received: 29 June 2021
/
Revised: 26 July 2021
/
Accepted: 29 July 2021
/
Published: 20 August 2021
(This article belongs to the Topic Optimisation, Optimal Control and Nonlinear Dynamics in Electrical Power, Energy Storage and Renewable Energy Systems)
Abstract
:Nuclear and renewables energies are the two variants for low-carbon energy and the evolving grid suggests possible synergies between them. Nuclear energy introduces supple operations based on power demand, while renewables such as PV and wind hybrid systems depend on the presence and strength of sunlight or wind. For grid stability, there is need to improve their performance in order to overcome the impact of this disadvantage. The paper is a step in this direction as it addresses a detailed comprehensive dynamic modeling and an efficient control of grid-connected energy sources such as PV or wind system to increase system reliability and to ensure the power quality and safe operation of critical demands. The behavior of the suggested hybrid system is tested at different climate circumstances such as variation of sun radiation and wind speed. The PV is equipped with a boost converter and a three-phase pulse width modulation (PWM) inverter. The wind energy comprises a doubly fed generator (DFIG) based on a variable-speed wind turbine. The two controllers’ rotor-side and grid-side converters of DFIG have the ability to generate and observe reactive power, to keep constant speed of the rotor and control the DC-link voltage. The proposed scheme was investigated using MATLAB software. The maximum power point tracking (MPPT) was used for two systems, PV and wind, in varying weather conditions. The simulation results prove that the voltage at the point of common coupling was constant. Furthermore, the injected current of the grid side was in sinusoidal form and was synchronized with grid side voltage. In addition, the injected power-to-utility grid was around power delivered by the hybrid PV and wind system.
1. Introduction
Energy plays a major role in daily life and energy demand is increasing owing to an increase in population and industrialization [1,2,3]. Fossil fuels-based energy sources are depleting as the rate of energy consumption increases and supply decreases, resulting in energy reduction. The depleting oil reserves associated with coal and natural gas-fired generation are encouraging practitioners to research for alternative and sustainable energy resources. However, there is a strong relation between energy policy and climate policy since most of the sources of greenhouse gases are from the energy sector. The key solution to lowering greenhouse gas emissions is the use of clean energy sources (the sun, wind, water, and atom), referred to as the green square. Synergy between them is a key component in developing pathways to decarbonization of the energy sector [4]. Nuclear–renewable hybrid systems are integrated facilities that include nuclear reactors and renewable generators. They can simultaneously address greenhouse gas emission reductions and grid flexibility if they are well-integrated. Nuclear power can enhance services to the grid, such as reserve capacity and mechanical and rotational energy to maintain grid stability. However, as the grid is the source of power to the offsite power system of nuclear reactors, the international standards emphasized on the necessity for nuclear reactors are yet to be amalgamated. The main purpose of such a connection is the ability to introduce a reliable supply with sufficient capacity and power quality (PQ). This is due to many reasons [5]:
- currently, nuclear reactors include modern electrical loads that are more sensitive to PQ because of numerous microprocessor-based controls;
- intricacy of the nuclear reactor’s various processes;
- restarting-up has high costs and consumes time;
- large computer systems in numerous applications and facilities.
Recently, the applications of hybrid renewable energy sources have grown quickly and have attracted great interests. The uses of new energy resources, especially wind and solar photovoltaic (PV), systems are highly recommended. These new energy resources are renewable, environmentally friendly, inexhaustible, and economical over an interval of time.
Among the resources of renewable energy, wind and solar generation systems have recently become predominant and can be considered the most promising technology to produce electricity [6]. Both solar and wind energy are considered excellent sources from which energy can be obtained. Photovoltaic systems have numerous advantages over the wind system such as low maintenance, no moving parts, and an accessible structure. Otherwise, wind energy is recognized as one of the most efficient clean renewable sources and has attracted comprehensive research interests in academic and industrial areas. Wind systems are less expensive than PV systems, especially on a large scale. However, wind energy systems require qualified staff for operation and maintenance [7].
Hybrid systems are interconnected using PV, wind energy, fuel cells, and micro turbine generators to produce power to load and connect to utility grids. The PV and wind system has a higher accuracy in transmitting continuous power versus an individual source. Thus, the amalgamation of these resources of renewable energy to form a PV and wind hybrid composed of two or more renewable sources is an excellent choice for distributing energy production that can be applied to overcoming intermittency and providing highly reliable and continuous output power to utility grids and rural areas [8]. Different control techniques have been presented that prevail over issues related to maximum extraction of power and injected power quality (PQ). Lately, different investments and research have been executed regarding hybrid PV/wind, such as Bansod [9].
To draw maximum power from hybrid PV/wind and deliver stable power on-demand, a significant battery bank is required. However, the use of a battery is not environmentally friendly and there are drawbacks such as hulking weights, huge size, high costs, and chemical defilement. Thus, one method to use the electric power generated by the PV and wind systems is by directly connecting them to the utility grid [10,11].
As mentioned before, in the future, it is anticipated that the majority of grid sources will consist of nuclear and renewable energy. Nuclear reactors need a stable and reliable grid in order to operate safely and this requires an improved performance of renewables. The contribution of this research work is to study the performance of a grid-connected PV/wind system under several operating circumstances, such as variations of sun irradiance and wind speed. The suggested system uses a boost converter with PV for maximum power point tracking (MPPT) and a double fed induction generator (DFIG) driven by a variable speed wind turbine (WT). Generally, the DFIG is applied to wind generation because of its different merits, such as easy construction, real and reactive power control, and the capability to reduce maximum power from the WTs [11].
The rest of this manuscript is well-regulated as follows. In Section 2, the PV/Wind system modeling, control, and its components are developed. In Section 3, photovoltaic system modeling is presented. Wind system and control technique are demonstrated in Section 4. The results and discussions about the performance of the hybrid system are included in Section 5. Conclusions, followed by references, are presented in the final section.
2. Hybrid Solar PV/Wind Systems Configuration
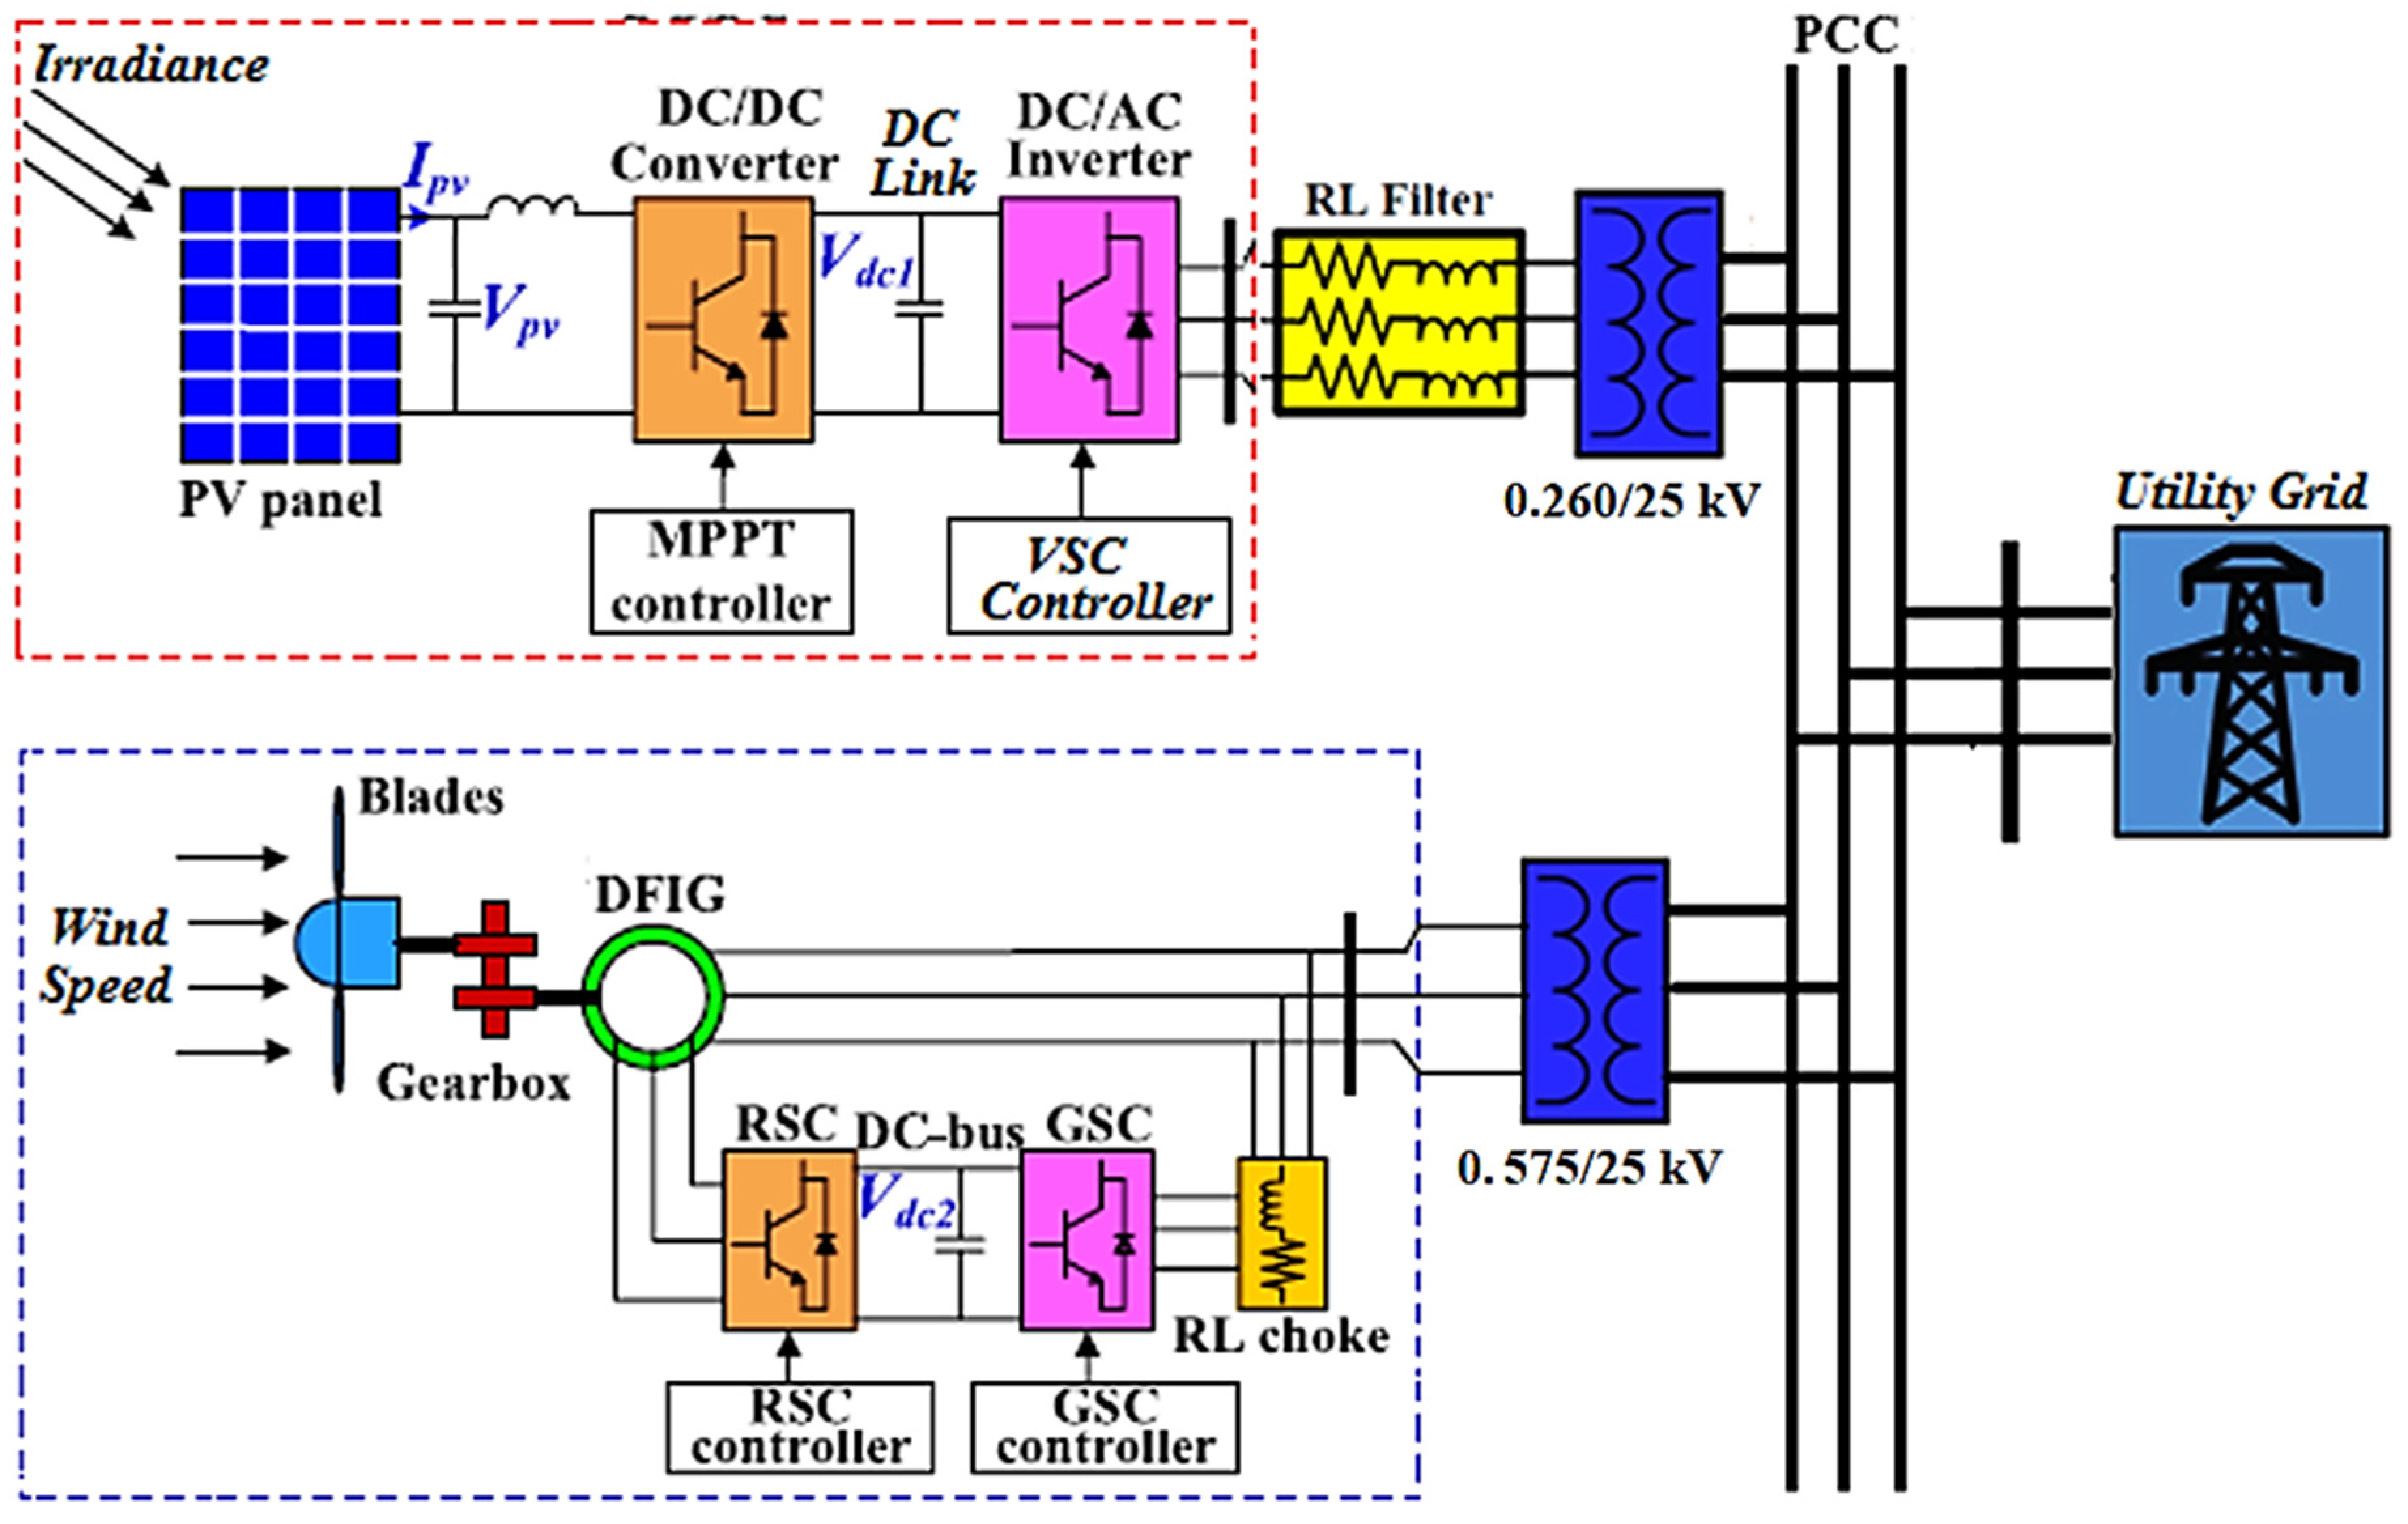
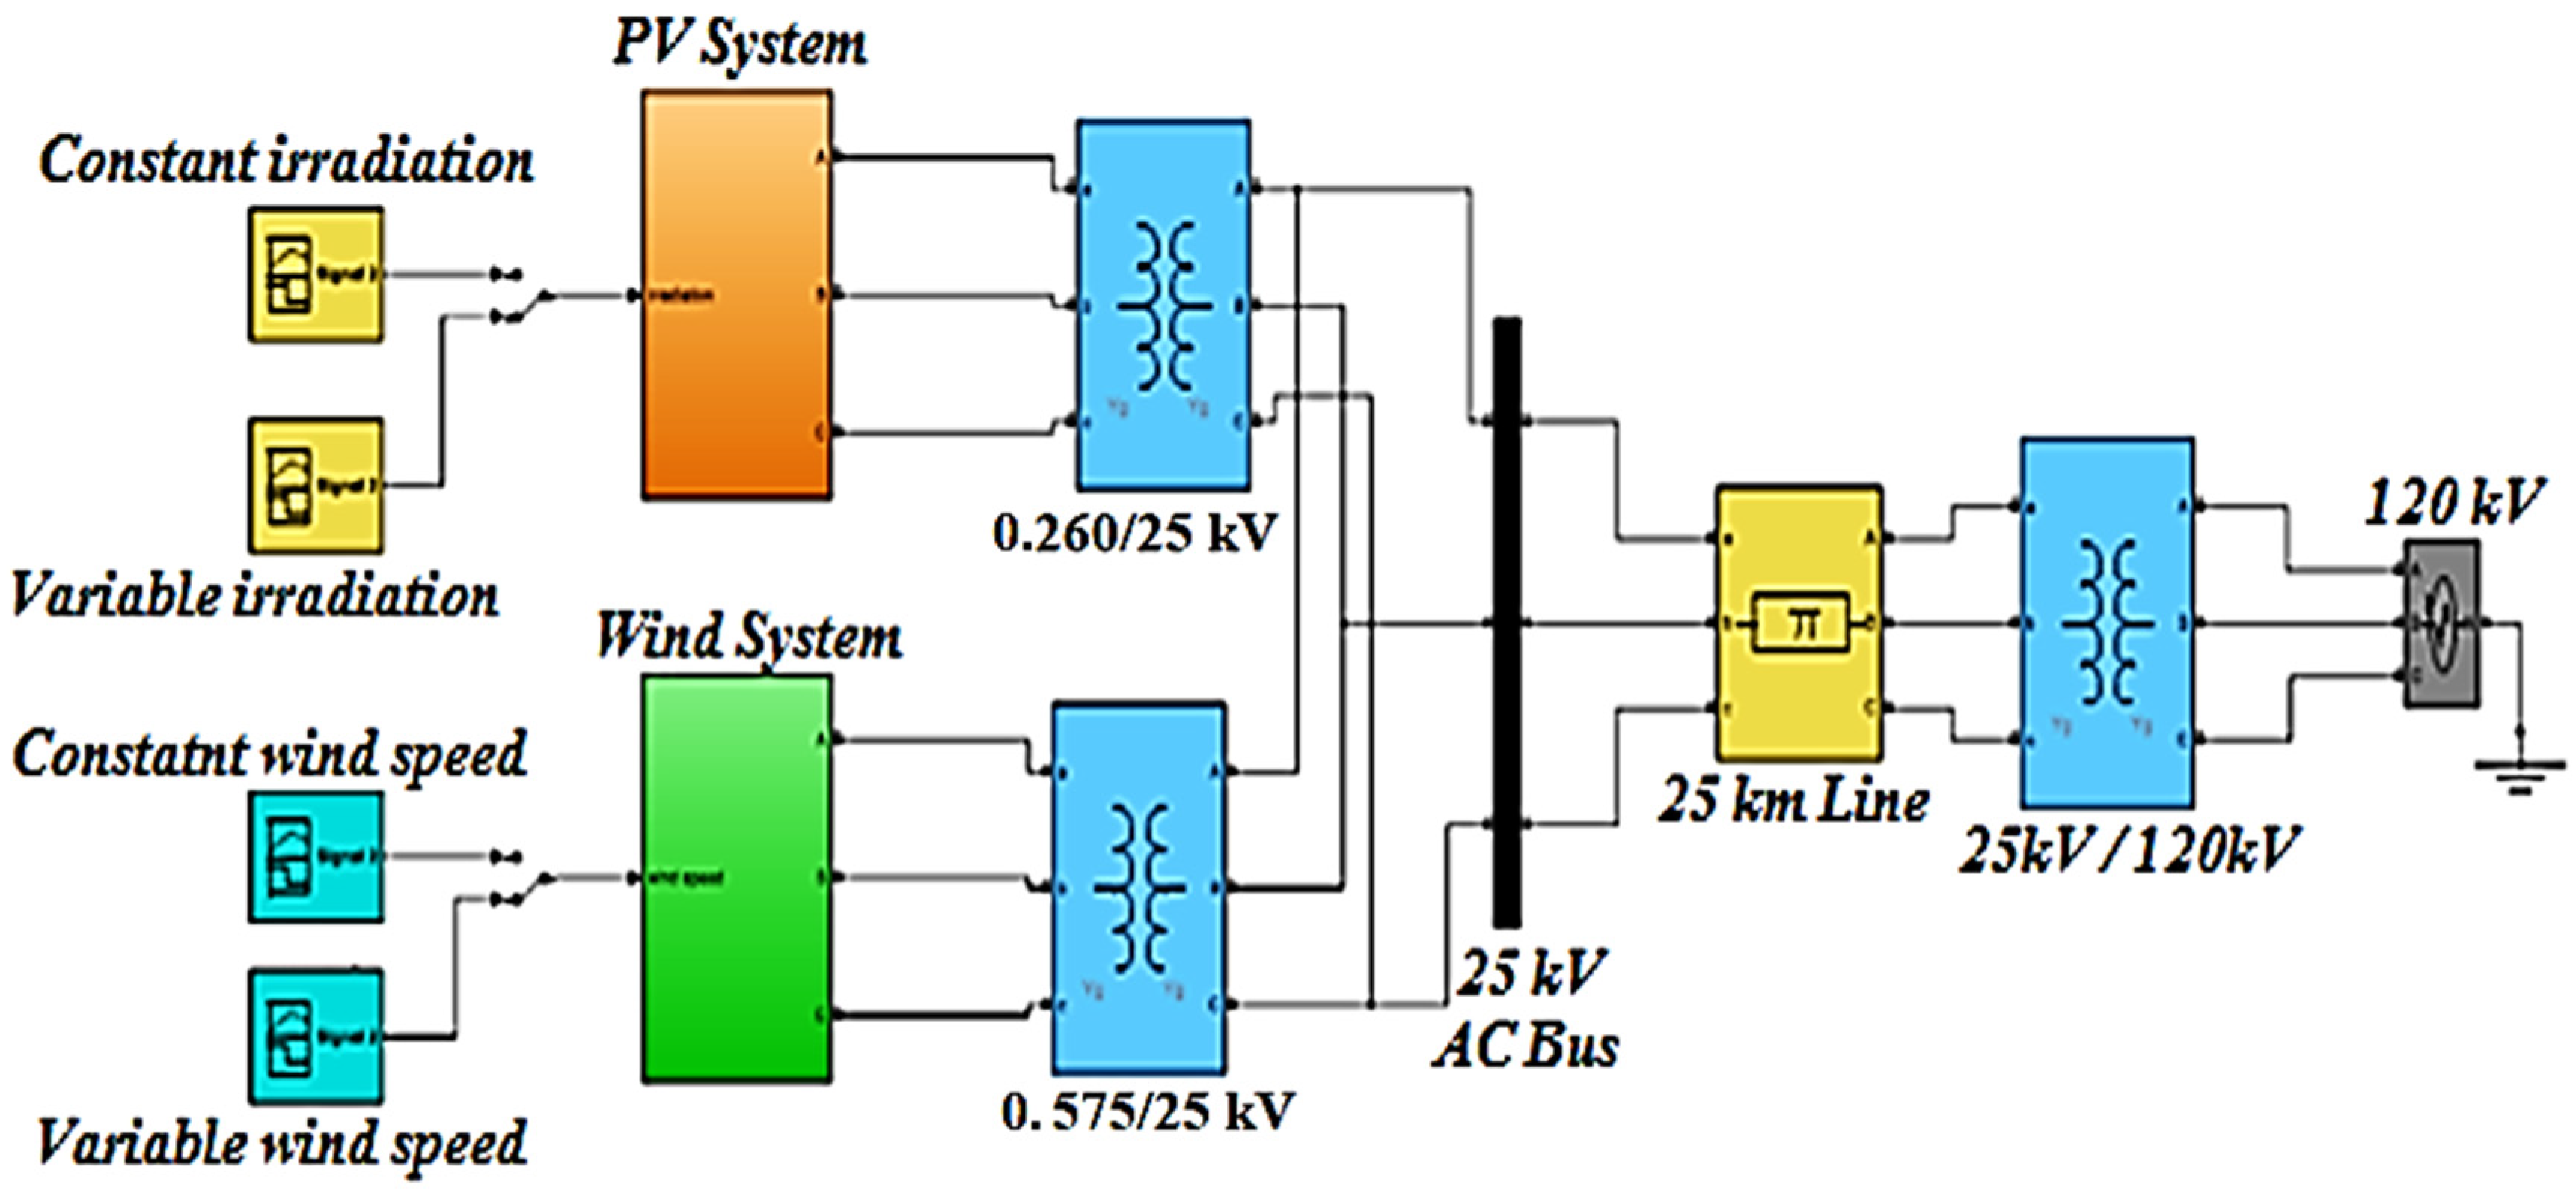
A hybrid system is generally composed of two or more renewable resources to provide increased efficiency and greater stability in energy supply. The overall system configuration of the PV/wind system is presented in Figure 1. It consists of two blocks: the power and control blocks. The power block includes the PV array and wind turbine as the energy source. The PV system is equipped with a boost converter to increase array output voltage to the desired voltage level (500 V DC) with MPPT. Additionally, the DC-AC inverter converts 500 V DC to 260 V AC and maintains a power factor equal to one. The wind system includes a doubly fed generator based on a variable speed WT. The rotor side converter (RSC) is used to extract maximum power of wind at variations in wind speed and the grid side converter (GSC) is used to set DC-bus voltage at a specific value. The transformer is applied in order to raise output voltage to PCC voltage. Regarding the control block, numerous techniques have been investigated to extract maximum power, maintain a power factor equal to one, and adjust the -link voltage [12,13].
3. Photovoltaic (PV) System Description
In this section, modeling of a PV and its performance are described. In addition to the boost converter, the MPPT technique and DC-AC inverter are debated.
3.1. Photovoltaic Generator Model
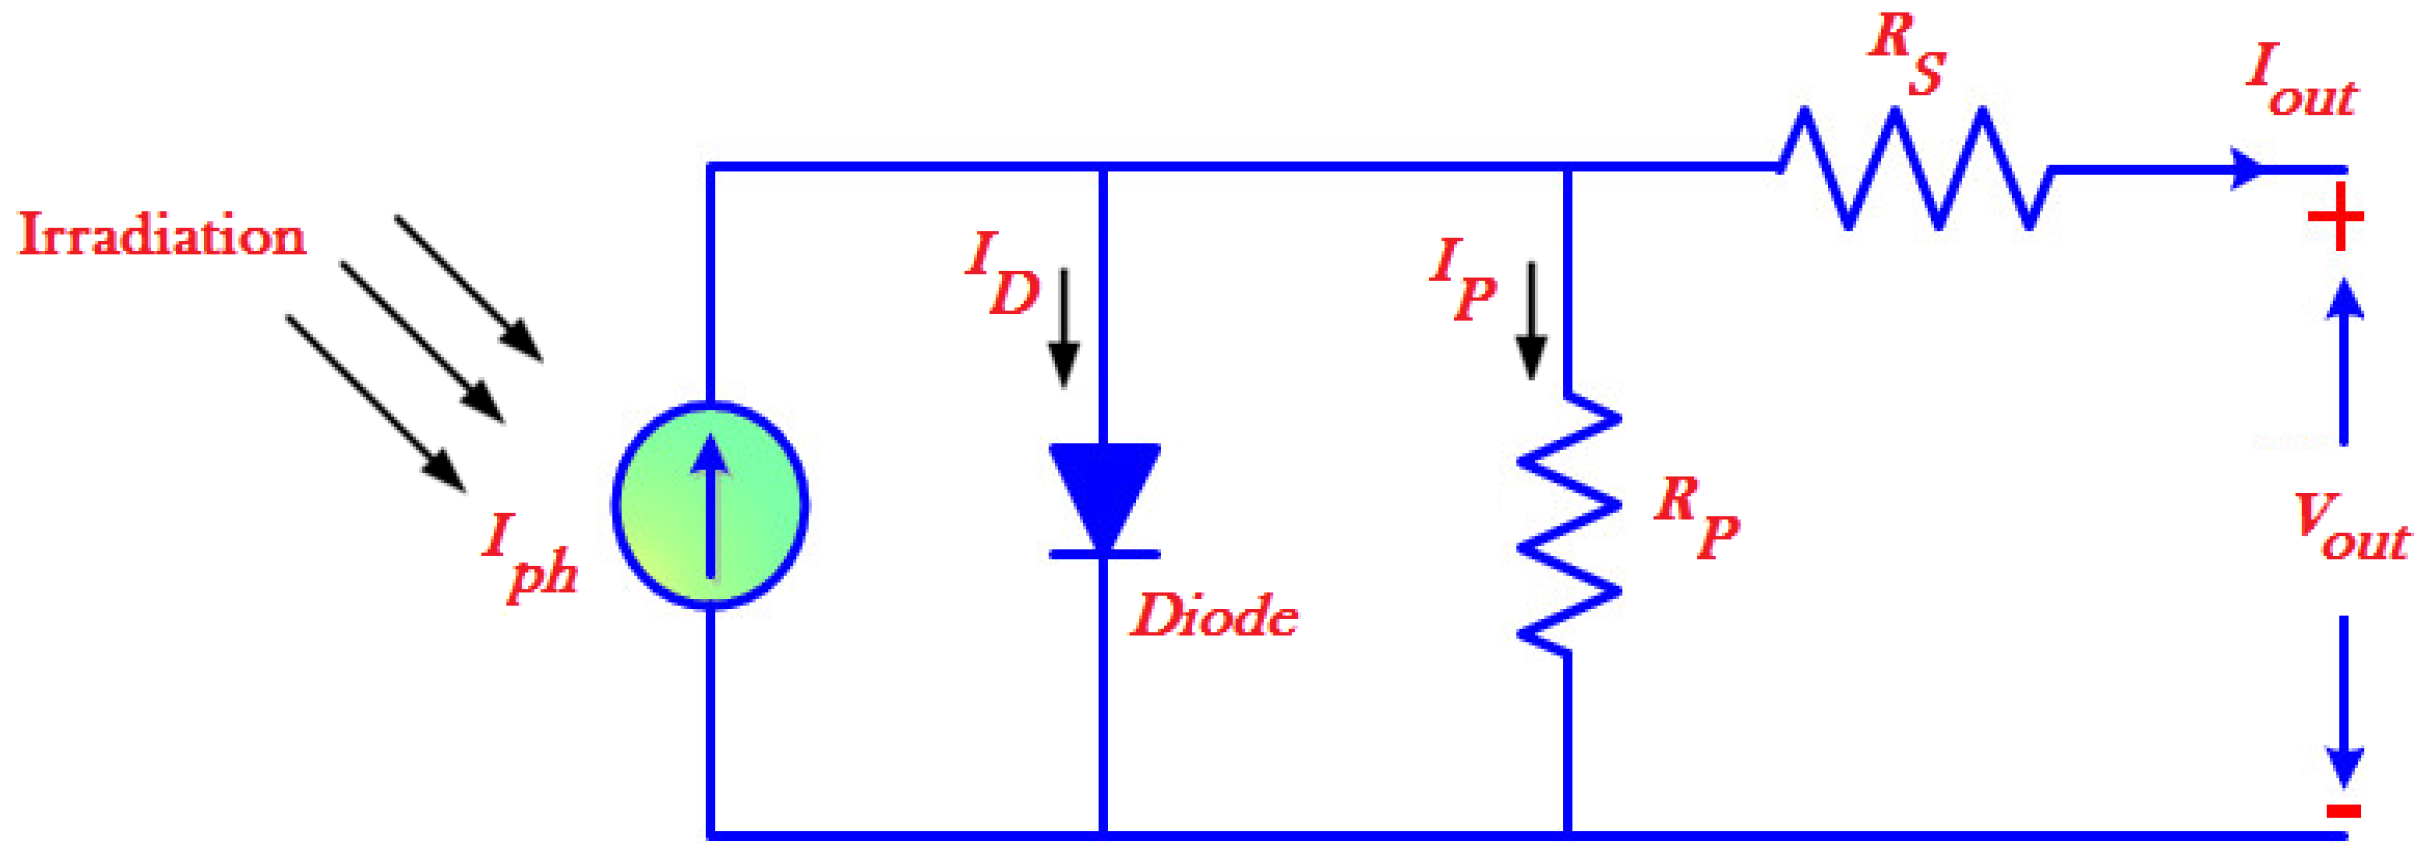
In general, an equivalent circuit of a PV system is used and inserted based on a PNPN diode or Shockley diode, as depicted in Figure 2, which is usually composed of a photo-generated current that depends on irradiation and temperature, an anti-parallel diode declaring non-linear impedance of the P-N junction, and series and shunt inherent resistances accounting for resistive losses [14]. The electrical idiosyncratic of a PV module can be simulated with reference to the differences in the climate conditions like temperature and sun irradiation [15]. By applying Kirchhoff’s current law, the corresponding equations that mathematically depict the I-V curve can be described as follows [16,17]:
The PV module output current is identified by:
where
Iout, Vout: output current (A) and voltage of PV cell (V);
IPh, I0: photocurrent and diode saturation current of PV cell (A);
Rs, RP: series and parallel intrinsic resistances of PV cell (Ω);
q: charge of electron (1.6 × 10⁻¹⁹ c);
A: P-N junction ideality factor;
K: Boltzmann’s gas constant (1.4 × 10⁻²³ J/K);
TC: cell absolute operating temperature (Kelvin);
Where the light-generated current relates to the irradiance, the cell temperature is expressed as follows:
The diode saturation current depends on the cell temperature as follows:
TS: standard test condition (TS = 25 °C, GS = 1000 W/m2);
G: solar irradiation (W/m2);
Ki: short circuit current coefficient;
Eg: band-gap of the PV cell semiconductor.
3.2. Modeling of Boost Converter with MPPT
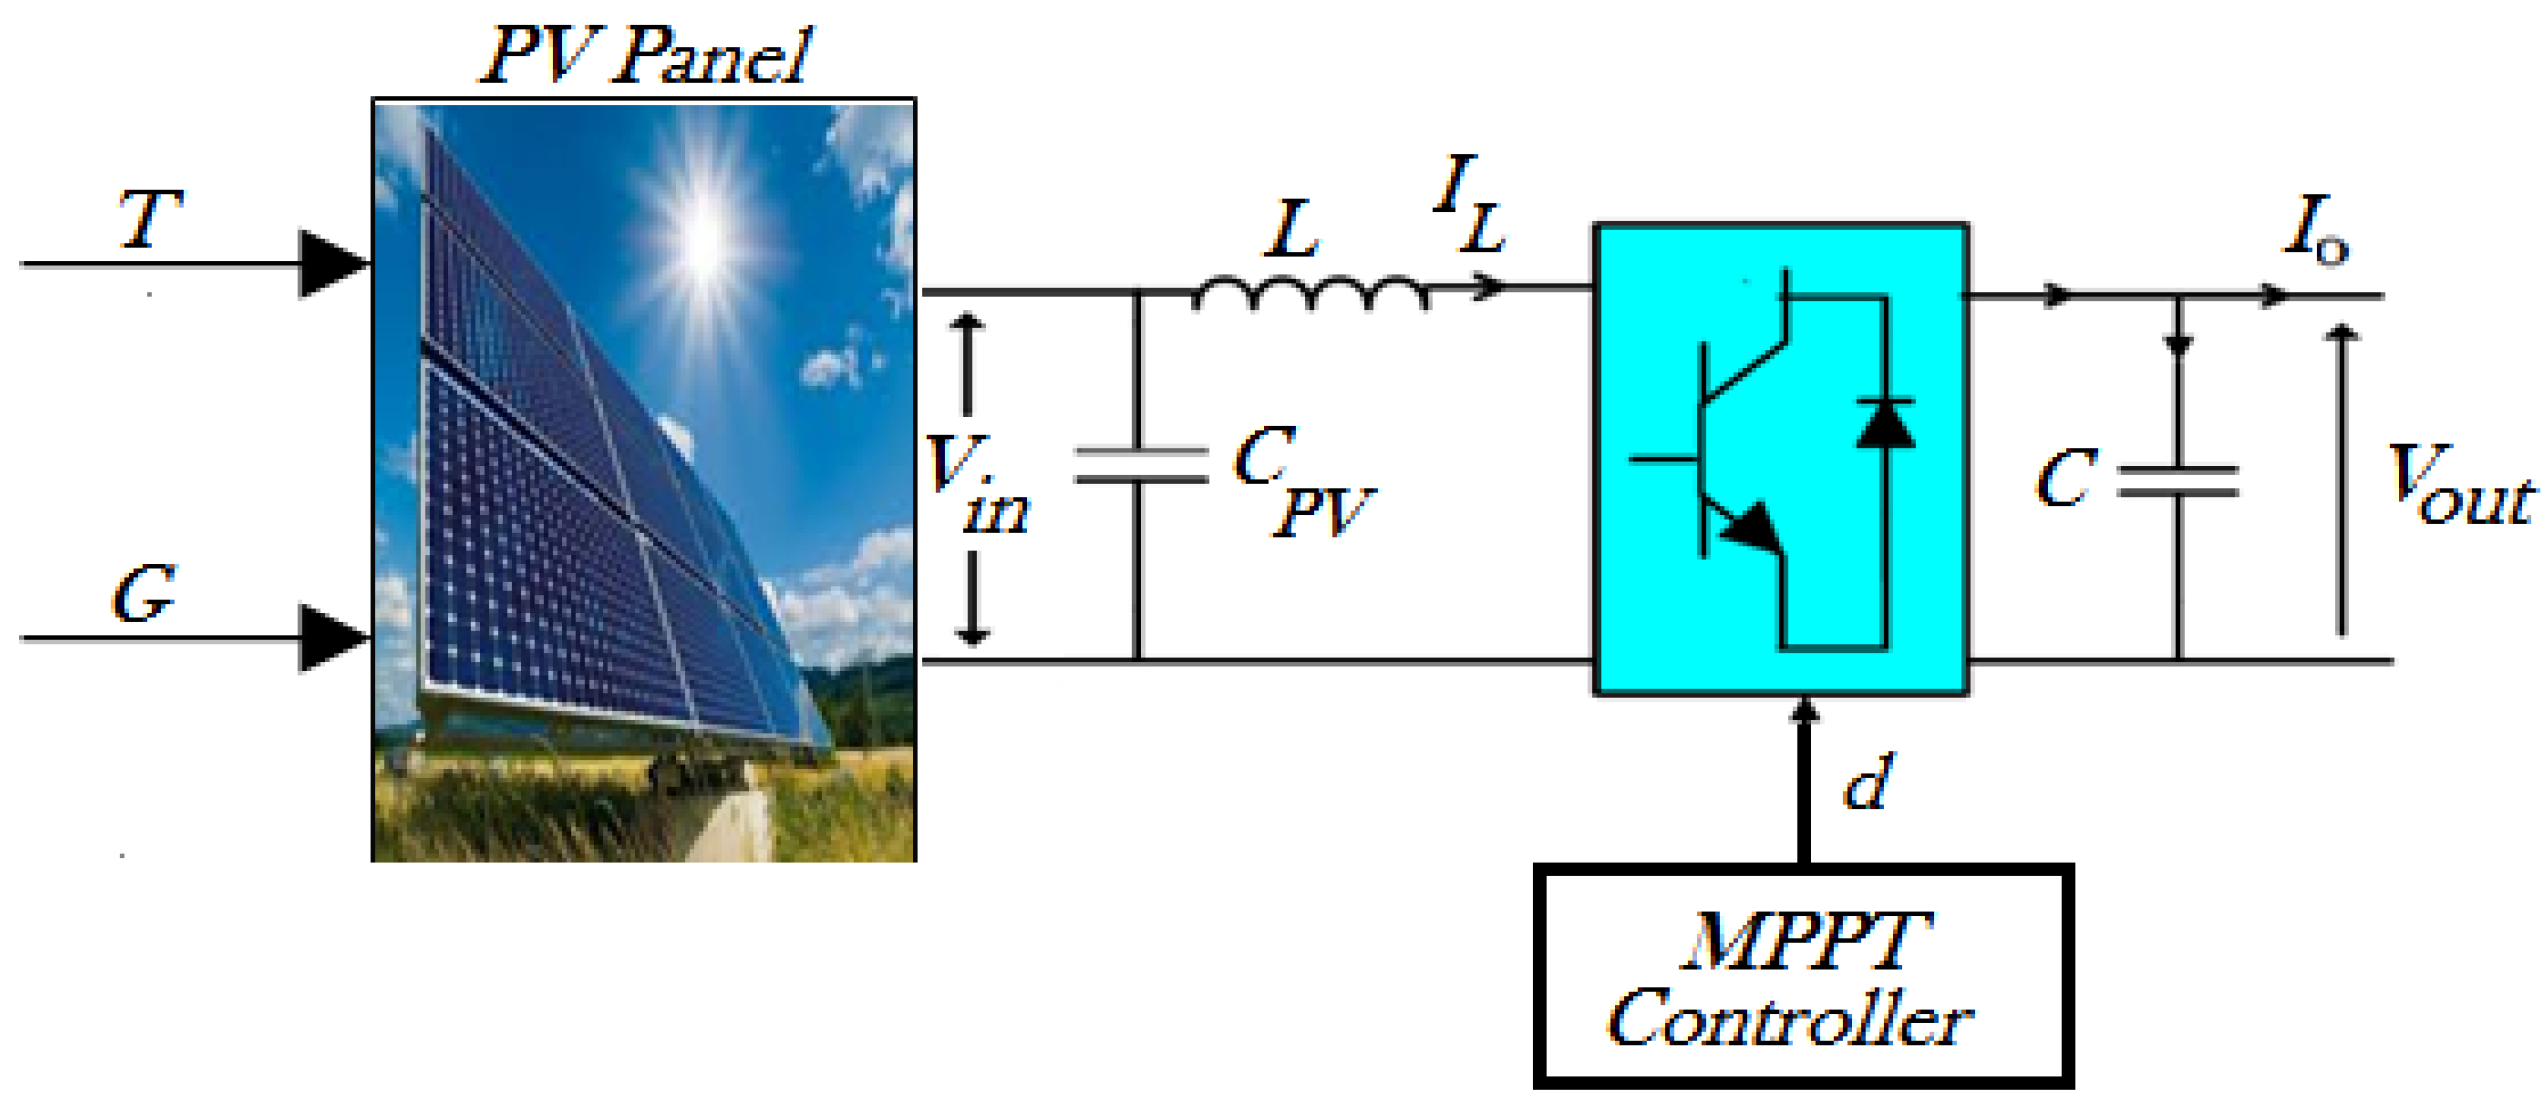
In this manuscript, the DC-DC converter is applied for MPPT. Since the voltage from the PV system has a small magnitude to be converted to AC voltage through DC-AC inverter, the converter topology steps the voltage from the PV array (VMPP = 272 VDC at irradiation of 1000 W/m2) to the desired voltage level (500 VDC). This converter will display a low ripple current on the PV array side [18]. The circuit connection of the DC-DC boost converter to PV array is depicted in Figure 4. Switching the duty cycle is referred to as (D) and is piloted by the MPPT controller that uses the “incremental conductance + integral regulator” method.
The converter topology in the state-space model is demonstrated by the following set of equations [6]:
where,
Vin: input voltage to boost converter and output from PV system;
Vout: desired output voltage from boost converter;
L, C: boost inductance and output capacitance;
D: duty cycle of boost converter switch;
Io: output current from boost converter;
IL: input current to boost converter.
3.3. Incremental Conductance (IC) Based MPPT
This section discusses the solar energy intensity changes through time, and the MPPT algorithm is applied to extract maximum power from the PV in certain operating circumstances [19]. Previous studies have proposed different MPPT methods such as fuzzy logic control, perturb and observe (P&O), and particle swarm optimization [16,17,18,19,20]. In this work, the “incremental conductance + integral regulator” method is applied owing to its simplicity and merit of providing a perfect attitude of fast variation of sun irradiation.
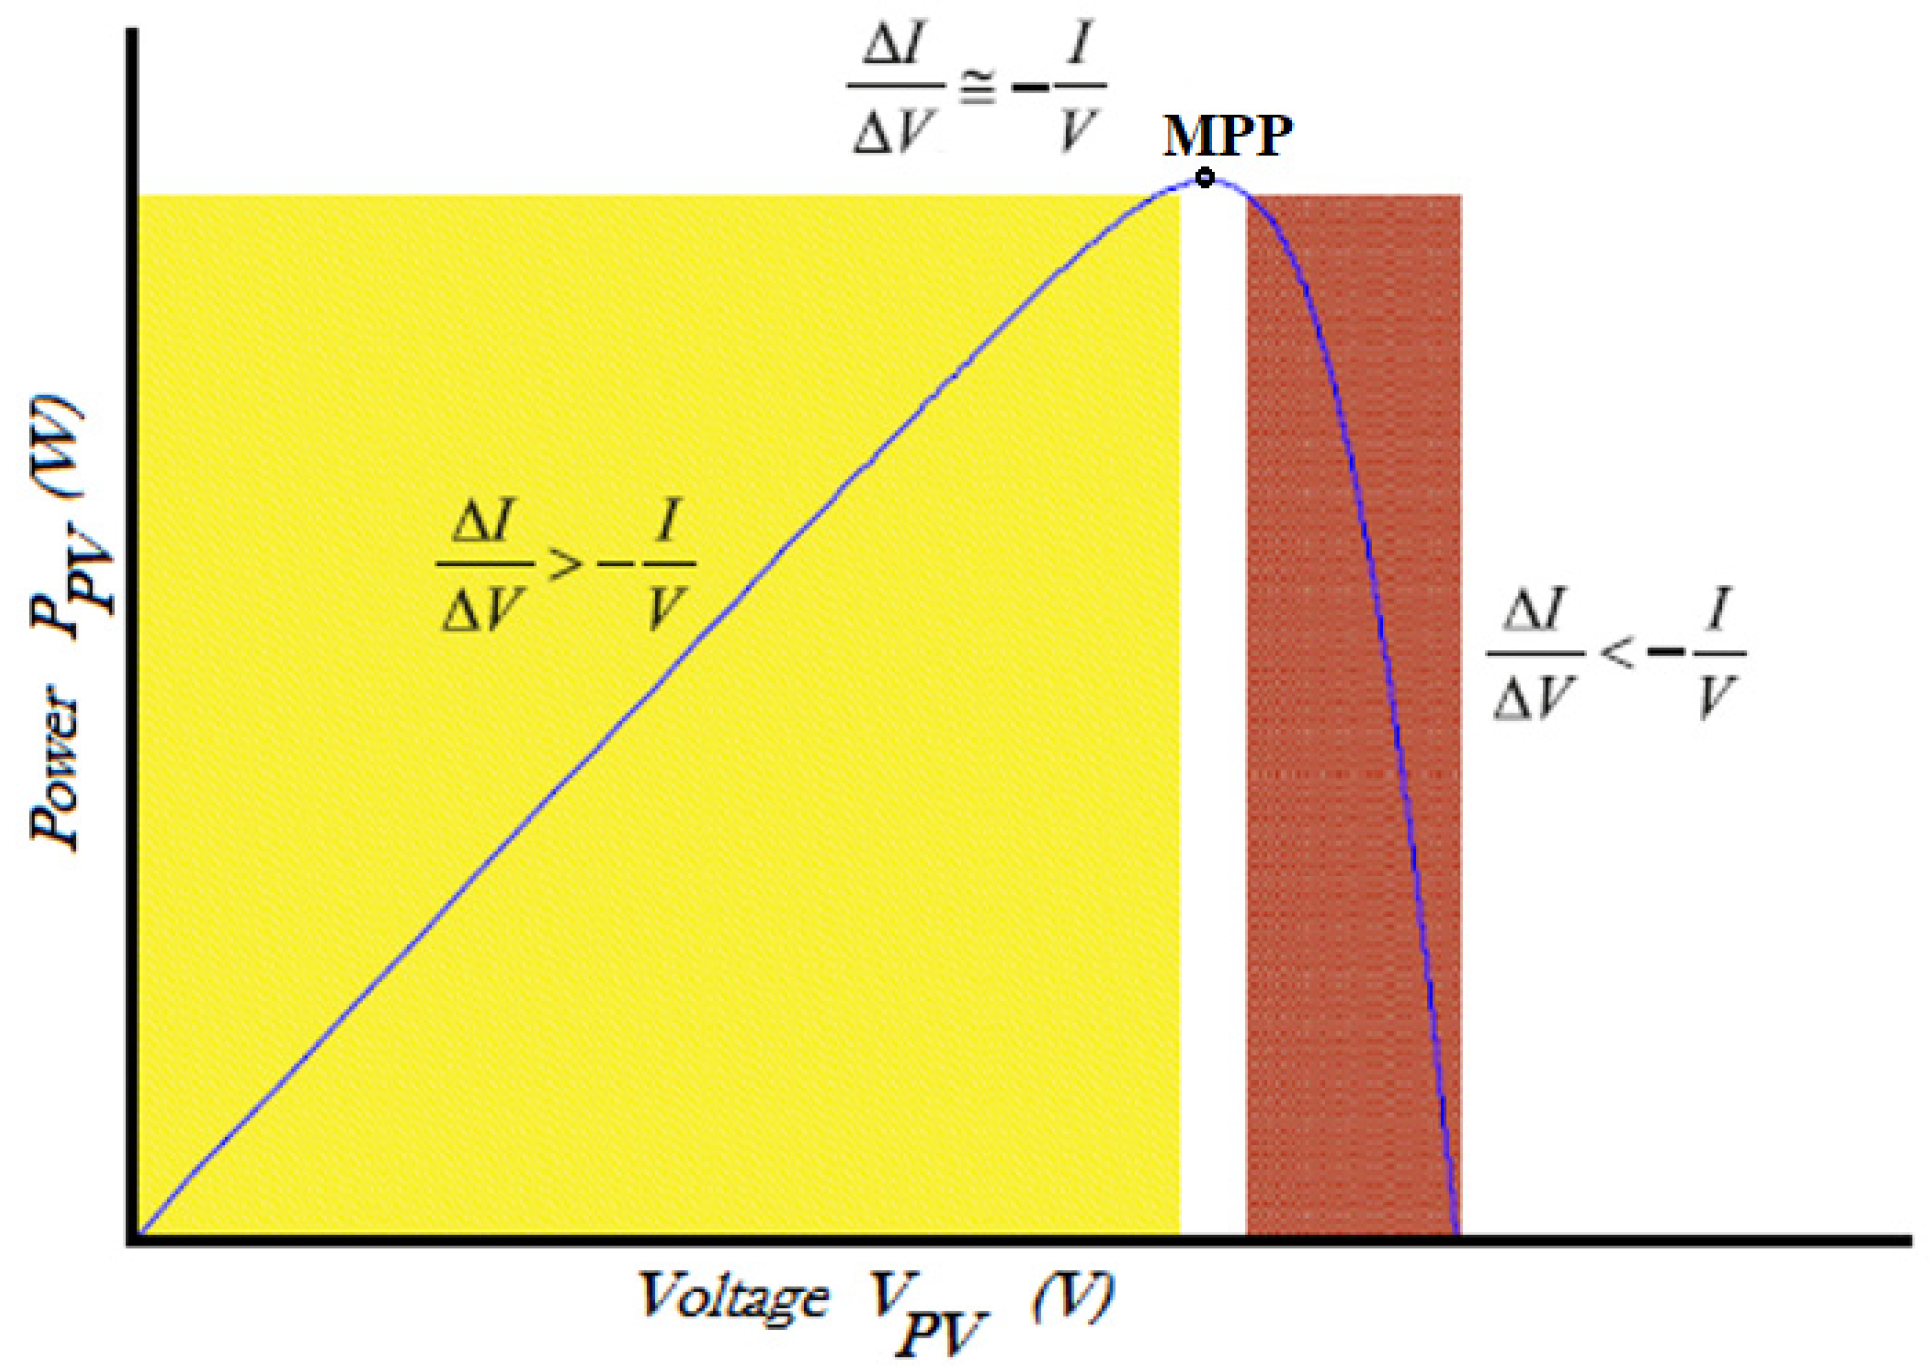
The basic idea of incremental conductance for MPPT on a PV curve is depicted in Figure 5; the slope indicates the derivative of power with regards to voltage (dP/dV), which is null at the MPP, increasing on the left-hand side and decreasing on the right-hand side of MPP [21]. The mathematical model of this method is as follows if the working point is the MPP:
Equation (5) can be reorganized in the following form:
where ΔI & ΔV are the PV increments of current and voltage, respectively. The basic rules for incremental conductance can be derived from the PV curve shown in Figure 5 and is illustrated as:
Using the rules in Equation (6), the basic flow chart based on MPPT incremental conductance is depicted in Figure 6. In this method, the tracking of MPP is obtained by a constant step size (). If the working point is the MPP, the error signal will be (0) whereas at the right or left of the MPP, this error signal is regulated by an integral regulator switch to adjust PV output voltage.
3.4. DC/AC Inverter Controller
The proposed scheme of inverter control is shown in Figure 7. The main objective is performed to set the DC-link voltage, inject real power control, and make the power factor equal to one at PCC. This control is helpful for its decoupled control ability and quick dynamics [22].
Then,
Converting Equation (7) into d-q synchronous rotating frame gives the voltage balance across the line:
where,
Vabc, Iabc: voltage and current at DC-AC converter;
ω: grid frequency;
Rf, Lf: resistance and inductance of RL filter;
Cbus: DC-link capacitor;
Vdc: DC-link voltage.
The phase locked loop is known as a closed loop control. The main purpose of PLL is the estimation of the grid angle voltage (θ) for d-q coordinates. Therefore, there is an accurate synchronization among inverter output voltage based on grid voltage and current.
The DC-link control loop of voltage is accountable for arranging DC-link voltage at a stable given value.
The reference DC voltage is compared with the present value and the difference is used for the PI controller in order to adjust voltage at 500 V DC; the output is applied as direct-axis reference (Id-ref) for the inner-current controller.
The current controllers independently loop the direct and quadrature axis (Id & Iq) for grid currents. The (Id-ref) is obtained from the DC-link voltage control whereas the (Iq-ref) is imposed to zero to guarantee a power factor equal to one. Since the direct axis is aligned with the grid voltage vector (Vd), the quadrature axis grid voltage (Vq) is imposed to zero. Thus, the real and reactive power can be adjusted separately by means of Id and Iq, respectively.
Then,
Output voltage Vd-ref and Vq-ref from the current controller loop are transformed to three various modulating signals: Uref (a), Uref (b), and Uref (c). The three levels of PWM technique use these signals to produce IGBTs switching pulses.
4. Wind Power Description
In this part, the mechanical modeling of the WT and its performance are introduced. In addition to the doubly fed generator (DFIG) model, the two controllers’ rotor-side and grid-side converters of the DFIG and MPPT method are discussed.
4.1. Wind Turbine (WT) Model
The wind turbine is modeled by an aerodynamic input torque that drives a DFIG. The captured mechanical power (Pmech) that is produced by the turbine is dependent on the wind velocity and is described mathematically as follows [23]:
where,
Pmech: mechanical output power of WT (watt);
CP: turbine power coefficient;
λt: tip speed ratio of rotor blade;
βP: blade pitch angle in degrees;
ρair: air density (kg/m3);
At: turbine swept area (m2);
Vw: wind speed (m/s).
The power coefficient is a combination of the blade pitch angle and tip speed ratio and can be calculated using the mathematical relation as follows:
The value of the constants (C1–C6) depends on the type of WT and manufacturer [23]. The coefficients (C1–C6) are given as (0.5176, 116, 0.4, 5, 21, and 0.0068), where λi is known as:
Equations from (11)–(13) have been applied in developing the mathematical model of WT. Moreover, Equation (11) is normalized into a per unit system as follows:
where,
Pmech-pu: the nominal power for values A and ρ;
Cp-pu: performance coefficient of Cp maximum value;
VW-pu: the base wind speed;
Kp: power gain for Cp-pu =1 pu & Vpu =1 pu.
4.2. DFIG Model
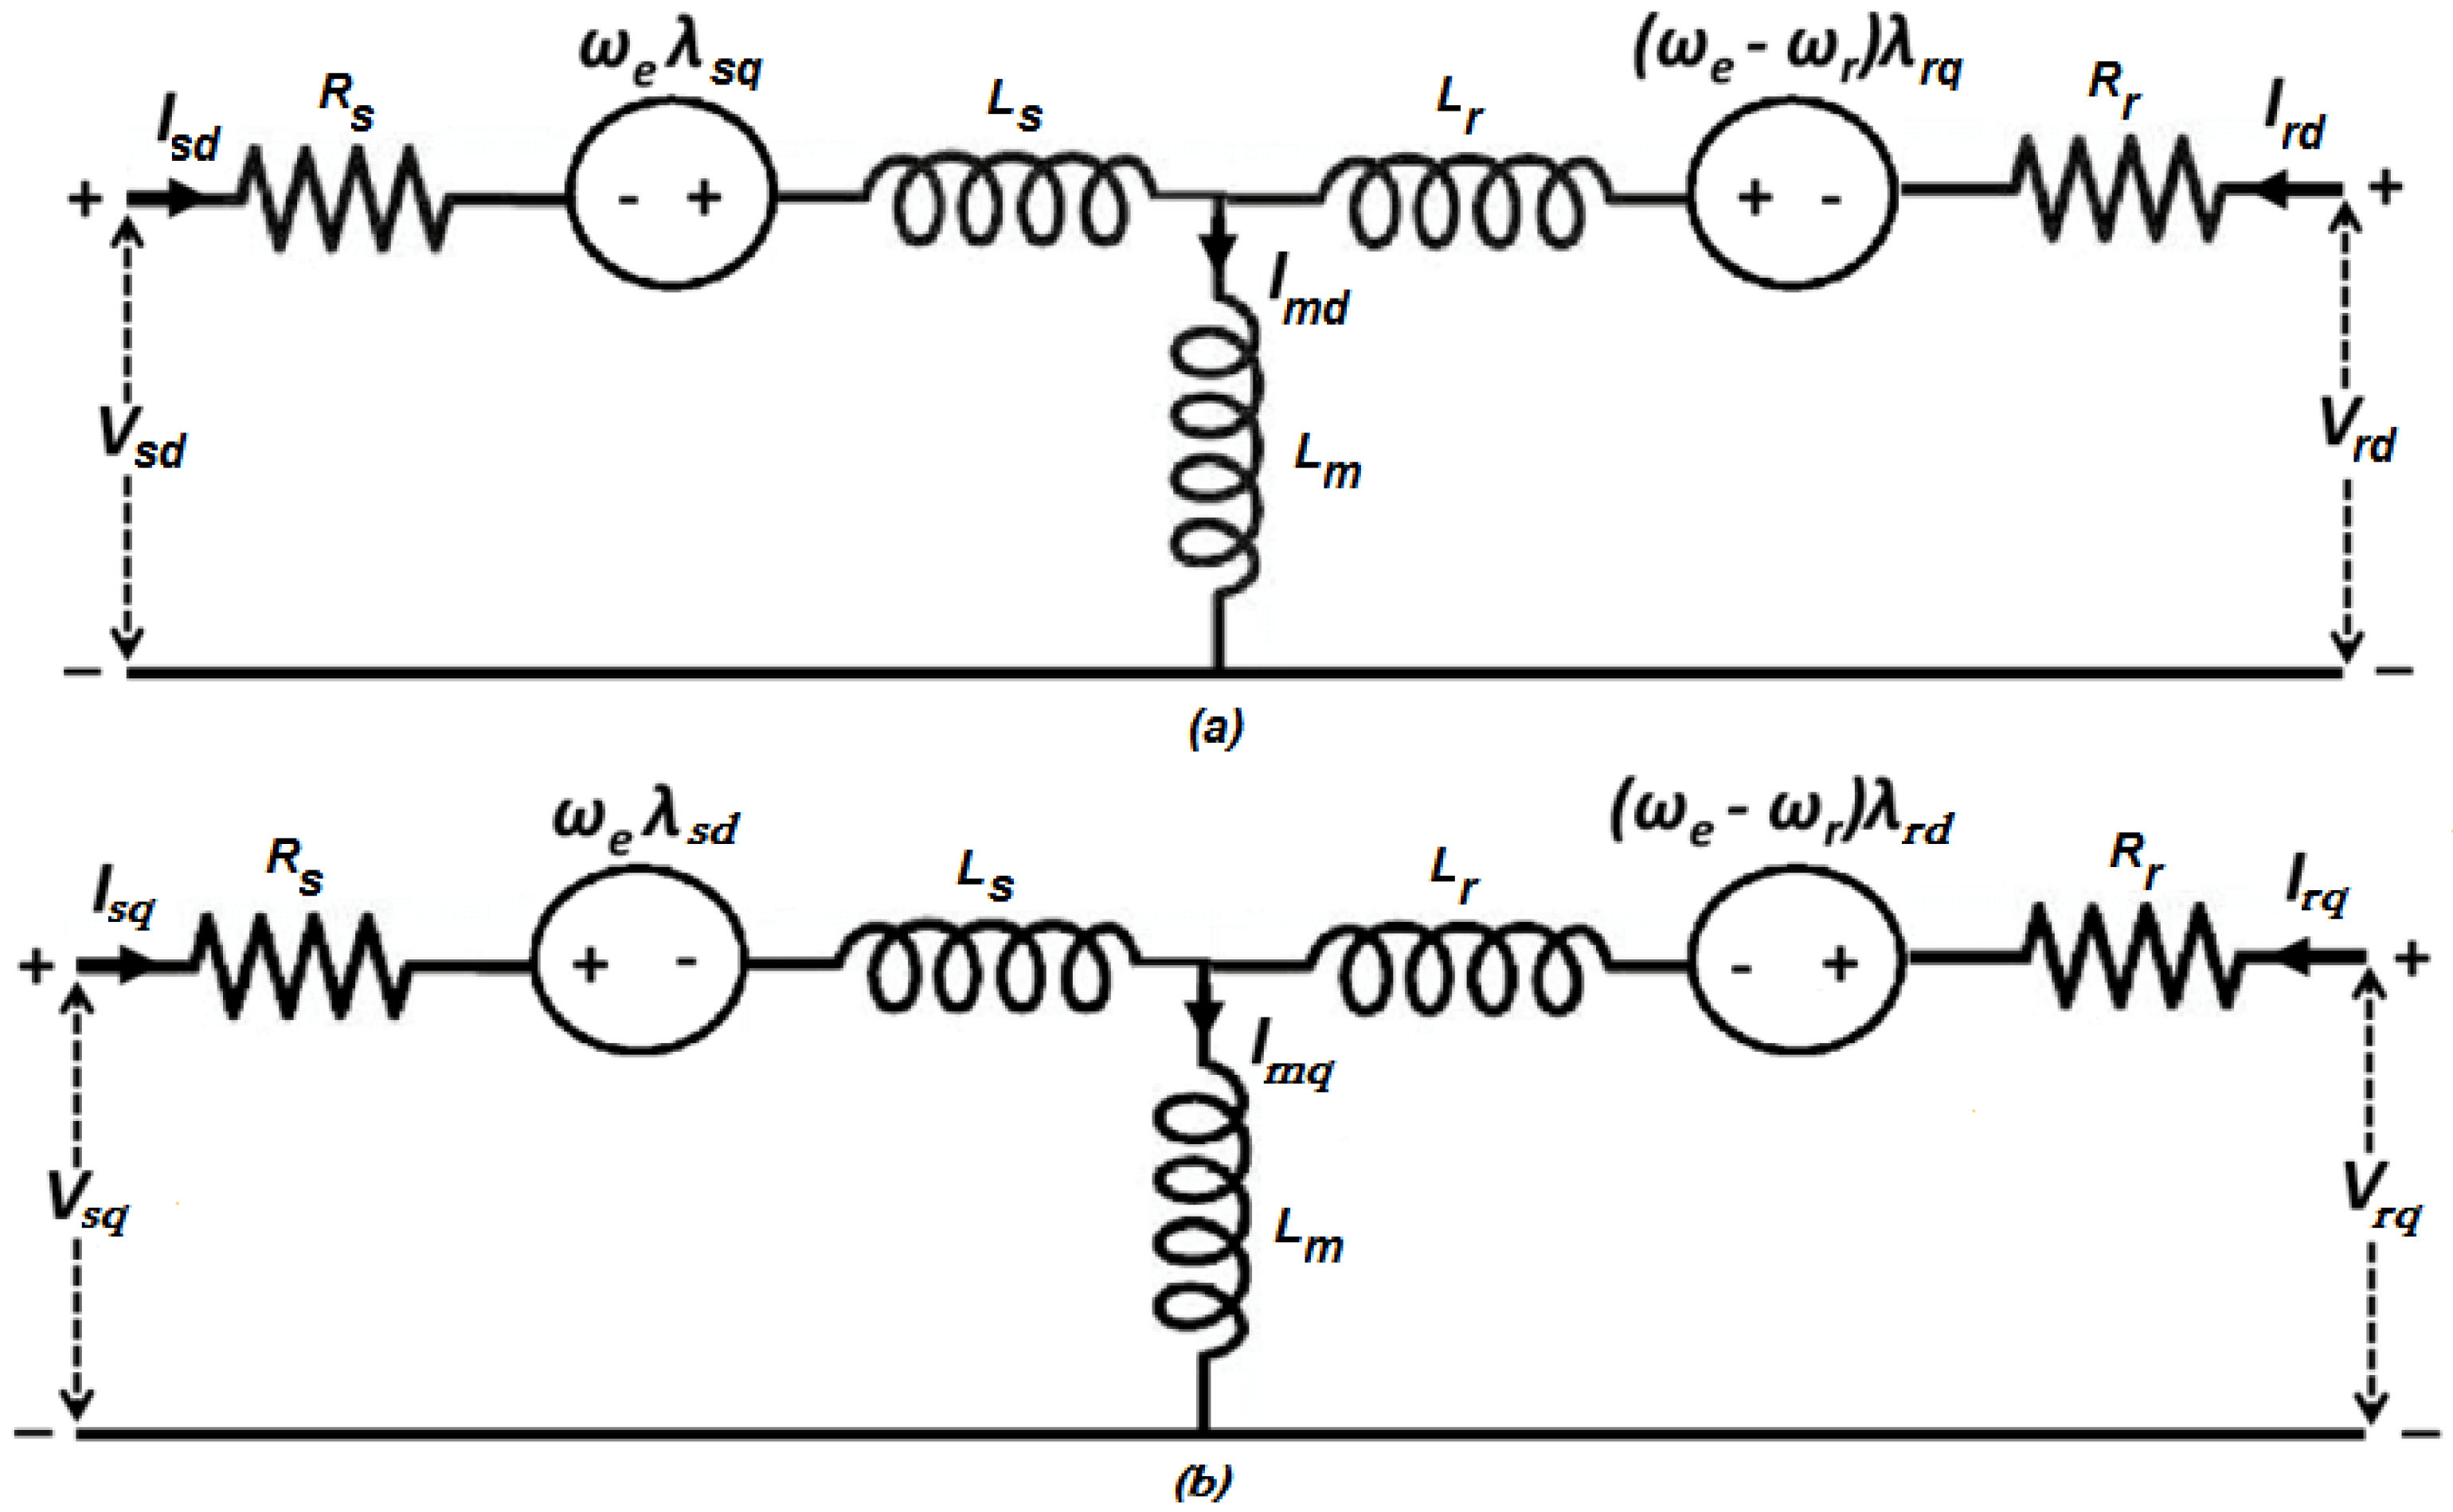
The DFIG is a wound rotor induction generator and is preferred in wind power due to its small size with higher MVA ratings, reduced inverter rating, variable generator speed, fixed frequency operation, and improved system performance as well as producing power at the stator terminals at a fixed voltage and frequency regardless of generator speed. DFIG requires only handling a fraction (25–30%) of the overall power to obtain entire control of generator. In the suggested control scheme, a stator flux oriented control (SFOC) is applied separately to the control of the real and reactive power on the stator side. The DFIG park model can be represented by the equivalent circuits in direct-quadrature (d-q) reference frame as depicted in Figure 9.
The stator and rotor equations of DFIG modeling in flux linkage can be described as follows [24]:
The electrical mathematical modeling of DFIG in the d-q synchronous rotating frame for the stator and rotor voltage equations under balanced operating conditions can be written as follows [25]:
where is the slip speed. The expression of the electromagnetic torque for the DFIG can be described as follows:
where,
λsd, λsq: stator flux d-q components;
λrd, λrq: rotor flux d-q components;
isd, isq: stator current d-q components;
ird, irq: rotor current d-q components;
Rs, Ls: stator resistance & stator self-inductance of DFIG;
Rr, Lr: rotor resistance & rotor self-inductance of DFIG;
Lm: magnetizing inductance of DFIG;
Vsd, Vsq: stator voltage d-q component;
Vrd, Vrq: rotor voltage d-q component;
ωe: angular velocity;
ωr: rotational speed of rotor;
σ: leakage factor;
±δ: fixed step size;
ims: stator magnetizing current;
P: number of pole pairs;
m: stator modulation factor.
The instantaneous real and reactive power equations of the stator and rotor windings in terms of two axis voltage and current are defined as follows [12]:
From the above equations, it is obvious that the injected power to electrical grid can be controlled by controlling the rotor current d-q components. The design specifications of DFIG are given in Table 3.
4.3. Rotor Side Converter of DFIG
The major assignment of RSC is employed to obtain MPPT and control the inoculated reactive power by the DFIG to maintain the stator at a power factor equal to one [26]. For flux , orientation of the stator along the synchronously rotating d-axis, = , therefore = 0. Hence, using (15) and (16), the stator currents and voltages d-q components can be represented as:
The rotor voltage references d-q components and can be described with the stator flux orientation of the d-axis using (15) and (16) as follows:
where is the slip speed, is the leakage factor, is the magnetizing current, and and are the control outputs of the PI controllers. By substituting (20) in (17) and (18), the stator real and reactive powers and the electromagnetic torque are expressed by the following equations [27]:
The suggested control for the RSC scheme is illustrated in Figure 10. The q-axis rotor voltage reference () can be created via an MPPT controller after computing reference torque . The d-axis rotor voltage reference () can be produced from the control loop of reactive power. The reference of reactive power () is equal to zero; thus, it is considered that the required reactive power for the DFIG can be drawn from GSC and maintain the stator at a power factor equal to one [12].
4.4. Grid Side Converter of DGIG
The major assignment of GSC is employed to maintain a DC-link voltage constant regardless of the value and trend of rotor power flow and is also used to produce or absorb reactive power and to maintain a power factor equal to one at the connection point to the utility grid. The set of voltage equations for GSC can be described as follows:
where Rf and Lf are the resistance and self-inductance coefficient for the line inductors, respectively, and iagc, ibgc, icgc are the line currents and Vagc, Vbgc, Vcgc are the converter voltages. By applying the three phase to two phase transformations, the grid side converter voltage equations can be converted into a d-q reference frame synchronously as follows:
The d-axis of the reference frame through the grid voltage vector is aligned, then =||, so = 0. Therefore using Equation (18), the active power and the DC-bus voltage can be illustrated via , whereas the reactive power can be controlled via , as follows:
Finally, the DC-link voltage can be written as follows:
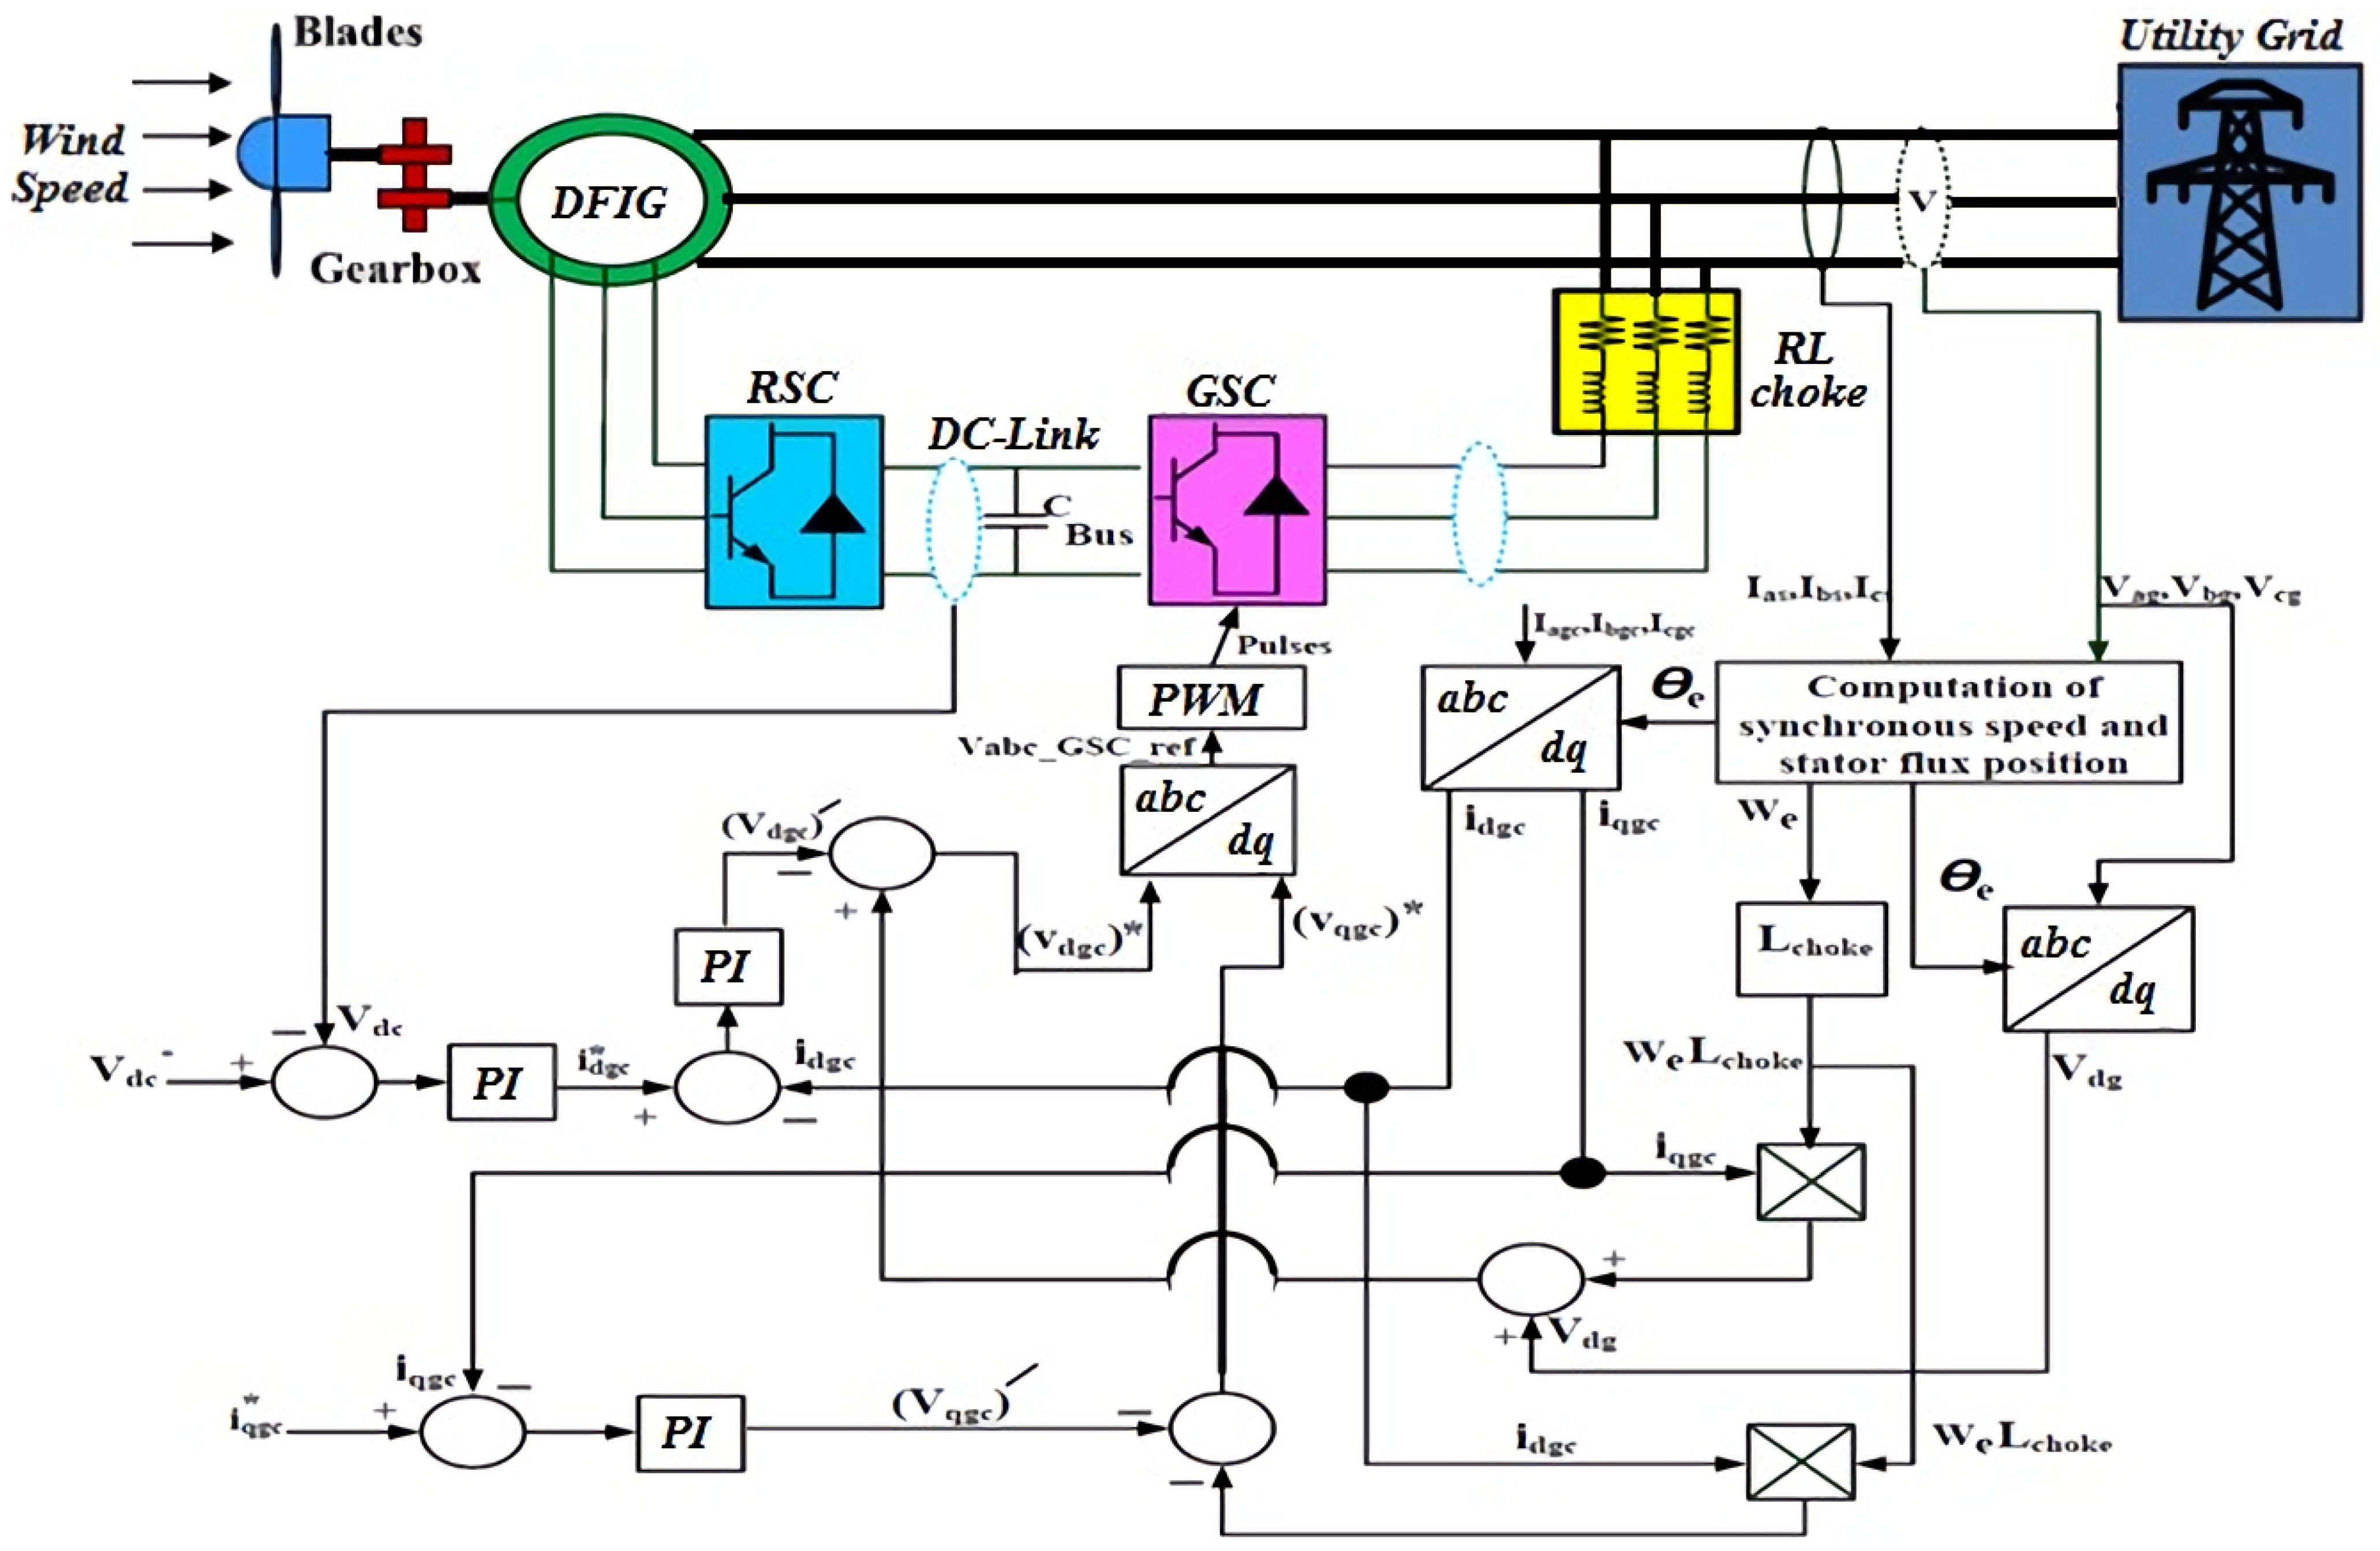
The suggested control structure of the grid side is shown in Figure 11. The GSC is a regulated PWM converter, with d-axis current () set to DC-bus voltage and the q-axis current () set to the exchanged reactive power with the utility grid. The q-axis current reference () is adjusted to (0) to maintain the utility grid at a power factor equal to one. The d-q reference components for the GSC voltage for current regulation can be represented as follows:
4.5. Improved MPPT for Wind Energy Conversion System (WECS)
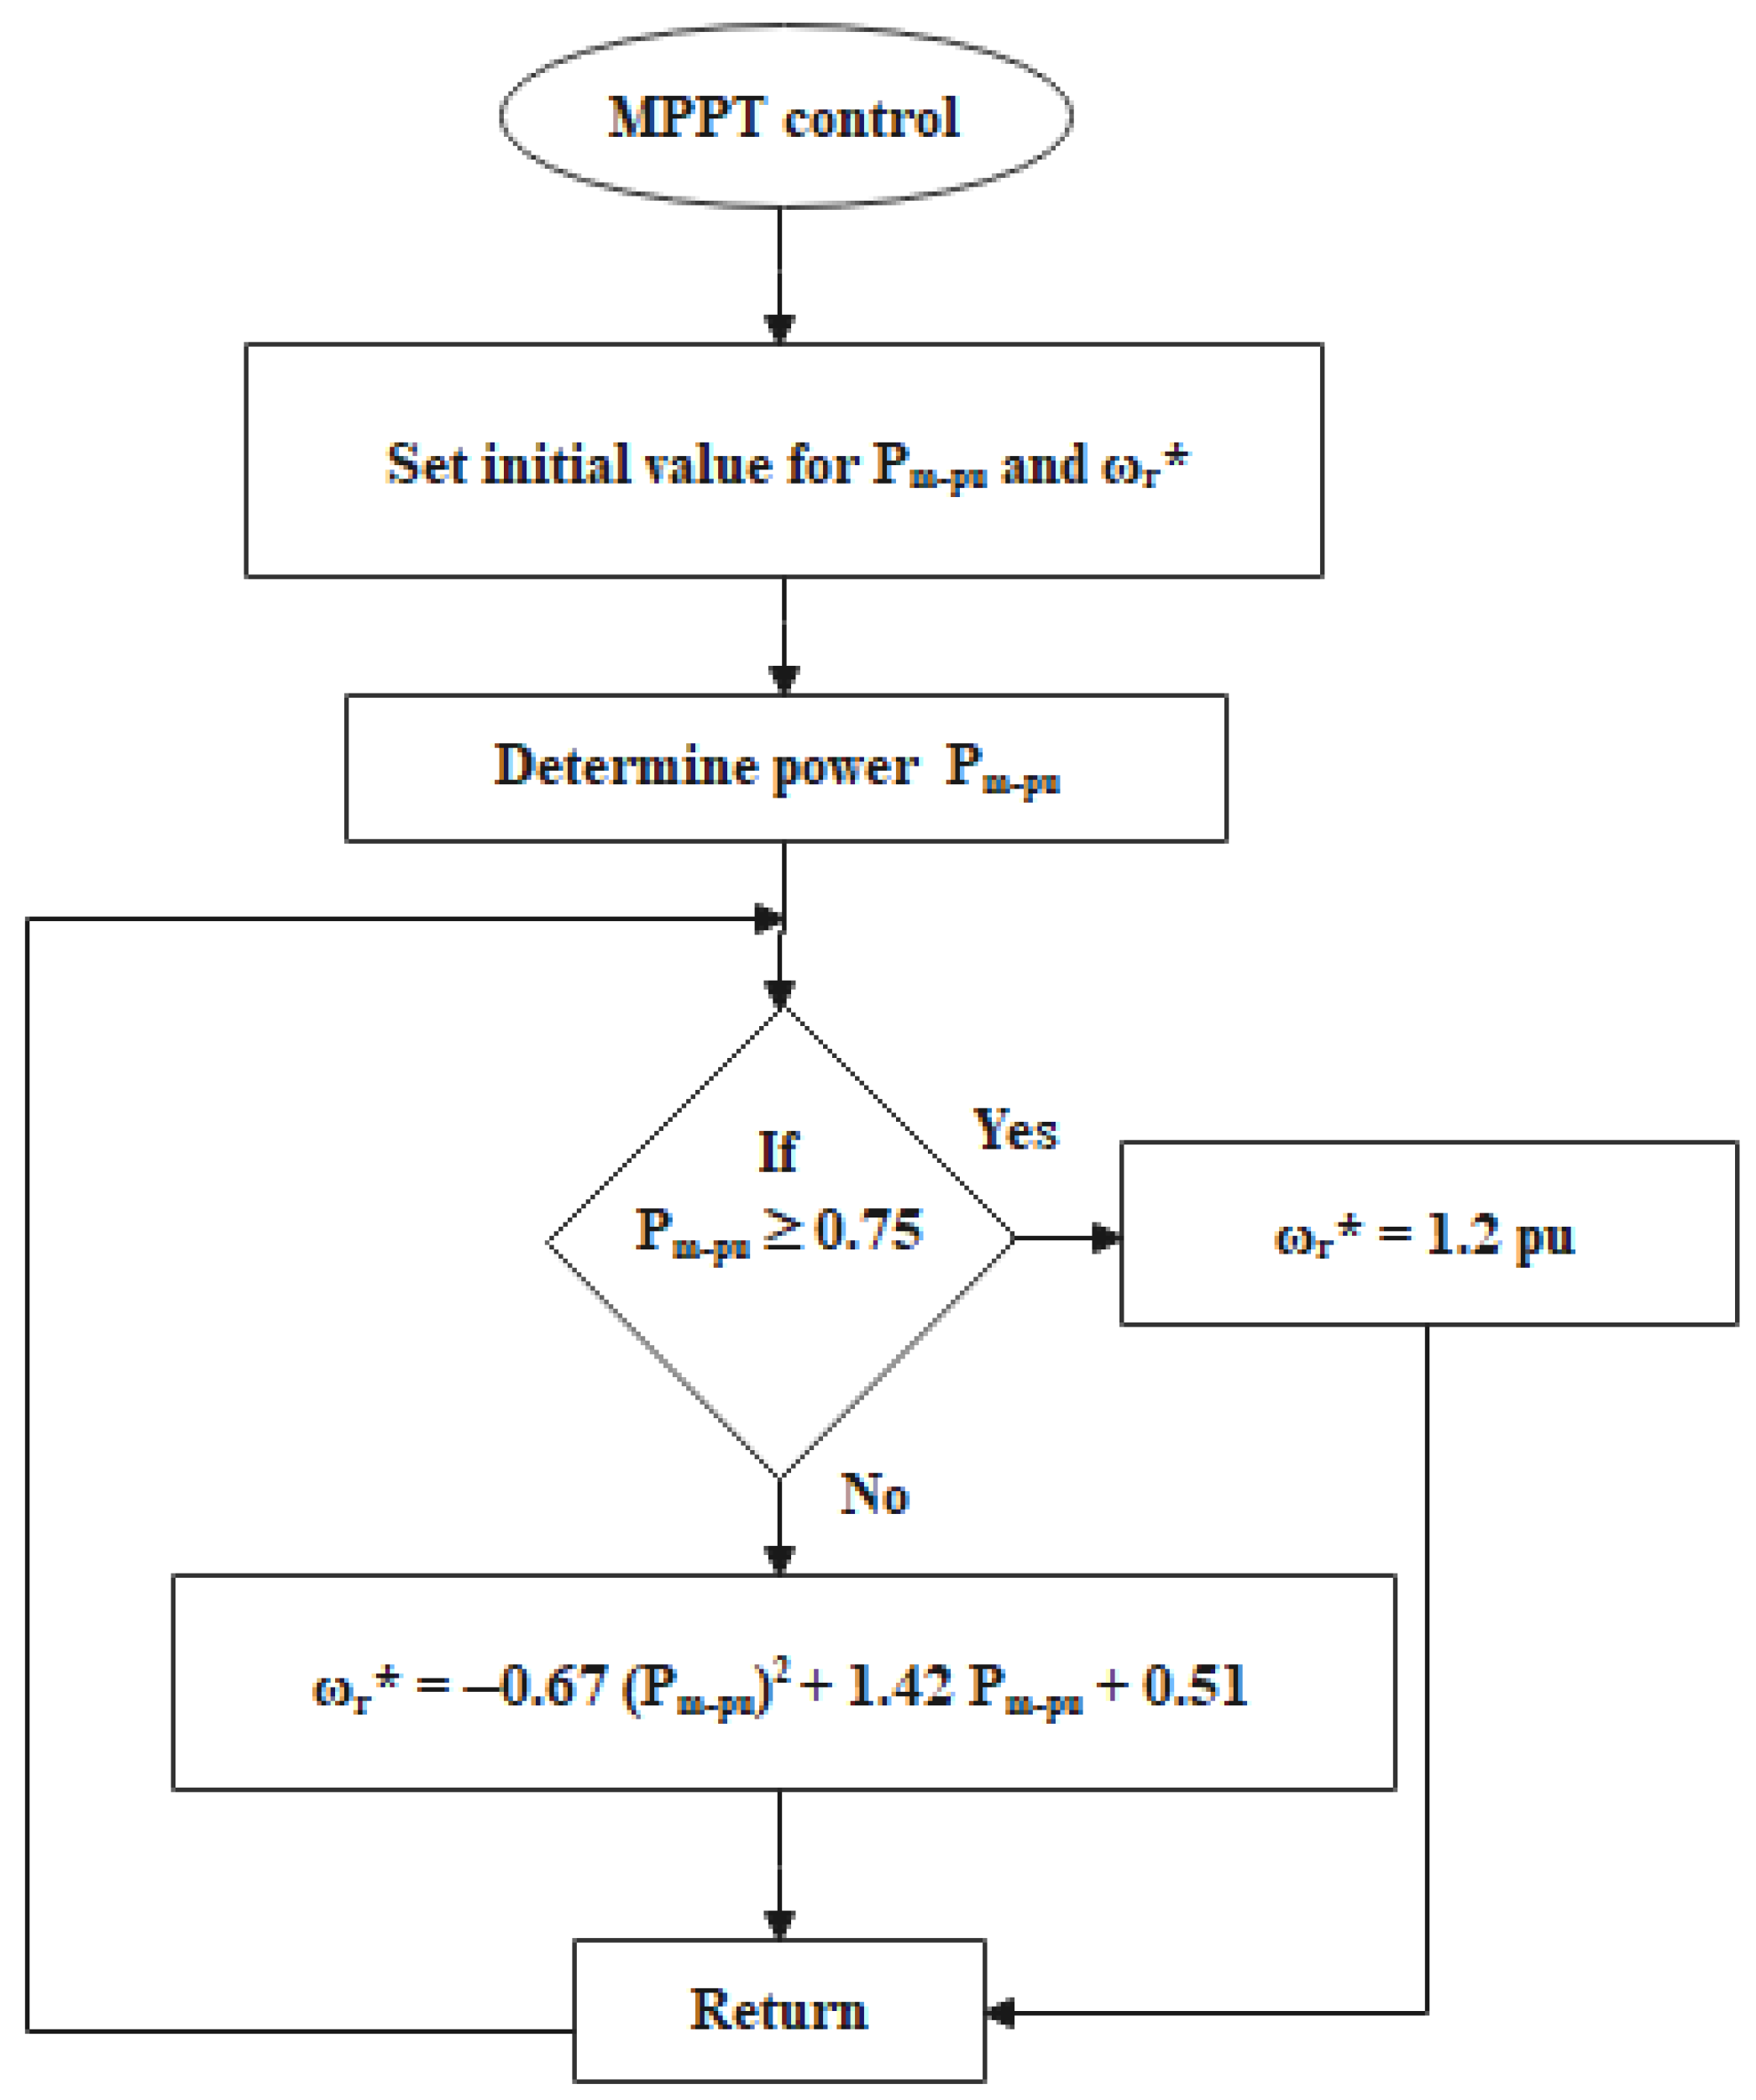
The maximum power from WT is removed at optimal speed of the rotor (). Accordingly, if wind speed changes, the MPPT controller computes the rotational speed () to track the MPP. Since the popular MPPT controllers with measurement of wind speed and WT performance, the error in modelling of WT and obscurity of accuracies in the sensors will impact the setting of the MPPT [28]. The proposed MPPT flow chart is represented in Figure 12. The MPPT depends on the mechanical power (Pm-pu) to define the optimal rotational speed (), which is generally 1.2 pu, but for mechanical power (Pm-pu) levels can be less than 75% and are described as follows [29]:
5. Results and Discussion
The represented model of the hybrid PV/wind system illustrated in Figure 1 was simulated using MATLAB software to demonstrate its performance. Figure 13 depicts the overall simulated diagram of a 10-MW hybrid PV/wind connected to the utility grid. The system was analyzed at different operating circumstances, such as wind speed and sun radiation. This study examined detailed dynamic modeling, control and simulation of a solar PV- and DFIG-based wind hybrid system interconnected to the utility grid, and variations in the AC load power and dispatch power to the distribution grid. The simulation was investigated in three case studies: system attitude of the PV, wind, and hybrid PV/wind. The simulation outcomes indicated that the presented control successfully performed the required system attitude.
5.1. Case (I): System Performance of PV
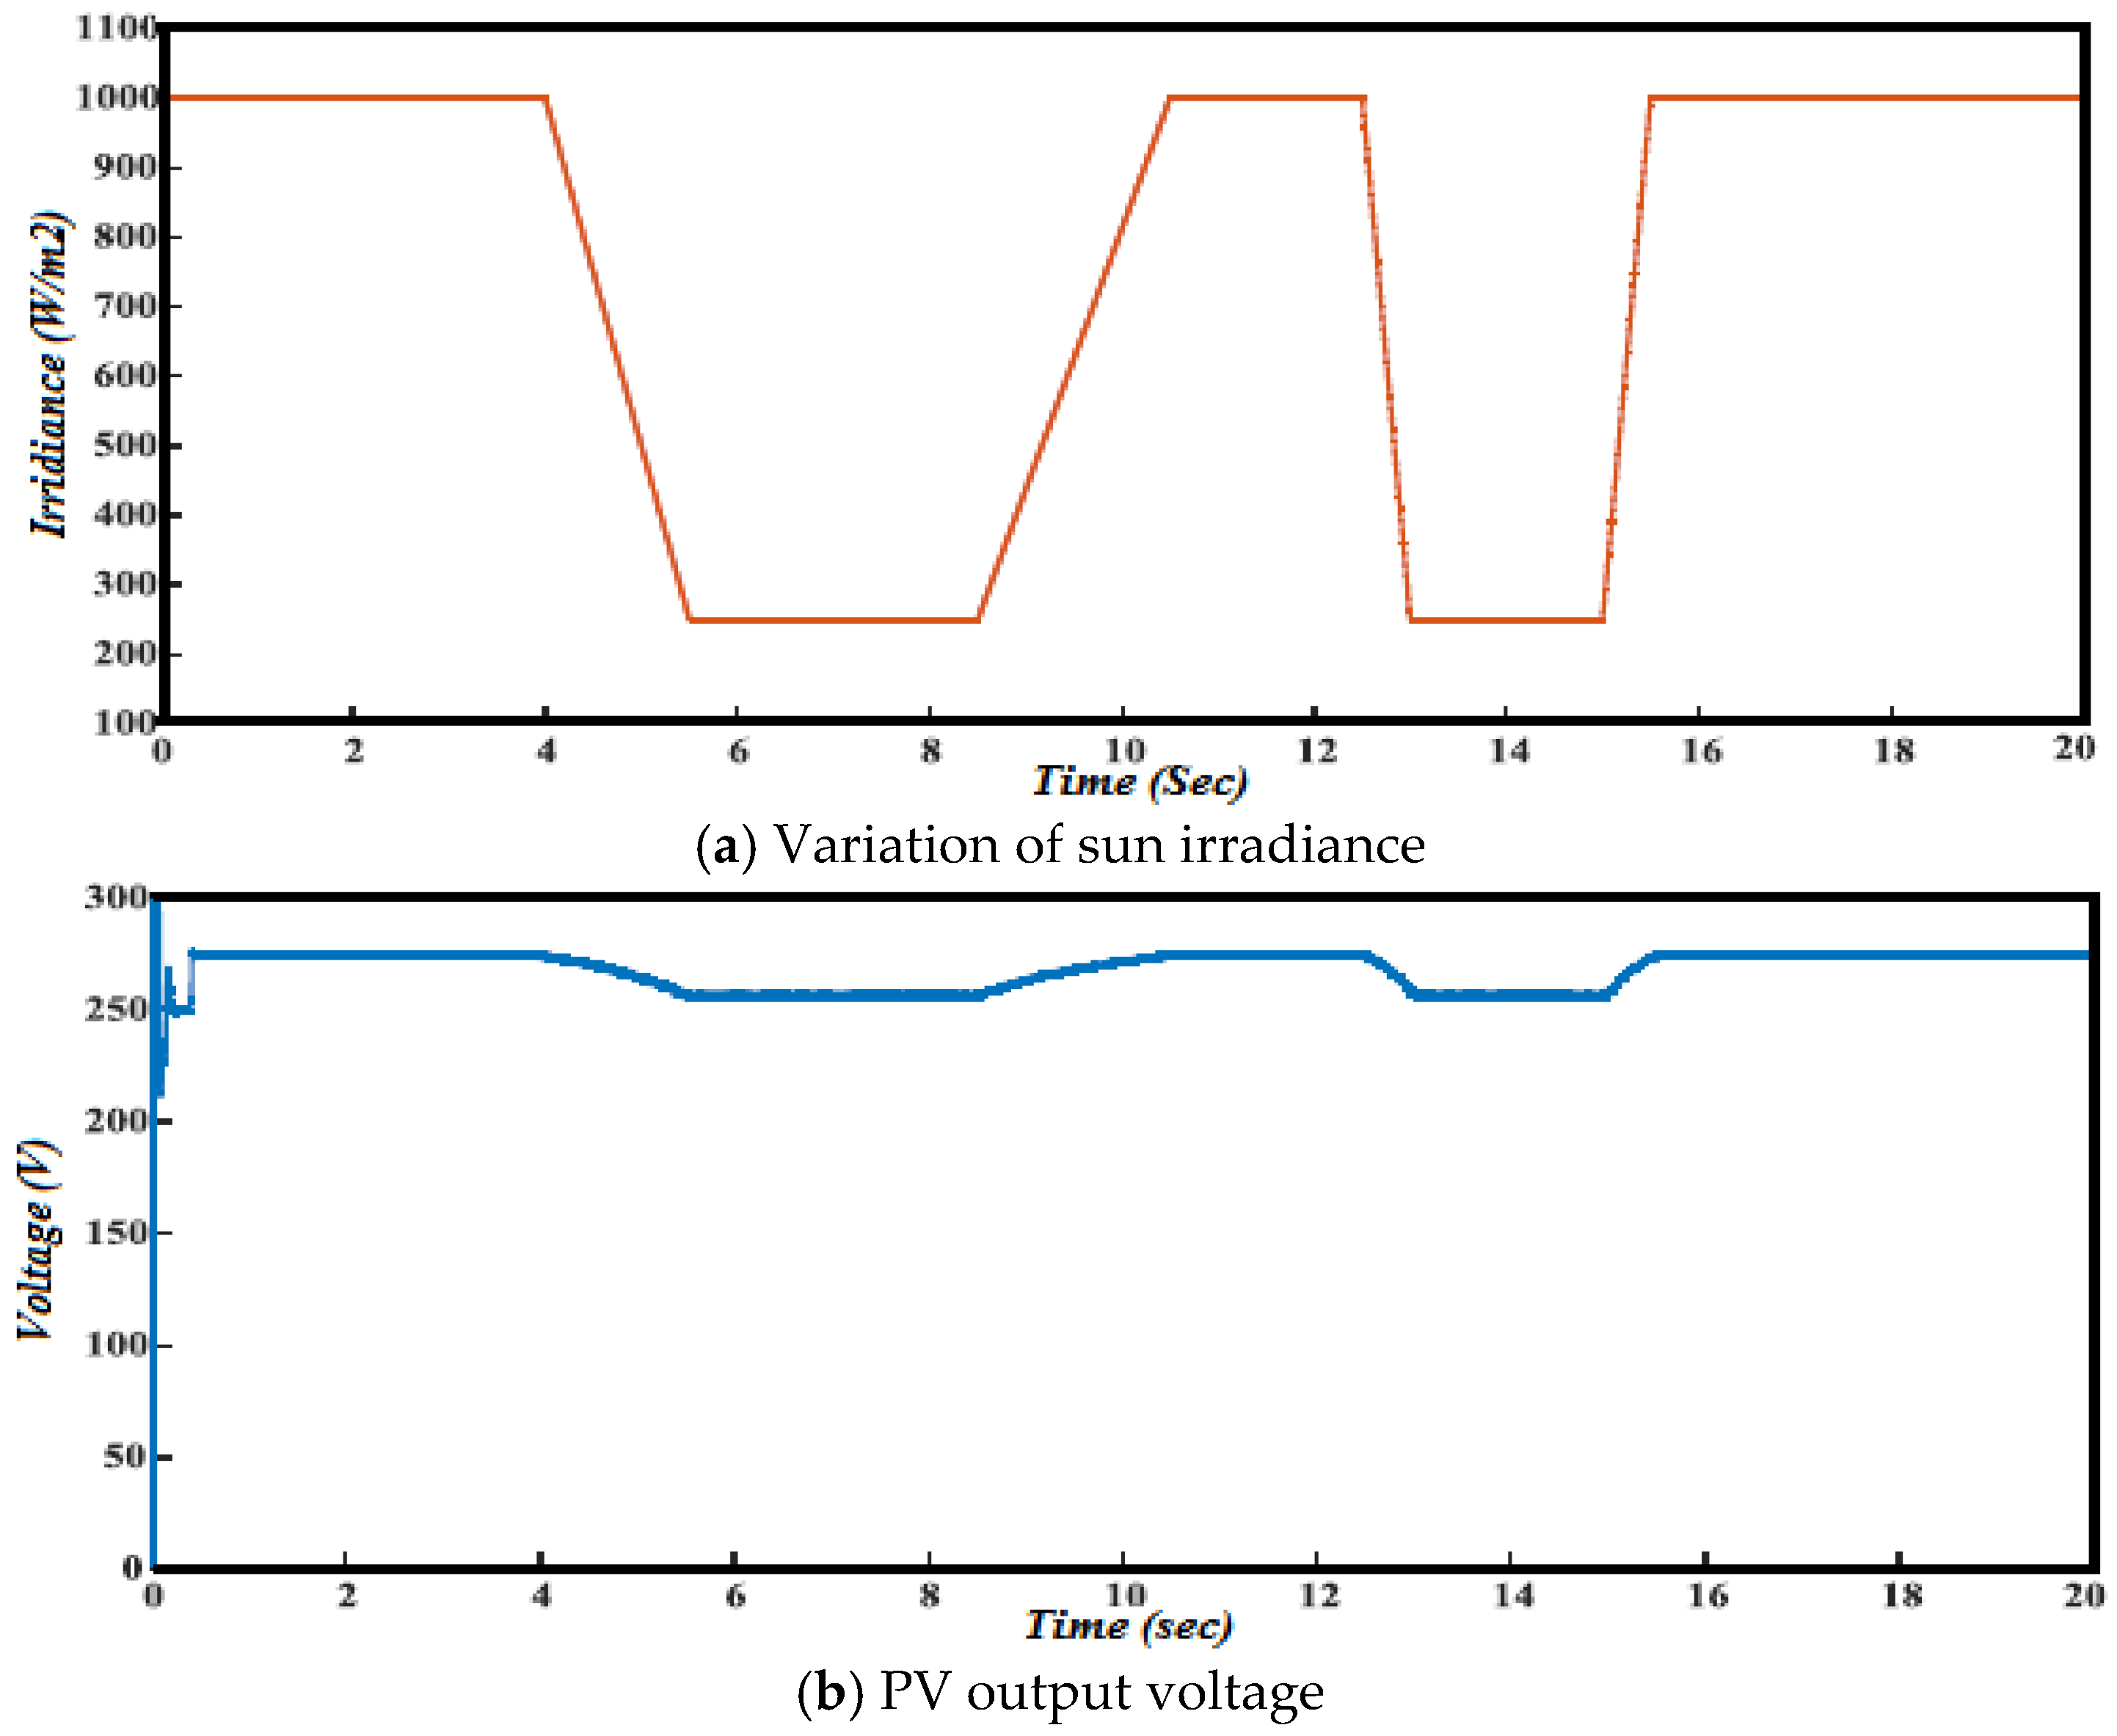
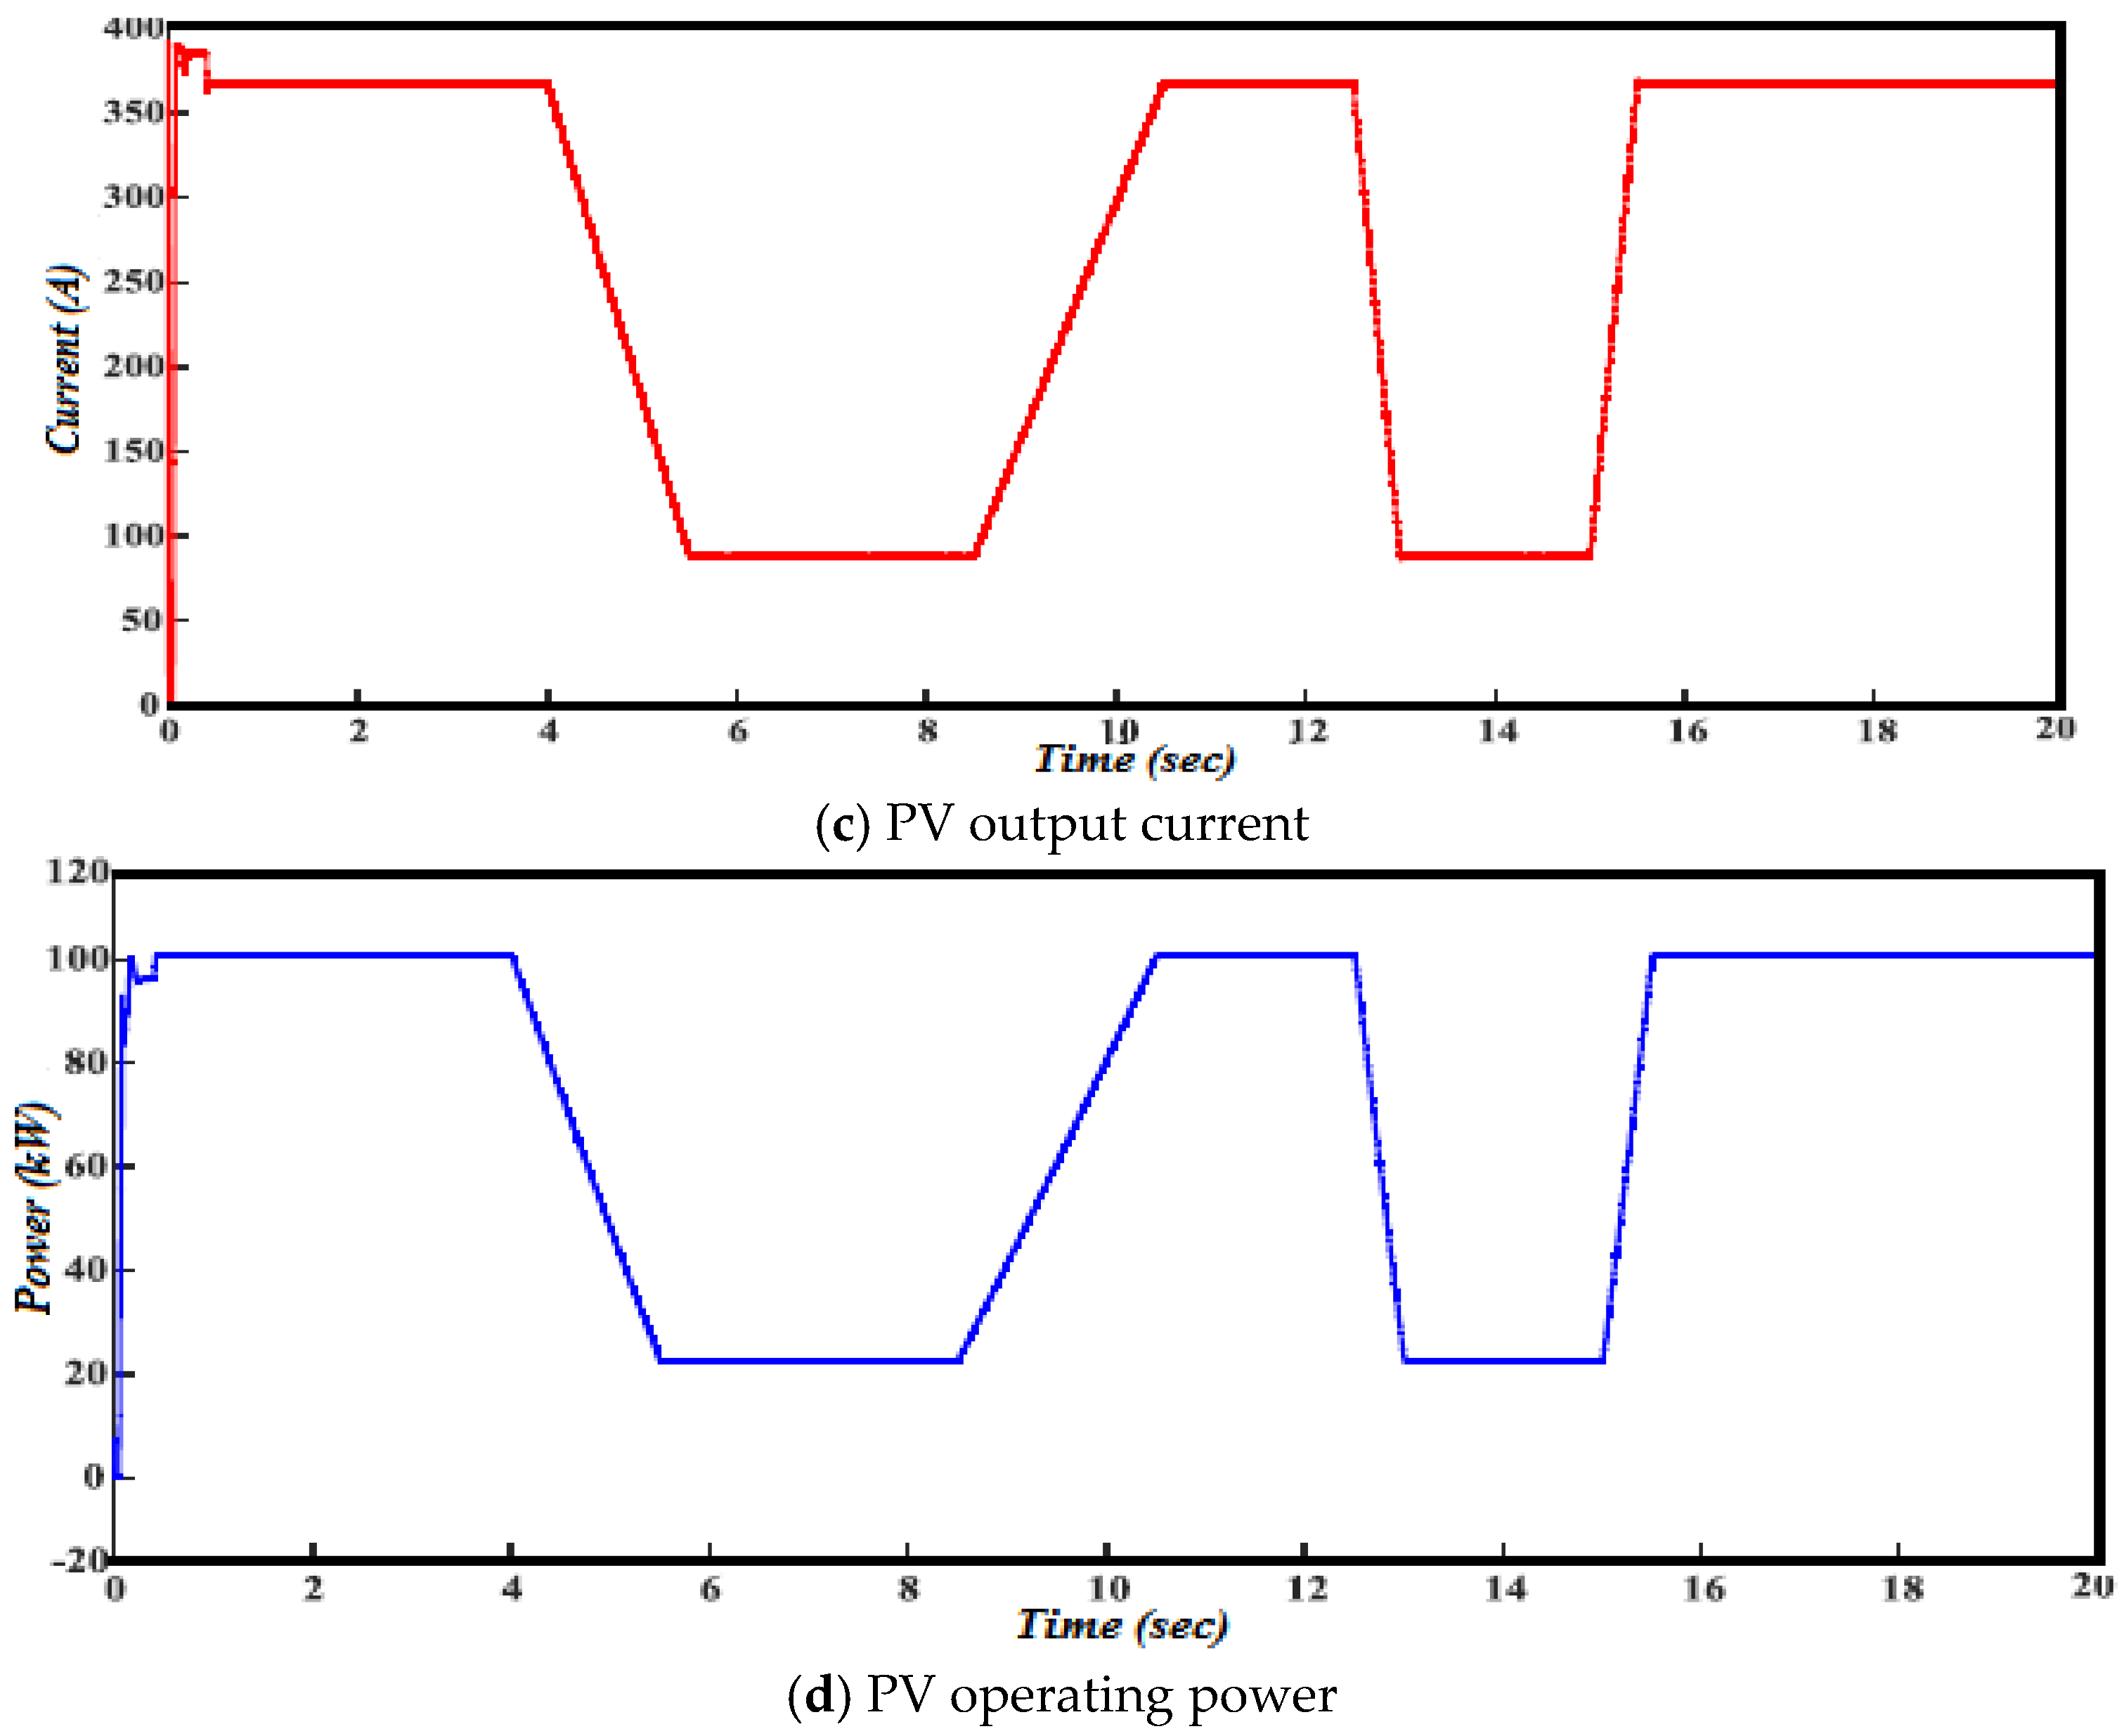
This section investigated the performance under variations of sun irradiance. The PV array temperature was considered to be fixed at 25 °C throughout the entire simulation. The output of most solar panels was measured at standard test conditions (STC): a temperature of 25 °C (77 °F). The variation of sun irradiance is illustrated in Figure 14a. This difference shows the shift of irradiation throughout the day. The PV array output voltage well-affected the voltage at MPP, responding to variations in sun irradiance, as depicted in Figure 14b. PV output current was affected by sun irradiance variations, as illustrated in Figure 14c. Since dP/dV was nearly zero, the PV array operating power points were well-tracked across the MPPs during variations of sun irradiance, as represented in Figure 14d. Thus, MPPT accurately tracked the MPPs of the PV array while the sun irradiance changed continuously.
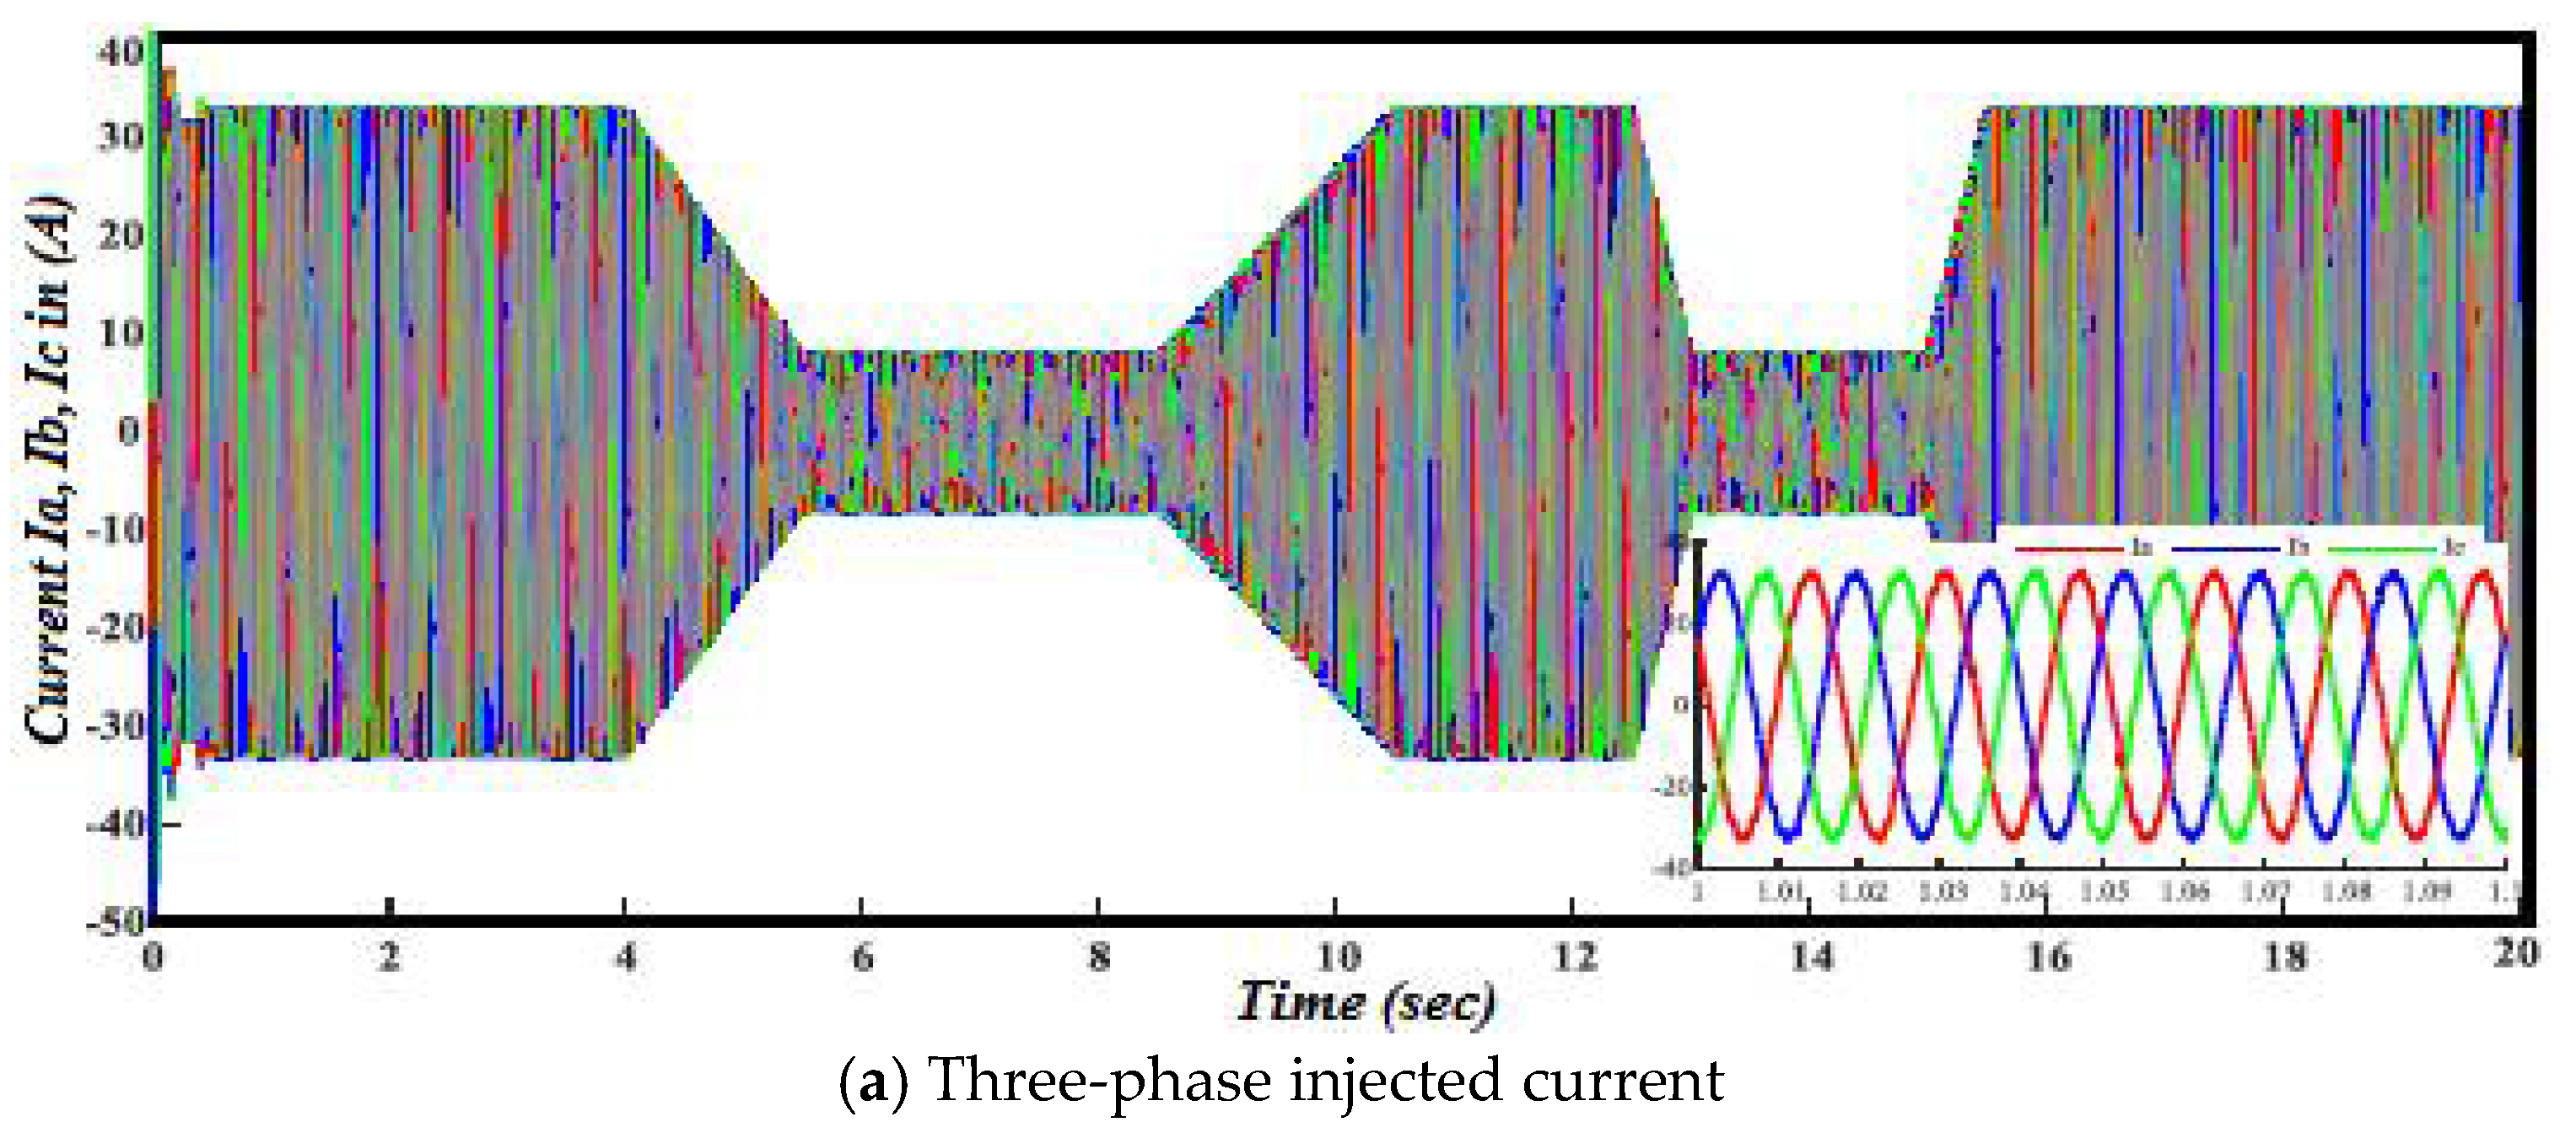
Figure 15a illustrates the three-phase injected current, in which the waveforms were sinusoidal. In Figure 15b, the injected real power was close to the created value; thus, small losses and the reactive power was null, hence a power factor equal to one (P.F). Figure 15c illustrates the injected voltage and current to the electrical grid; the grid voltage and current were in phase due to one P.F.
5.2. Case (2): System Performance of Wind Energy
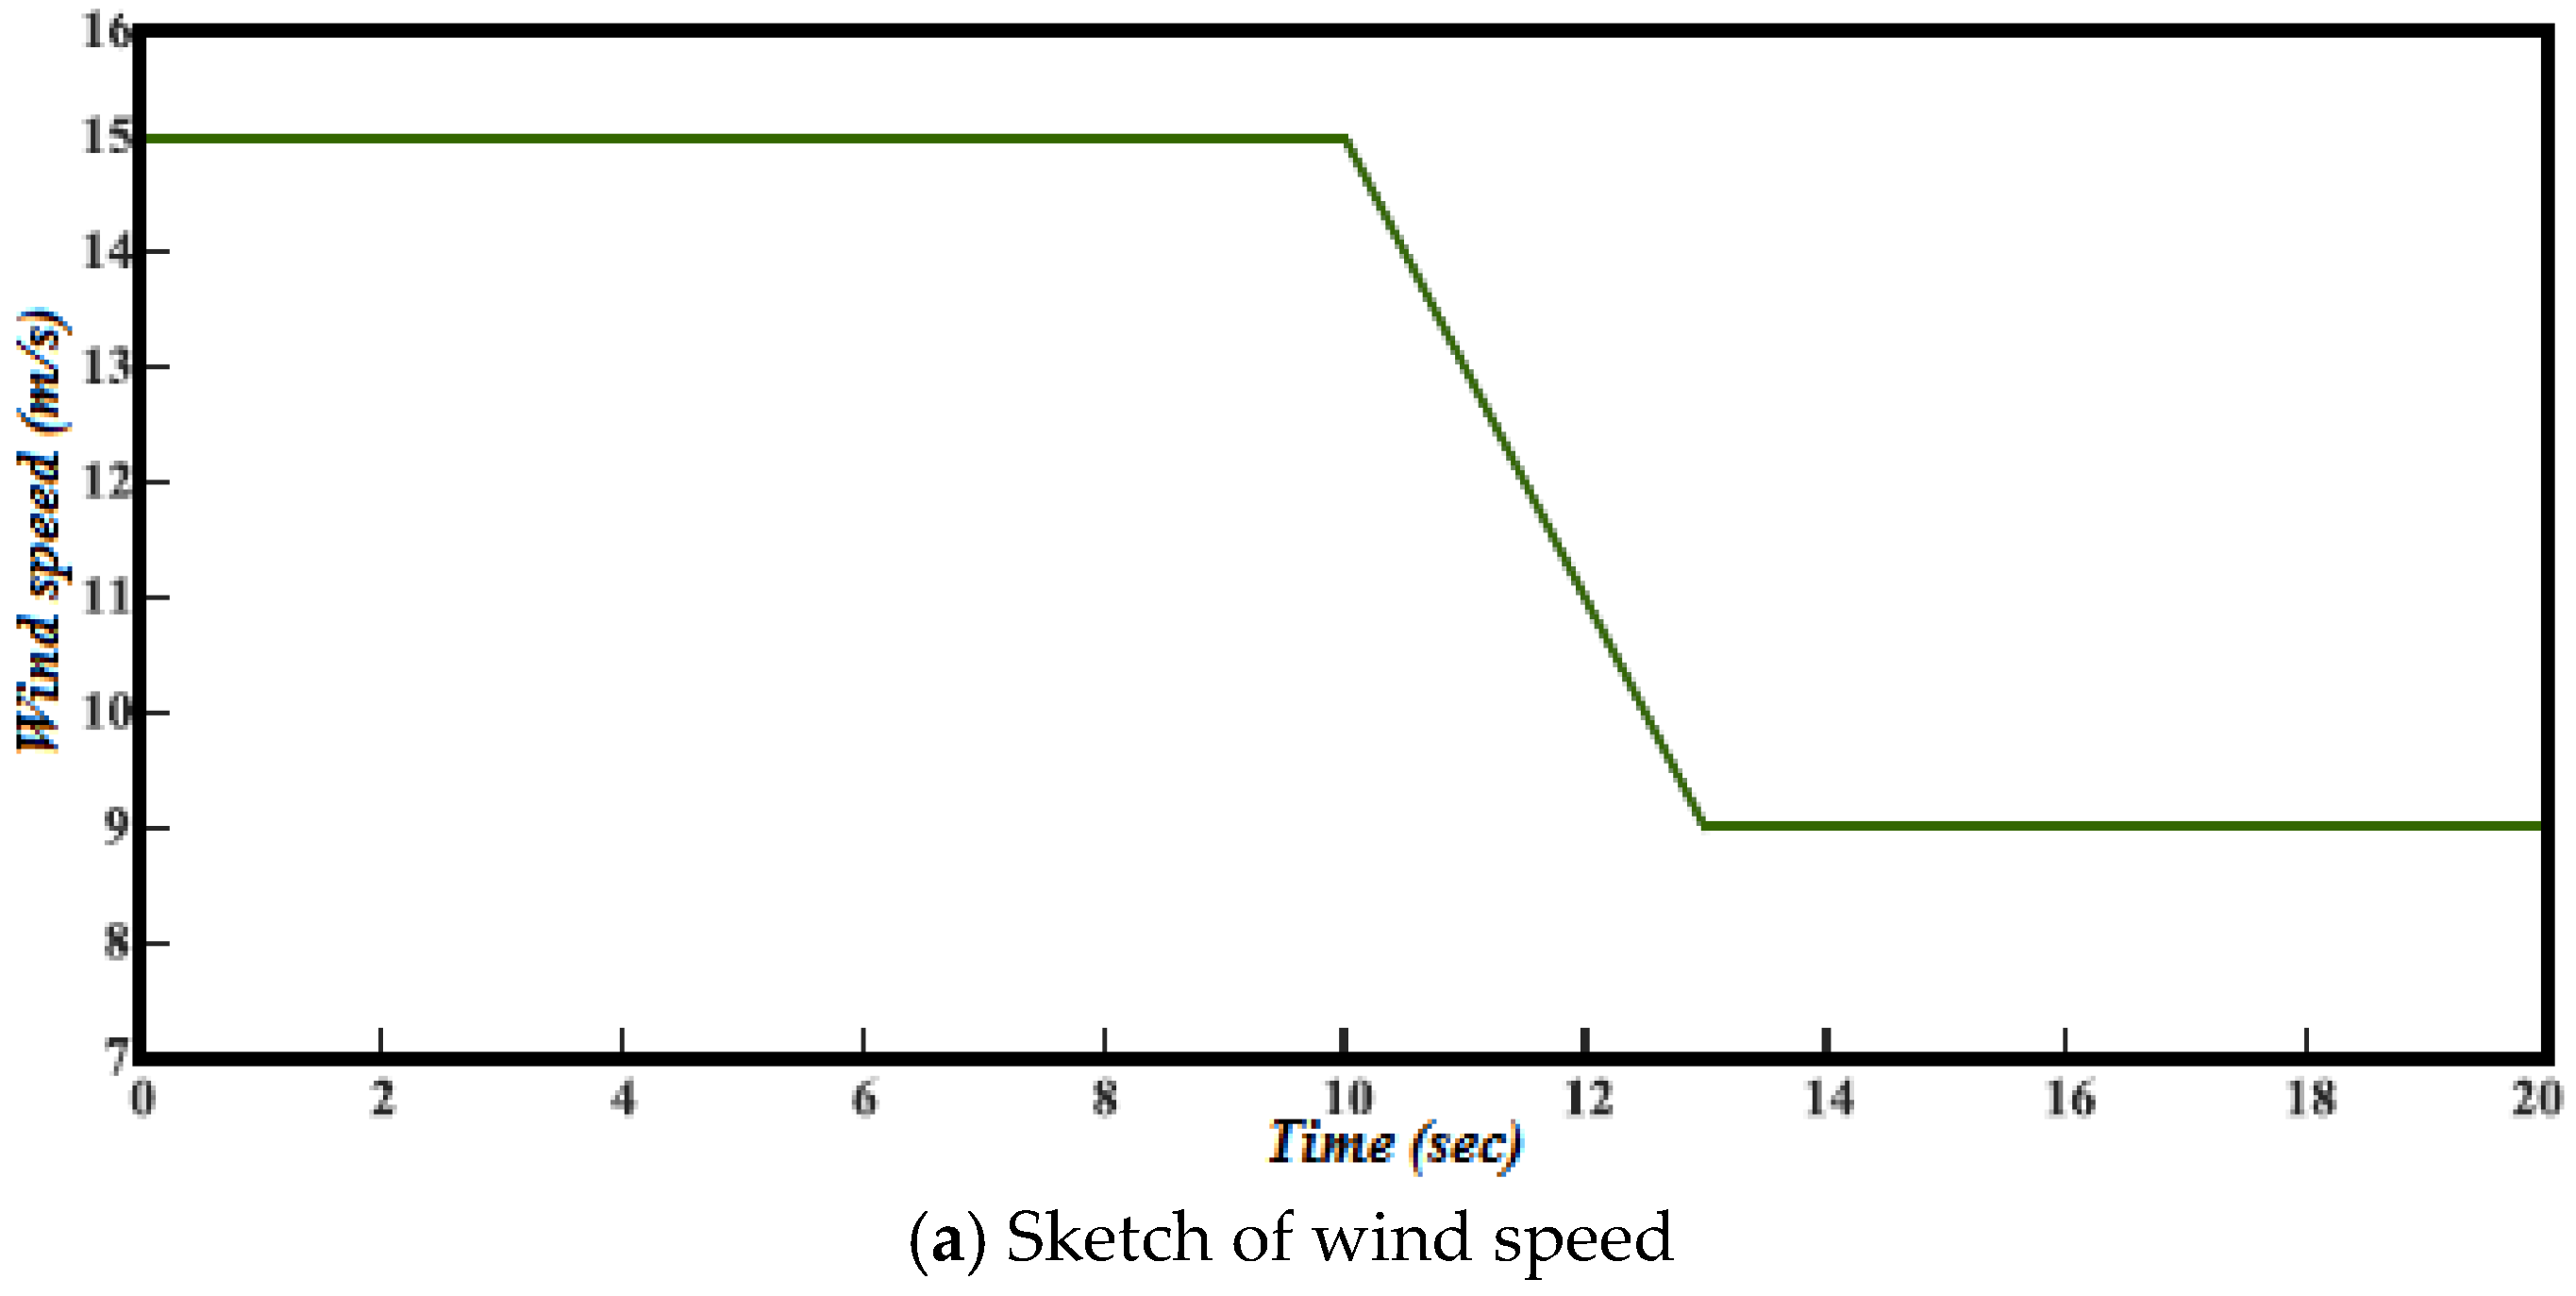
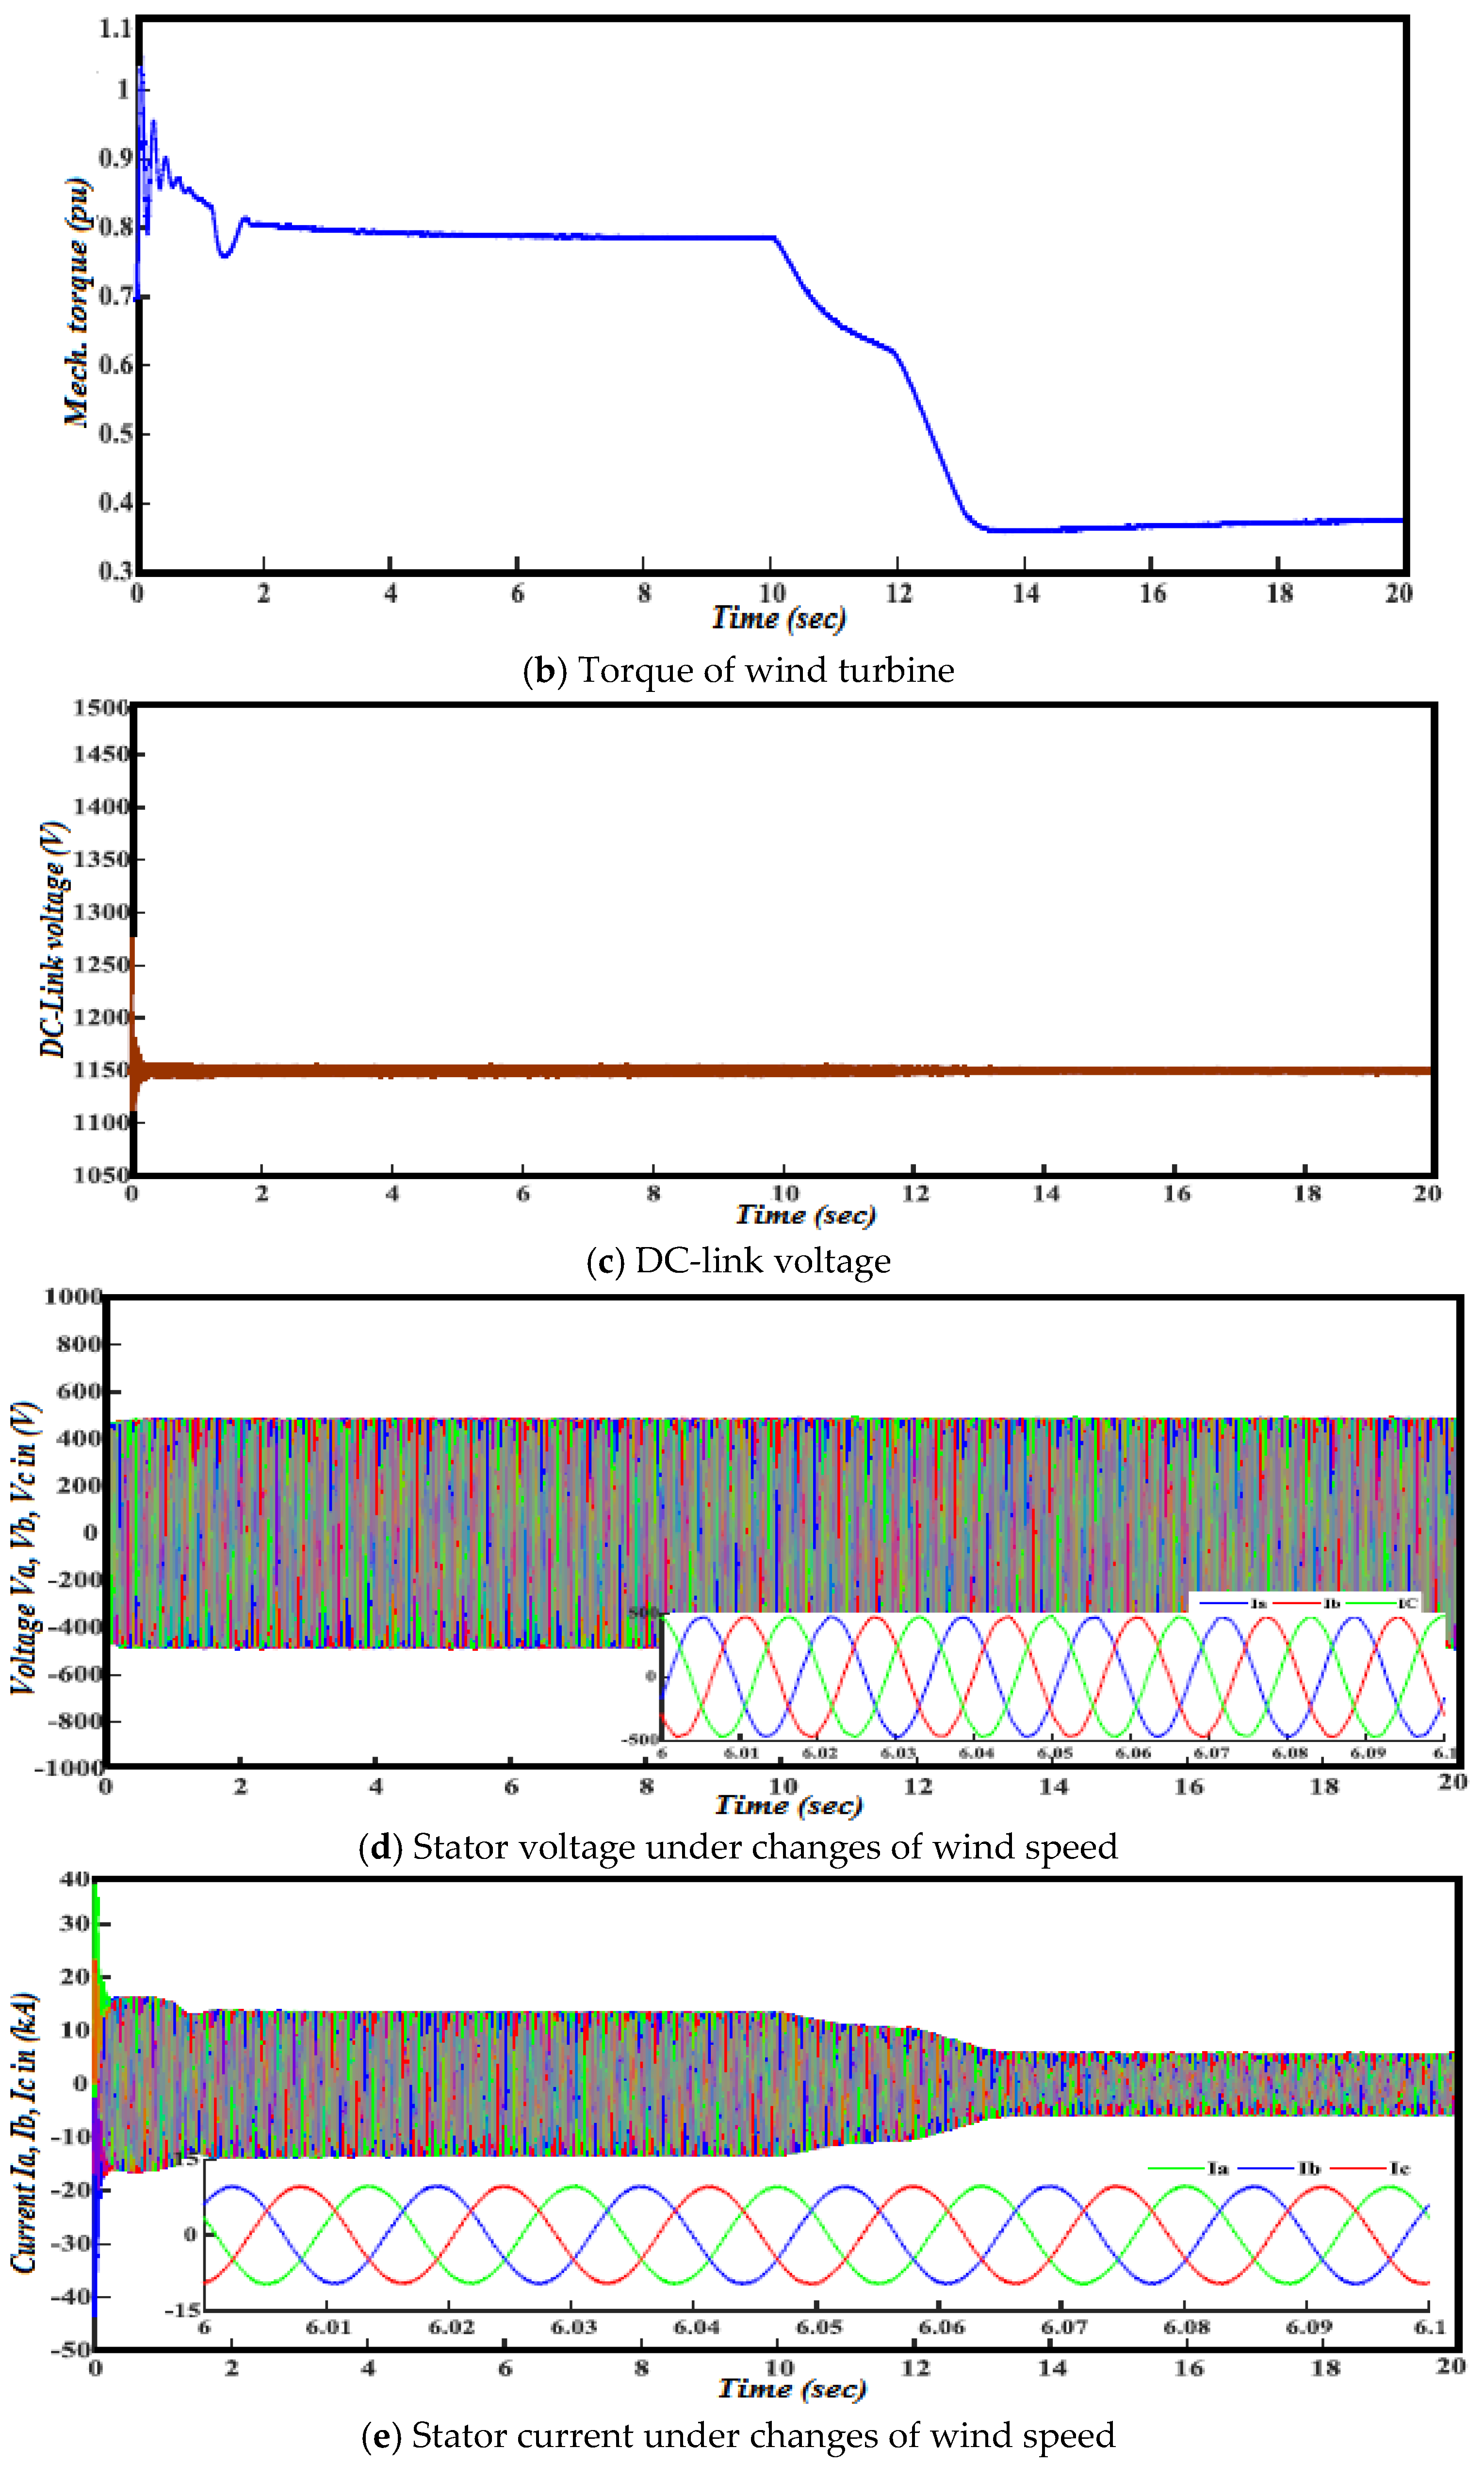
This case examined the wind performance under variation of wind speed. Figure 16a illustrates the speed variation of the gradation wind and the ramp change of wind speed was 15 m/s and 9 m/s, respectively. Figure 16b represents mechanical torque of the WT in the process of extracting maximum wind energy. In Figure 16c, the DC-link voltage was fixed at 1150 V, irrespective of magnitude of the injected power. Figure 16d,e depicts constant stator voltage and variation of stator current under variations of wind speed; the waveforms of the three-phase stator voltage and current were sinusoidal.
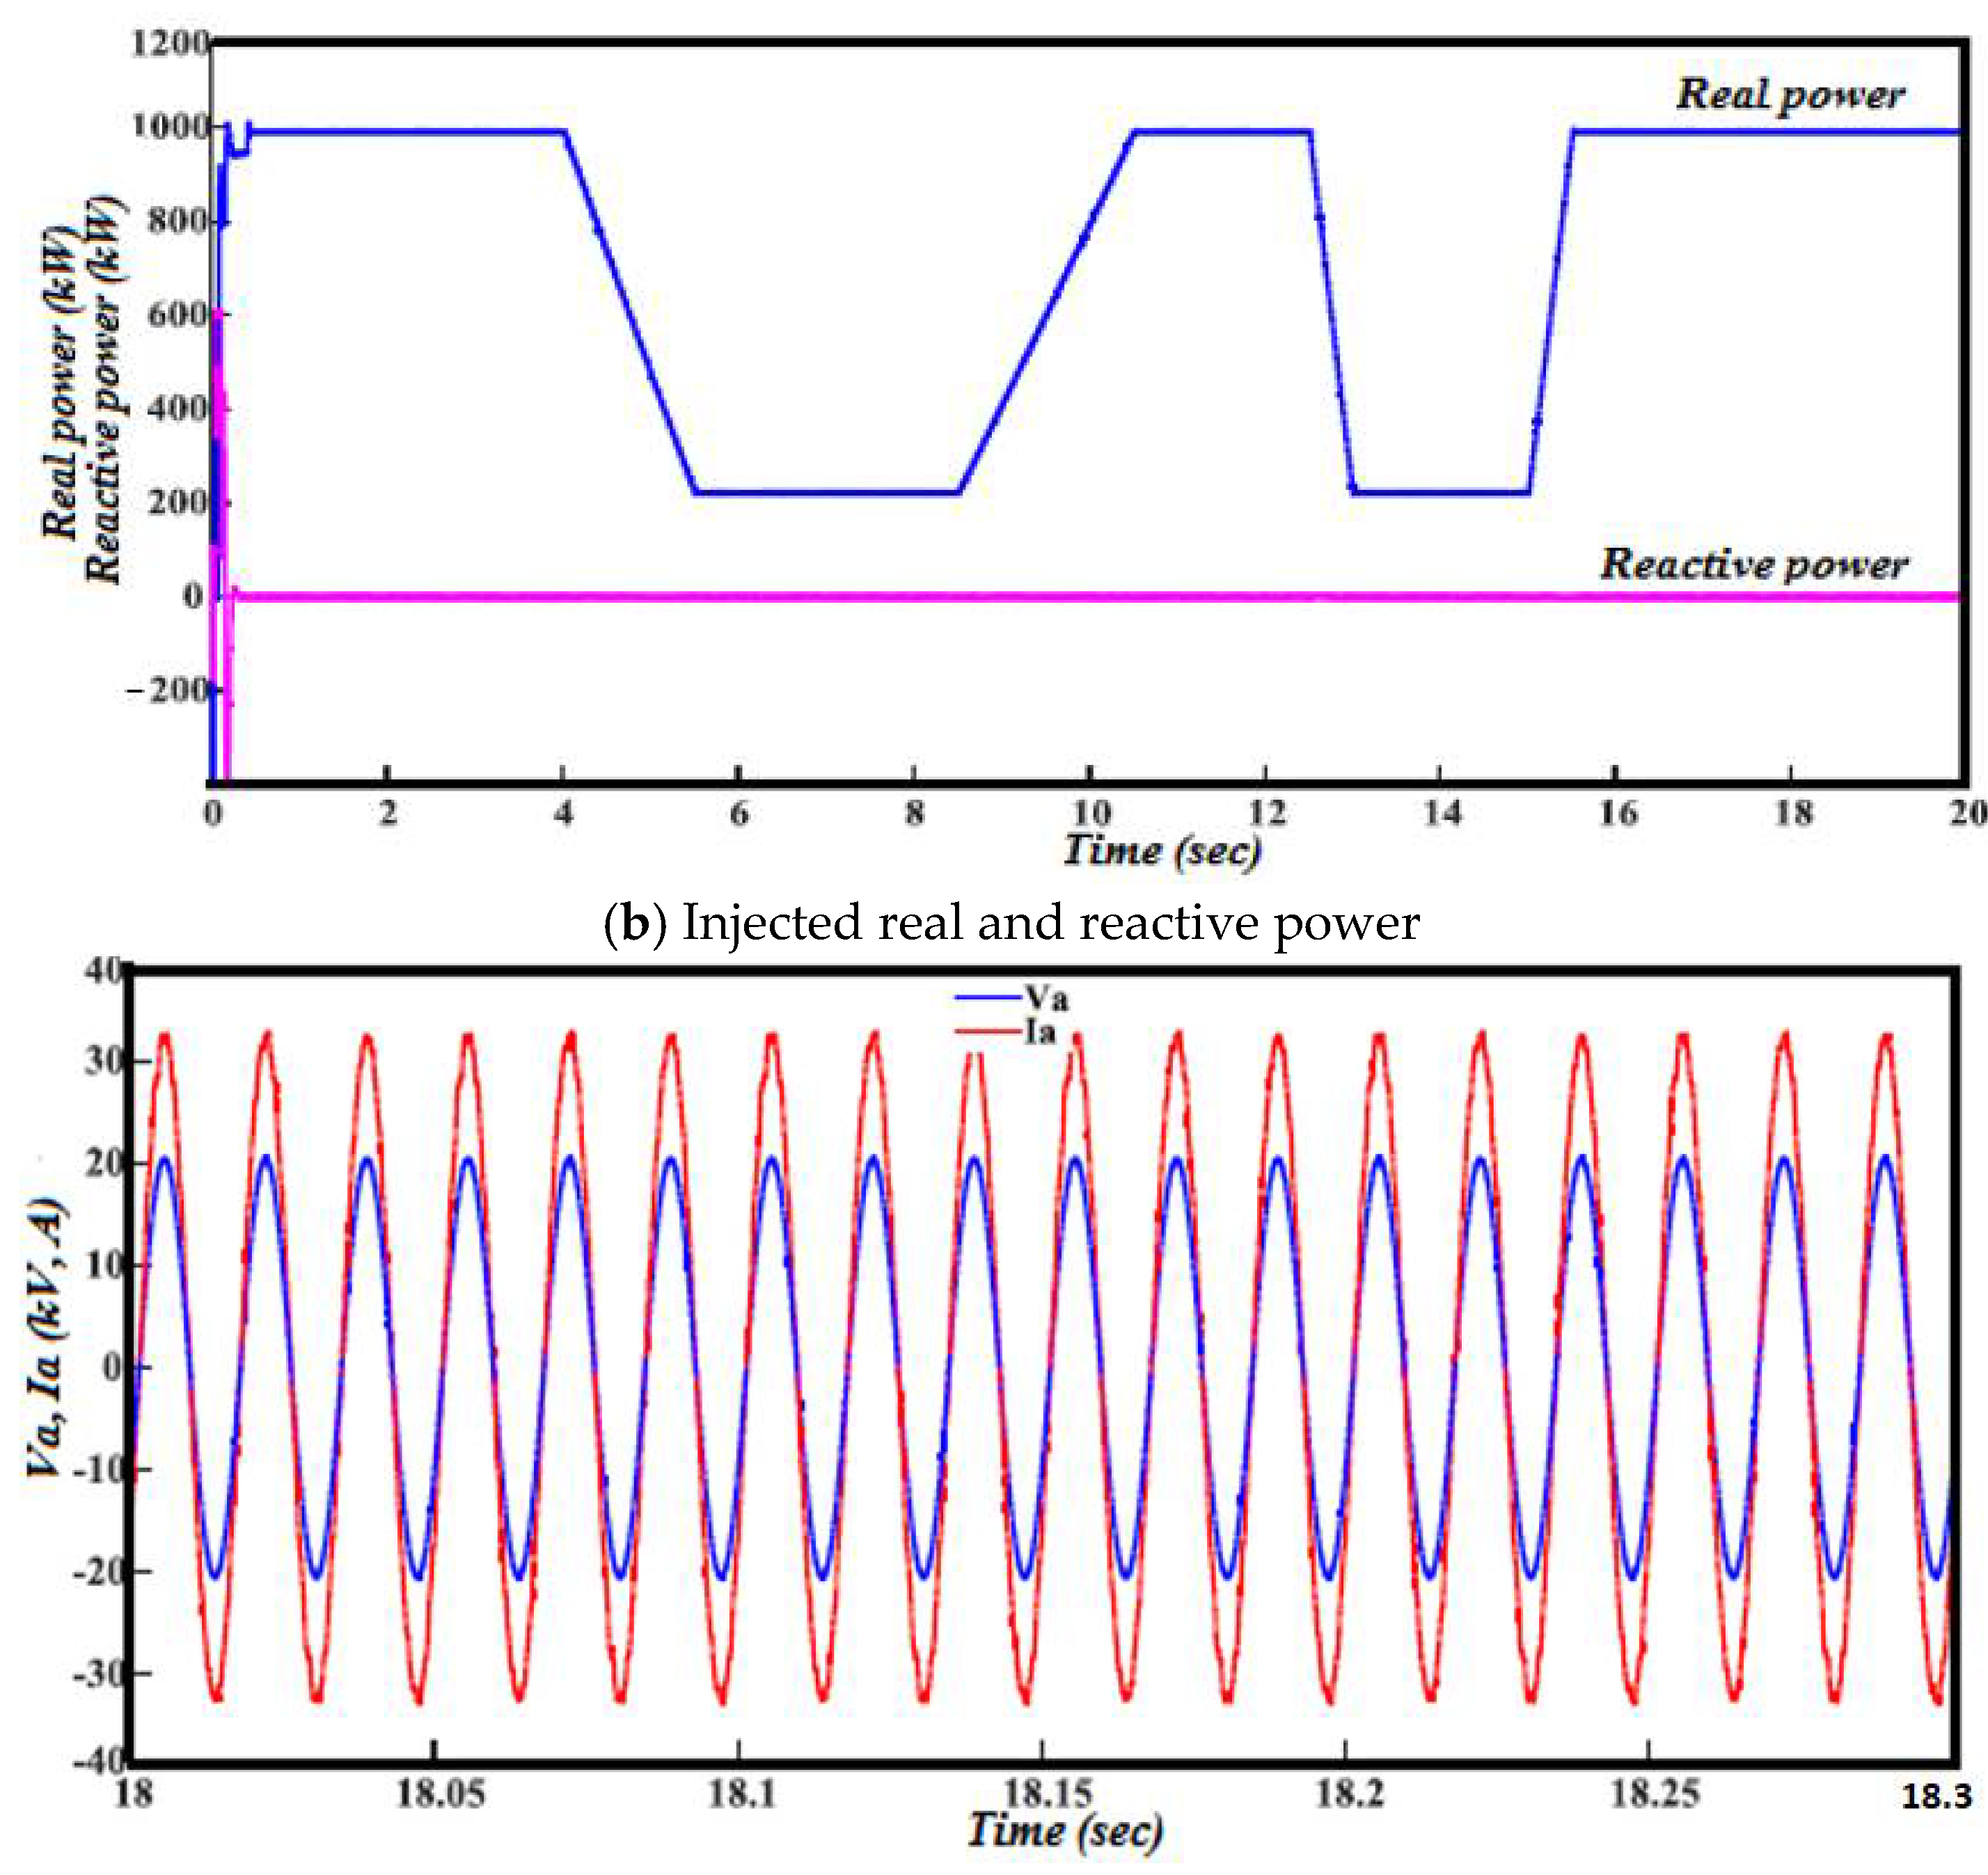
Figure 17a illustrates the injected real power from the DFIG wind farm changes according to wind speed, whereas the delivered reactive power was null; hence, a power factor equal to one. To explain the validity of GSC and RSC, Figure 17b illustrates that the stator voltage and current were in phase due to zero reactive power and a power factor equal to one. Figure 17c shows the injected current from the wind system. The change of current amplitude reflects the variation of power since grid voltage continued to be constant.
5.3. Case (3): Hybrid PV/Wind System Performance
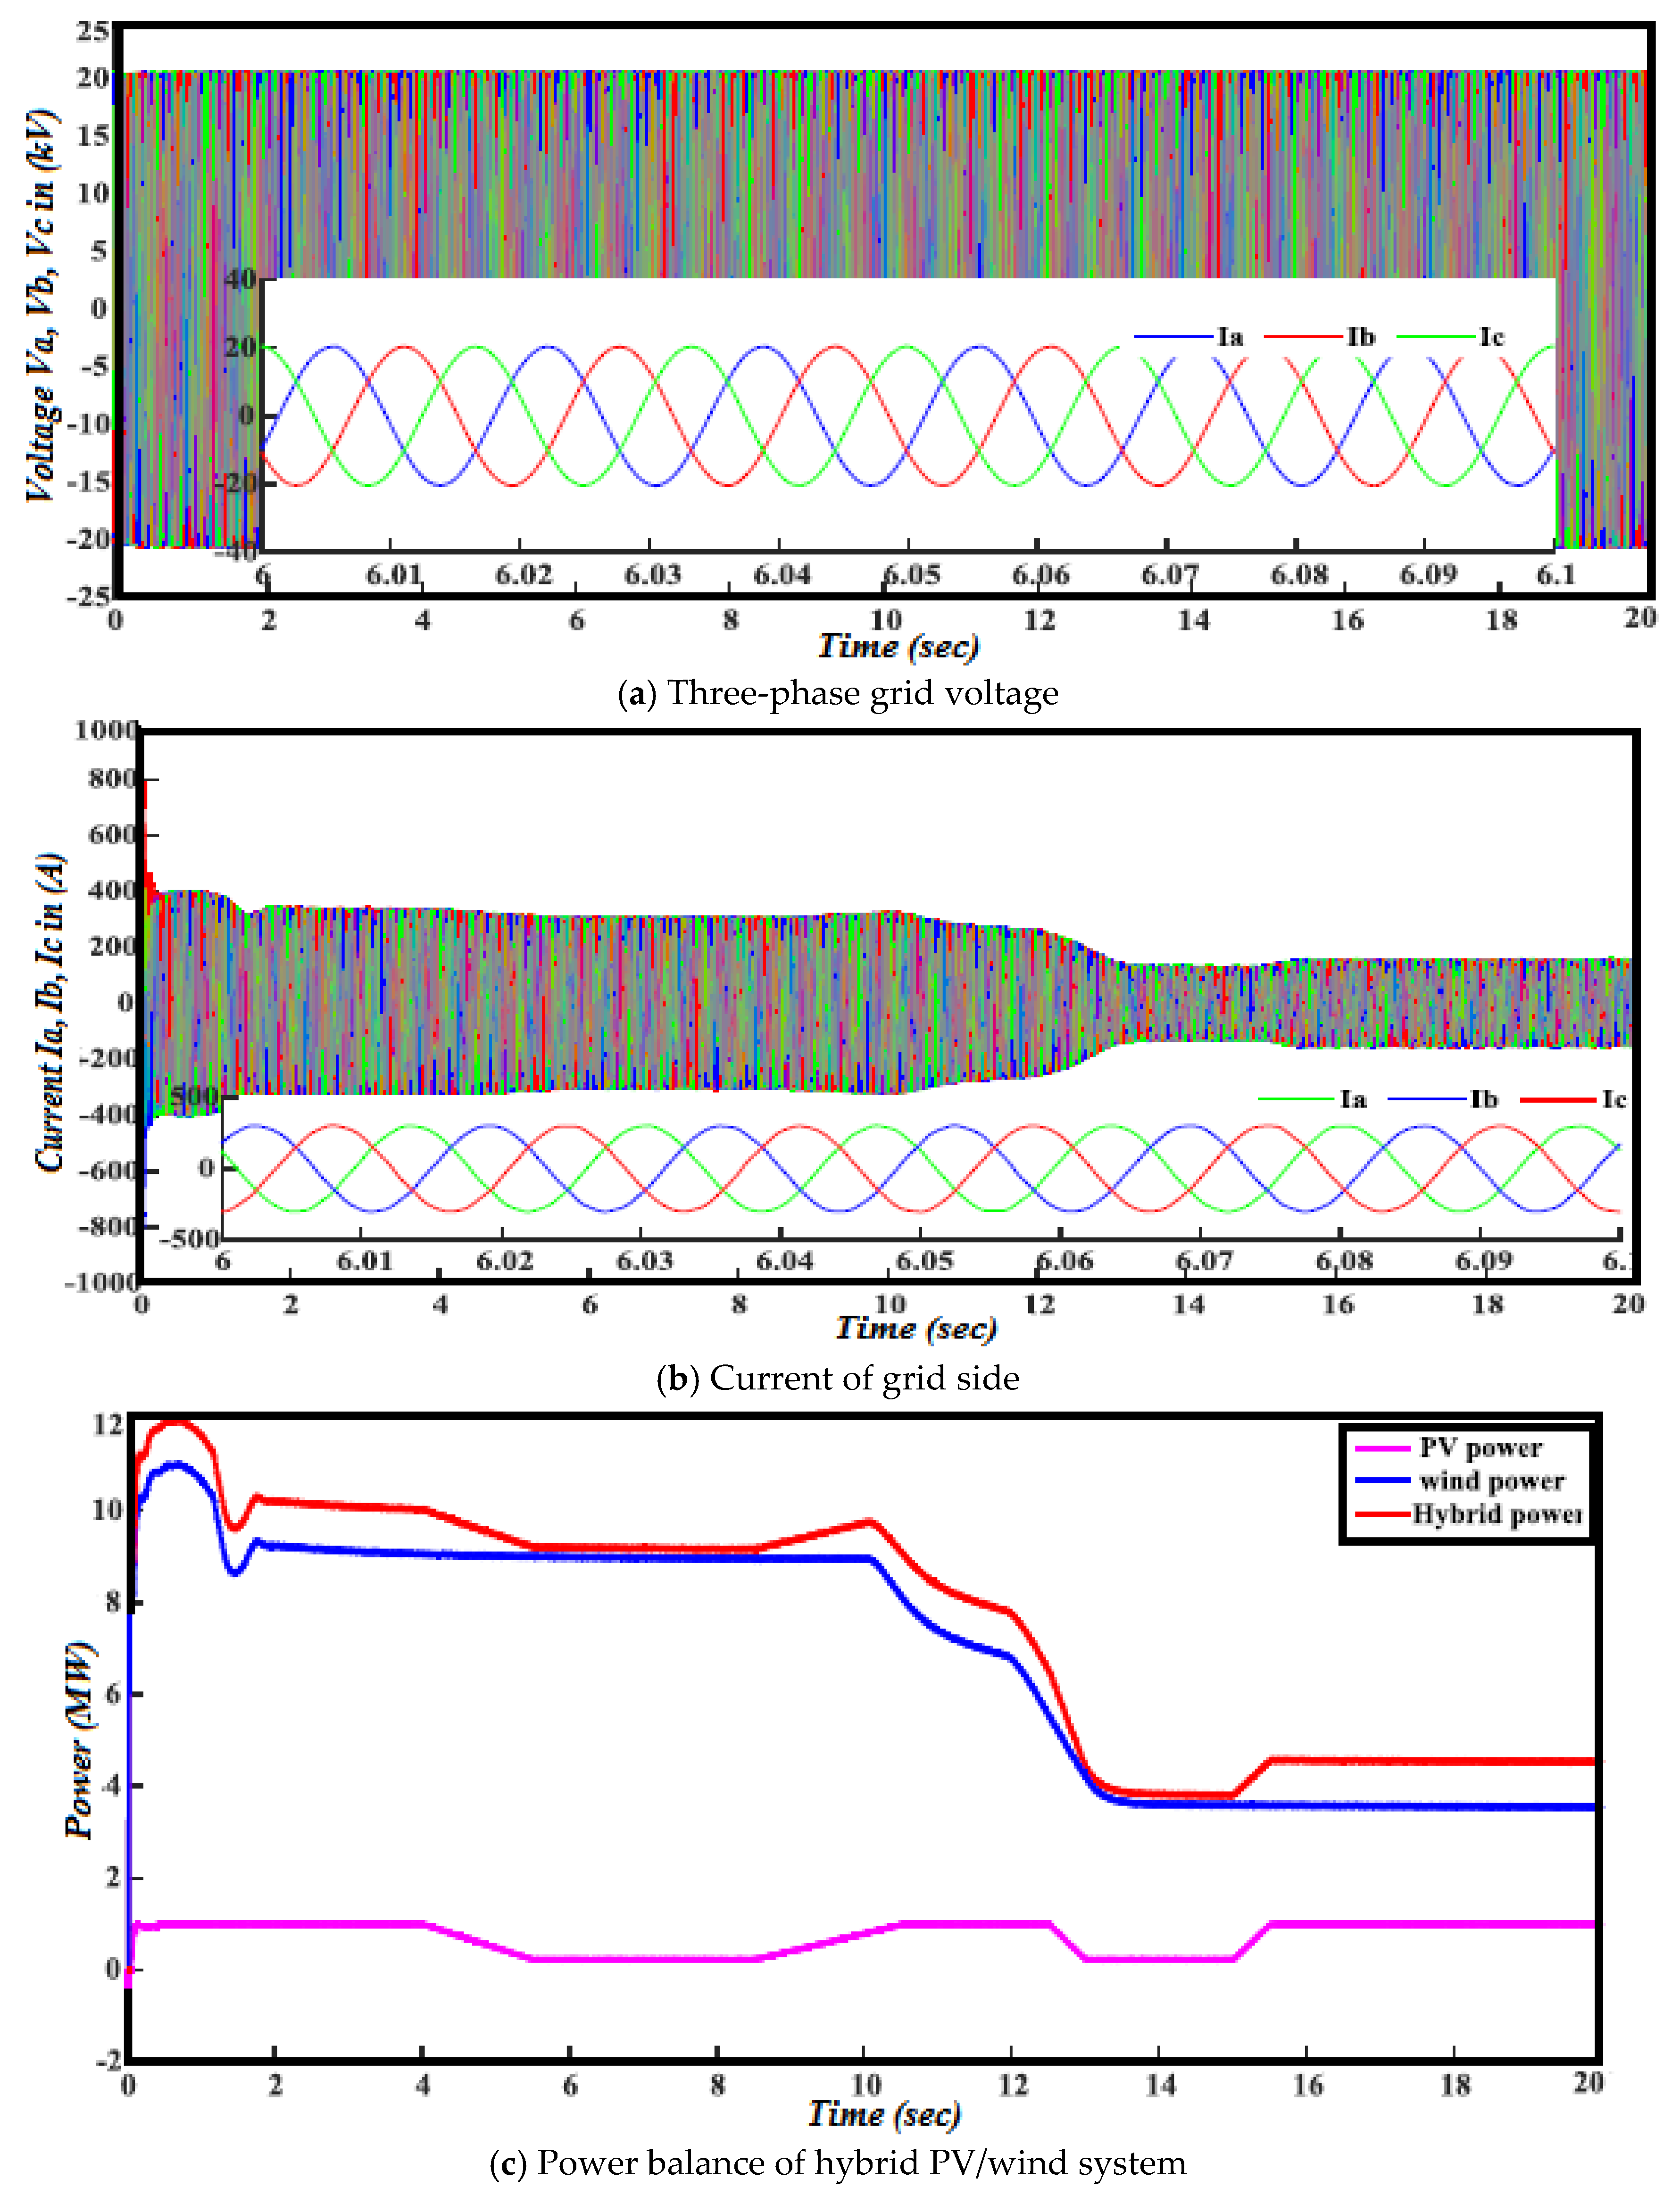
This scenario examined the system performance of the hybrid PV/wind at variations of sun irradiation and wind speed. Figure 18a illustrates the waveforms of the three-phase grid voltage, and it is evident that grid voltage remained constant. Figure 18b depicts the current of the grid side, which is in sinusoidal form. Figure 18c shows the power balance of the hybrid PV/wind system; the injected power from the PV was equal to 1 MW at TS, whereas the maximum power of wind energy was equal to 9 MW at base wind speed.
6. Conclusions
In the future, it is strongly recommended that the majority of the grid’s resources be nuclear and renewable to solve the problem of energy reduction and global climate change simultaneously. Nuclear reactors need a stable and reliable grid in order to operate safely and this requires an improved performance of renewable energies, especially wind and solar PV systems. Among their drawbacks is the dependence of the presence and strength of wind or sunlight (changes of wind speed and solar irradiation). This manuscript is a step in this direction. It introduces a comprehensive dynamic modeling and control and an efficient grid-inserted hybrid photovoltaic/wind system, which was analyzed and successfully performed using MATLAB program. The behavior of the suggested hybrid system was tested at different climate circumstances, such as variations of sun radiation and wind speed. The MPPT was utilized for two systems, PV and wind, to analyze the maximum power under different environmental conditions. Characteristics of the doubly fed induction generator were analyzed and the control mode of DFIG were designed and implemented in this study. The simulation and the test results proved the robustness of the suggested hybrid system in response to swift variations in sun radiation and wind speed conditions during the day. Future work will be oriented toward investigating the stability of a hybrid system during grid fault.
Author Contributions
Conceptualization, S.A.M. and M.A.T.; methodology, A.A.E. and M.A.T.; software, S.A.M.; validation, S.A.M. and A.A.E.; formal analysis, M.A.T.; investigation, M.A.T., A.M.E.-R.; resources, S.A.M. and A.A.E.; data curation, S.A.M. and A.M.E.-R.; writing—original draft preparation, S.A.M. and M.A.T.; writing—review and editing, A.A.E. and M.A.T.; visualization, A.M.E.-R.; supervision, S.A.M. and A.A.E.; project administration, S.A.M. and A.A.E.; funding acquisition, A.M.E.-R. All authors have read and agreed to the published version of the manuscript.
Funding
This research received no external funding.
Institutional Review Board Statement
Not applicable.
Informed Consent Statement
Not applicable.
Data Availability Statement
Not applicable.
Acknowledgments
The researcher (M. A. Tolba) is funded by a full scholarship (mission 2019/20) from the Ministry of Higher Education of Egypt. The current research work is not funded by the mentioned ministry of Egypt or any other foundation or organization.
Conflicts of Interest
The authors declare no conflict of interest.
References
- Ishaque, K.; Salam, Z. A review of maximum power point tracking techniques of PV system for uniform insolation and partial shading condition. Renew. Sustain. Energy Rev. 2013, 19, 475–488. [Google Scholar] [CrossRef]
- Tolba, M.; Rezk, H.; Diab, A.A.Z.; Al-Dhaifallah, M. A Novel Robust Methodology Based Salp Swarm Algorithm for Allocation and Capacity of Renewable Distributed Generators on Distribution Grids. Energies 2018, 11, 2556. [Google Scholar] [CrossRef] [Green Version]
- Tolba, M.A.; Rezk, H.; Tulsky, V.; Diab, A.A.Z.; Abdelaziz, A.Y.; Vanin, A. Impact of Optimum Allocation of Renewable Distributed Generations on Distribution Networks Based on Different Optimization Algorithms. Energies 2018, 11, 245. [Google Scholar] [CrossRef] [Green Version]
- Bragg-Sitton, S.M.; Boardman, R.; Ruth, M.; Lyons, P.B. Report of International Workshop to Explore Synergies between Nuclear and Renewable Energy Sources as a Key Component in Developing Pathways to Decarbonization of the Energy Sector; Idaho National Laboratory: Colorado, ID, USA, 2016. [Google Scholar]
- Iaea Nuclear Energy Series No. NG-T-3.8. Electric Grid Reliability and Interface with Nuclear Power Plants; International Atomic Energy Agency: Vienna, Austria, 2012.
- Hossain, J.; Sakib, N.; Hossain, E.; Bayindir, R. Modelling and Simulation of Solar Plant and Storage System: A Step to Mi-crogrid Technology. Int. J. Renew. Energy Res. 2017, 7, 723–737. [Google Scholar]
- Costa, Á.M.; Orosa, J.A.; Vergara, D.; Fernández-Arias, P. New Tendencies in Wind Energy Operation and Maintenance. Appl. Sci. 2021, 11, 1386. [Google Scholar] [CrossRef]
- Duer, S.; Zajkowski, K.; Harničárová, M.; Charun, H.; Bernatowicz, D. Examination of Multivalent Diagnoses Developed by a Diagnostic Program with an Artificial Neural Network for Devices in the Electric Hybrid Power Supply System “House on Water”. Energies 2021, 14, 2153. [Google Scholar] [CrossRef]
- Bansod, P.G.; Adhau, S. Dynamic Modeling and Control of Hybrid Generation System for Grid Connected Application. In Proceedings of the 2016 International Conference on Energy Efficient Technologies for Sustainability (ICEETS), Bangalore, India, 20–21 May 2016; pp. 787–791. [Google Scholar] [CrossRef]
- Hirose, T.; Matsuo, H. Standalone Hybrid Wind-Solar Power Generation System Applying Dump Power Control without Dump Load. IEEE Trans. Ind. Electron. 2012, 59, 988–997. [Google Scholar] [CrossRef]
- Hossain, M.K.; Ali, M. Transient stability augmentation of PV/DFIG/SG-based hybrid power system by parallel-resonance bridge fault current limiter. Electr. Power Syst. Res. 2016, 130, 89–102. [Google Scholar] [CrossRef]
- Parida, A.; Chatterjee, D. Cogeneration topology for wind energy conversion system using doubly-fed induction generator. IET Power Electron. 2016, 9, 1406–1415. [Google Scholar] [CrossRef]
- Bakir, H.; Kulaksiz, A.A. Modelling and voltage control of the solar-wind hybrid micro-grid with optimized STATCOM using GA and BFA. Eng. Sci. Technol. Int. J. 2020, 23, 576–584. [Google Scholar] [CrossRef]
- Rhouma, M.B.; Gastli, A.; Ben Brahim, L.; Touati, F.; Benammar, M. A simple method for extracting the parameters of the PV cell single-diode model. Renew. Energy 2017, 113, 885–894. [Google Scholar] [CrossRef]
- Azali, S.; Sheikhan, M. Intelligent control of photovoltaic system using BPSO-GSA-optimized neural network and fuzzy-based PID for maximum power point tracking. Appl. Intell. 2016, 44, 88–110. [Google Scholar] [CrossRef]
- Koad, R.; Zobaa, A.; Shahat, A. A Novel MPPT Algorithm Based on Particle Swarm Optimisation for Photovoltaic Systems. IEEE Trans. Sustain. Energy 2017, 8, 468–476. [Google Scholar] [CrossRef] [Green Version]
- Calasan, M.; Jovanovic, D.; Rubezic, V.; Mujovic, S.; Dukanovic, S. Estimation of Single-Diode and Two Diode Solar Cell Parameters by Using a Chaotic Optimization Approach. Energies J. 2019, 12, 4209. [Google Scholar] [CrossRef] [Green Version]
- Mohamed, S.A.; El Sattar, M.A. A comparative study of P&O and INC maximum power point tracking techniques for grid-connected PV systems. SN Appl. Sci. 2019, 1, 174. [Google Scholar] [CrossRef] [Green Version]
- Haripriya, T.; Parimi, A.M.; Rao, U.M. Performance evaluatzion of DC Grid Connected Solar PV System for Hybrid Control of DC-DC Boost Converter. In Proceedings of the 2016 10th International Conference on Intelligent Systems and Control (ISCO), Institute of Electrical and Electronics Engineers (IEEE), Coimbatore, India, 7–8 January 2016; pp. 1–6. [Google Scholar]
- Mohsen, S. Overview of grid-connected two-stage transformer-less inverter design. J. Mod. Power Syst. Clean Energy 2018, 6, 642–655. [Google Scholar]
- Bae, S.; Kwasinski, A. Dynamic Modeling and Operation Strategy for a Microgrid with Wind and Photovoltaic Resources. IEEE Trans. Smart Grid 2012, 3, 1867–1876. [Google Scholar] [CrossRef]
- Mohamed, S. Design, Control and Performance Analysis of a Grid-Connected Hybrid System. Egypt J. Eng. Sci. Technol. 2018, 24, 18–26. [Google Scholar] [CrossRef]
- Oskouei, A.B.; Banaei, M.R.; Sabahi, M. Hybrid PV/wind system with quinary asymmetric inverter without increasing DC-link number. Ain Shams Eng. J. 2016, 7, 579–592. [Google Scholar] [CrossRef] [Green Version]
- Parida, A.; Chatterjee, D. An improved control scheme for grid connected doubly fed induction generator considering wind-solar hybrid system. Int. J. Electr. Power Energy Syst. 2016, 77, 112–122. [Google Scholar] [CrossRef]
- Abo-Alela, S.A.-Z. Design and Performance of Hybrid Wind-Solar Energy Generation System for Efficiency Improvement. J. Al-Azhar Univ. Eng. Sect. 2018, 13, 1118–1124. [Google Scholar] [CrossRef]
- Mohamed, S.A.; Abdel-Rahim, A.-M.M. Voltage Regulation Using a Driven-PMSG with Static Compensator. In Proceedings of the 2019 Innovations in Power and Advanced Computing Technologies (i-PACT), Vellore, India, 22–23 March 2019; Volume 1, pp. 1–7. [Google Scholar]
- Subramanian, C.; Casadei, D.; Tani, A.; Rossi, C. Modeling and Simulation of Grid Connected Wind Energy Conversion Sys-tem Based on a Doubly Fed Induction Generator (DFIG). Int. J. Electr. Energy 2014, 2, 161–166. [Google Scholar]
- Jangid, T.; Yadav, D.; Suman, N. Maximum Power Output of DFIG Based WECS Using Improved MPPT Algorithm. In Proceedings of the 2018 International Conference on Inventive Research in Computing Applications (ICIRCA), Coimbatore, India, 11–12 July 2018; pp. 1074–1079. [Google Scholar] [CrossRef]
- Abo-Khalil, A.G.; Alyami, S.; Sayed, K.; Alhejji, A. Dynamic Modeling of Wind Turbines Based on Estimated Wind Speed under Turbulent Conditions. Energies 2019, 12, 1907. [Google Scholar] [CrossRef] [Green Version]
Figure 1.
Schematic representing a model of a PV/wind test system connected to a grid.

Figure 2.
Simplest single diode PV module equivalent circuit.

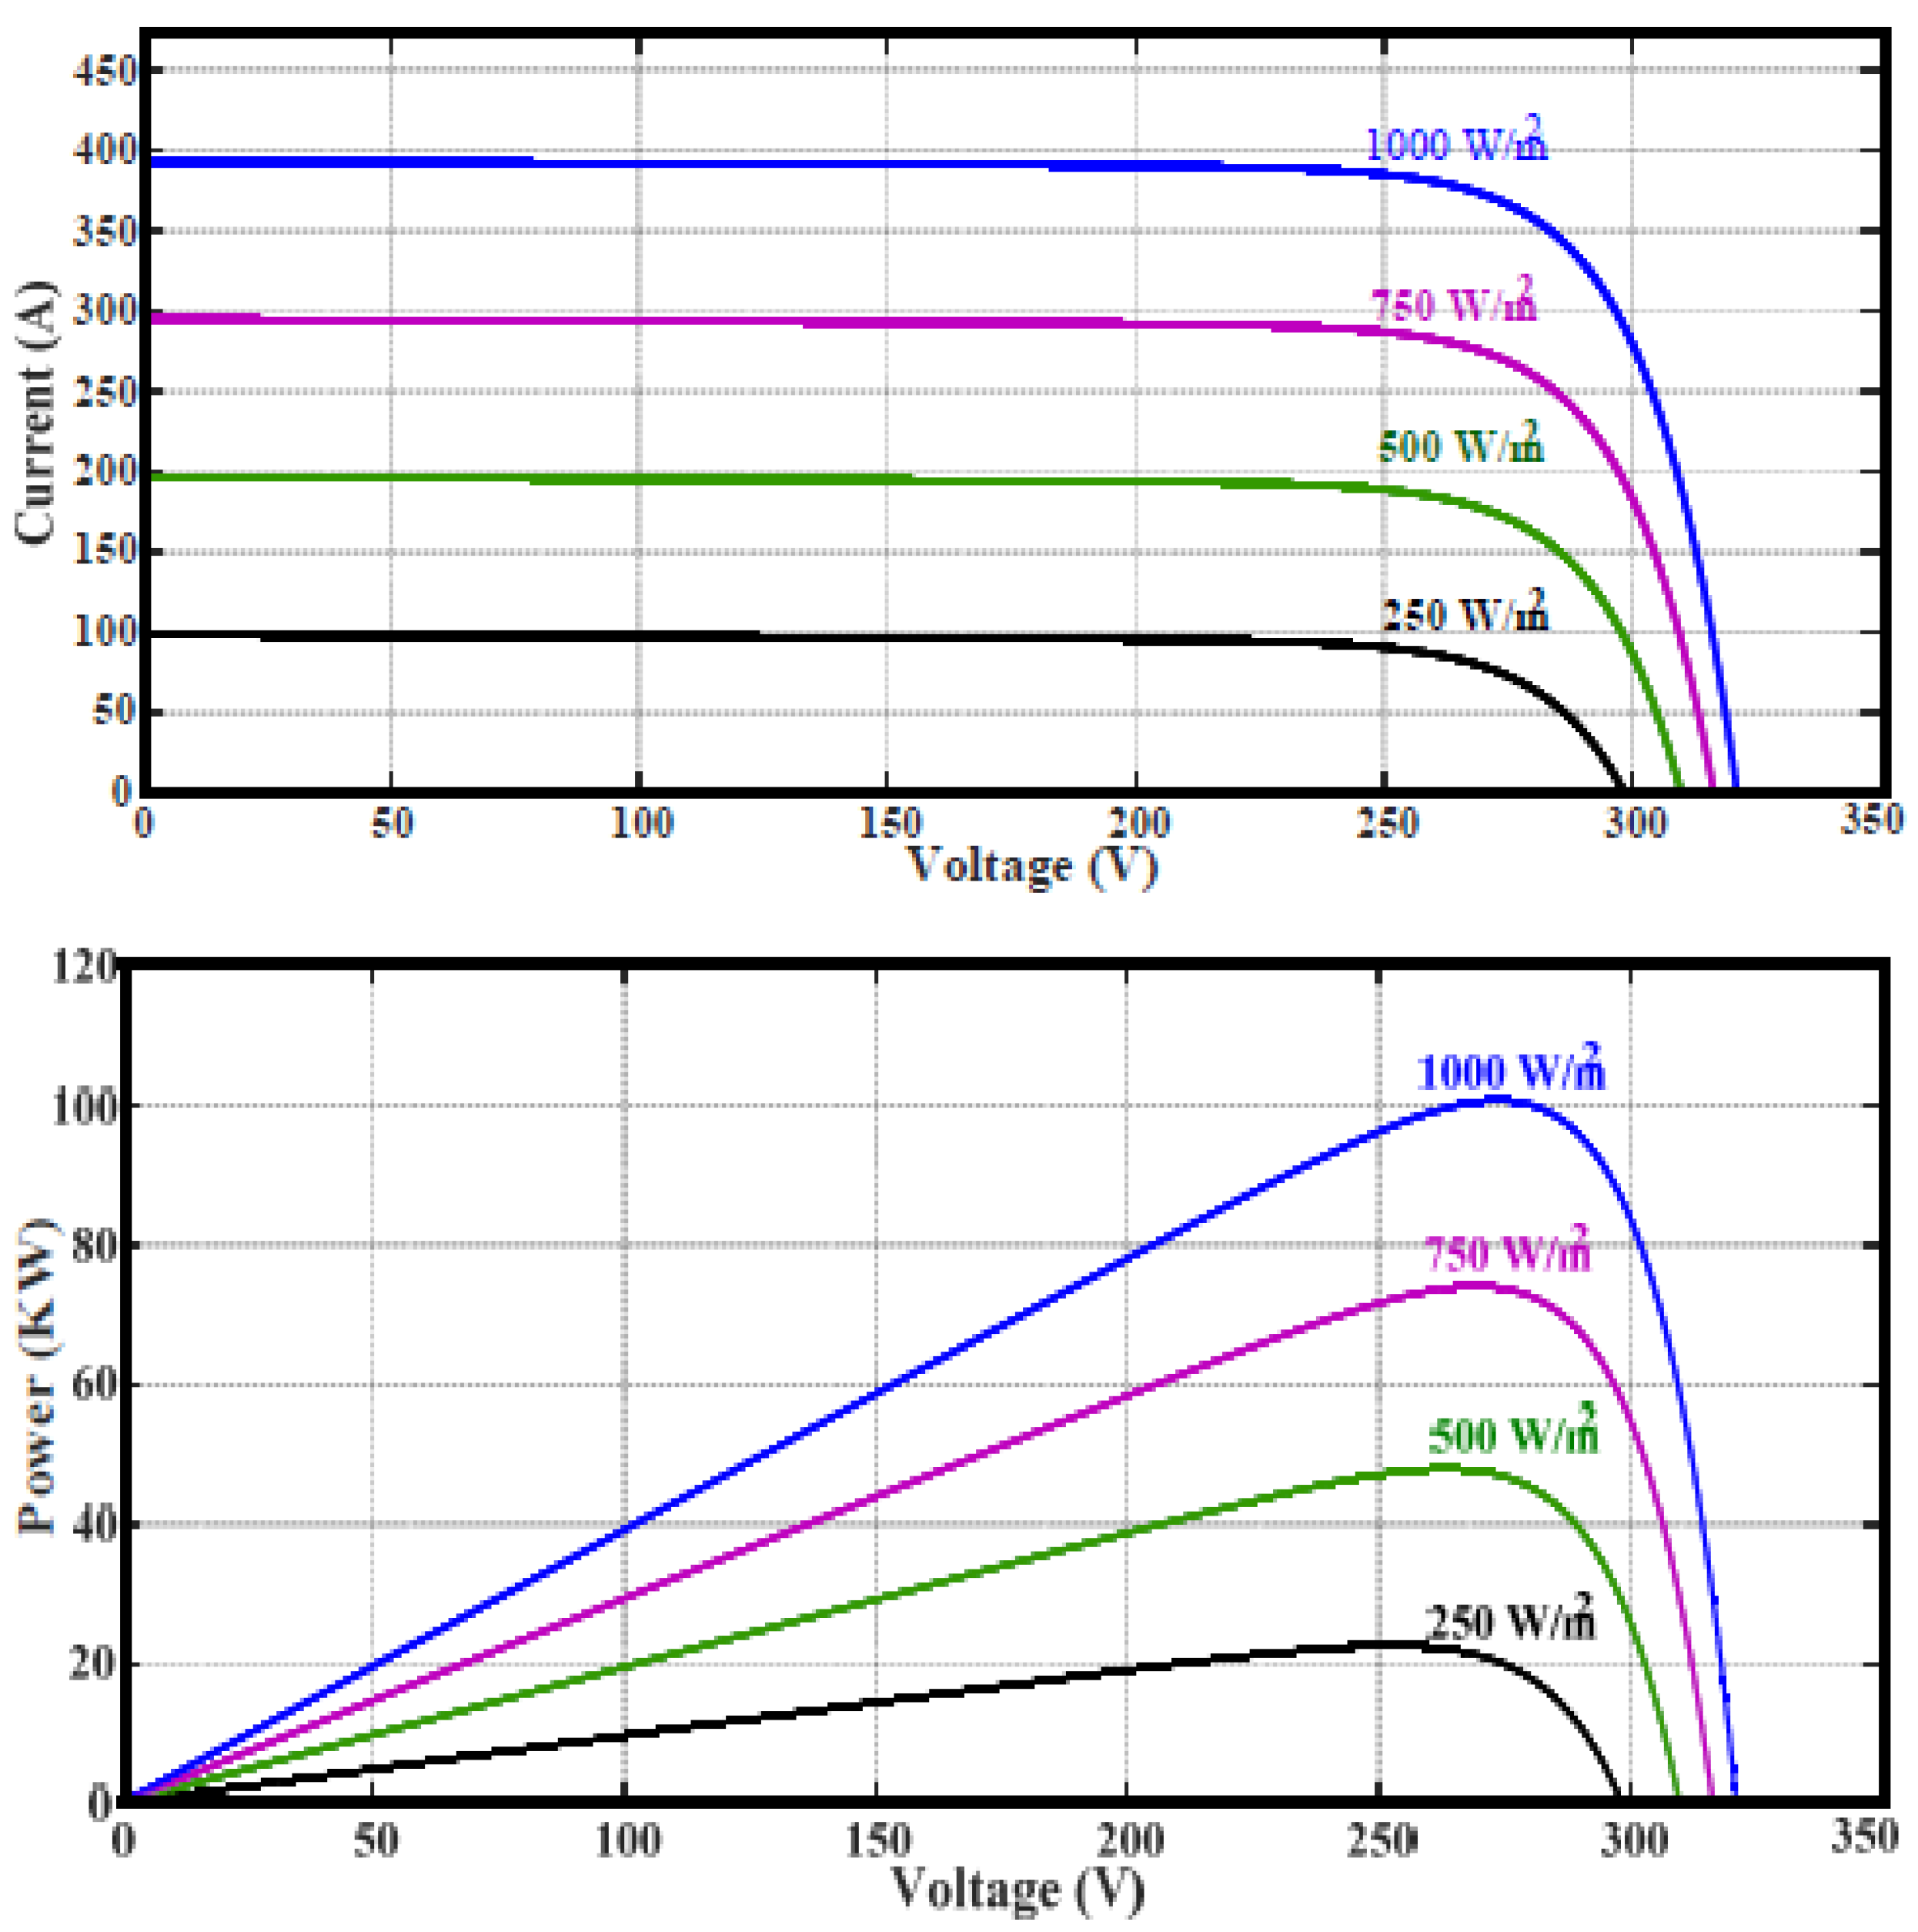
Figure 3.
Typical PV array characteristics under different radiation levels.

Figure 4.
Boost converter equivalent circuit with MPPT.

Figure 5.
PV curve for the basic incremental conductance of MPPT.

Figure 6.
The basic flow chart based on MPPT incremental conductance technique.

Figure 7.
Proposed scheme of DC/AC inverter.

Figure 8.
Typical P-ω curve of the WT for various wind speeds.

Figure 9.
Equivalent circuit for the DFIG in d-q reference frame, (a) d-axis model, and (b) q-axis model.
Figure 9.
Equivalent circuit for the DFIG in d-q reference frame, (a) d-axis model, and (b) q-axis model.

Figure 10.
Schematic diagram control for RSC.

Figure 11.
Schematic diagram control for GSC.

Figure 12.
Proposed flow chart of the MPPT.

Figure 13.
Overall simulated model of grid-connected PV/wind system.

Figure 14.
System performance of the PV array.


Figure 15.
System performance of the PV.


Figure 16.
Performance of DFIG system.


Figure 17.
System performance of wind.

Figure 18.
System performance of hybrid PV/Wind.


Table 1.
Design specifications for PV system.
| SN | Parameters | Rating Values |
|---|---|---|
| 1 | Number of arrays | 10 |
| 2 | Number of series attached modules per string | 5 |
| 3 | Number of parallel strings | 96 |
| 4 | Module type | SunPower SPR-305-WHT |
| 5 | Maximum power per array | 100 kw |
| 6 | Voltage at maximum power | 274 V |
| 7 | Current at maximum power | 386 A |
| 8 | Open circuit voltage (OCV) | 320 V |
| 9 | Short circuit current (SCC) | 392 A |
Table 2.
Design specifications for the wind system.
| SN | Parameters | Rating Values |
|---|---|---|
| 1 | Wind speed base value | 15 m/s |
| 2 | Maximum power at base wind speed | 1.5 MW |
| 3 | Rotational speed base value | 1.2 pu |
| 4 | Tip speed ratio optimal value | λ = 8.1 |
| 5 | Nominal performance coefficient (Cp) | 0.48 pu for [λ = 8.1, β = 0] |
Table 3.
Design specifications for DFIG.
| SN | Parameters | Rating Values |
|---|---|---|
| 1 | Rotor type | Wound rotor |
| 2 | Rated power | 9 MW |
| 3 | Stator nominal voltage (L-L) | 575 V |
| 4 | Nominal frequency | f = 60 Hz |
| 5 | Stator resistance in pu | Rs = 0.03 |
| 6 | Stator inductance in pu | Ls = 0.18 |
| 7 | Rotor resistance in pu | Rr = 0.02 |
| 8 | Rotor inductance in pu | Lr = 0.15 |
| 9 | Magnetizing inductance in pu | Lm = 2.8 |
| 10 | Nominal DC-link voltage | 1150 V |
Publisher’s Note: MDPI stays neutral with regard to jurisdictional claims in published maps and institutional affiliations. |
© 2021 by the authors. Licensee MDPI, Basel, Switzerland. This article is an open access article distributed under the terms and conditions of the Creative Commons Attribution (CC BY) license (https://creativecommons.org/licenses/by/4.0/).
Share and Cite
MDPI and ACS Style
Mohamed, S.A.; Tolba, M.A.; Eisa, A.A.; El-Rifaie, A.M. Comprehensive Modeling and Control of Grid-Connected Hybrid Energy Sources Using MPPT Controller. Energies 2021, 14, 5142. https://0-doi-org.brum.beds.ac.uk/10.3390/en14165142
AMA Style
Mohamed SA, Tolba MA, Eisa AA, El-Rifaie AM. Comprehensive Modeling and Control of Grid-Connected Hybrid Energy Sources Using MPPT Controller. Energies. 2021; 14(16):5142. https://0-doi-org.brum.beds.ac.uk/10.3390/en14165142
Chicago/Turabian StyleMohamed, Shazly A., Mohamed A. Tolba, Ayman A. Eisa, and Ali M. El-Rifaie. 2021. "Comprehensive Modeling and Control of Grid-Connected Hybrid Energy Sources Using MPPT Controller" Energies 14, no. 16: 5142. https://0-doi-org.brum.beds.ac.uk/10.3390/en14165142
Note that from the first issue of 2016, this journal uses article numbers instead of page numbers. See further details here.