
Investigation on Energy Flow Characteristics of Fuel Cell System Based on Real Vehicle Tests

 and
and
Abstract
:1. Introduction
1.1. Literature Review
1.2. Contributions of This Work
1.3. Organization of the Paper
2. Research Object
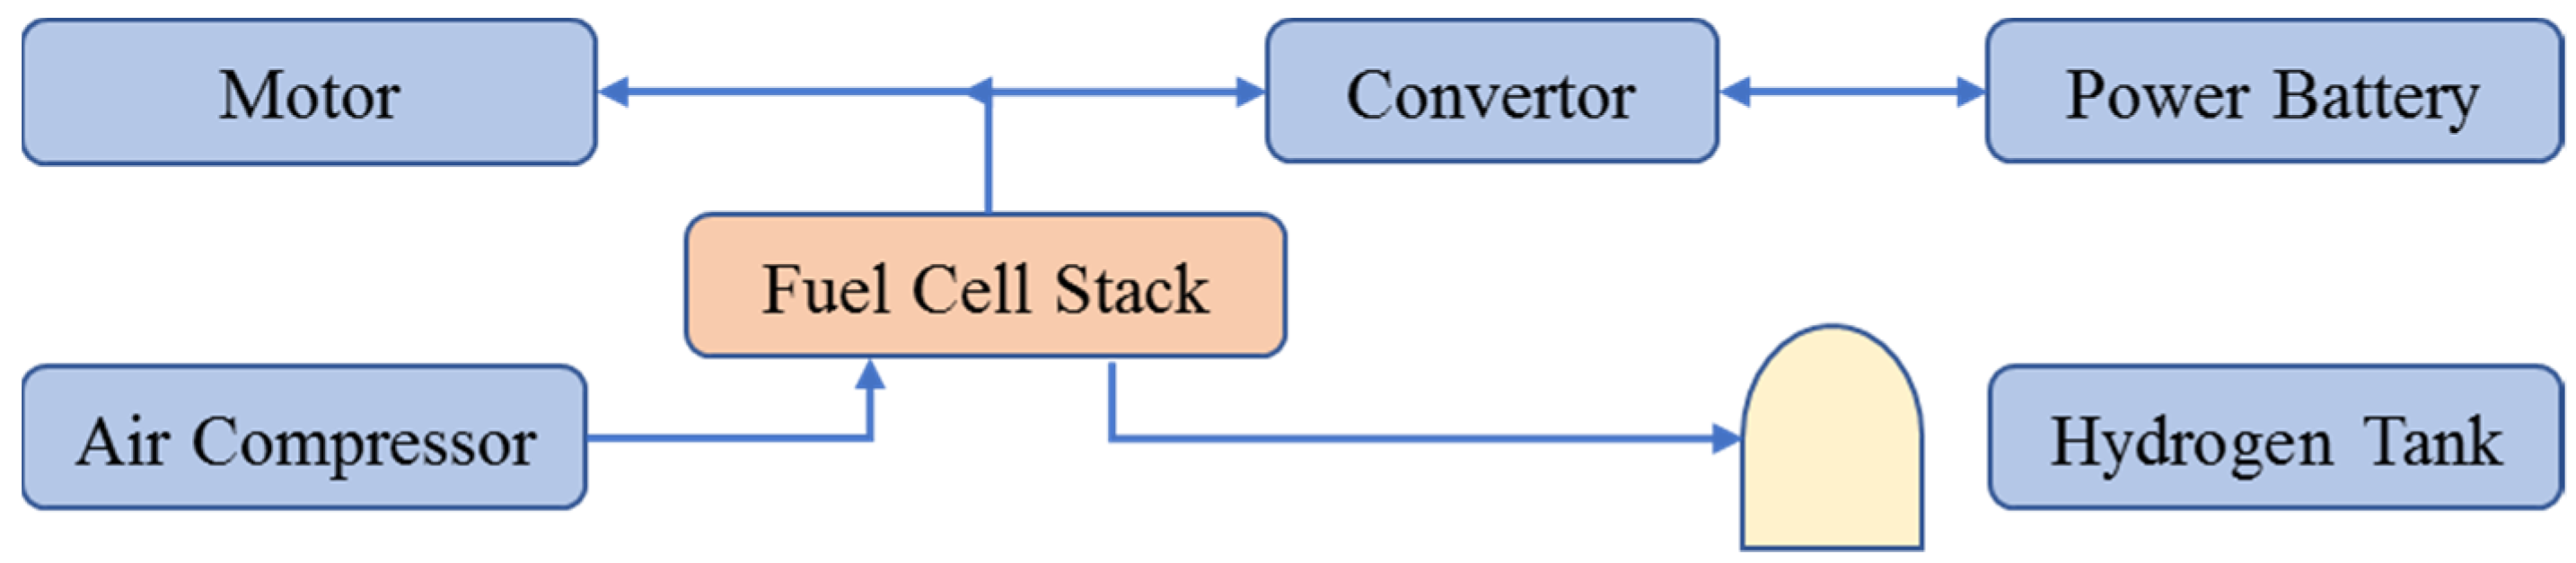
2.1. Introduction to the Power Systems
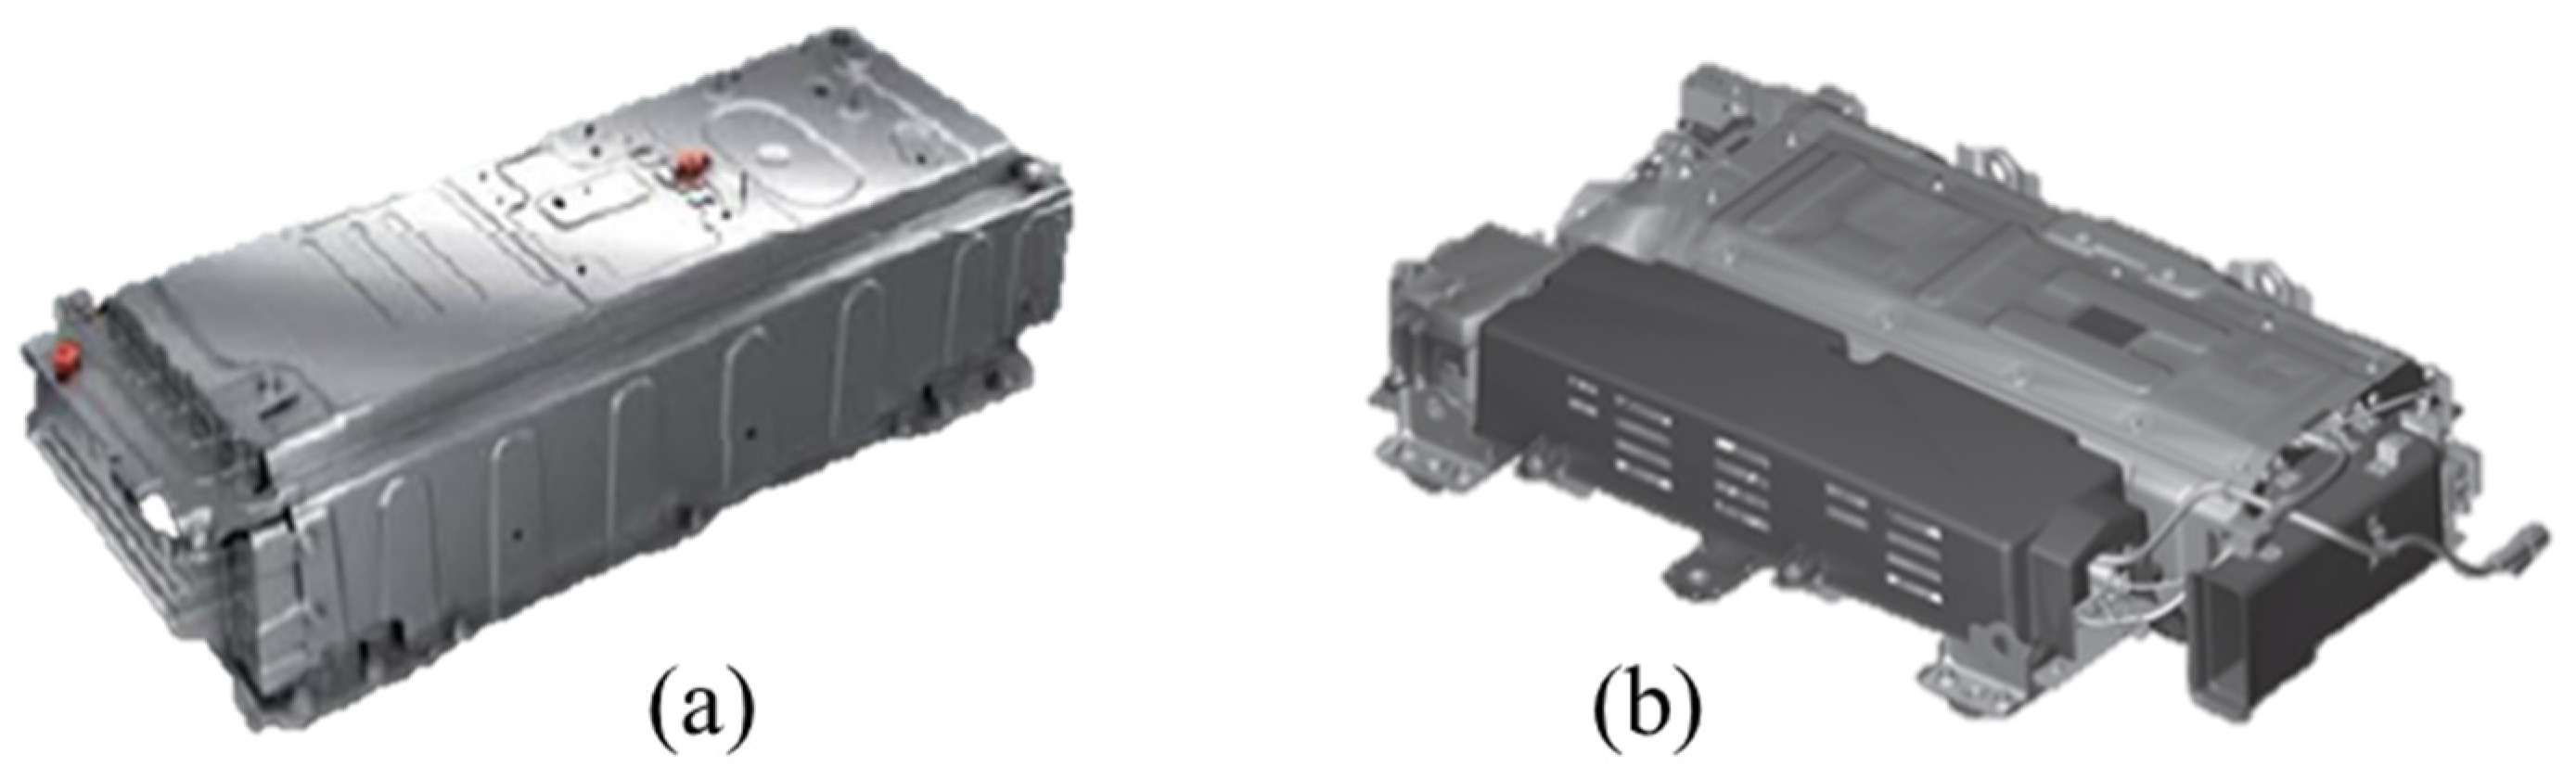
2.2. Power Battery Layout Types and Parameters of the Vehicles
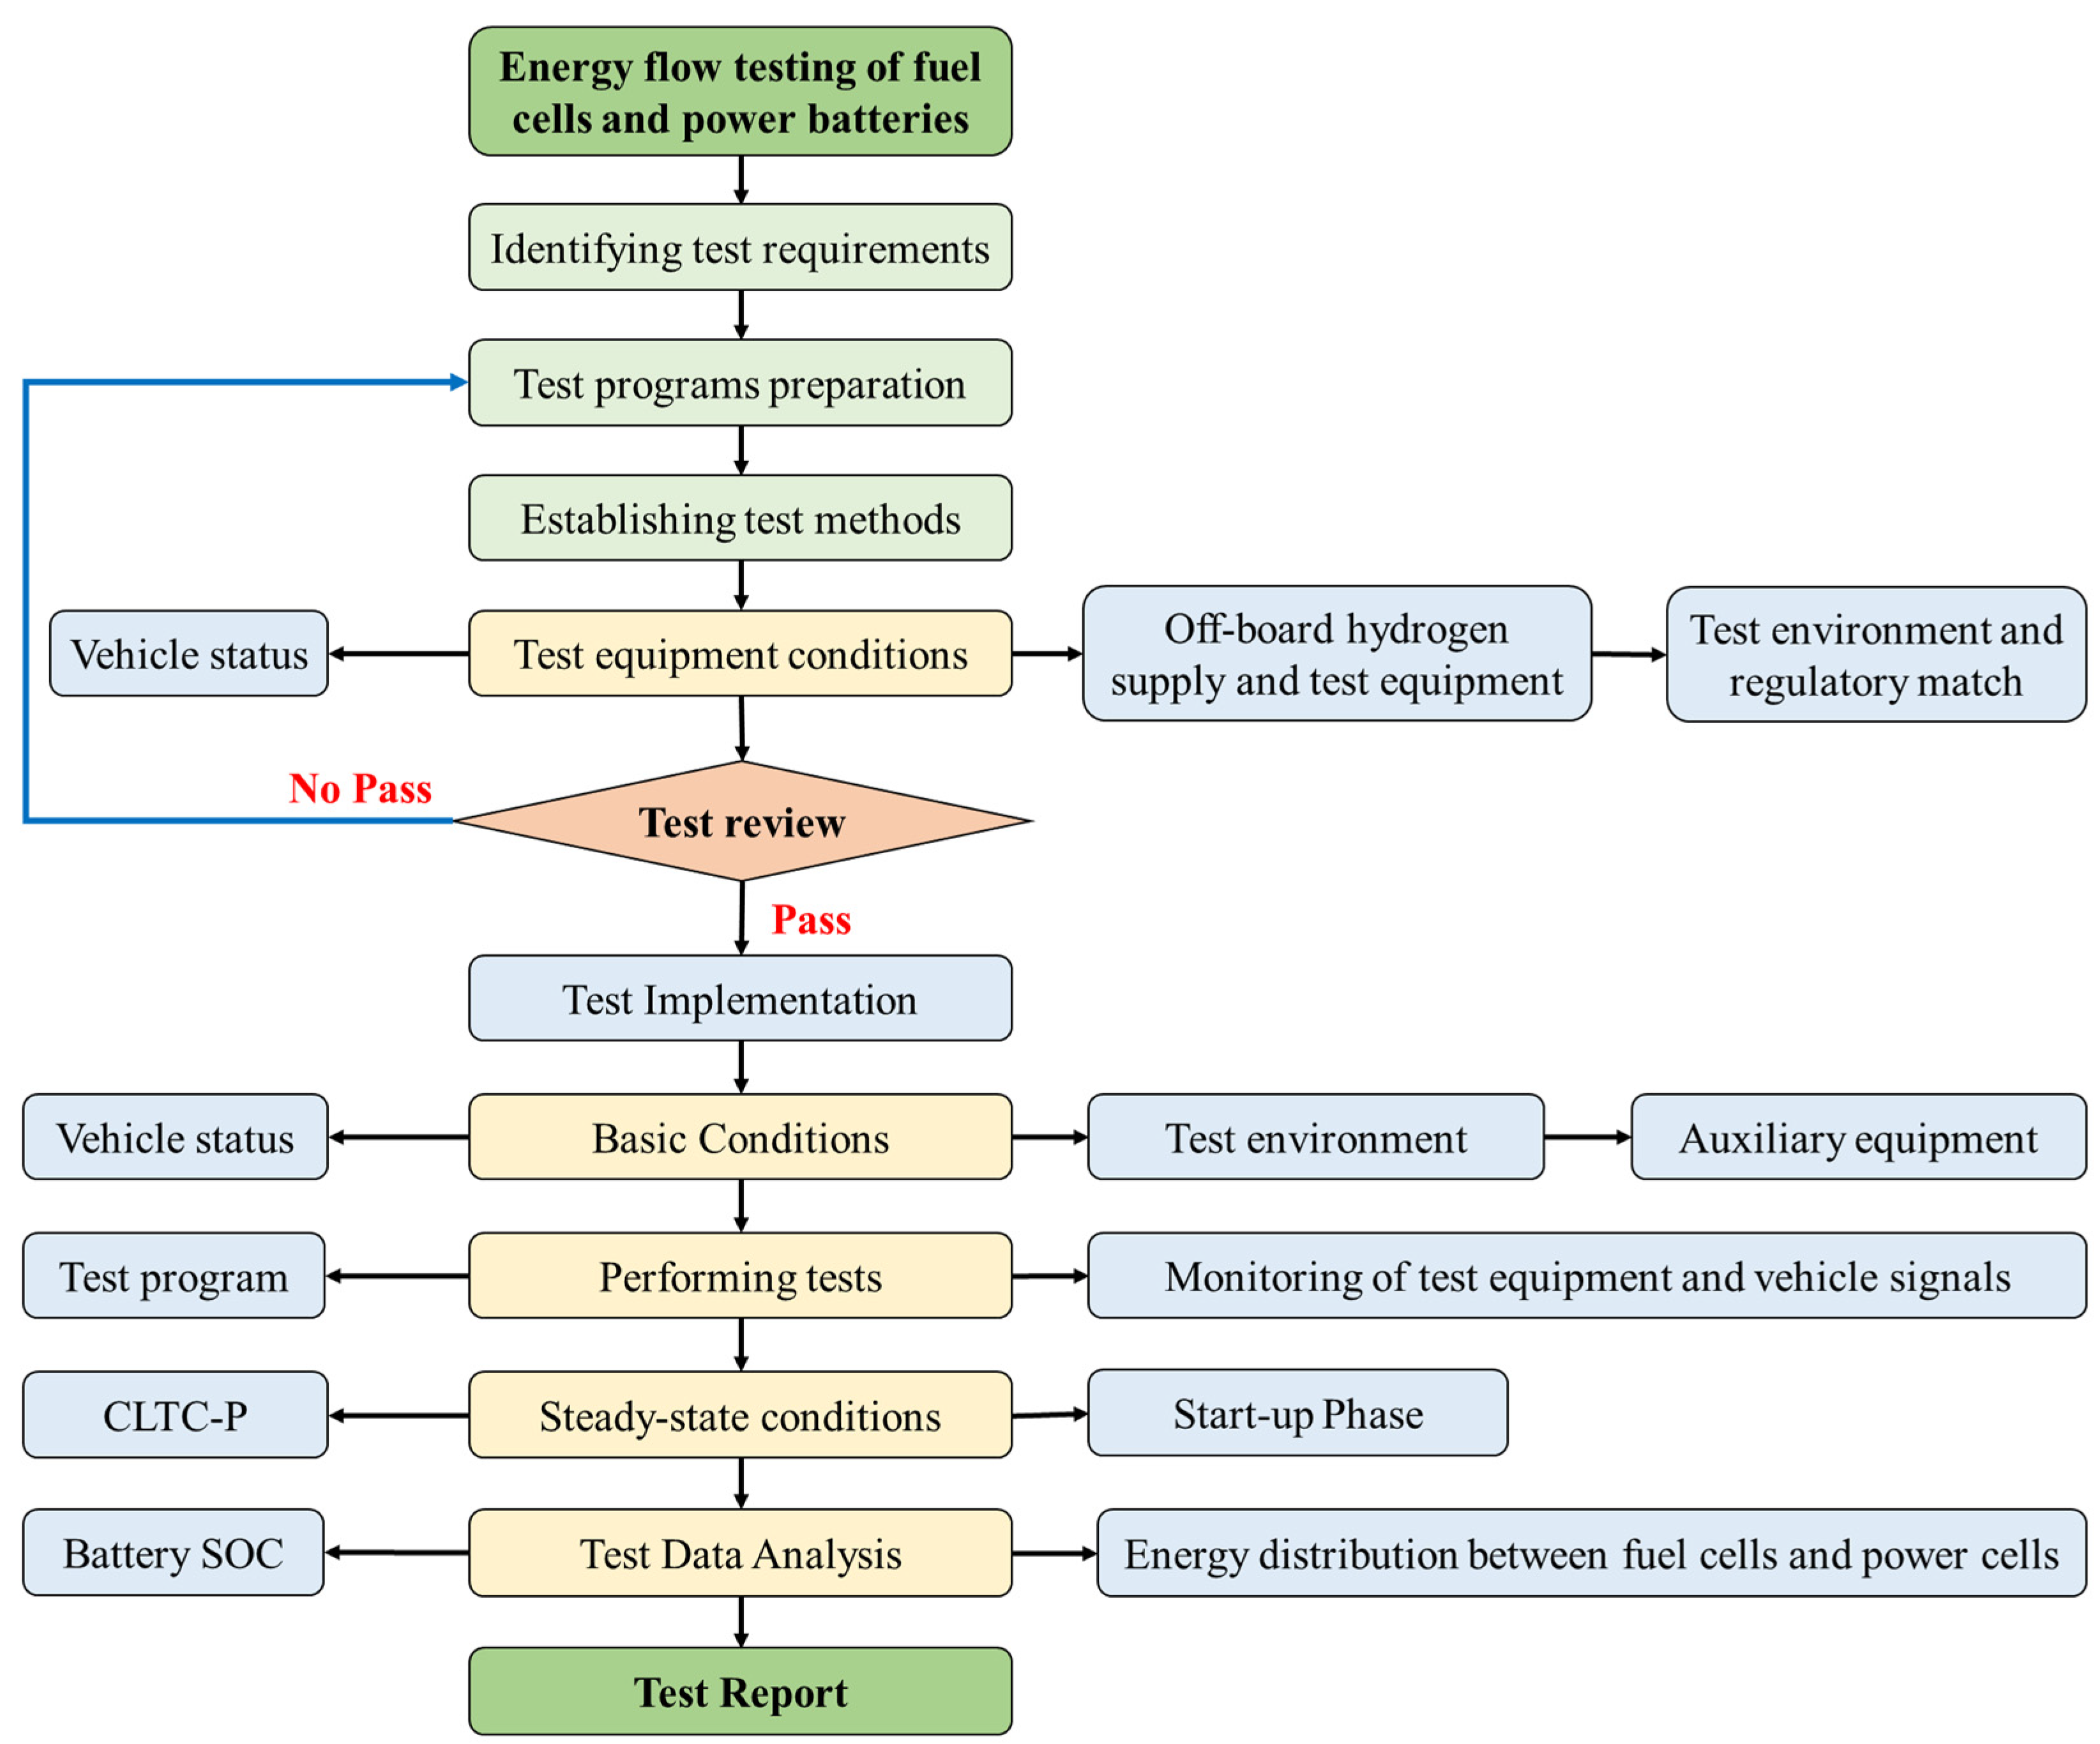
3. Test Method
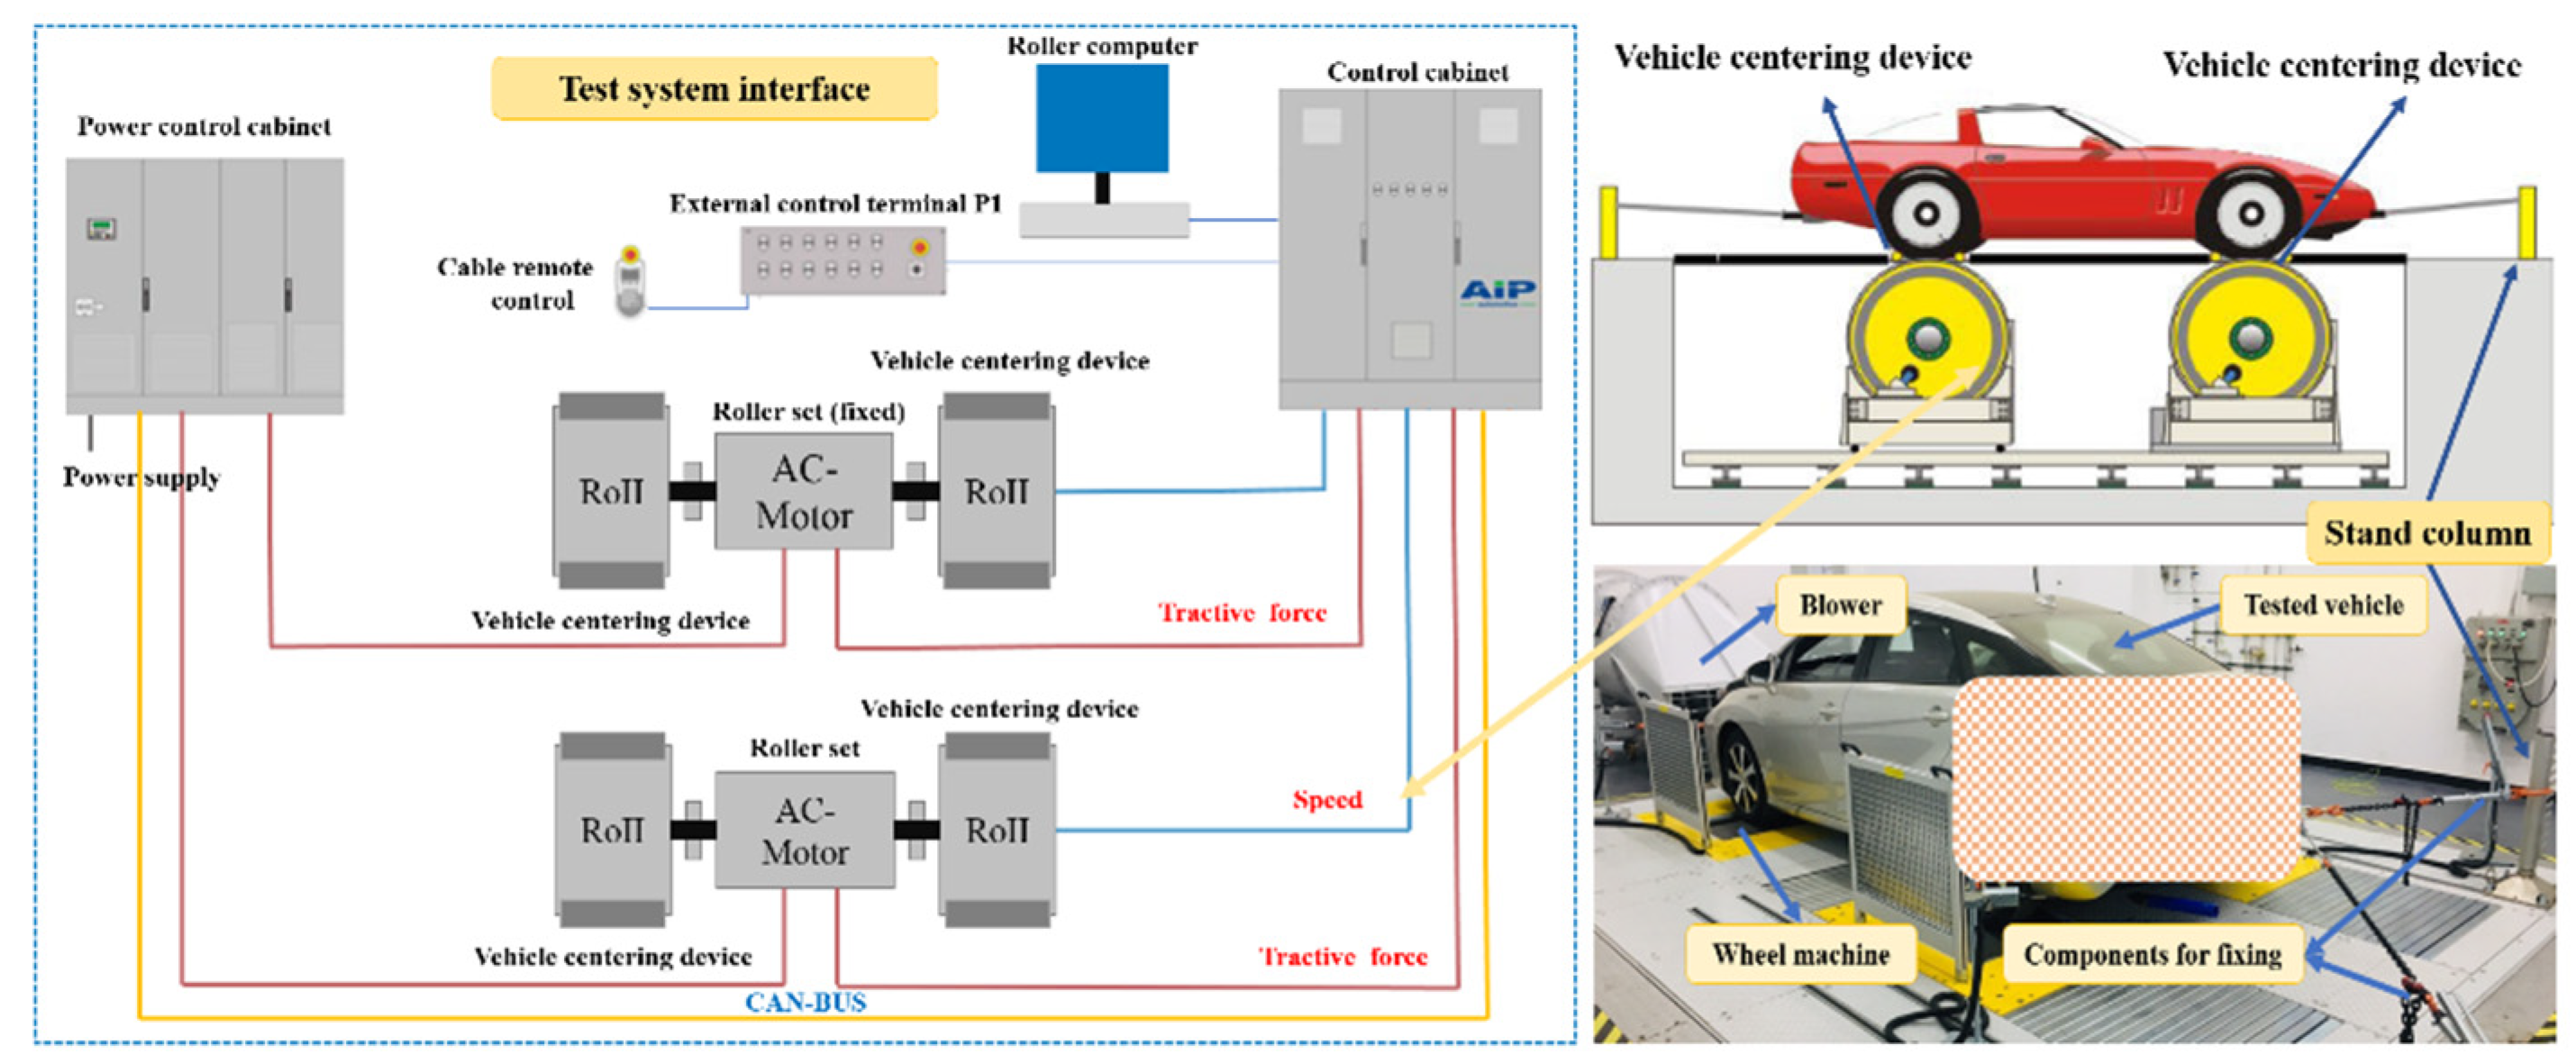
3.1. Test Stand
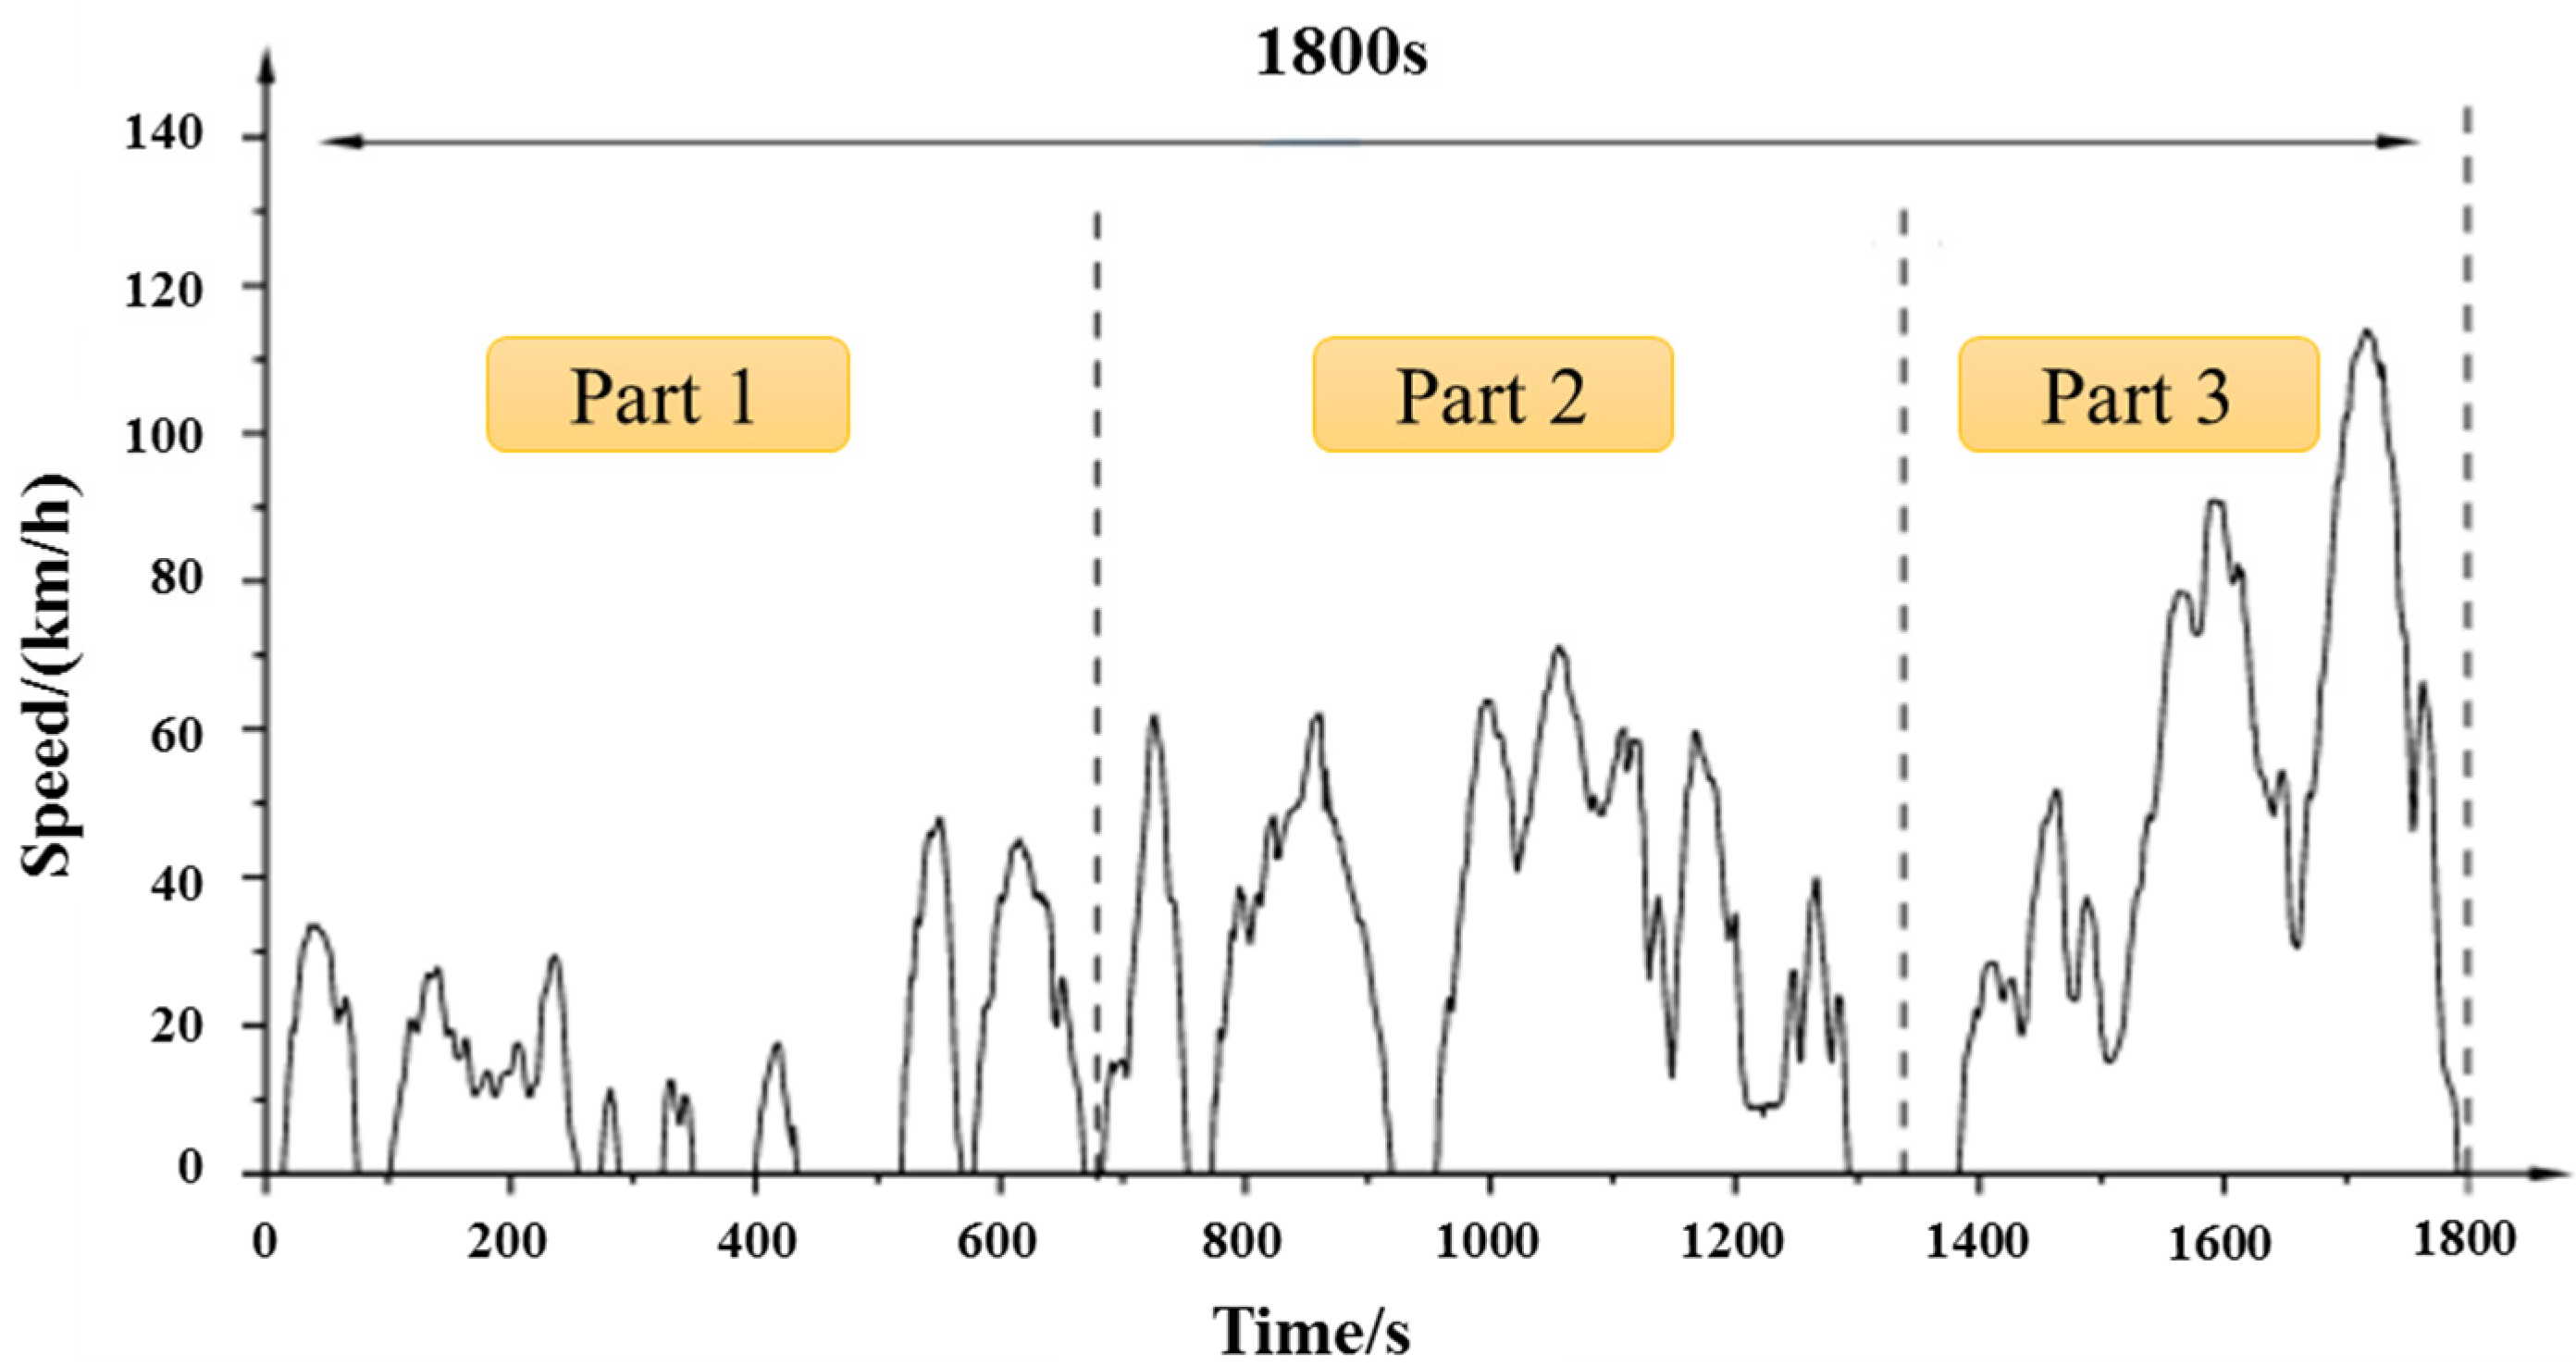
3.2. CLTC-P Working Condition
3.3. Test Methods and Procedures
3.3.1. Steady-State Power Test
- (a)
- Mount the vehicle on the drum stand;
- (b)
- Pull up the vehicle speed to 60 kM/h, warm up the machine for half an hour and observe the stable water temperature at the outlet of the electric pile (fluctuation ± 0.5 °C);
- (c)
- Stop the vehicle, switch the chassis dynamometer to constant speed mode within 3 s, and adjust the cooling fan airflow to the maximum;
- (d)
- Pull the speed up to 80 kM/h through the chassis dynamometer;
- (e)
- Depress the pedal, observe the fuel cell stack output power, stabilize it in the set power ±0.5 kW range, start timing for 5 min after the timing is finished, switch to the following working condition, and continue the test until the test is completed;
- (f)
- Observe the fuel cell stack outlet water temperature during the test. After the fuel cell stack outlet temperature is significantly higher than 80 °C, the fuel cell stack power should be immediately reduced to 10 kW working condition for cooling until the fuel cell stack outlet water temperature drops to 60 °C, then continue to complete the test.
3.3.2. CLTC-P Working Condition Test
- (a)
- After the vehicle is fixed to the chassis dynamometer, dip the vehicle for 30 min;
- (b)
- Warm-up the vehicle, operate the vehicle under a completed CLTC-P cycle, shut down the vehicle when the cycle ends, preset the vehicle;
- (c)
- Start recording the whole vehicle CAN signal, acquisition frequency 10 Hz;
- (d)
- According to the CLTC-P working condition table, carry out a continuous cycle working condition test. The hydrogen consumption, chassis dynamometer driving mileage, and other parameters of each process are recorded;
- (e)
- Stop after completing six cycles of testing;
- (f)
- Stop data recording and analyze the data.
4. Test Results and Discussion
4.1. Energy Flow Distribution Characteristics of Fuel Cell Stack and Power Cell under Different Modes
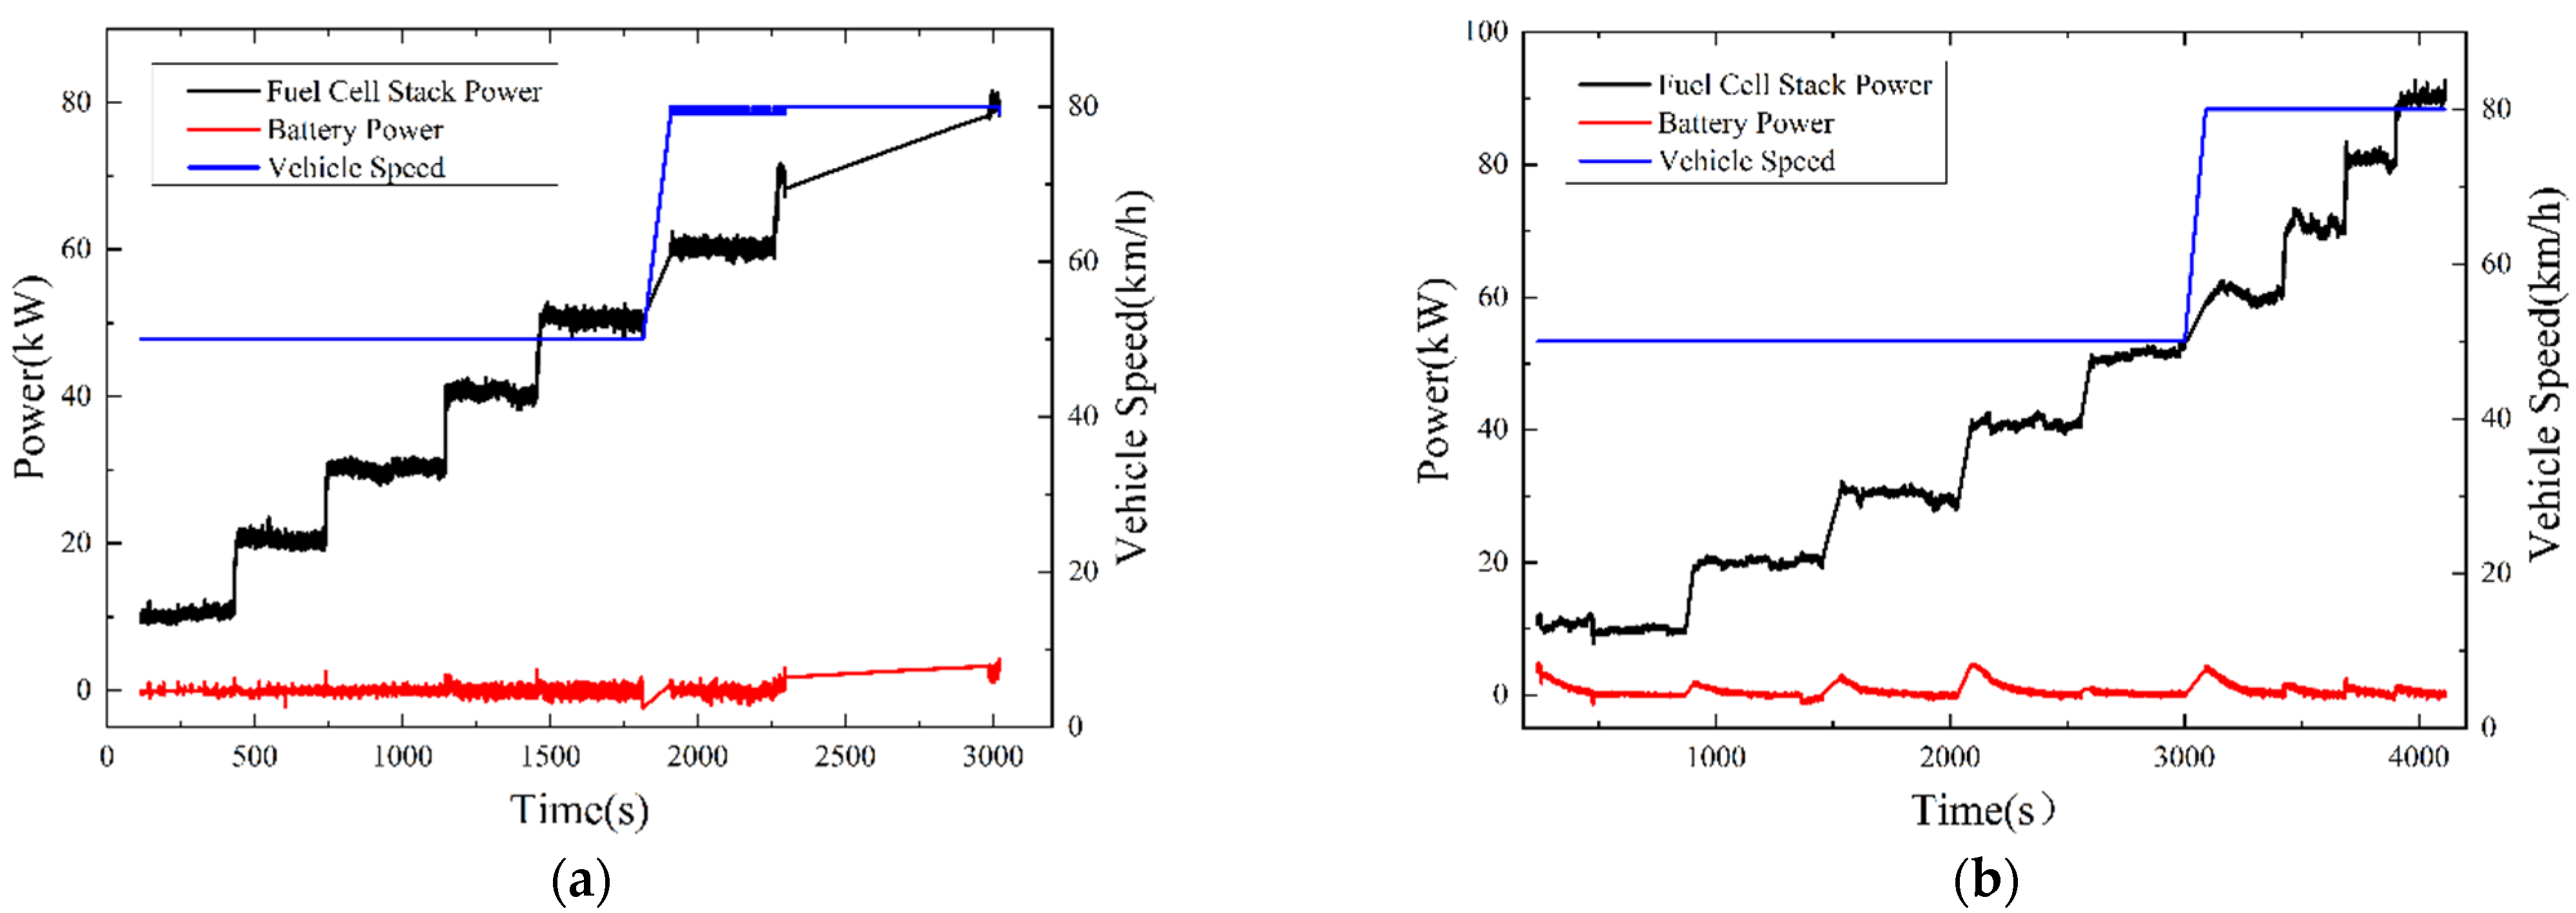
4.1.1. Constant Power Mode
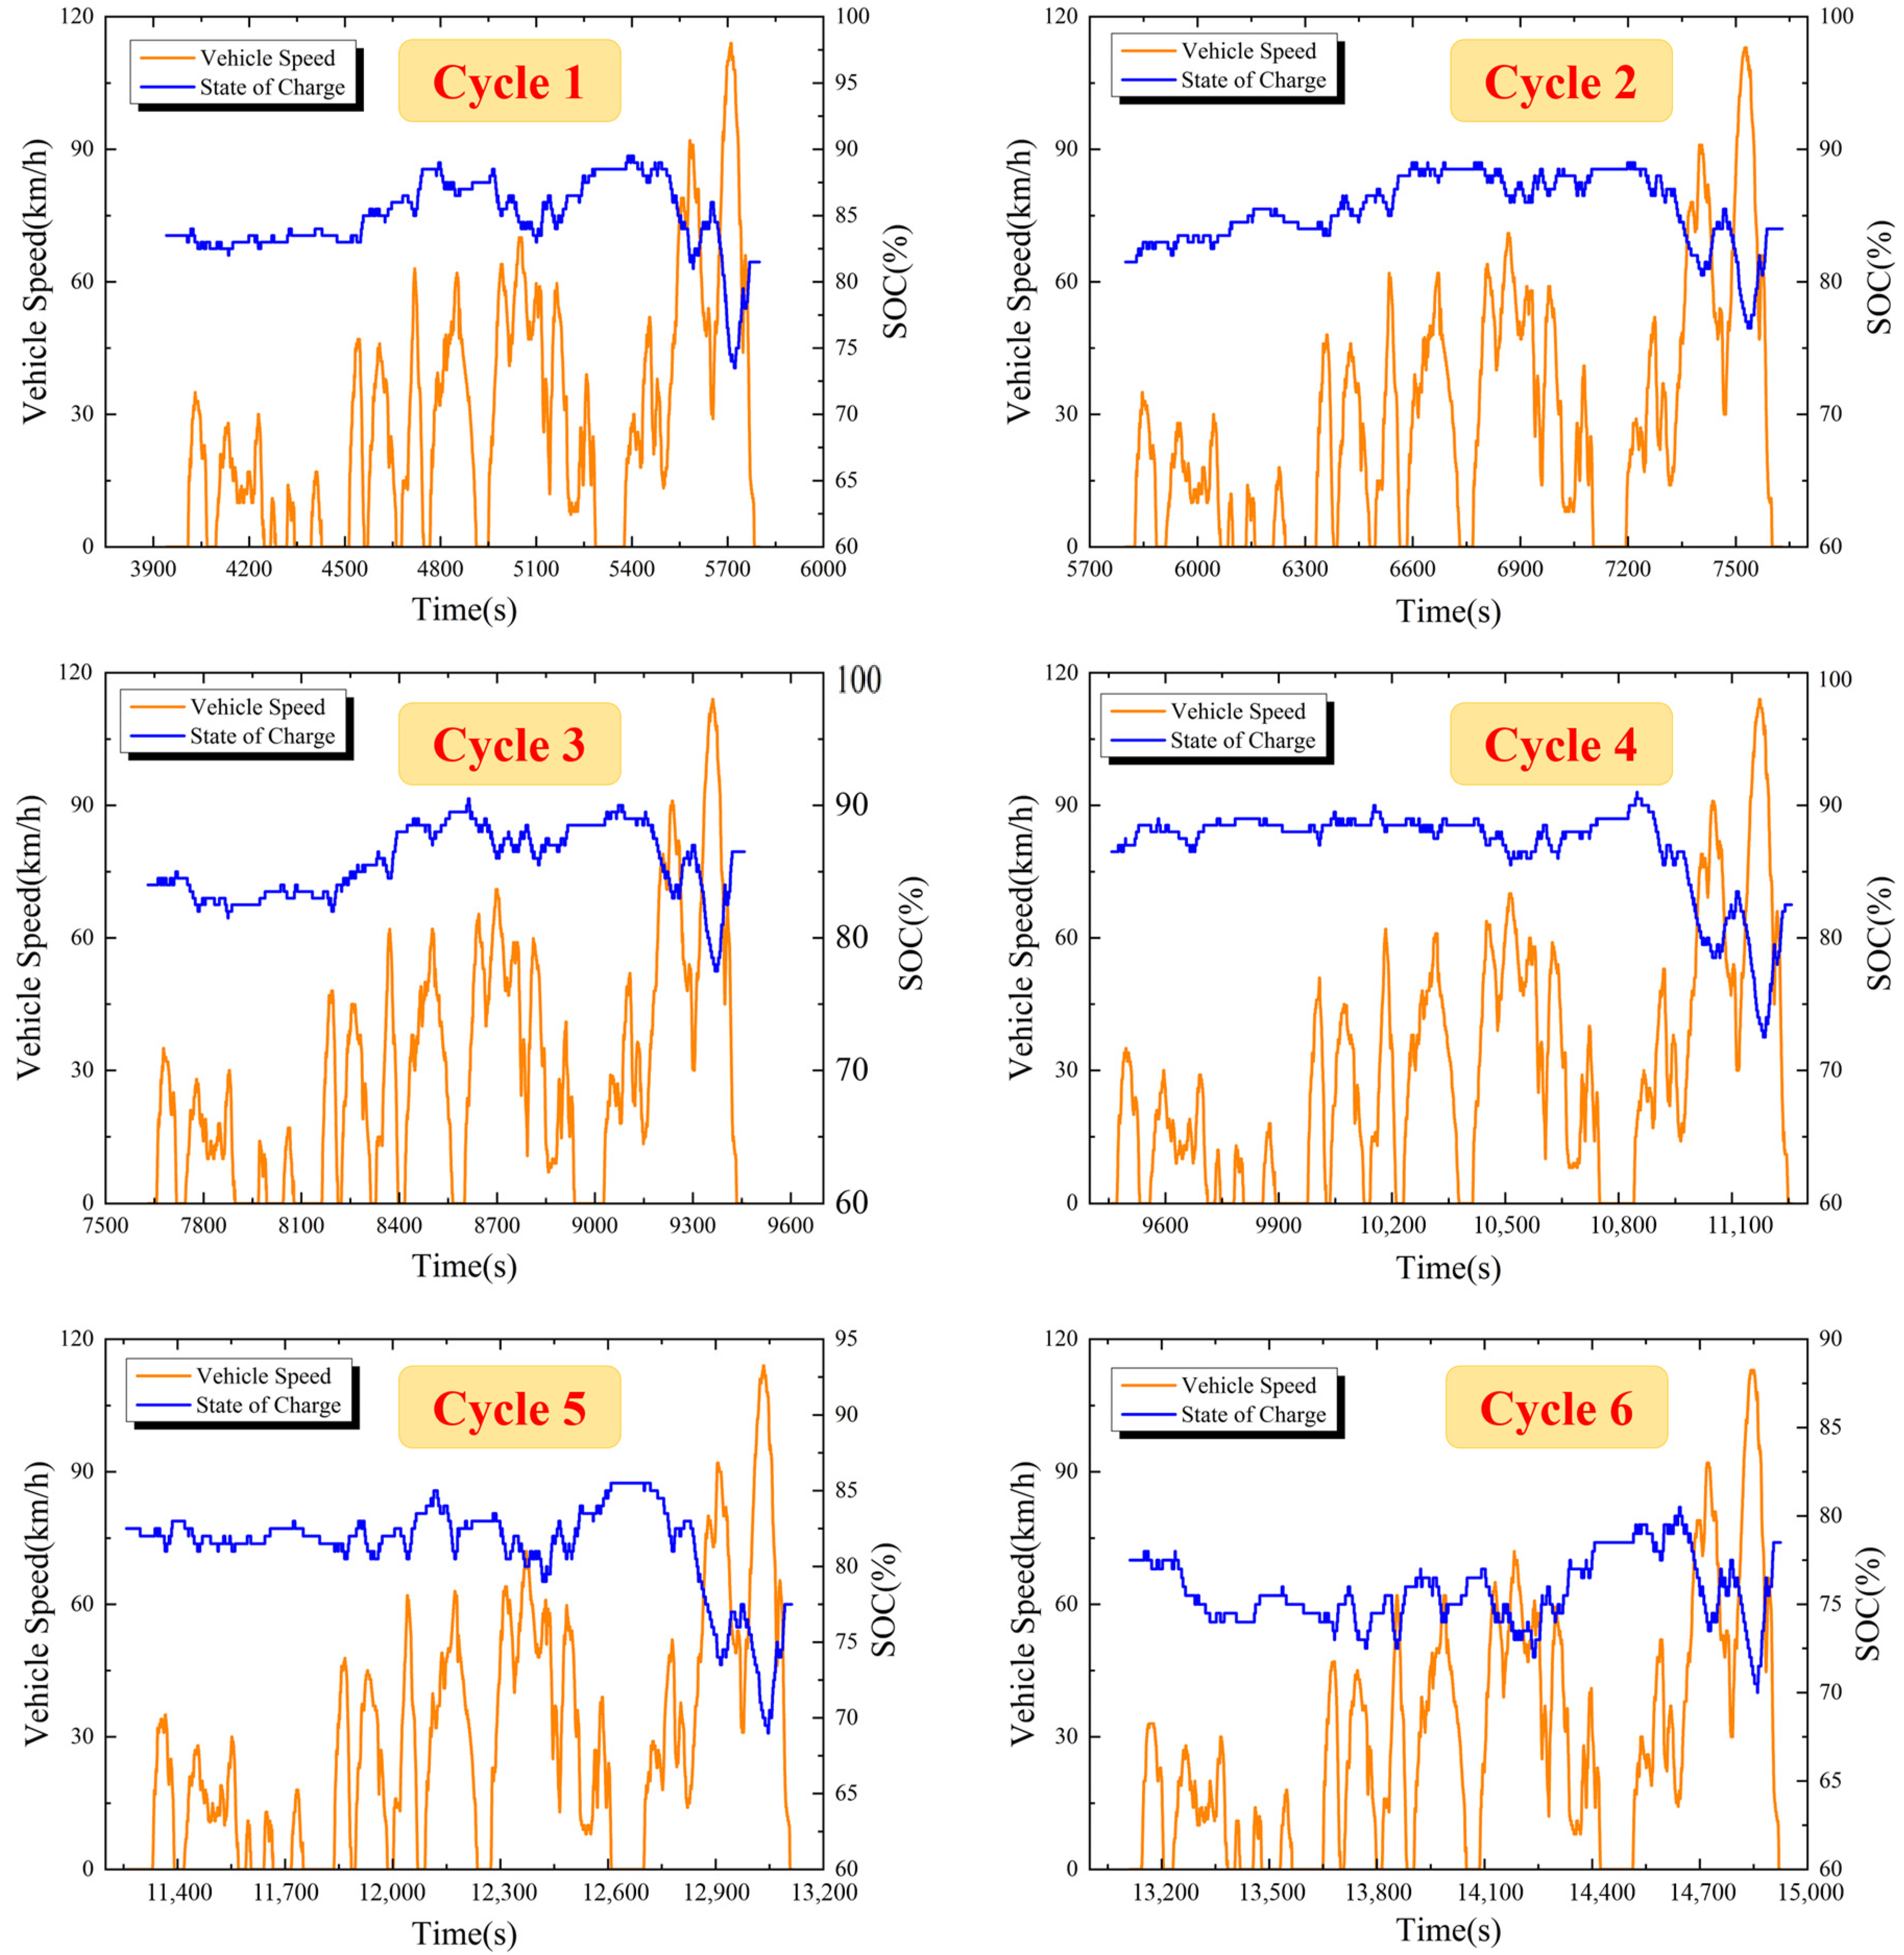
4.1.2. CLTC-P Cycle Conditions
4.2. Fuel Cell Stack Operating Characteristics Based on SOC Change Rate
4.2.1. Operating Characteristics of the Two Vehicles
4.2.2. Comparisons in the SOC Change Rates between the Two Vehicles
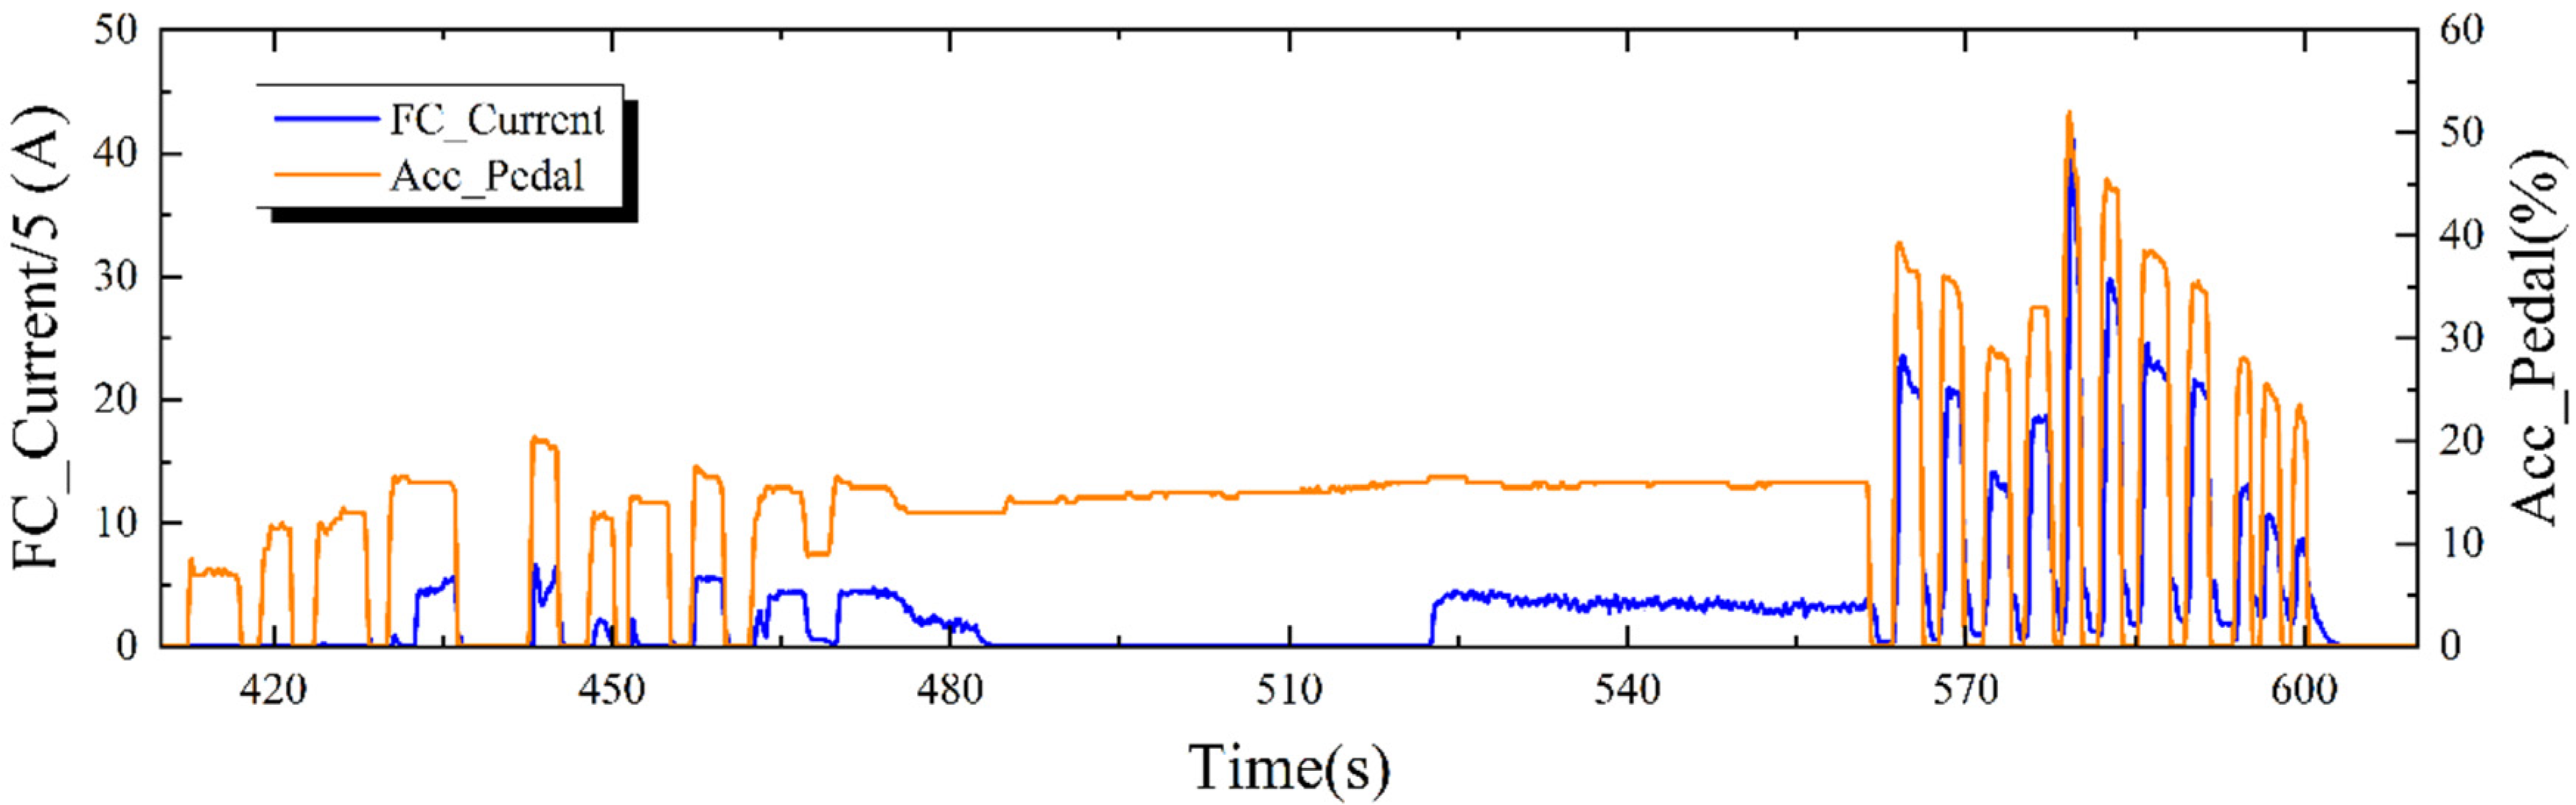
4.3. Operating Characteristics of the Fuel Cell Stack during the Startup Phase
5. Conclusions
- (1)
- The test vehicles’ energy management strategies are developed mainly based on power following. In each CLTC-P cycle, the ratio of cumulative power battery output energy of vehicle B is larger than that of vehicle A, reflecting the relatively higher contribution and participation of power battery in driving vehicle B;
- (2)
- Vehicle A has a smaller battery SOC variation interval and a lower variable rate than vehicle B. Therefore, compared to vehicle B, vehicle A is less dependent on the power battery when driving the vehicle and relies mainly on the fuel cell stack to follow the variation in the drive motor power;
- (3)
- In the low-torque demand phase, the reactor does not follow the drive motor power and is driven entirely by the power battery. This strategy can better protect the reactor from the high potential operation. The reactor shows good followability in the medium-to-high torque stabilization phase and the sizeable variable load phase.
Author Contributions
Funding
Data Availability Statement
Acknowledgments
Conflicts of Interest
References
- Li, Y.; Pei, P.; Wu, Z.; Ren, P.; Jia, X.; Chen, D.; Huang, S. Approaches to avoid flooding in association with pressure drop in proton exchange membrane fuel cells. Appl. Energy 2018, 224, 42–51. [Google Scholar] [CrossRef]
- Chen, D.; Pan, L.; Pei, P.; Huang, S.; Ren, P.; Song, X. Carbon-coated oxygen vacancies-rich Co3O4 nanoar-rays grow on nickel foam as efficient bifunctional electrocatalysts for rechargeable zinc-air batter-ies. Energy 2021, 224, 120142. [Google Scholar] [CrossRef]
- Yang, Z.; Du, Q.; Jia, Z.; Yang, C.; Xuan, J.; Jiao, K. A comprehensive proton exchange membrane fuel cell system model integrating various auxiliary subsystems. Appl. Energy 2019, 256, 113959. [Google Scholar] [CrossRef]
- Gérardin, K.; Raël, S.; Bonnet, C.; Arora, D.; Lapicque, F. Direct coupling of PEM fuel cell to supercapac-itors for higher durability and better energy management. Fuel Cells 2018, 18, 315–325. [Google Scholar] [CrossRef]
- De Luca, D.; Fragiacomo, P.; De Lorenzo, G.; Czarnetzki, W.T.; Schneider, W. Strategies for Dimensioning Two-Wheeled Fuel Cell Hybrid Electric Vehicles Using Numerical Analysis Software. Fuel Cells 2016, 16, 628–639. [Google Scholar] [CrossRef]
- Alloui, H.; Becherif, M.; Marouani, K. Modelling and frequency separation energy management of fuel Cell-Battery Hybrid sources system for Hybrid Electric Vehicle. In Proceedings of the 21st Mediterranean Conference on Control and Automation, Platanias, Greece, 25–28 June 2013. [Google Scholar]
- Kelouwani, S.; Agbossou, K.; Dubé, Y.; Boulon, L. Fuel cell Plug-in Hybrid Electric Vehicle anticipatory and real-time blended-mode energy management for battery life preservation. J. Power Sources 2013, 221, 406–418. [Google Scholar] [CrossRef]
- Hong, J.; Wang, Z.; Chen, W.; Wang, L.; Lin, P.; Qu, C. Online accurate state of health estimation for battery systems on real-world electric vehicles with variable driving conditions considered. J. Clean. Prod. 2021, 294, 125814. [Google Scholar] [CrossRef]
- Sulaiman, N.; Hannan, M.; Mohamed, A.; Majlan, E.; Daud, W.W. A review on energy management system for fuel cell hybrid electric vehicle: Issues and challenges. Renew. Sustain. Energy Rev. 2015, 52, 802–814. [Google Scholar] [CrossRef]
- Das, H.S.; Tan, C.W.; Yatim, A. Fuel cell hybrid electric vehicles: A review on power conditioning units and topologies. Renew. Sustain. Energy Rev. 2017, 76, 268–291. [Google Scholar] [CrossRef]
- Azidin, F.A.; Hannan, M.A.; Mohamed, A. Renewable energy technologies and hybrid electric vehicle challenges. Prz. Elektrotechniczny 2013, 89, 150–156. [Google Scholar]
- Kraa, O.; Ghodbane, H.; Saadi, R.; Ayad, M.Y.; Bahri, M. Energy management of fuel cell/ superca-pacitor hybrid source based on linear and sliding mode control. Energy Procedia 2015, 74, 1258–1264. [Google Scholar] [CrossRef] [Green Version]
- Ettihir, K.; Higuita Cano, M.; Boulon, L.; Agbossou, K. Design of an adaptive ems for fuel cell vehi-cles. Int. J. Hydrogen Energy 2017, 42, 1481–1489. [Google Scholar] [CrossRef]
- Li, Q.; Yang, H.; Han, Y.; Li, M.; Chen, W. A state machine strategy based on droop control for an ener-gy management system of pemfc-battery-supercapacitor hybrid tramway. Int. J. Hydrogen Energy 2016, 41, 16148–16159. [Google Scholar] [CrossRef]
- Hwang, J.J.; Chen, Y.J.; Kuo, J.K. The study on the power management system in a fuel cell hybrid ve-hicle. Int. J. Hydrogen Energy 2012, 37, 4476–4489. [Google Scholar] [CrossRef]
- Mohammedi, M.; Kraa, O.; Becherif, M.; Aboubou, A.; Ayad, M.Y.; Bahri, M. Fuzzy logic and passivi-ty-based controller applied to electric vehicle using fuel cell and supercapacitors hybrid source. Energy Procedia 2014, 50, 619–626. [Google Scholar]
- Li, Q.; Chen, W.; Li, Y.; Liu, S.; Huang, J. Energy management strategy for fuel cell/battery/ultracapacitor hybrid vehicle based on fuzzy logic. Int. J. Electr. Power Energy Syst. 2012, 43, 514–525. [Google Scholar] [CrossRef]
- Erdinc, O.; Vural, B.; Uzunoglu, M. A wavelet-fuzzy logic based energy management strategy for a fuel cell/battery/ultra-capacitor hybrid vehicular power system. J. Power Sources 2009, 194, 369–380. [Google Scholar] [CrossRef]
- Li, C.Y.; Liu, G.P. Optimal fuzzy power control and management of fuel cell/battery hybrid vehi-cles. J. Power Sources 2009, 192, 525–533. [Google Scholar] [CrossRef]
- Hong, Z.; Zhu, Y.; Shang, W.; Li, Q.; Chen, W. Research of energy management strategy for fuel cell/battery hybrid locomotive. In Proceedings of the 2017 IEEE Transportation Electrification Conference and Expo, Asia-Pacific (ITEC Asia-Pacific), Harbin, China, 7–10 August 2017. [Google Scholar]
- Bizon, N.; Iana, G.; Kurt, E.; Thounthong, P.; Oproescu, M.; Culcer, M.; Iliescu, M. Air flow real-time optimi-zation strategy for fuel cell hybrid power sources with fuel flow based on load-following. Fuel Cells 2018, 18, 809–823. [Google Scholar] [CrossRef]
- Zhang, P.; Yan, F.; Du, C. A comprehensive analysis of energy management strategies for hybrid elec-tric vehicles based on bibliometrics. Renew. Sustain. Energy Rev. 2015, 48, 88–104. [Google Scholar] [CrossRef]
- Fares, D.; Chedid, R.; Panik, F.; Karaki, S.; Jabr, R. Dynamic programming technique for optimizing fuel cell hybrid vehicles. Int. J. Hydrogen Energy 2015, 40, 7777–7790. [Google Scholar] [CrossRef]
- Xu, L.; Li, J.; Hua, J.; Li, X.; Ouyang, M. Adaptive supervisory control strategy of a fuel cell/battery-powered city bus. J. Power Sources 2009, 194, 360–368. [Google Scholar] [CrossRef]
- Ouddah, N.; Adouane, L.; Abdrakhmanov, R. From Offline to Adaptive Online Energy Management Strategy of Hybrid Vehicle Using Pontryagin’s Minimum Principle. Int. J. Automot. Technol. 2018, 19, 571–584. [Google Scholar] [CrossRef]
- Chen, Q.; Gao, L.; Dougal, R.A.; Quan, S. Multiple model predictive control for a hybrid proton ex-change membrane fuel cell system. J. Power Sources 2009, 191, 473–482. [Google Scholar] [CrossRef]
- Bambang, R.T.; Rohman, A.S.; Dronkers, C.J.; Ortega, R.; Sasongko, A. Energy management of fuel cell/battery/supercapacitor hybrid power sources using model predictive control. IEEE Trans. Ind. Inform. 2014, 10, 1992–2002. [Google Scholar]


| Vehicle Type | Vehicle A | Vehicle B |
|---|---|---|
| Power Battery | NI-MH | Lithium |
| Self-discharge Rate | 20% | 5% |
| Cycle life | >500 | >800 |
| Capacity (kWh) | 1.6 | 1.56 |
| Operating temperature (℃) | −20~60 | −20~70 |
| Nominal Voltage (V) | 245 | 240 |
| Decorate Position | Luggage Room | Luggage Room |
| Cooling Mode | Air Cooling | Hydrocooling |
| Features | Overall | Part 1 | Part 2 | Part 3 |
|---|---|---|---|---|
| Running time/s | 1800 | 674 | 693 | 433 |
| Mileage/km | 14.48 | 2.45 | 5.91 | 6.12 |
| Maximum speed/(km/h) | 114.00 | 48.10 | 71.20 | 144.00 |
| Maximum acceleration/(m/s2) | 1.47 | 1.47 | 1.44 | 1.06 |
| Maximum deceleration/(m/s2) | −1.47 | −1.42 | −1.47 | −1.46 |
| Average speed/(km/h) | 28.96 | 13.09 | 30.68 | 50.90 |
| Average acceleration/(m/s2) | 0.45 | 0.42 | 0.46 | 0.46 |
| Average deceleration/(m/s2) | −0.49 | −0.45 | −0.50 | −0.54 |
| Acceleration ratio/% | 28.78 | 22.55 | 30.45 | 35.80 |
| Deceleration ratio/% | 26.44 | 21.51 | 28.43 | 30.95 |
| Uniformity ratio/% | 22.67 | 20.77 | 21.36 | 27.71 |
| Idle speed ratio/% | 22.11 | 35.16 | 19.77 | 5.54 |
| Cycle Number | Battery Cumulative Energy Output (kW·h) | Battery Energy Change (kW·h) | Fuel Cell Energy Output (kW·h) | Total Energy Output (kW·h) | Battery Energy Output Ratio |
|---|---|---|---|---|---|
| 1 | 0.66 | 0.0225 | 2.92 | 2.9425 | 0.65 |
| 2 | 0.66 | 0 | 2.89 | 2.89 | 0.66 |
| 3 | 0.66 | −0.0075 | 2.85 | 2.8425 | 0.66 |
| 4 | 0.68 | 0 | 2.70 | 2.7 | 0.68 |
| 5 | 0.70 | 0.0075 | 2.76 | 2.7675 | 0.7 |
| 6 | 0.70 | −0.0075 | 2.73 | 2.7225 | 0.7 |
| Total | 4.06 | 0.015 | 16.85 | 16.865 | 4.1 |
| Cycle Number | Battery Cumulative Energy Output (kW·h) | Battery Energy Change (kW·h) | Fuel Cell Energy Output (kW·h) | Total Energy Output (kW·h) | Battery Energy Output Ratio |
|---|---|---|---|---|---|
| 1 | 1.42 | −0.0312 | 2.31 | 2.2788 | 0.64 |
| 2 | 1.34 | 0.039 | 2.36 | 2.399 | 0.54 |
| 3 | 1.31 | 0.039 | 2.47 | 2.509 | 0.51 |
| 4 | 1.30 | −0.0624 | 2.4 | 2.3376 | 0.58 |
| 5 | 1.31 | −0.078 | 2.17 | 2.092 | 0.66 |
| 6 | 1.22 | 0.0234 | 2.26 | 2.2834 | 0.52 |
| Total | 7.9 | −0.0702 | 13.97 | 13.8998 | 3.46 |
| Cycle Number | SOC Maximum (%) | SOC Minimum (%) | Range (%) | Average SOC (%) |
|---|---|---|---|---|
| 1 | 89.5 | 73.5 | 16 | 84.8 |
| 2 | 89.5 | 76.5 | 13 | 85.5 |
| 3 | 90 | 77.5 | 12.5 | 85.7 |
| 4 | 91 | 72.5 | 18.5 | 86.8 |
| 5 | 85.5 | 69 | 16.5 | 81.4 |
| 6 | 80.5 | 70 | 10.5 | 75.7 |
| Cycle Number | SOC Maximum (%) | SOC Minimum (%) | Range (%) | Average SOC (%) |
|---|---|---|---|---|
| 1 | 59.5 | 53 | 6.5 | 56.1 |
| 2 | 60 | 53.5 | 6.5 | 56.9 |
| 3 | 60 | 53.5 | 6.5 | 56.9 |
| 4 | 58.5 | 53.5 | 5 | 56.5 |
| 5 | 59.5 | 53.5 | 6 | 56.8 |
| 6 | 60 | 53.5 | 6.5 | 57 |
Publisher’s Note: MDPI stays neutral with regard to jurisdictional claims in published maps and institutional affiliations. |
© 2021 by the authors. Licensee MDPI, Basel, Switzerland. This article is an open access article distributed under the terms and conditions of the Creative Commons Attribution (CC BY) license (https://creativecommons.org/licenses/by/4.0/).
Share and Cite
Duan, Z.; Li, C.; Feng, L.; Yu, S.; Jiang, Z.; Xu, X.; Hong, J.; Chen, D. Investigation on Energy Flow Characteristics of Fuel Cell System Based on Real Vehicle Tests. Energies 2021, 14, 8172. https://0-doi-org.brum.beds.ac.uk/10.3390/en14238172
Duan Z, Li C, Feng L, Yu S, Jiang Z, Xu X, Hong J, Chen D. Investigation on Energy Flow Characteristics of Fuel Cell System Based on Real Vehicle Tests. Energies. 2021; 14(23):8172. https://0-doi-org.brum.beds.ac.uk/10.3390/en14238172
Chicago/Turabian StyleDuan, Zhijie, Chen Li, Lili Feng, Shuguang Yu, Zengyou Jiang, Xiaoming Xu, Jichao Hong, and Dongfang Chen. 2021. "Investigation on Energy Flow Characteristics of Fuel Cell System Based on Real Vehicle Tests" Energies 14, no. 23: 8172. https://0-doi-org.brum.beds.ac.uk/10.3390/en14238172