
Methane Pyrolysis in Molten Potassium Chloride: An Experimental and Economic Analysis
by
 ,
,
Jinho Boo
1, 
Eun Hee Ko
2,
No-Kuk Park
3,
Changkook Ryu
4,
Yo-Han Kim
5,
Jinmo Park
5,* and
Dohyung Kang
2,* 1
Department of Chemistry, College of Science, Yeungnam University, Gyeongsan 38541, Korea
2
School of Chemical Engineering, Yeungnam University, 280 Daehak-ro, Gyeongsan 38541, Korea
3
Institute of Clean Technology, Yeungnam University, 280 Daehak-ro, Gyeongsan 38541, Korea
4
School of Mechanical Engineering, Sungkyunkwan University, Suwon 16419, Korea
5
H2 Technology, R&D Division, KOGAS Research Institute, 950 Incheonsinhang-Daero, Yeonsu-Gu, Incheon 21993, Korea
*
Authors to whom correspondence should be addressed.
Energies 2021, 14(23), 8182; https://0-doi-org.brum.beds.ac.uk/10.3390/en14238182
Submission received: 15 November 2021
/
Revised: 29 November 2021
/
Accepted: 1 December 2021
/
Published: 6 December 2021
Abstract
:Although steam methane reforming (CH4 + 2H2O → 4H2 + CO2) is the most commercialized process for producing hydrogen from methane, more than 10 kg of carbon dioxide is emitted to produce 1 kg of hydrogen. Methane pyrolysis (CH4 → 2H2 + C) has attracted much attention as an alternative to steam methane reforming because the co-product of hydrogen is solid carbon. In this study, the simultaneous production of hydrogen and separable solid carbon from methane was experimentally achieved in a bubble column filled with molten potassium chloride. The melt acted as a carbon-separating agent and as a pyrolytic catalyst, and enabled 40 h of continuous running without catalytic deactivation with an apparent activation energy of 277 kJ/mole. The resultant solid was purified by water washing or acid washing, or heating at high temperature to remove salt residues from the carbon. Heating the solid product at 1200 °C produced the highest purity carbon (97.2 at%). The economic feasibility of methane pyrolysis was evaluated by varying key parameters, that is, melt loss, melt price, and carbon revenue. Given a potassium chloride loss of <0.1 kg of salt per kg of produced carbon, the carbon revenue was calculated to be USD > 0.45 per kg of produced carbon. In this case, methane pyrolysis using molten potassium chloride may be comparable to steam methane reforming with carbon capture storage.
1. Introduction
Global carbon dioxide (CO2) emissions resulting from the combustion of fossil fuels continue to increase steadily, and have already caused anthropogenic climate changes [1]. To decrease atmospheric CO2 concentrations, focus has been directed toward non-fossil energy sources that do not generate CO2 [2,3]. Many studies have been performed on hydrogen as an energy source [4,5], because its combustion in air generates only water. However, steam methane reforming (SMR; CH4 + 2H2O → 4H2 + CO2) is the process most commonly used to produce hydrogen, and it generates ~10 kg of CO2 per 1 kg of hydrogen [6,7]. The amount of hydrogen produced annually is ~50 million tons, but more than half is consumed as a raw material by the petrochemical industry. Therefore, the current hydrogen industry should be modernized to produce hydrogen in an environmentally friendly manner.
To achieve a successful transition from a fossil fuel-based energy system to hydrogen, a cost-effective process that can produce a large amount of hydrogen without generating CO2 is required. Many researchers have studied the effectiveness of water electrolysis powered by renewable energy [8,9], but none of the electrolytic processes devised to date are as cost-effective as SMR. Thus, a near-term environmentally friendly process that can produce hydrogen in a cost-effective manner is required to replace SMR.
Methane pyrolysis (CH4 → 2H2 + C) has been widely examined as an alternative means of producing hydrogen without CO2 [10,11,12], and involves the simple decomposition of methane into molecular hydrogen and solid carbon. Because only hydrogen is produced in a gaseous stream, this process is not burdened by the cost of separating hydrogen from a product mixture. The raw material, methane, is abundant and cheap, and its pyrolysis requires less heat than SMR (~37.5 vs. ~41.3 kJ/mol of H2 produced). Most importantly, no oxygen is consumed during methane pyrolysis, and thus, the amount of CO2 produced is minuscule compared with SMR [13]. However, methane pyrolysis produces less hydrogen per mole of methane than SMR (2 versus 4 moles of H2/mole of CH4). The result is that the commercial viability of methane pyrolysis depends on the production of separable solid carbon with commercial value [14].
To pyrolyze methane, the strong C–H bonds must be broken, and this requires considerable heat input. Without a suitable catalyst, cleavage of the first C–H bond requires temperatures in excess of 1200 °C, and under these conditions, the CH3 radicals formed combine to form various hydrocarbon intermediates in the gas phase [15,16]. Solid catalysts have been widely used to reduce pyrolysis temperatures, and transition metals such as nickel [17], iron [18], and cobalt [19] have been considered because they provide rapid reaction rates and are relatively cheap. For example, the use of a nickel-based catalyst decreased the activation energy from 422 kJ/mole [20] for non-catalyzed gaseous methane pyrolysis to ~50 kJ/mole [21]. Interestingly, defective sites in solid carbon can also act as pyrolytic catalysts [22]. Maradov measured the catalytic activities of various types of carbon, and found that they depended on defect structures and surface areas [11].
During methane pyrolysis on a solid catalyst, methane is strongly chemisorbed on the surface and then dehydrogenated [12]. The C–C bonds formed on the surfaces of solid catalysts oligomerize to form carbonaceous species and eventually solid carbon, which remains on the catalyst. However, this carbon coke cannot be easily removed and finally deactivates the catalyst [23]. Thus, to re-use catalysts for methane pyrolysis, these carbonaceous products are removed by oxidation with air [24], H2O [25], or CO2 [26], which substantially increases operating costs and CO2 emissions.
However, methane can also be pyrolyzed in a bubble column filled with a high-temperature liquid [27]. The methane is bubbled through the melt in a column, and at gas–liquid interfaces is catalytically decomposed into molecular hydrogen and carbonaceous species; because the gas–melt interface is continuously renewed as bubbles rise through the column, methane contacts carbon-free melt surfaces, and carbonaceous products tend to be released into the gas phase rather than being adsorbed on melt surfaces, which circumvents the problem of carbon immobilization on the catalyst. As a result, catalytic deactivation has hardly been observed in such melt systems.
Several studies have reported the successful production of separable carbon and high-purity hydrogen in a molten system. By reacting methane in molten metals or salts with relatively low melting points in bubble columns, gaseous hydrogen is continuously produced, and separable solid carbon is collected from melt surfaces. Serban et al. used molten tin and silicon carbide mixtures as catalysts for methane pyrolysis [28]. Plevan et al. [29] and Geißler [30] reported that molten tin and lead can both produce separable carbon from the pyrolysis of methane, but that their pyrolyzing activities were low. Geißler et al. achieved 20~30% hydrogen yields using a bubble column (height = 1 m) filled with molten tin at 1000 °C. Upham et al. [31] and Rahimi et al. [32] investigated the higher catalytic activities of molten bismuth-based alloys and found that nickel–bismuth [31] and copper–bismuth [32] alloys markedly increased methane conversion as compared with molten bismuth. However, carbon produced by molten metal systems inevitably contains metal impurities that cannot be easily removed [33].
Molten salts, such as alkali and transition metal halides, which are stable under reducing conditions, have also been used as melts for methane pyrolysis [34,35]. If the carbon produced by a molten salt system contains salt residue, it must be subsequently removed. Rahimi et al. used an immiscible molten salt–metal mixed system for methane pyrolysis to increase the purity of the carbon produced [33]. Kang et al. showed that transition metal halides, e.g., manganese chloride [34] and iron chloride, are highly active for decomposing methane into hydrogen and separable carbon [35]. Based on the result of H–D exchange between methane and deuterium in the molten transition metal halides, it was found that methane is dehydrogenated into CH2 or CH by the catalytic ionic complexes [34,35]. Then, CH2 or CH hydrocarbon intermediates may be oligomerized into solid carbon. However, the toxicities and costs of some transition metal halides limit their commercial applications. Molten alkali halides can accelerate CH3 radical generation from methane compared to gas phase pyrolysis without melts, but do not dehydrogenate methane as much as molten transition metal halides [34,35,36].
For cost purposes, the selling price of carbon largely determines the economic feasibility of bubble column methane pyrolysis processes. Perez et al. investigated methane pyrolysis in molten gallium experimentally and using computational methods [37]. Techno-economic analysis showed that the molten gallium system competed with SMR at a carbon selling price of EUR 200~400 tonne−1 and a CO2 tax of EUR 50 tonne−1. Yaun et al. also evaluated the economics and concluded that methane pyrolysis provides an alternative to SMR at a carbon selling price of USD > 440 tonne−1 and a CO2 tax of USD > 35 tonne−1 [38]. Parkinson et al. simulated the pyrolysis process in a molten metal system and concluded that the selling price of carbon and the CO2 tax should be USD > 78 tonne−1 and USD > 220 tonne−1, respectively [6], to achieve economic feasibility. Keipi et al. reported that a minimum carbon price of EUR 280–310 tonne−1 is required to compete with SMR [39]. Cheon et al. recently estimated that the cost of hydrogen production by methane pyrolysis ranges from 2.14 to 3.82 USD kgH2−1, depending on the scale and detailed design of the process [40].
Although many have studied the technical aspects of methane pyrolysis using melts or economically evaluated process feasibilities, few studies have addressed both topics. Therefore, in this study, we examined methane pyrolysis in molten potassium chloride (KCl), which is one of the cheapest and most abundant salts, technically and economically. The kinetics of methane pyrolysis in molten KCl were investigated in detail, and cost-effective ways of removing salt residues from the carbon produced were examined. Based on our experimental results, we simulated the pyrolysis process and evaluated the economic viability of the process by considering the amount of salt lost as inseparable residue in the carbon produced.
Specifically, we addressed the following questions: (1) What are the kinetic parameters of methane pyrolysis in molten KCl? (2) How much salt residue is present in the carbon produced? (3) What is the best method of removing salt residues from this carbon? (4) To what extent does salt loss affect the economic feasibility of methane pyrolysis using a bubble column filled with molten KCl?
2. Methods
2.1. Preparation of Molten KCl for Methane Pyrolysis
KCl melts were prepared from powder (Sigma-Aldrich 99.05, St. Louis, MO, USA). Briefly, KCl powder was poured into a quartz tube (i.d. = 1.5 cm), which was then placed in an electric furnace. The salt was dehydrated under Ar flow (20 mL/min (STP)) at 100 °C overnight and then heated to its melting point (~770 °C) at 5 °C/min. After melting, the height of salt in the tube was measured, and if required, more dehydrated KCl powder was added to adjust the height of molten salt in the tube to the prescribed level (7.5 cm). The colorless, transparent KCl melt was then bubbled with Ar (20 mL/min (STP)) for at least 12 h to ensure it was fully dehydrated.
2.2. Methane Pyrolysis Kinetics in the Differential Molten Salt Reactor
The schematic of the differential reactor filled with molten salt is similar to that of the previous study [34,35]. The column was a quartz tube (i.d. = 1.5 cm) with a melting point of ~1650 °C. To measure kinetic parameters, the residence time of bubbles inside the molten salt column was adjusted to <0.3 s, so that we could assume isothermal and isobaric conditions and no bubble collapse during the process. An open quartz capillary tube (i.d. = 0.2 cm) was inserted to 1 cm from the bottom of the reactor, which resulted in a 6.5 cm height of melt for bubble movement. Methane was injected into the melt through the capillary tube. Bubbles generated at the tip of the capillary tube rose through the melt at ~25 cm/s. Thus, the reactor was operated at a short bubble residence time and low methane conversion. Reaction rates were measured at different melt temperatures and methane partial pressures. Kinetic parameters including apparent activation energy and reaction order were determined from reaction rates. Gas mixtures leaving the column were analyzed using an HP 7890 Series gas chromatograph equipped with a thermal conductivity detector.
Bubble sizes were estimated using the frequencies of pressure fluctuations, which were determined using a pressure transducer connected to the inlet tube. Using the known volumetric flow rate of the inlet gas and the frequency of bubble generation, the volumes of single bubbles were calculated at different temperatures and inlet flow rates.
2.3. Characterization of the Carbon Produced
After conducting methane pyrolysis, the solid carbon-rich material produced on top of the melt was collected, placed in warm deionized water (50 °C), agitated for 1 h, and filtered. The resultant cake was then re-washed in warm DI water and filtered 10 times, and dried at 110 °C overnight. In addition to water-washing, the cake was treated in four different ways to remove more of the residual salt in the carbon, as follows: (1) It was treated with 0.5 M HCl for 1 h and filtered five times, then dried at 110 °C overnight. (2) It was sonicated in water for 5 h, and filtered 10 times and dried at 110 °C overnight. (3) It was heat-treated at 1000 °C under vacuum (<0.1 bar) for 12 h to remove residual salt. (4) It was heat-treated at 1200 °C (near the boiling point of KCl) under flowing Ar for 5 h.
RAMAN spectra of the carbon cake produced were obtained using an ARAMIS instrument (Horiba Jobin Yvon at an excitation wavelength of 633 nm, Edison, NJ, USA). Residual salt concentrations were measured using pelletized cake material by X-ray fluorescence (XRF) using a Rigaku ZSX Primus instrument (Rigaku Corporation, Tokyo, Japan).
2.4. Process Simulation
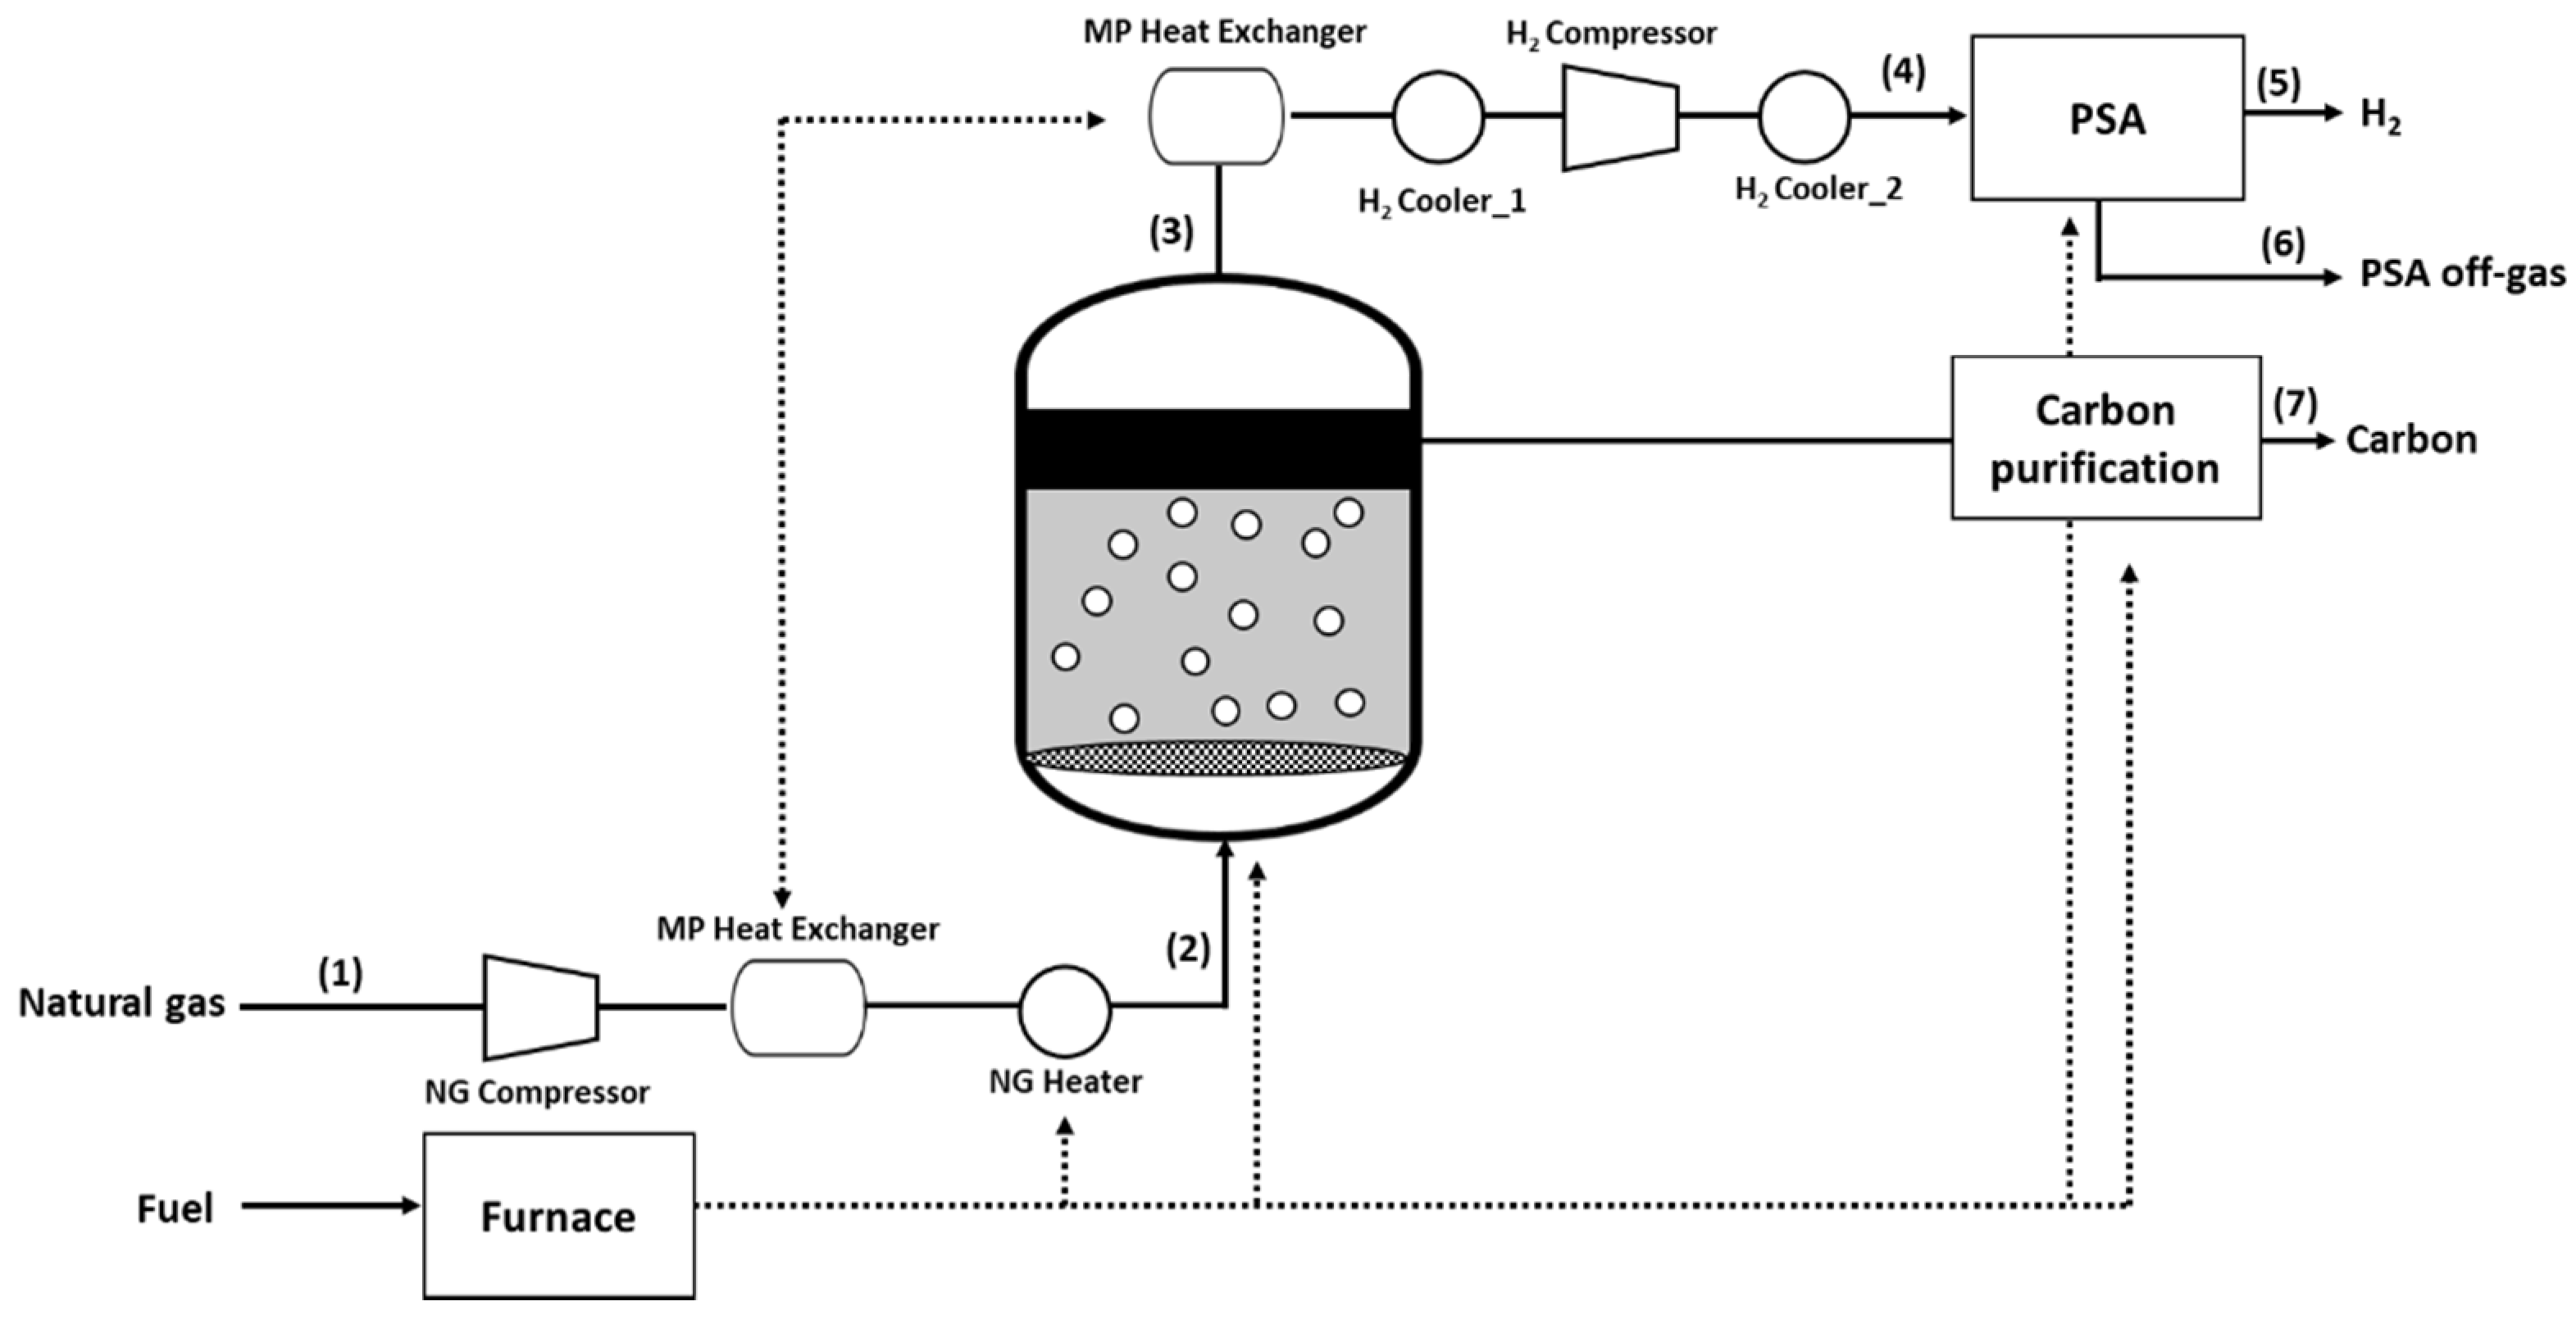
Methane pyrolysis was simulated using Aspen Plus software (Aspen Technology, Inc., Bedford, MA, USA). A block flow diagram of the simulated process using a bubble column filled with melt is shown in Figure 1. The kinetics were investigated using the differential bubble columns to simulate a large-scale reactor. Because no commercial bubble column filled with high-temperature melt was available, the size of the bubble column was calculated based on the single bubble model proposed by Kang et al. [34]. We assumed individual bubbles acted as batch reactors at a constant temperature, and methane was pyrolyzed at the bubble/melt interface.
For the simulations, methane was preheated and compressed before entering the bubble column at 1000 °C and 5 bar. The gaseous products, that is, hydrogen and unreacted methane, were then cooled and compressed to 10 bar and passed through a pressure swing adsorption (PSA) unit to separate hydrogen from methane, by-products, and impurities in the natural gas (NG) feedstock (these were later used as a process energy source). The solid cake recovered from the melt was post-treated to purify the carbon, and the salt recovered from the post-treatment procedure was recycled into the reactor. Inseparable salt residues in the cake were not recovered.
To evaluate the economic feasibility of the process, capital and operating costs were calculated using the following assumptions (Table 1). The capital costs of the bubble column reactor, heat exchangers, fired heaters, and compressors were calculated using the equations proposed by D. Seider et al. [41]. The cost of the bubble column was calculated based on the total weight of the material used in its construction. Then, several design factors, including engineering, constructing, and piping factors, were considered. Operating costs were estimated by considering the utilities used for the process. The Chemical Engineering Plant Cost Index (CEPCI) was applied to update the process costs calculated using the assumptions in Table 1. For sensitivity analysis, key economic parameters such as catalyst loss, catalyst price, and carbon revenue were varied, and their effects on hydrogen production costs were calculated.
3. Results and Discussion
3.1. Effectiveness of the Catalytic Activity of Molten KCl
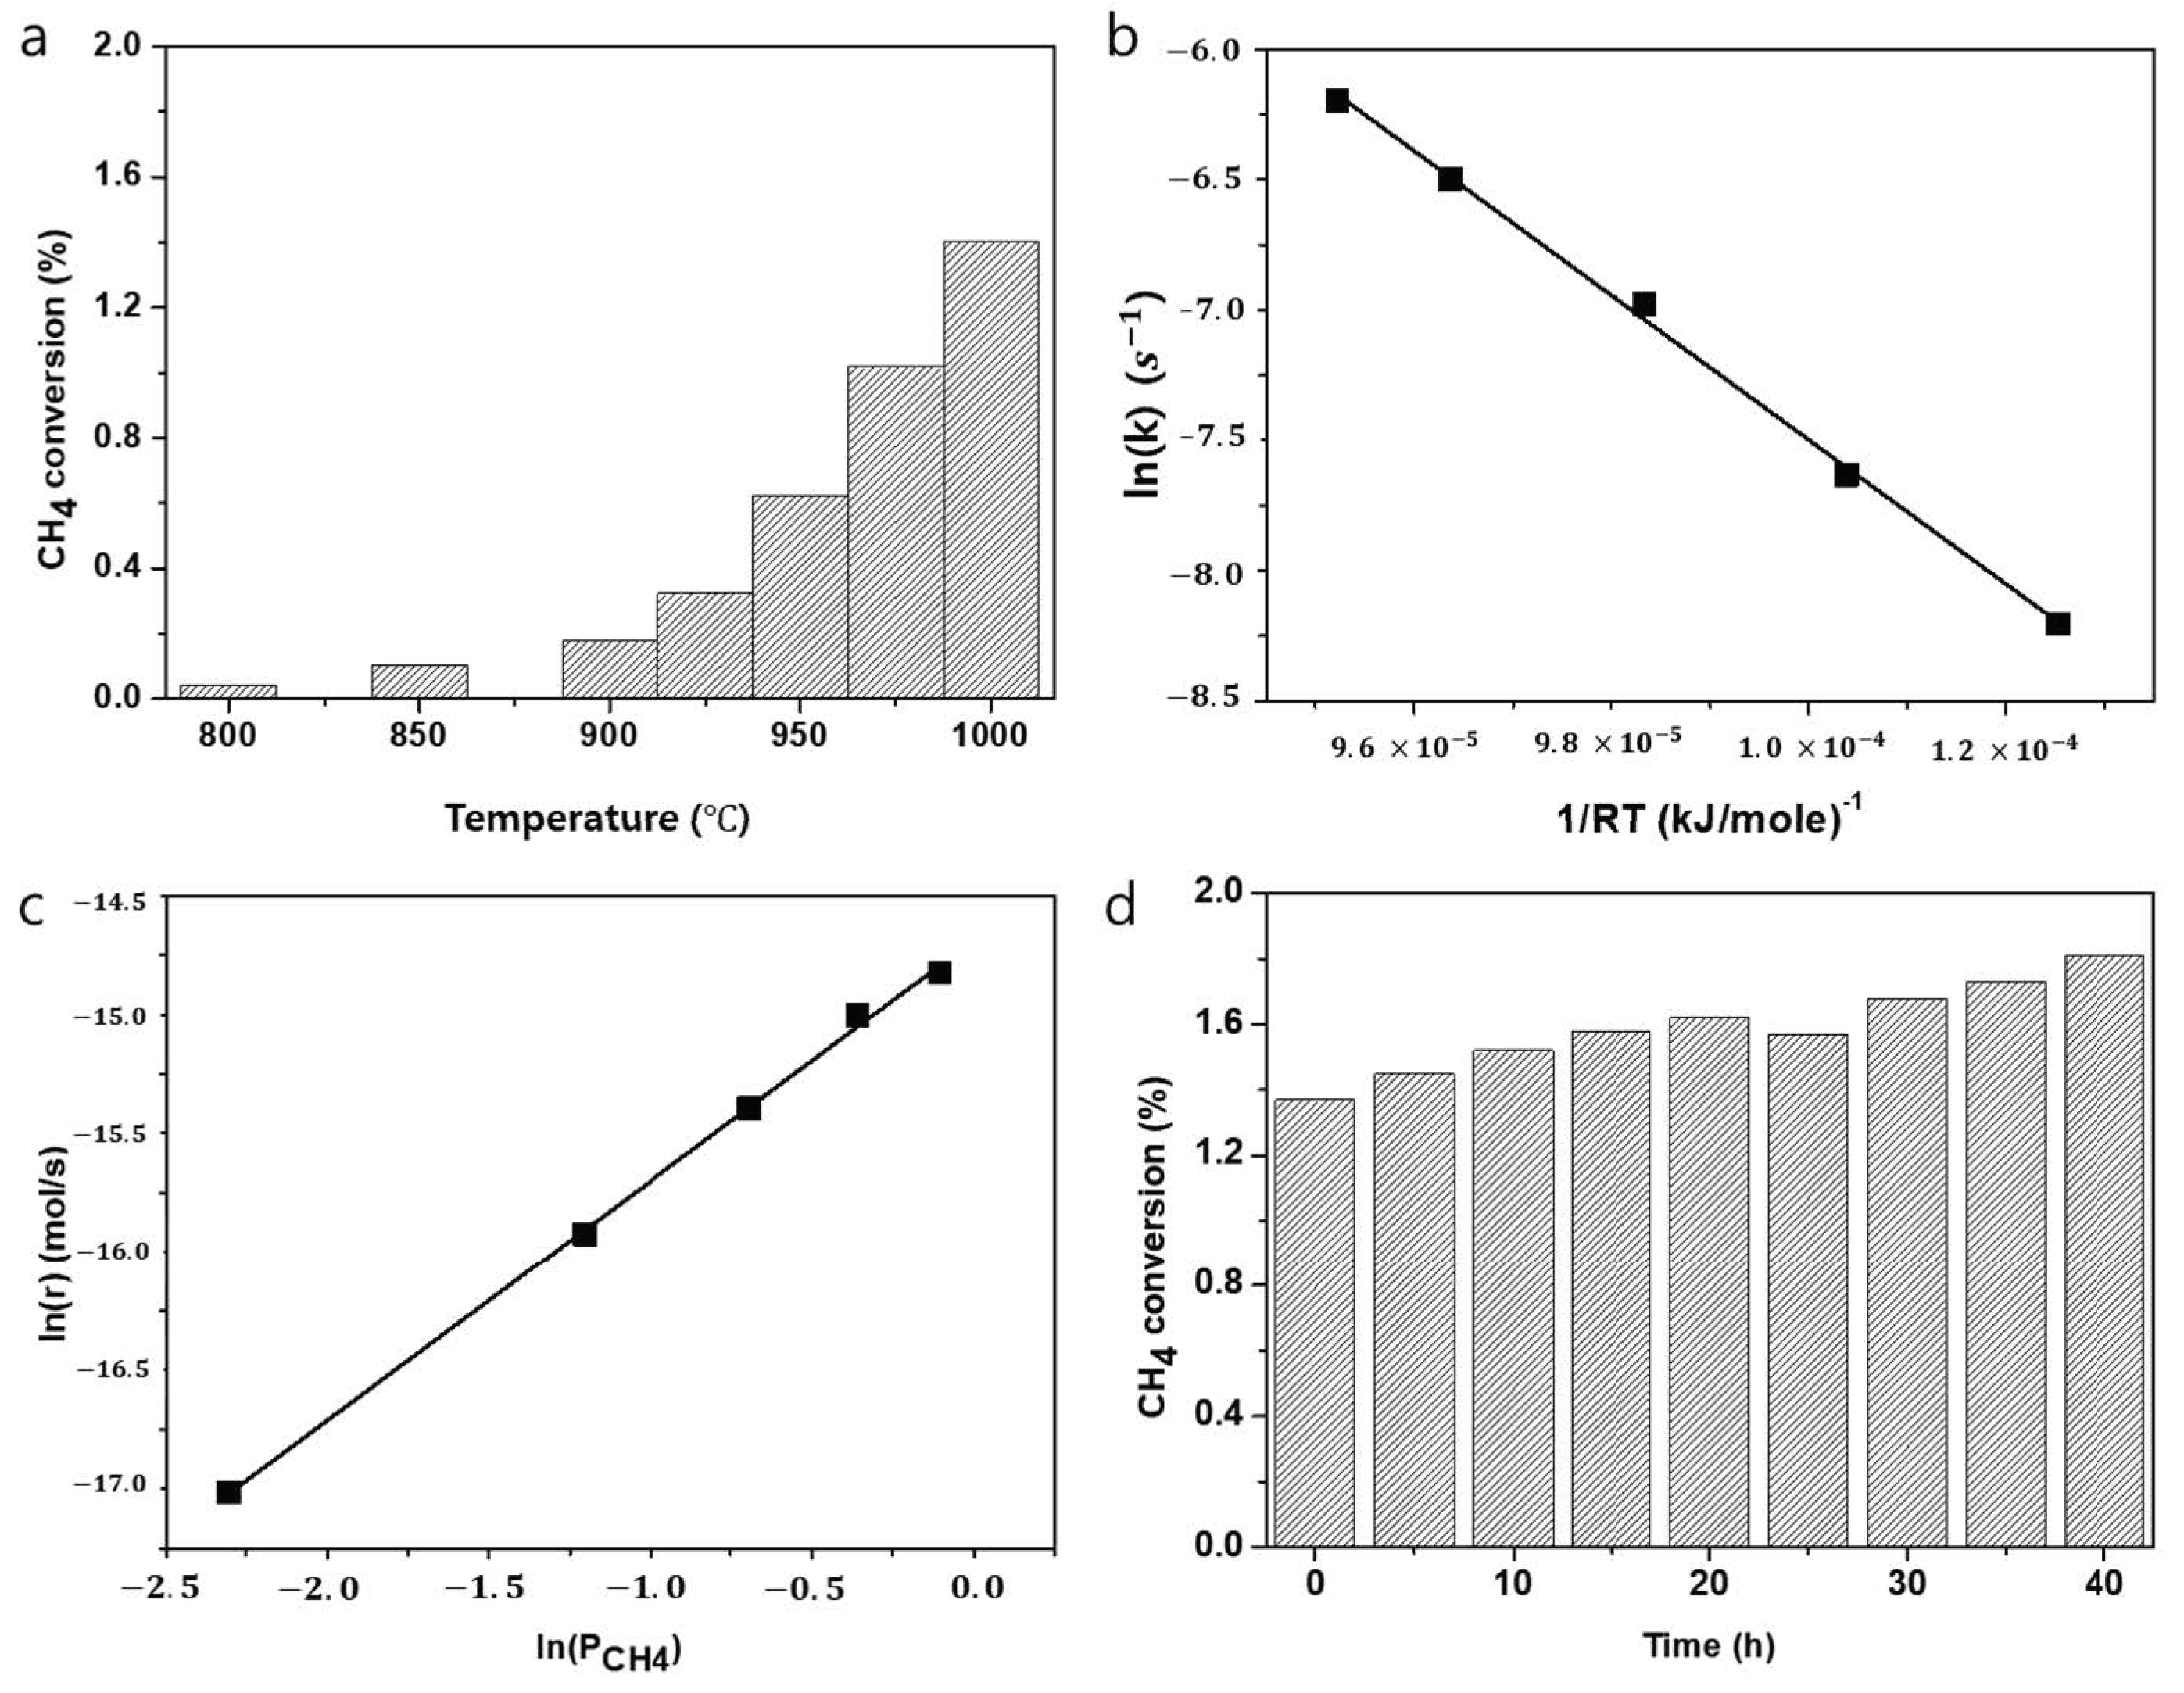
Methane conversion was measured using the bubble column reactor at different temperatures (700~1000 °C) by injecting the reactant gas mixture (20 mL/min (STP), Ar:CH4 = 50:50 vol%) into molten KCl. The temperature of the melt was measured by dipping a quartz-coated thermocouple into the melt. The void space above the melt was cooled to minimize gas–phase reactions and the amount of methane pyrolyzed in the void space was subtracted from the total amount of methane converted in the differential reactor. A methane conversion versus temperature plot is shown in Figure 2a, which shows that conversion increased with temperature. Given the relatively short residence time (~0.3 s) and low methane conversion achieved using the lab setup, we assumed isothermal and isobaric conditions. An Arrhenius plot fitted using methane conversions as a function of temperature is shown in Figure 2b. From this plot, an activation energy of 277 15 kJ/mole was calculated with an R2 value of 0.99, and the pre-exponential factor was estimated to be 6 108 to 3 109, which is similar to that for a molten potassium/sodium chloride mixture determined in a previous study [35,36]. The reaction rate of methane pyrolysis was measured at different methane partial pressures (0.1 to 0.9 bar) (Figure 2c). The apparent reaction order of methane pyrolysis was estimated to be 1.0 with an R2 value of 0.99 in the molten KCl.
The catalytic stability of the molten KCl was measured over a continuous run of 40 h at 1000 °C. Because of the high vapor pressure of the molten KCl at this temperature, there is a possibility that KCl vapor might continuously escape during the 40 h run, which would reduce melt height and bubble residence time. However, the cooling of the bubble column headspace effectively addressed this possibility by causing KCl vapor to condense and subsequently to be re-melted in the bubble column. Over the 40 h run, no catalytic deactivation was observed (Figure 2d). The slight increase in methane conversion observed was possibly due to the accumulation of solid carbon in the system. Although most of the carbon produced during pyrolysis was collected on the top of the melt, some carbon remained fluidized in the melt. We suspect this carbon increases melt viscosity, and thus, increases bubble residence times. Thus, it appears that if the carbon produced could be continuously recovered, methane conversion would remain stable.
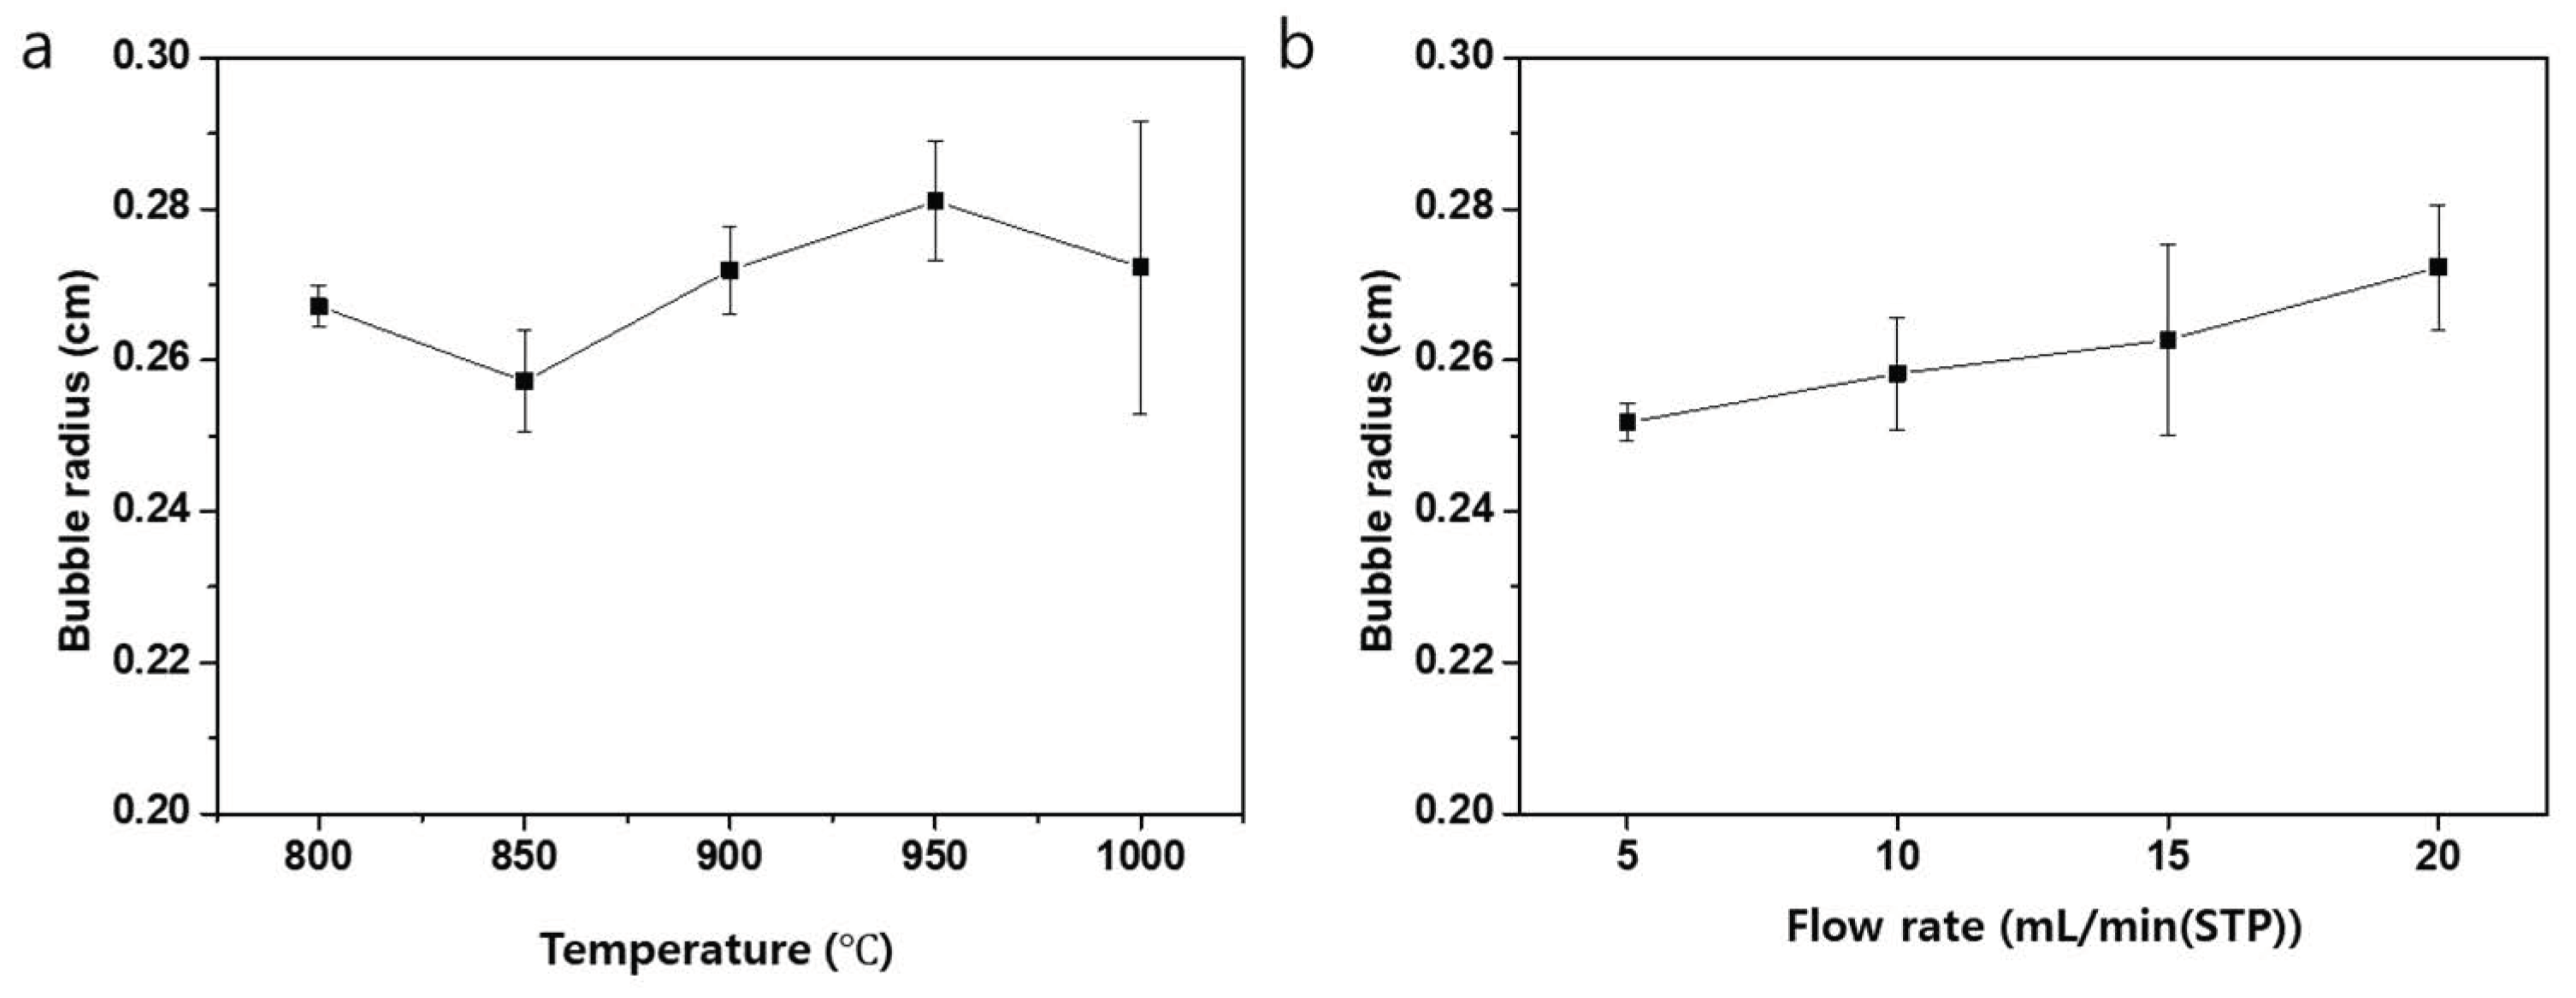
Bubble size was measured as a function of temperature and flow rate (Figure 3) using a pressure transducer in the inlet tube. When the gas was introduced into the melt and a bubble was generated on the tip of the quartz inlet tube, a pressure change was observed. By measuring the periodicity of this pressure change, we calculated bubble volumes based on the time required to generate a single bubble and the known flow rate. At least 1000 bubbles were observed to calculate average bubble radii.
A bubble radius versus temperature plot is shown in Figure 3a. Although melt physical properties such as density, surface tension, and viscosity varied with temperature, bubble sizes changed little, presumably because the diameter of the inlet tube, which importantly determines bubble size, was fixed. Using a 20 mL/min (STP) inlet flowrate, bubbles of average radius 0.27 cm were generated at 800 to 1000 °C. A bubble radius versus flowrate plot is shown in Figure 3b. Although bubble sizes slightly increased with flowrate, the bubble radii remained at ~0.27 cm. This near independence of bubble size and flow rate suggests that the reaction kinetics observed at the lab scale could be applied to large-scale operations.
3.2. Purification of the Carbon Cake
The economic feasibility of molten salt-based methane pyrolysis processes depends on the market value of the solid carbon produced, and KCl contamination limits its commercial appeal. Furthermore, if the carbon contains a large amount of unrecoverable KCl, salt is continuously lost and must be added to maintain the process, which increases processing costs.
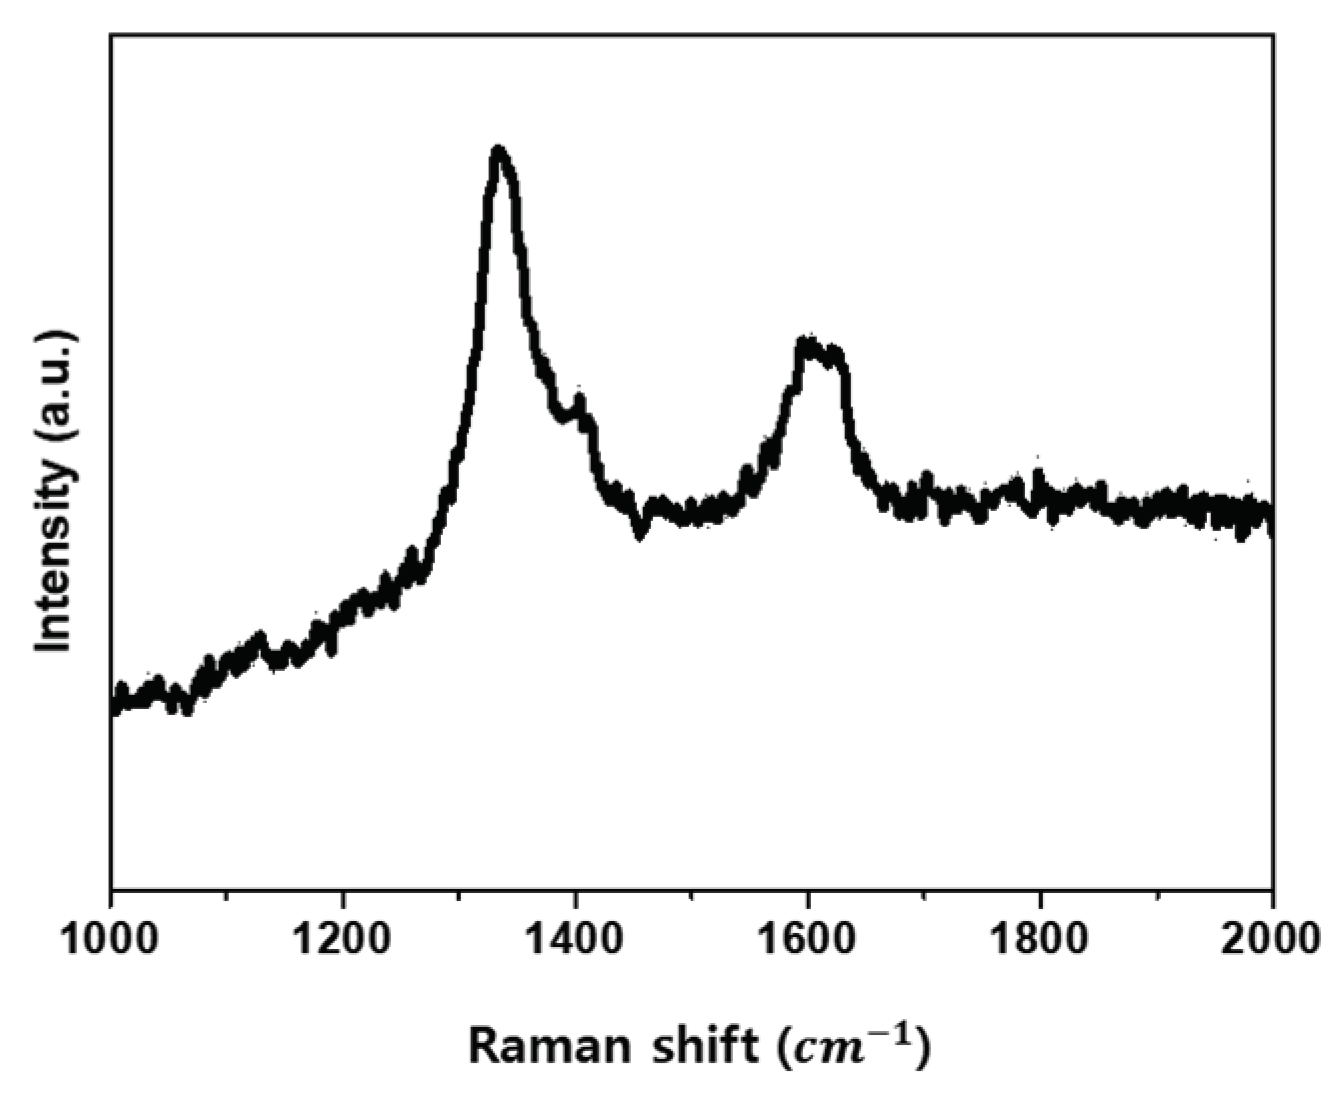
After a continuous run of the experimental unit for 40 h, carbon cake collected from the top of the reactor was washed with deionized water to recover the carbon. To investigate the potential applications of this carbon and estimate its market value, we subjected it to Raman spectroscopy (Figure 4). The Raman spectra obtained showed D and G bands at 1335 and 1585 cm−1, which correspond to defects in sp2 network structures. Furthermore, the D to G band ratio (ID/IG) is inversely proportional to the degree of graphitization of carbon. In our case, the ID/IG ratio of the water-washed carbon cake was around 1.5, indicating an amorphous structure.
To remove salt residues from the cake, it was treated by HCl washing, sonication in water, or heating to 1000~1200 °C. The atomic concentrations in cake purified using these methods were determined by XRF (Table 2). Charge imbalances are possibly due to the potassium hydroxide formation during the washing step and additives used to pelletize the carbon sample for the XRF measurement. The atomic percentages of HCl-washed and sonicated cake had carbon concentrations of 96.2 and 95.7 at%, respectively, which was greater than that in water-washed cake (93.4 at%), and demonstrated that despite the solubility of KCl in water, high levels of KCl remained in the salt even after HCl treatment and sonication.
Salt impurities can also be removed from carbon by heating. Because KCl has a high vapor pressure at 1000 °C, we tried to remove the remaining salt residues by heating the cake under a vacuum. The cake was heated at 1000 °C under vacuum and the vaporized salt was recovered in a cold trap. This technique increased the carbon content to 95.2 at%, which is too great a KCl loss for the process to bear. To further increase carbon purity, the cake was heated at 1200 °C, which is near the boiling point of KCl (1420 °C), under flowing Ar. To prevent carbon from burning at this temperature, high-purity Ar (99.999%) was further purified using an oxygen trap before the furnace. As a result, the carbon purity increased to 97.2 at%. This temperature treatment also reduced the amount of wastewater generated during water-related purification procedures, and the salt recovered could be re-used in the reactor. Therefore, we conclude that high-temperature treatment is the most economical way of purifying the carbon cake produced during the pyrolysis of methane using molten KCl.
3.3. Process Simulation and Economic Feasibility
Methane pyrolysis was simulated using the Aspen Plus software package. Stream data are shown in Table 3. Due to the material used to construct the reactor, the reaction temperature was limited to 1000 °C. A single bubble was assumed to act as a reactor with a catalytic surface wall of molten KCl. Detailed modeling of the bubble column was explained in a previous study [34]. After methane pyrolysis, the gas and solid products were separately passed through PSA and carbon purification units. The conditions of the inlet and outlet streams of PSA were determined based on the result of the previous study [47]. We assumed that the efficiency of the PSA unit was 90%. The amount of salt loss during the salt purification stage was estimated using experimental data (Table 2).
The process economics were evaluated based on the results of the simulation. Capital costs (USD) were calculated using the assumptions shown in Table 1 and annualized (USD y−1) by applying a capital cost recovery factor (CRF). Capital costs per unit of hydrogen production (USD kgH2−1) were calculated by dividing annualized capital costs by annual hydrogen production (kgH2 y−1) [40].
here, i and N are the discount rate and lifetime of the process, respectively.
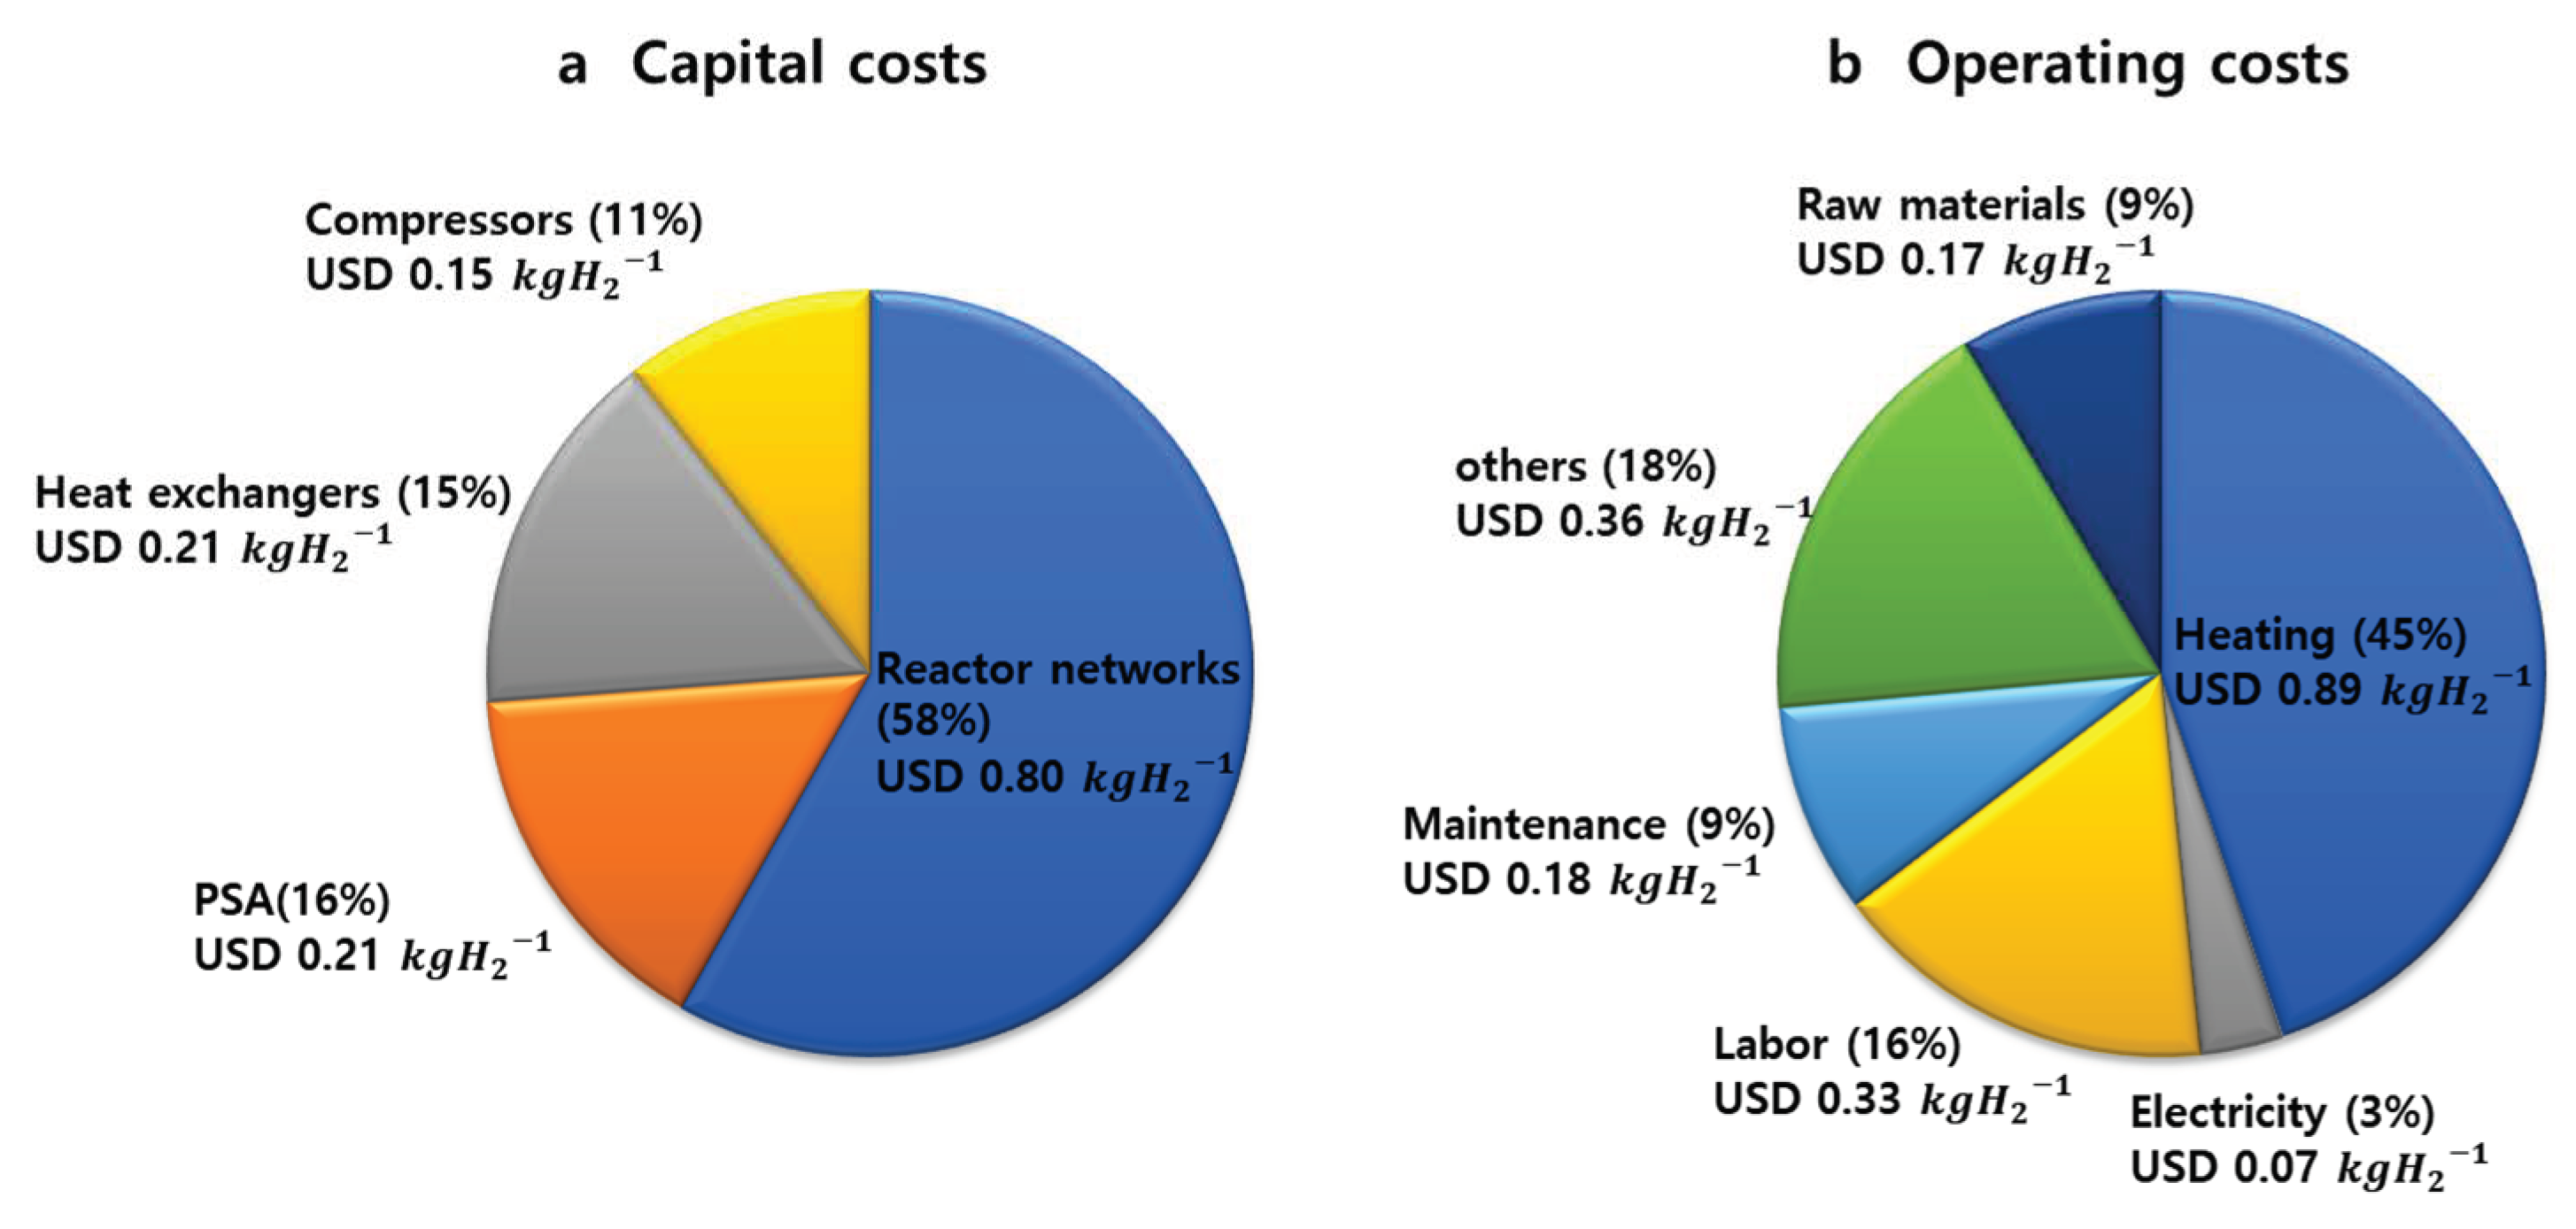
Capital cost estimations are shown in Figure 5a and Table 4, and these compared well with previous studies [37,40]. Due to the elevated operating temperature (1000 °C) used and the corrosiveness of the melt, the cost of the bubble column reactor networks was the highest, at USD ~0.80 kgH2−1, followed by the PSA unit, heat exchangers, and compressors at USD 0.21, 0.21, and 0.15 kgH2−1, respectively. The capital cost of the carbon separation unit depended on the techniques used (Table 2).
The operating costs per unit of hydrogen production (USD kgH2−1) were obtained by multiplying the amounts of utilities consumed to run the process by their unit costs (Figure 5b and Table 4). The highest heating cost, USD 0.89 kgH2−1, was attributed to the endothermicity of the pyrolysis reaction and the high operating temperature. Here, maintenance did not include the cost of salt loss, which was attributed to the salt residues contained in the final carbon product.
To investigate how KCl loss affects the economic feasibility of the overall process, the amount of molten catalyst lost (kgCat kgC−1), the price of the molten catalyst (USD kgCat−1), and the carbon revenue (USD kgC−1) were varied. Considering the salt compositions of carbon (Table 2), the amount of KCl loss was estimated to range from 0.1 to 0.3 kgCat kgC−1 based on the assumption that 90% of the salt in cake would be recovered during carbon post-treatment procedures.
The economic feasibility of methane pyrolysis is highly dependent on the selling price of the carbon. However, the carbon produced by methane pyrolysis inevitably contains impurities, such as residual metal and salt, and thus, the cost for removing impurities from carbon must be considered. In this study, carbon revenue was calculated by subtracting the carbon purification cost from its assumed selling price (USD 0.5 kgC−1) [40]. The cost for separating impurities from the carbon depends on the purification method used. For example, water washing incurs the cost of treating wastewater, and the high-temperature method incurs fuel costs. For the carbon purification methods mentioned in Table 2, the cost of removing impurities from carbon varied from USD 0.05 to 0.25 kgC−1, which resulted in carbon revenues from USD 0.25 to 0.45 kgC−1.
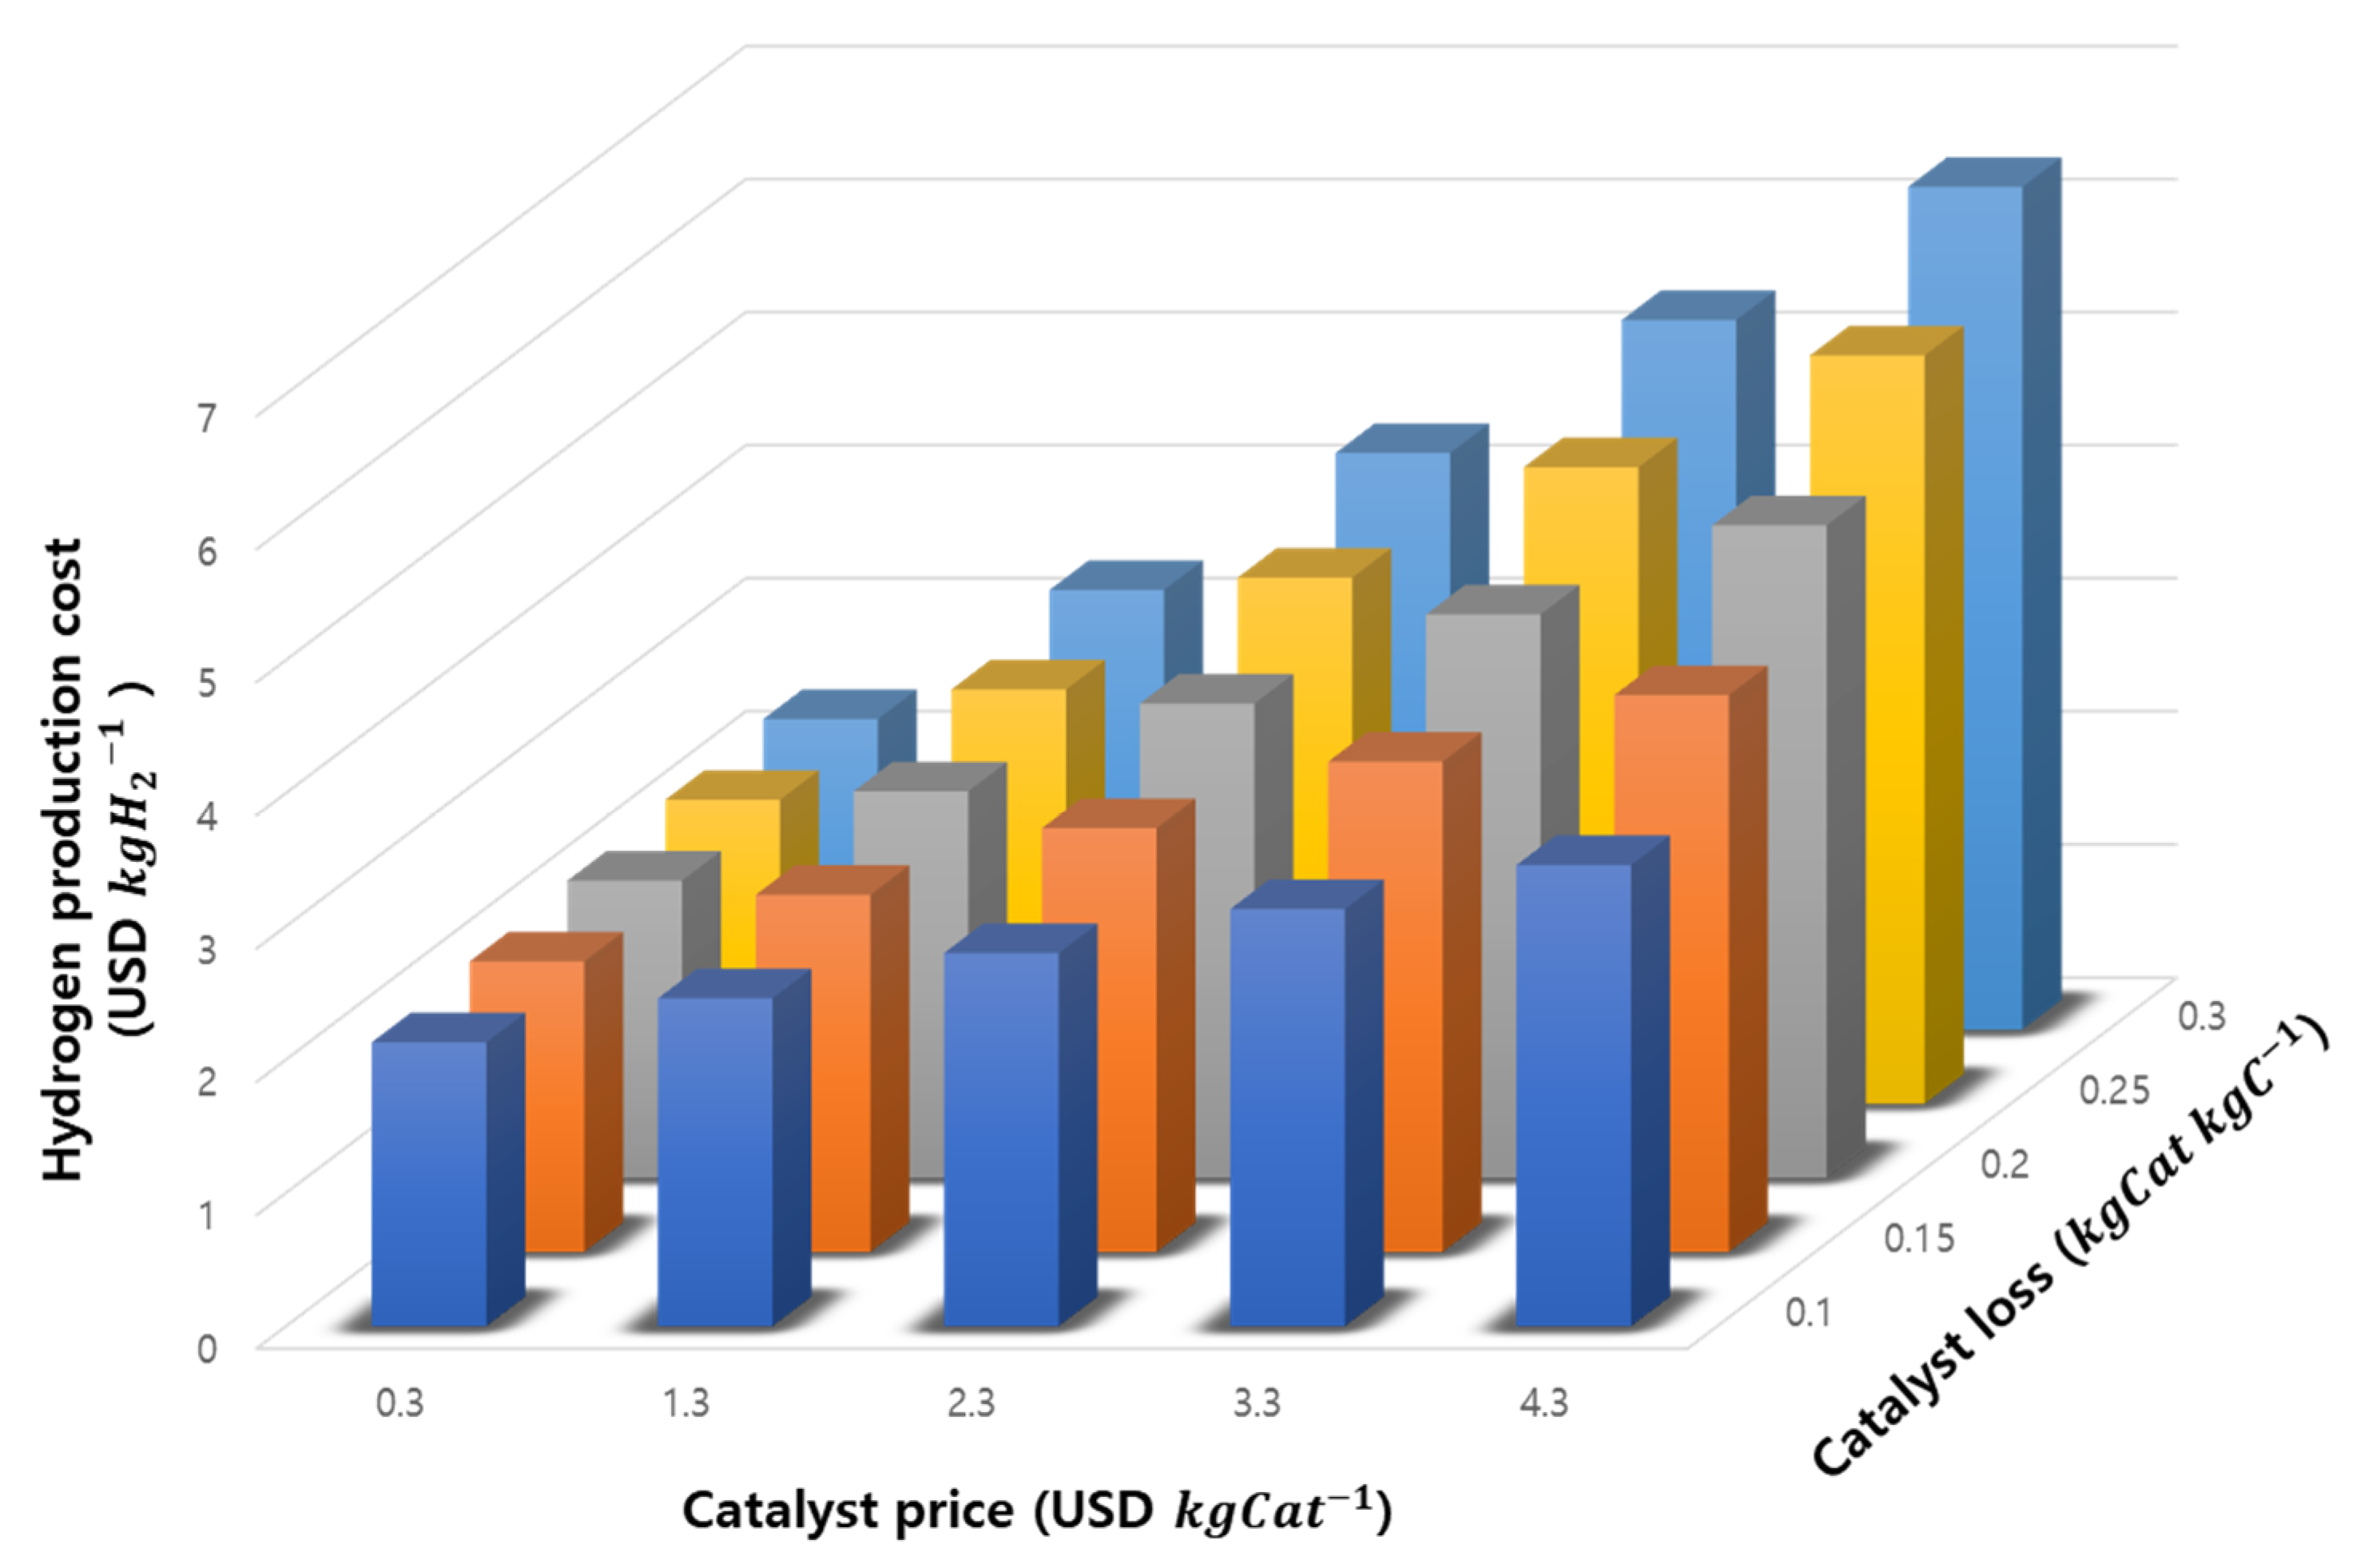
Figure 6 shows the cost of producing hydrogen for different KCl losses and carbon revenues. As the amount of KCl loss decreased and carbon revenue increased, the hydrogen production costs decreased. Because low-cost KCl was utilized as a melt in this study, hydrogen production cost increased by about USD 0.2 kgH2−1 as the amount of KCl loss increased from 0.1 to 0.3 kgCat kgC−1. Had a high-cost melt such as Ni-Bi alloy been used, the hydrogen production cost would have increased markedly. When we assumed that the price of the molten catalyst increased from USD 0.3 to 4.3 kgCat−1, the hydrogen production cost increased by about USD 4.0 kgH2−1 at a melt loss of 0.3 kgCat kgC−1, and carbon revenue was USD 0.45 kgC−1 (Figure 7). From this analysis, we concluded the hydrogen production cost changed by up to 10% given the KCl losses mentioned in Figure 6.
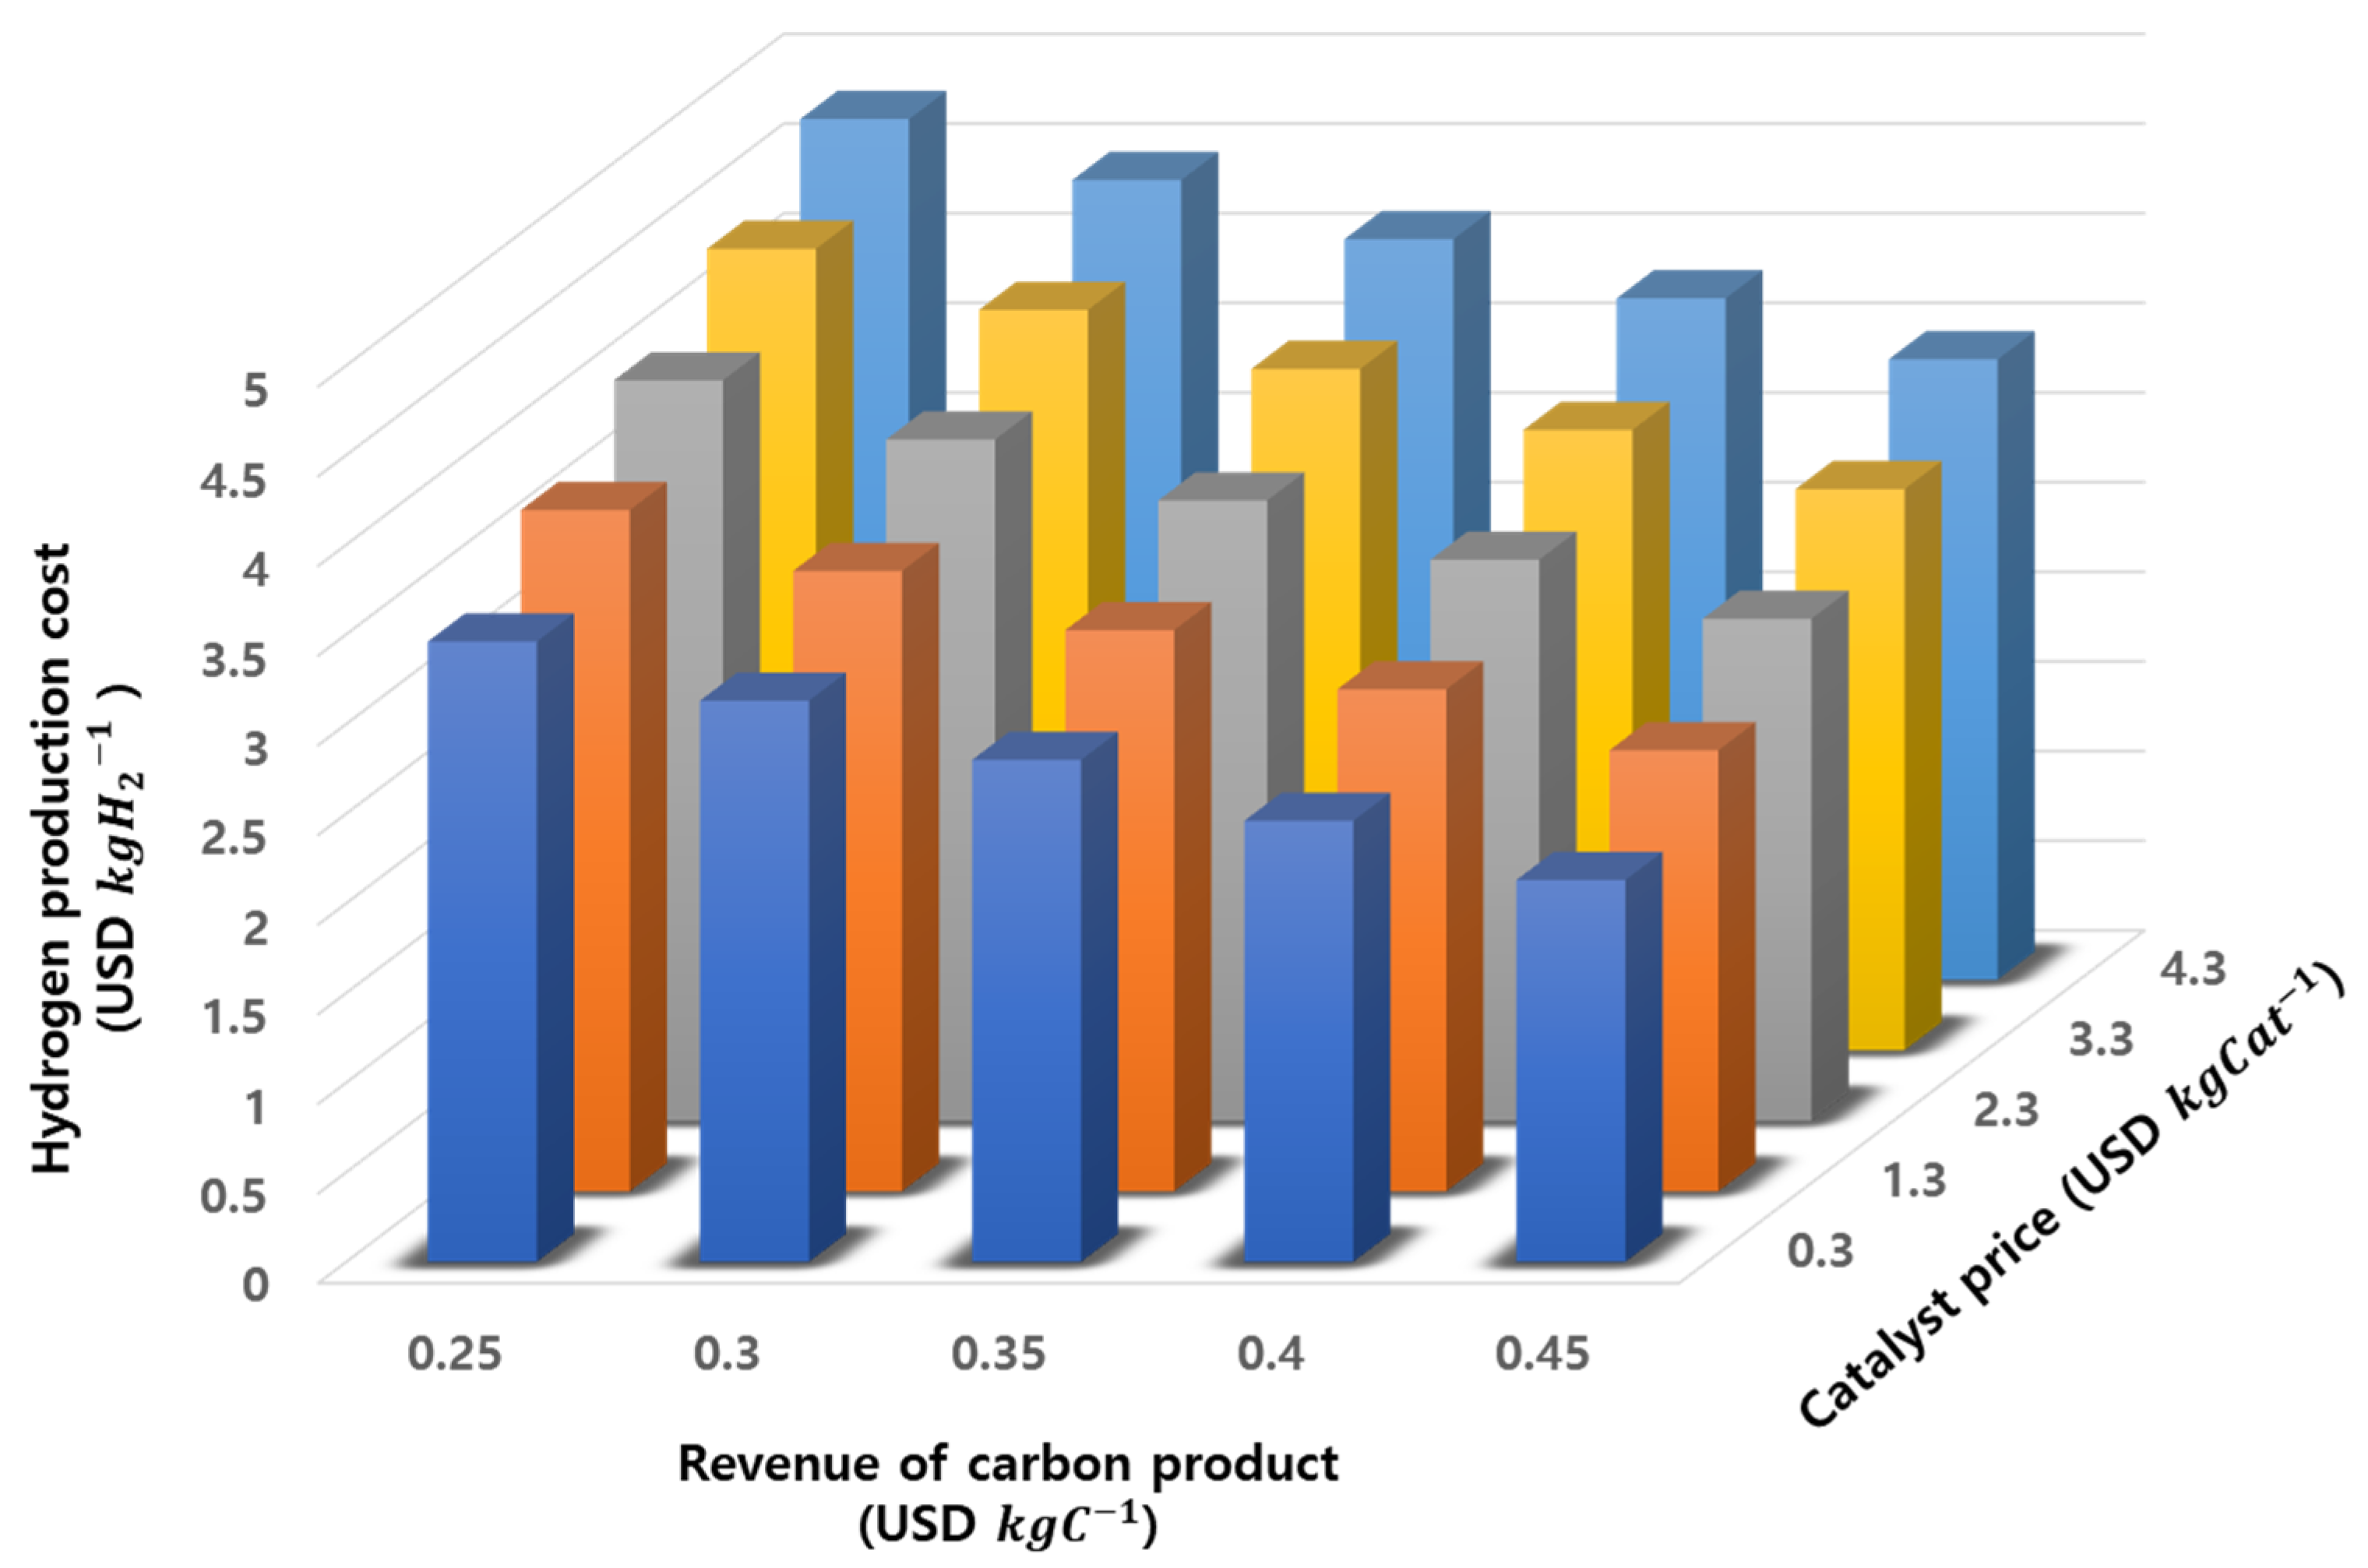
Carbon revenue had a major effect on the economic feasibility of the molten KCl-based methane pyrolysis (Figure 6 and Figure 8). As revenue decreased from USD 0.45 to 0.25 kgC−1, hydrogen production cost increased by about USD 1.3 kgH2−1 (Figure 6 and Figure 8), which adequately demonstrated the impact of carbon revenue on the economic viability of the process, and is consistent with the results of previous research [14,38,39].
Assuming the best scenario, whereby KCl loss was minimized and carbon revenue maximized, the hydrogen production cost was calculated to be USD 2.13 kgH2−1, which was still higher than that of SMR (USD ~1.5 kgH2−1 [40]). However, this compared the economic feasibility of methane pyrolysis to SMR without a carbon capture storage (CCS) facility, and if this was included, the hydrogen production cost of SMR would be about USD 2.0 kgH2−1 [40], which is comparable to the hydrogen production cost calculated for the best scenario of the molten KCl-based methane pyrolysis process.
Natural gas quality can affect the purity of hydrogen produced by the bubble column reactor and the resulting hydrogen separation costs. Other hydrocarbons contained together with methane in natural gas can be easily decomposed under conditions where methane pyrolysis occurs, since methane has one of the most difficult C–H bonds to dissociate. Molten salts might have relatively strong resistance to sulfur impurities compared to molten or solid metal catalysts, but a desulfurization step was still required prior to the bubble column reactor to minimize sulfur poisoning. The capital cost of a desulfurization unit was calculated using a simple power relationship reported in the previous study [47]. The increase in maintenance cost caused by the yearly replacement of the desulfurization bed was also considered. In addition, the increase in N2 and CO2 compositions in natural gas can cause an increase in the PSA-related costs. To consider the flexible usage of various natural gas feeds for the methane pyrolysis process, we increased the costs related with desulfurization and PSA units by 30%. As a result, hydrogen production cost increased by about USD 0.12 kgH2−1, which might vary significantly depending on the origin of the natural gas.
4. Conclusions
In this study, a molten KCl-based methane pyrolysis process was investigated experimentally and economically as a potential alternative to commercial steam/methane reforming. Methane conversion was studied in the melt-filled bubble column and measured at different temperatures and methane partial pressures, and kinetic parameters such as apparent activation energy (277 15 kJ/mole) and reaction order (1.0) were calculated. Over continuous 40 h runs, no catalytic deactivation was observed, and hydrogen and separable carbon were co-produced. Salt impurities in carbon cake were removed by water washing, HCl washing, sonication in water, heating under vacuum, and heating under Ar. Heating at 1200 °C under Ar produced carbon of the highest purity (97.2 at.%). Using experimental data, the molten KCl-based methane pyrolysis process was simulated using Aspen Plus according to the block diagram of the process. To evaluate the economic feasibility of the process, capital and operating costs were calculated. Reactor networks (58%) and heating (45%) costs contributed most to capital and operating costs, respectively. For sensitivity analysis, key parameters such as molten catalyst loss (kgCat kgC−1), price of the melt (USD kgCat−1), and carbon revenue (USD kgC−1) were varied, and hydrogen production costs were calculated (USD kgH2−1). For the best scenario, in which KCl loss was minimized and carbon revenue was maximized, the hydrogen production cost was estimated to be USD 2.13 kgH2−1, which was higher than that of SMR, but comparable to SMR with CCS.
Author Contributions
Conceptualization, J.B. and D.K.; data curation, J.B. and E.H.K.; investigation, E.H.K., N.-K.P. and C.R.; methodology, J.B., N.-K.P. and D.K.; supervision, Y.-H.K., J.P. and D.K.; validation, Y.-H.K., J.P. and D.K.; writing—original draft, J.B., J.P. and D.K.; writing—review and editing; C.R., J.P. and D.K. All authors have read and agreed to the published version of the manuscript.
Funding
This research was supported by Commercial Feasibility Assessment of Methane Pyrolysis for CO2 Relived Hydrogen Production funded by the Korea Gas Corporation (RD2020-0261).
Conflicts of Interest
The authors declare no conflict of interest.
References
- Peters, G.P.; Andrew, R.M.; Canadell, J.G.; Friedlingstein, P.; Jackson, R.B.; Korsbakken, J.I.; Le Quéré, C.; Peregon, A. Carbon dioxide emissions continue to grow amidst slowly emerging climate policies. Nat. Clim. Chang. 2020, 10, 3–6. [Google Scholar] [CrossRef]
- Gielen, D.; Boshell, F.; Saygin, D.; Bazilian, M.D.; Wagner, N.; Gorini, R. The role of renewable energy in the global energy transformation. Energy Strategy Rev. 2019, 24, 38–50. [Google Scholar] [CrossRef]
- Pickl, M.J. The renewable energy strategies of oil majors–From oil to energy? Energy Strategy Rev. 2019, 26, 100370. [Google Scholar] [CrossRef]
- Dawood, F.; Anda, M.; Shafiullah, G.M. Hydrogen production for energy: An overview. Int. J. Hydrogen Energy 2020, 45, 3847–3869. [Google Scholar] [CrossRef]
- Abe, J.O.; Popoola, A.P.I.; Ajenifuja, E.; Popoola, O.M. Hydrogen energy, economy and storage: Review and recommendation. Int. J. Hydrogen Energy 2019, 44, 15072–15086. [Google Scholar] [CrossRef]
- Parkinson, B.; Matthews, J.W.; McConnaughy, T.B.; Upham, D.C.; McFarland, E.W. Techno-Economic Analysis of Methane Pyrolysis in Molten Metals: Decarbonizing Natural Gas. Chem. Eng. Technol. 2017, 40, 1022–1030. [Google Scholar] [CrossRef]
- Parkinson, B.; Balcombe, P.; Speirs, J.F.; Hawkes, A.D.; Hellgardt, K. Levelized cost of CO2 mitigation from hydrogen production routes. Energy Environ. Sci. 2019, 12, 19–40. [Google Scholar] [CrossRef]
- Grigoriev, S.A.; Fateev, V.N.; Bessarabov, D.G.; Millet, P. Current status, research trends, and challenges in water electrolysis science and technology. Int. J. Hydrogen Energy 2020, 45, 26036–26058. [Google Scholar] [CrossRef]
- Chi, J.; Yu, H. Water electrolysis based on renewable energy for hydrogen production. Chin. J. Catal. 2018, 39, 390–394. [Google Scholar] [CrossRef]
- Guéret, C.; Daroux, M.; Billaud, F. Methane pyrolysis: Thermodynamics. Chem. Eng. Sci. 1997, 52, 815–827. [Google Scholar] [CrossRef]
- Muradov, N. Catalysis of methane decomposition over elemental carbon. Catal. Commun. 2001, 2, 89–94. [Google Scholar] [CrossRef]
- Abbas, H.F.; Wan Daud, W.M.A. Hydrogen production by methane decomposition: A review. Int. J. Hydrogen Energy 2010, 35, 1160–1190. [Google Scholar] [CrossRef]
- Li, Y.; Li, D.; Wang, G. Methane decomposition to COx-free hydrogen and nano-carbon material on group 8–10 base metal catalysts: A review. Catal. Today 2011, 162, 1–48. [Google Scholar] [CrossRef]
- Parkinson, B.; Tabatabaei, M.; Upham, D.C.; Ballinger, B.; Greig, C.; Smart, S.; McFarland, E. Hydrogen production using methane: Techno-economics of decarbonizing fuels and chemicals. Int. J. Hydrogen Energy 2018, 43, 2540–2555. [Google Scholar] [CrossRef]
- Chen, C.-J.; Back, M.H.; Back, R.A. The Thermal Decomposition of Methane. I. Kinetics of the Primary Decompositionto C2H6 + H2; Rate Constant for the Homogeneous Unimolecular Dissociation of Methane and its Pressure Dependence. Can. J. Chem. 1975, 53, 3580–3590. [Google Scholar] [CrossRef] [Green Version]
- Chen, C.-J.; Back, M.H.; Back, R.A. The thermal decomposition of methane. II. Secondary reactions, autocatalysis and carbon formation; non-Arrhenius behaviour in the reaction of CH3 with ethane. Can. J. Chem. 1976, 54, 3175–3184. [Google Scholar] [CrossRef]
- Ermakova, M.A.; Ermakov, D.Y.; Kuvshinov, G.G.; Plyasova, L.M. New Nickel Catalysts for the Formation of Filamentous Carbon in the Reaction of Methane Decomposition. J. Catal. 1999, 187, 77–84. [Google Scholar] [CrossRef]
- Takenaka, S.; Serizawa, M.; Otsuka, K. Formation of filamentous carbons over supported Fe catalysts through methane decomposition. J. Catal. 2004, 222, 520–531. [Google Scholar] [CrossRef]
- Avdeeva, L.B.; Kochubey, D.I.; Shaikhutdinov, S. Cobalt catalysts of methane decomposition: Accumulation of the filamentous carbon. Appl. Catal. A Gen. 1999, 177, 43–51. [Google Scholar] [CrossRef]
- Keipi, T.; Tolvanen, K.E.S.; Tolvanen, H.; Konttinen, J. Thermo-catalytic decomposition of methane: The effect of reaction parameters on process design and the utilization possibilities of the produced carbon. Energy Convers. Manag. 2016, 126, 923–934. [Google Scholar] [CrossRef]
- Beebe, T.P.; Goodman, D.W.; Kay, B.D.; Yates, J.T. Kinetics of the activated dissociative adsorption of methane on the low index planes of nickel single crystal surfaces. J. Chem. Phys. 1987, 87, 2305–2315. [Google Scholar] [CrossRef]
- Muradov, N.; Smith, F.; T-Raissi, A. Catalytic activity of carbons for methane decomposition reaction. Catal. Today 2005, 102–103, 225–233. [Google Scholar] [CrossRef]
- Wang, H.Y.; Lua, A.C. Methane decomposition using Ni–Cu alloy nano-particle catalysts and catalyst deactivation studies. Chem. Eng. J. 2015, 262, 1077–1089. [Google Scholar] [CrossRef]
- Villacampa, J.I.; Royo, C.; Romeo, E.; Montoya, J.A.; Del Angel, P.; Monzón, A. Catalytic decomposition of methane over Ni-Al2O3 coprecipitated catalysts: Reaction and regeneration studies. Appl. Catal. A Gen. 2003, 252, 363–383. [Google Scholar] [CrossRef]
- Choudhary, V.R.; Banerjee, S.; Rajput, A.M. Continuous Production of H2 at Low Temperature from Methane Decomposition over Ni-Containing Catalyst Followed by Gasification by Steam of the Carbon on the Catalyst in Two Parallel Reactors Operated in Cyclic Manner. J. Catal. 2001, 198, 136–141. [Google Scholar] [CrossRef]
- Kang, D.; Lee, J.W. Enhanced methane decomposition over nickel–carbon–B2O3 core–shell catalysts derived from carbon dioxide. Appl. Catal. B Environ. 2016, 186, 41–55. [Google Scholar] [CrossRef]
- Steinberg, M. Fossil fuel decarbonization technology for mitigating global warming. Int. J. Hydrogen Energy 1999, 24, 771–777. [Google Scholar] [CrossRef] [Green Version]
- Serban, M.; Lewis, M.A.; Marshall, C.L.; Doctor, R.D. Hydrogen Production by Direct Contact Pyrolysis of Natural Gas. Energy Fuels 2003, 17, 705–713. [Google Scholar] [CrossRef]
- Plevan, M.; Geißler, T.; Abánades, A.; Mehravaran, K.; Rathnam, R.K.; Rubbia, C.; Salmieri, D.; Stoppel, L.; Stückrad, S.; Wetzel, T. Thermal cracking of methane in a liquid metal bubble column reactor: Experiments and kinetic analysis. Int. J. Hydrogen Energy 2015, 40, 8020–8033. [Google Scholar] [CrossRef]
- Geißler, T.; Plevan, M.; Abánades, A.; Heinzel, A.; Mehravaran, K.; Rathnam, R.K.; Rubbia, C.; Salmieri, D.; Stoppel, L.; Stückrad, S.; et al. Experimental investigation and thermo-chemical modeling of methane pyrolysis in a liquid metal bubble column reactor with a packed bed. Int. J. Hydrogen Energy 2015, 40, 14134–14146. [Google Scholar] [CrossRef]
- Chester, U.D.; Vishal, A.; Alexander, K.; Snodgrass, Z.R.; Gordon, M.J.; Horia, M.; McFarland, E.W. Catalytic molten metals for the direct conversion of methane to hydrogen and separable carbon. Science 2017, 358, 917–921. [Google Scholar] [CrossRef] [Green Version]
- Palmer, C.; Tarazkar, M.; Kristoffersen, H.H.; Gelinas, J.; Gordon, M.J.; McFarland, E.W.; Metiu, H. Methane Pyrolysis with a Molten Cu–Bi Alloy Catalyst. ACS Catal. 2019, 9, 8337–8345. [Google Scholar] [CrossRef]
- Rahimi, N.; Kang, D.; Gelinas, J.; Menon, A.; Gordon, M.J.; Metiu, H.; McFarland, E.W. Solid carbon production and recovery from high temperature methane pyrolysis in bubble columns containing molten metals and molten salts. Carbon 2019, 151, 181–191. [Google Scholar] [CrossRef]
- Kang, D.; Rahimi, N.; Gordon, M.J.; Metiu, H.; McFarland, E.W. Catalytic methane pyrolysis in molten MnCl2-KCl. Appl. Catal. B Environ. 2019, 254, 659–666. [Google Scholar] [CrossRef]
- Kang, D.; Palmer, C.; Mannini, D.; Rahimi, N.; Gordon, M.J.; Metiu, H.; McFarland, E.W. Catalytic Methane Pyrolysis in Molten Alkali Chloride Salts Containing Iron. ACS Catal. 2020, 10, 7032–7042. [Google Scholar] [CrossRef]
- Palmer, C.; Tarazkar, M.; Gordon, M.J.; Metiu, H.; McFarland, E.W. Methane pyrolysis in low-cost, alkali-halide molten salts at high temperatures. Sustain. Energy Fuels 2021, 5, 6107–6123. [Google Scholar] [CrossRef]
- Leal Pérez, B.J.; Medrano Jiménez, J.A.; Bhardwaj, R.; Goetheer, E.; van Sint Annaland, M.; Gallucci, F. Methane pyrolysis in a molten gallium bubble column reactor for sustainable hydrogen production: Proof of concept & techno-economic assessment. Int. J. Hydrogen Energy 2021, 46, 4917–4935. [Google Scholar] [CrossRef]
- Yuan, W.; Sammons, N.E.; McGlocklin, K.H.; Eden, M.R. Economic analysis and process integration of hydrogen production strategies. In 18 European Symposium on Computer Aided Process Engineering; Braunschweig, B., Joulia, X., Eds.; Elsevier: Amsterdam, The Netherlands, 2008; Volume 25, pp. 1083–1088. ISBN 978-0444532275. [Google Scholar]
- Keipi, T.; Tolvanen, H.; Konttinen, J. Economic analysis of hydrogen production by methane thermal decomposition: Comparison to competing technologies. Energy Convers. Manag. 2018, 159, 264–273. [Google Scholar] [CrossRef]
- Cheon, S.; Byun, M.; Lim, D.; Lee, H.; Lim, H. Parametric Study for Thermal and Catalytic Methane Pyrolysis for Hydrogen Production: Techno-Economic and Scenario Analysis. Energies 2021, 14, 6102. [Google Scholar] [CrossRef]
- Seider, W.; Seader, J.; Lewin, D. Product and Process Design Principles: Synthesis, Analysis, and Evaluation; John Wiley & Sons: Hoboken, NJ, USA, 2016. [Google Scholar]
- Cruellas, A.; Bakker, J.J.; van Sint Annaland, M.; Medrano, J.A.; Gallucci, F. Techno-economic analysis of oxidative coupling of methane: Current state of the art and future perspectives. Energy Convers. Manag. 2019, 198, 111789. [Google Scholar] [CrossRef]
- Turton, R.; Bailie, R.; Whiting, W. Analysis, Synthesis and Design of Chemical Processes; Pearson Education: Upper Saddle River, NJ, USA, 2014. [Google Scholar]
- Bhaskar, A.; Assadi, M.; Somehsaraei, H.N. Can methane pyrolysis based hydrogen production lead to the decarbonisation of iron and steel industry? Energy Convers. Manag. X 2021, 10, 100079. [Google Scholar] [CrossRef]
- Chen, J.; Tyagi, R.D.; Li, J.; Zhang, X.; Drogui, P.; Sun, F. Economic assessment of biodiesel production from wastewater sludge. Bioresour. Technol. 2018, 253, 41–48. [Google Scholar] [CrossRef] [PubMed] [Green Version]
- Hoffman, Z. Simulation and Economic Evaluation of Coal Gasification with SETS Reforming Process for Power Production. Master’s Thesis, Louisiana State University (LSU), Bat. Rouge, LA, USA, 2005. Available online: https//digitalcommons.lsu.edu/gradschool_theses/2269/ (accessed on 21 October 2021).
- Feedstock, E. Equipment Design and Cost Estimation for Small Modular Biomass Systems, Synthesis Gas Cleanup, and Oxygen Separation Equipment; National Renewable Energy Laboratory: Golden, CO, USA; Nexant Inc.: San Francisco, CA, USA, 2006. [Google Scholar]
Figure 1.
Block flow diagram of methane pyrolysis in molten KCl.

Figure 2.
Catalytic activity of molten KCl for methane pyrolysis for a 7.5 cm melt height in the differential reactor. (a) Methane conversion versus temperature at 20 mL/min (STP) of Ar:CH4 (50:50 vol%). (b) Arrhenius plot from which apparent activation energy and the pre-exponential factor were determined. (c) Plot used to determine apparent reaction order. (d) Methane conversion versus reaction time at 1000 °C and 20 mL/min (STP) of Ar:CH4 (50:50 vol%).

Figure 3.
(a) Bubble radius versus temperature at 20 mL/min (STP) of Ar:CH4 (50:50 vol %). (b) Bubble radius versus flow rate at 1000 °C.
Figure 3.
(a) Bubble radius versus temperature at 20 mL/min (STP) of Ar:CH4 (50:50 vol %). (b) Bubble radius versus flow rate at 1000 °C.

Figure 4.
Raman spectrum of the water-washed carbon product.

Figure 5.
Percentages of (a) capital and (b) operating costs of the molten KCl-based methane pyrolysis process.
Figure 5.
Percentages of (a) capital and (b) operating costs of the molten KCl-based methane pyrolysis process.

Figure 6.
Hydrogen production cost (USD kgH2−1) versus molten catalyst loss (kgCat kgC−1) and carbon revenue (USD kgC−1) at a fixed molten catalyst price of USD 0.3 kgCat−1.
Figure 6.
Hydrogen production cost (USD kgH2−1) versus molten catalyst loss (kgCat kgC−1) and carbon revenue (USD kgC−1) at a fixed molten catalyst price of USD 0.3 kgCat−1.

Figure 7.
Hydrogen production cost (USD kgH2−1) versus molten catalyst loss (kgCat kgC−1) and molten catalyst price (USD kgCat−1) at a fixed carbon revenue of USD 0.45 kgC−1.
Figure 7.
Hydrogen production cost (USD kgH2−1) versus molten catalyst loss (kgCat kgC−1) and molten catalyst price (USD kgCat−1) at a fixed carbon revenue of USD 0.45 kgC−1.

Figure 8.
Hydrogen production cost (USD kgH2−1) versus molten catalyst price (USD kgCat−1) and carbon revenue (USD kgC−1) at a fixed molten catalyst loss of 0.1 kgCat kgC−1.
Figure 8.
Hydrogen production cost (USD kgH2−1) versus molten catalyst price (USD kgCat−1) and carbon revenue (USD kgC−1) at a fixed molten catalyst loss of 0.1 kgCat kgC−1.


Table 1.
General assumptions made for the simulations.
| Properties | Descriptions | References |
|---|---|---|
| NG compositions (mol %) | 94% CH4; 3% CO2; 2% N2; 1% other hydrocarbons | |
| H2 production capacity | 0.75 kg s−1 | [37] |
| CEPCI | 655.9 (2021) | [40] |
| Discount rate | 0.045 | |
| Lifetime | 20 years | |
| NG lower heating value (LHVNG) | 46.502 MJ kg−1 (2019 year) | [37] |
| NG price | USD 0.005 MJLHV−1 | [42] |
| LP steam (160 °C) price | USD 13.28 GJ−1 (2014 year) | [43] |
| MP steam (184 °C) price | USD 14.19 GJ−1 (2014 year) | [43] |
| HP steam (254 °C) price | USD 17.7 GJ−1 (2014 year) | [43] |
| Cooling water price | USD 12 ton−1 (2018 year) | [14] |
| Electricity price | USD 56 MWh−1 | [44] |
| Labor cost | USD 11 h−1 (2018 year) | [45] |
| Other costs including maintenance | 3% of (Capital cost—Supplement) USD y−1 | [40] |
| Molten catalyst price | USD 0.3~4.3 kgCat−1 | |
| Molten catalyst loss | USD 0.1~0.3 kgCat kgC−1 | |
| Carbon revenue | USD 0.25~0.45 kgC−1 | |
| Bubble column reactor | (lb) | [41] |
| PSA | (2005 year) | [46] |
| Heat exchanger | USD (2010 year) | [41] |
| : tube-length correction | ||
| , | ||
| A: heat exchange surface area (ft2) | ||
| Fired heater | USD (2010 year) | [41] |
| : material factor | ||
| , Q: MMBtu/h | ||
| Compressor | USD (2010 year) | [41] |
| : material factor | ||
| : hp |
Table 2.
Average compositions of carbon cake purified using different methods.
| Methods | C (at%) | Cl (at%) | K (at%) |
|---|---|---|---|
| Warm water washing (50 °C) | 93.4 | 3.1 | 3.5 |
| HCl washing (50 °C) | 96.2 | 2.2 | 1.6 |
| Sonication in water (50 °C) | 95.7 | 1.8 | 2.5 |
| Heating under vacuum (1000 °C) | 95.2 | 1.8 | 3.0 |
| Heating under flowing Ar (1200 °C) | 97.2 | 1.3 | 1.5 |
Table 3.
Stream data of the pyrolytic process.
| (1) | (2) | (3) | (4) | (5) | (6) | (7) | |
|---|---|---|---|---|---|---|---|
| Temperature (°C) | 25 | 1000 | 1000 | 54.4 | 54.4 | 54.4 | 1000 |
| Pressure (bar) | 1.01 | 5.00 | 5.00 | 10.10 | 10.10 | 10.10 | 5.00 |
| Mass Flows (tonne h−1) | 17.18 | 17.18 | 8.17 | 8.17 | 2.72 | 5.45 | 9.01 |
| Mole fraction | |||||||
| CH4 | 0.94 | 0.94 | 0.11 | 0.11 | 0 | 0.47 | 0 |
| CO2 | 0.03 | 0.03 | 0.02 | 0.02 | 0 | 0.07 | 0 |
| H2 | 0 | 0 | 0.86 | 0.86 | 1.00 | 0.38 | 0 |
| N2 | 0.02 | 0.02 | 0.01 | 0.01 | 0 | 0.05 | 0 |
| C (including salt impurities) | 0 | 0 | 0 | 0 | 0 | 0 | 1.00 |
| Other hydrocarbons | 0.01 | 0.01 | <0.01 | <0.01 | 0 | 0.03 | 0 |
Table 4.
Capital and operating costs per unit kg of hydrogen production (USD kgH2−1) by molten KCl-based methane pyrolysis.
Table 4.
Capital and operating costs per unit kg of hydrogen production (USD kgH2−1) by molten KCl-based methane pyrolysis.
| Capital costs (USD kgH2−1) | |||||||
| Reactor | PSA | Heat exchangers | Compressors | Sum | |||
| 0.80 | 0.21 | 0.21 | 0.15 | 1.37 | |||
| Operating costs (USD kgH2−1) | |||||||
| Heating | Cooling | Electricity | Labor | Maintenance | Ohers | Raw materials | Sum |
| 0.89 | <0.01 | 0.07 | 0.33 | 0.18 | 0.36 | 0.17 | 2.00 |
Publisher’s Note: MDPI stays neutral with regard to jurisdictional claims in published maps and institutional affiliations. |
© 2021 by the authors. Licensee MDPI, Basel, Switzerland. This article is an open access article distributed under the terms and conditions of the Creative Commons Attribution (CC BY) license (https://creativecommons.org/licenses/by/4.0/).
Share and Cite
MDPI and ACS Style
Boo, J.; Ko, E.H.; Park, N.-K.; Ryu, C.; Kim, Y.-H.; Park, J.; Kang, D. Methane Pyrolysis in Molten Potassium Chloride: An Experimental and Economic Analysis. Energies 2021, 14, 8182. https://0-doi-org.brum.beds.ac.uk/10.3390/en14238182
AMA Style
Boo J, Ko EH, Park N-K, Ryu C, Kim Y-H, Park J, Kang D. Methane Pyrolysis in Molten Potassium Chloride: An Experimental and Economic Analysis. Energies. 2021; 14(23):8182. https://0-doi-org.brum.beds.ac.uk/10.3390/en14238182
Chicago/Turabian StyleBoo, Jinho, Eun Hee Ko, No-Kuk Park, Changkook Ryu, Yo-Han Kim, Jinmo Park, and Dohyung Kang. 2021. "Methane Pyrolysis in Molten Potassium Chloride: An Experimental and Economic Analysis" Energies 14, no. 23: 8182. https://0-doi-org.brum.beds.ac.uk/10.3390/en14238182
Note that from the first issue of 2016, this journal uses article numbers instead of page numbers. See further details here.