
Numerical and Experimental Analysis of Heat Flow at Window-to-Wall Interface


1
Faculty of Civil Engineering, Czestochowa University of Technology, 69 Dabrowskiego St., 42-201 Czestochowa, Poland
2
Ergo Plus Poland LLC, Polnocna 10 St., 42-610 Miasteczko Slaskie, Poland
*
Author to whom correspondence should be addressed.
Energies 2022, 15(10), 3837; https://0-doi-org.brum.beds.ac.uk/10.3390/en15103837
Submission received: 1 May 2022
/
Revised: 17 May 2022
/
Accepted: 19 May 2022
/
Published: 23 May 2022
Abstract
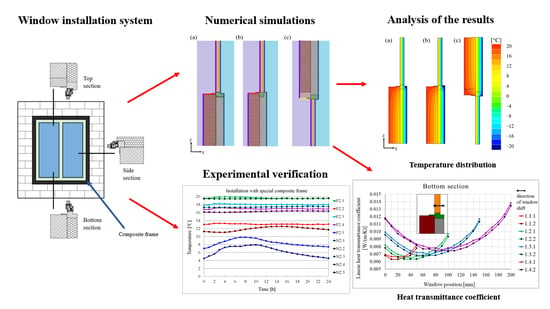
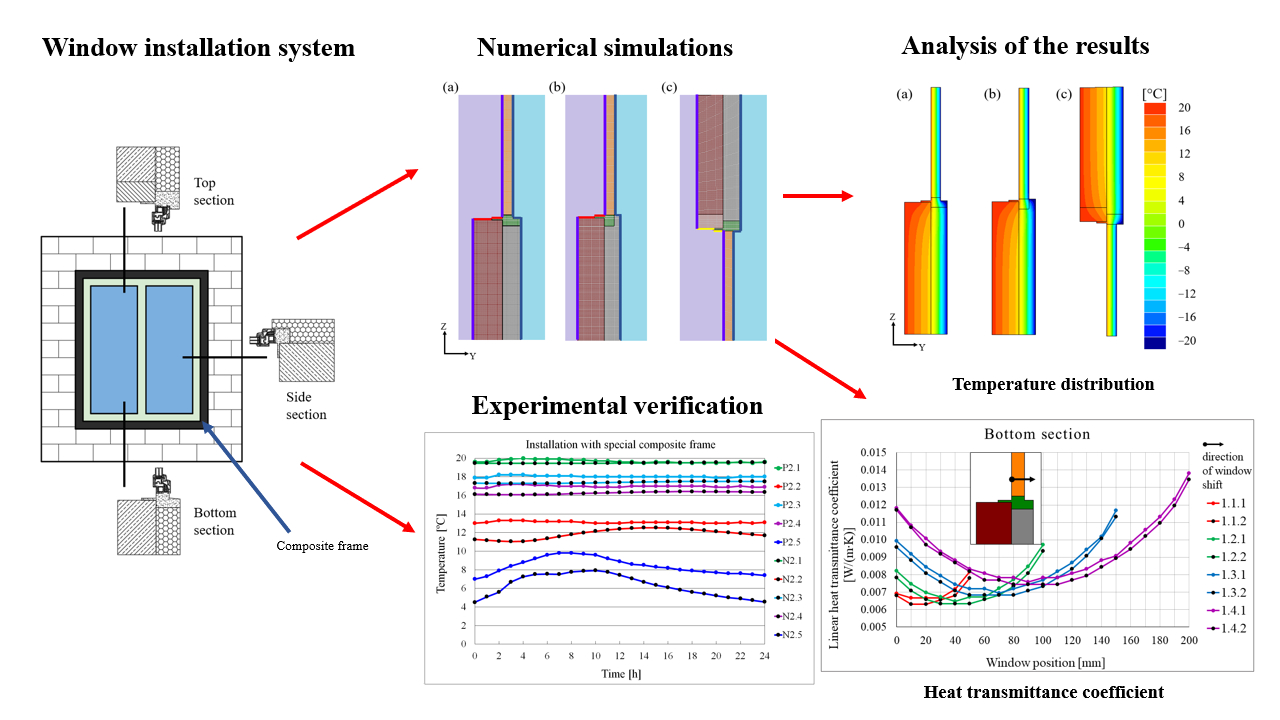
:External walls have a great influence on the thermal and humidity conditions in buildings as well as on the possibility of reducing energy consumption. While the structural and material aspects of walls and windows are well known, obtaining a tight connection to reduce thermal bridges between the window and walls still poses a significant problem. Therefore, a new window installation system proposed by the authors, eliminating linear and point thermal bridges at the window-to-wall interface, opens a pathway for lowering energy consumption in buildings and increasing thermal comfort and thermal efficiency. To prove the effectiveness of this system, numerical and experimental analyses of heat flow through an outer wall with a window were carried out. The numerical analyses were performed using the TRISCO software package. It was shown that the proposed solution eliminated the occurrence of linear thermal bridges at the window-to-wall interface (a linear heat transmittance coefficient Ψ ≈ 0.007, which meets the requirements of the passive house, was obtained). Thus, heat losses were reduced by nearly eight times compared to conventional installation systems. Numerical calculations were experimentally verified.
1. Introduction
Environmentally friendly activities in the construction industry focus on looking for opportunities to reduce energy consumption, especially since a European Commission report [1] showed that, on average, 51% of the annual energy expenditure in a household is spent on heating or cooling rooms. Heat exchange through the external walls, windows, doors and thermal bridges has the greatest impact on energy consumption. According to [2,3], heat flow is the cause of 40–60% of total energy loss, while Najjar et al. [4] estimated it to be up to 70%.
In [5,6,7], it was suggested that the external wall structure, and the type of materials they are made of, are crucial in limiting heat losses. Newly constructed buildings, especially energy-efficient and passive ones, must meet strict criteria in terms of energy savings and the sustainable use of natural resources. Reduction in heat losses can be achieved through the appropriate selection of materials as well as through structural and technological solutions. In the case of windows, heat losses can be significantly reduced by increasing the number of panes. Arici et al. [8] showed that replacing a double-glazed window with a triple-glazed one resulted in energy savings of about 50%, while the use of a four-glazed window resulted in 67% savings.
Although the proper design of external walls is possible through use of numerical analyses, thermal bridges occurring at the window-to-wall interface are still a major challenge. Holownia [9] showed that linear bridges are responsible for about 20% of the total heat losses through the external wall. In areas where thermal bridges occur, in addition to the increase in heat flow, there is a decrease in temperature, which may cause surface condensation and mould appearance [10]. Ujma and Kysiak [11] indicated that, apart from deterioration in user comfort (e.g., lower room temperature, occurrence of air drafts), thermal bridges also contribute to crack formation on the building facade. Therefore, when designing the building envelope, thermal bridges are subjected to special structural and energy analysis.
The linear heat transmittance coefficient Ψ is the basic parameter characterizing linear thermal bridges. Usually, it is adopted based on the technical literature (e.g., catalogues [12,13,14] and standards [15]) or it is calculated analytically according to [16]. The correct determination of linear and point heat transmittance coefficients allows determination of the influence of thermal bridges on heat losses. Pawlowski [17] and Martin et al. [18] point out that the standard based or analytically calculated thermal bridges may differ by about 20% compared to the actual values. The authors state that numerical calculations achieve results with 95% accuracy and therefore consider them to be more advisable. Similarly, Viot et al. [19] recommend performing numerical calculations for each newly introduced solution, instead of using commonly available catalogues. Additionally, most studies on thermal bridges are based on a one-dimensional heat flow analysis. It was shown in [20] that such an approach may produce unreliable results. Taoum et al. [21] suggest that two-dimensional and three-dimensional analyses provide better solutions. They also recommend using mesh sizes smaller than those used in conventional finite element methods (FEM), although this lengthens the computation time.
Some authors believe that the most reliable way to determine the value of thermal bridges is to combine numerical calculations with experimental studies. Zalewski et al. [22] examined thermal bridges in prefabricated building walls. The heat flow was controlled using thermocouples, an infrared camera and fluxmeters. The experimental results were compared with the numerical results. A similar approach to the analysis of thermal bridges in the external wall was presented in [23]. Various window elements were tested in a specially designed “hot box” device equipped with a measuring system and an infrared camera. A percentage discrepancy between the experimental and numerical results of about 5.0 to 7.0% was recorded.
Experimental tests in thermal chambers and numerical analyses suggest that window installation in the thermal insulation layer is the most optimal with respect to lowering of the linear heat transmittance coefficient, and thus reducing heat losses. Cappelletti et al. [24] analysed thermal bridges formed during the installation of wooden windows in the external wall. Linear heat transmittance coefficients were calculated for three cases of the window position relative to the wall face and for three methods of insulation of the hole perimeter. The analyses showed that moving windows towards the insulation layer, depending on the method of jamb insulation, reduced the value of the linear heat transmittance coefficient Ψ by 58 to 75%. Research by Misiopecki et al. [25] showed that the best approach was to position the window in the middle of the insulating layer—as a result the linear heat transmittance coefficient Ψ was decreased by about 50%. Similar analyses were carried out in [26], in which the authors paid attention to linear bridges occurring in the vicinity of steel lintels depending on the position of the window in the jambs. The authors suggest that the optimal position of the window is achieved when three conditions are met: parallel distribution of isotherms proving the continuity of the thermal coating, a low Ψ coefficient ensuring reduction in heat losses, and high temperature of the internal surface to avoid the risk of condensation. Pawlowski and Krajewska [27] showed that insulation extended over the frame, compared to a non-insulated frame, decreased the linear heat transmittance coefficient Ψ by about 20%, while the minimum temperature on the internal wall surface in place of a thermal bridge was higher by about 2 °C.
A number of studies [28,29,30] show that, apart from the optimal positioning of the window in the outer wall, the technological aspects of the window-to-wall interface are also important, especially to ensure the air- and watertightness of such connections. A lack of tightness results in deterioration in thermal and humidity parameters. Van Den Bossche et al. [28] examined the influence of different window installation methods on airtightness and suggested that, when installing with an airtight membrane, it is important not only to use it, but also to apply the correct method and sequence of installation steps. Van Linden and Van Den Bossche [29] emphasize that even in laboratory conditions it is difficult to obtain waterproof tight connections between the wall and window. They recommend the use of special gaskets and linings, which, however, further complicate the window installation process. Konstantinov and Safiullov [30] drew attention to another important aspect of installing windows in a thermal insulation layer. While analysing existing assembly technologies, they found that most of the proposed installation systems were adapted to the window installation in low-rise residential buildings. Installation from the outside of the building is therefore easier and no additional equipment is required for working at heights. The authors emphasize that there are no appropriate assembly systems for multi-storey residential buildings that would not generate high costs.
In [31,32], it was shown that the use of proper mounting elements, such as a special composite windowsill beam, for window installation, improved the temperature distribution in external walls. The freezing zone of such a wall was reduced, thanks to which there was no risk of damaging the wall due to water freezing in the pores of the walls and there was no risk of mould or fungus development on the inner surface of the window-to-wall interface.
Currently, the question arises whether it is possible to design such a system of window installation to avoid the formation of thermal bridges at the window-to-wall interface. This would mean obtaining a linear heat transmittance coefficient Ψ ≤ 0.01, as recommended by the Passive House Institute [33]. Such a connection would have to be both air- and watertight, and the assembly method should be universal enough to be used for standard wall structures used in contemporary construction and for any type and shape of window profile. Moreover, the connection should ensure an appropriate temperature on the inner surface of the window-to-wall interface to eliminate the risk of condensation and mould growth. These requirements are met by the solution discussed in this article. Analyses of heat flow through a wall with a window installed according to a patented system are presented. A special composite frame with a variable cross-section was used to install the window. The analyses covered the cross-section under the window, where the frame, in addition to its stabilizing and insulating role, transfers loads from the window and sill. Additionally, the side and upper cross-sections, where the frame serves only a stabilizing and insulating function, were also analysed.
2. Aim and Range
The aim of this investigation was to analyse heat flow through an external wall with a window installed in a so-called warm installation system using a special composite frame, according to the system elaborated and patented [34] by one of the co-authors of this work, and to compare this with a conventionally installed window, i.e., using mounting foam. Particular attention was paid to the influence of the window type, the thickness of the thermal insulation layer and the location of the window in the insulation layer on the linear heat transmittance coefficient Ψ. The demand for technologies that improve building thermal insulation properties justifies the focus on the elimination of thermal bridges at the window-to-wall interface. Taking into account the fact that the proper installation of windows plays an important role in reducing energy consumption today, the results of the research will directly benefit building users (by lowering heating costs, improving thermal comfort, reducing the risk of water vapor condensation and mould growth), and indirectly the whole of society (by reducing greenhouse gas emissions).
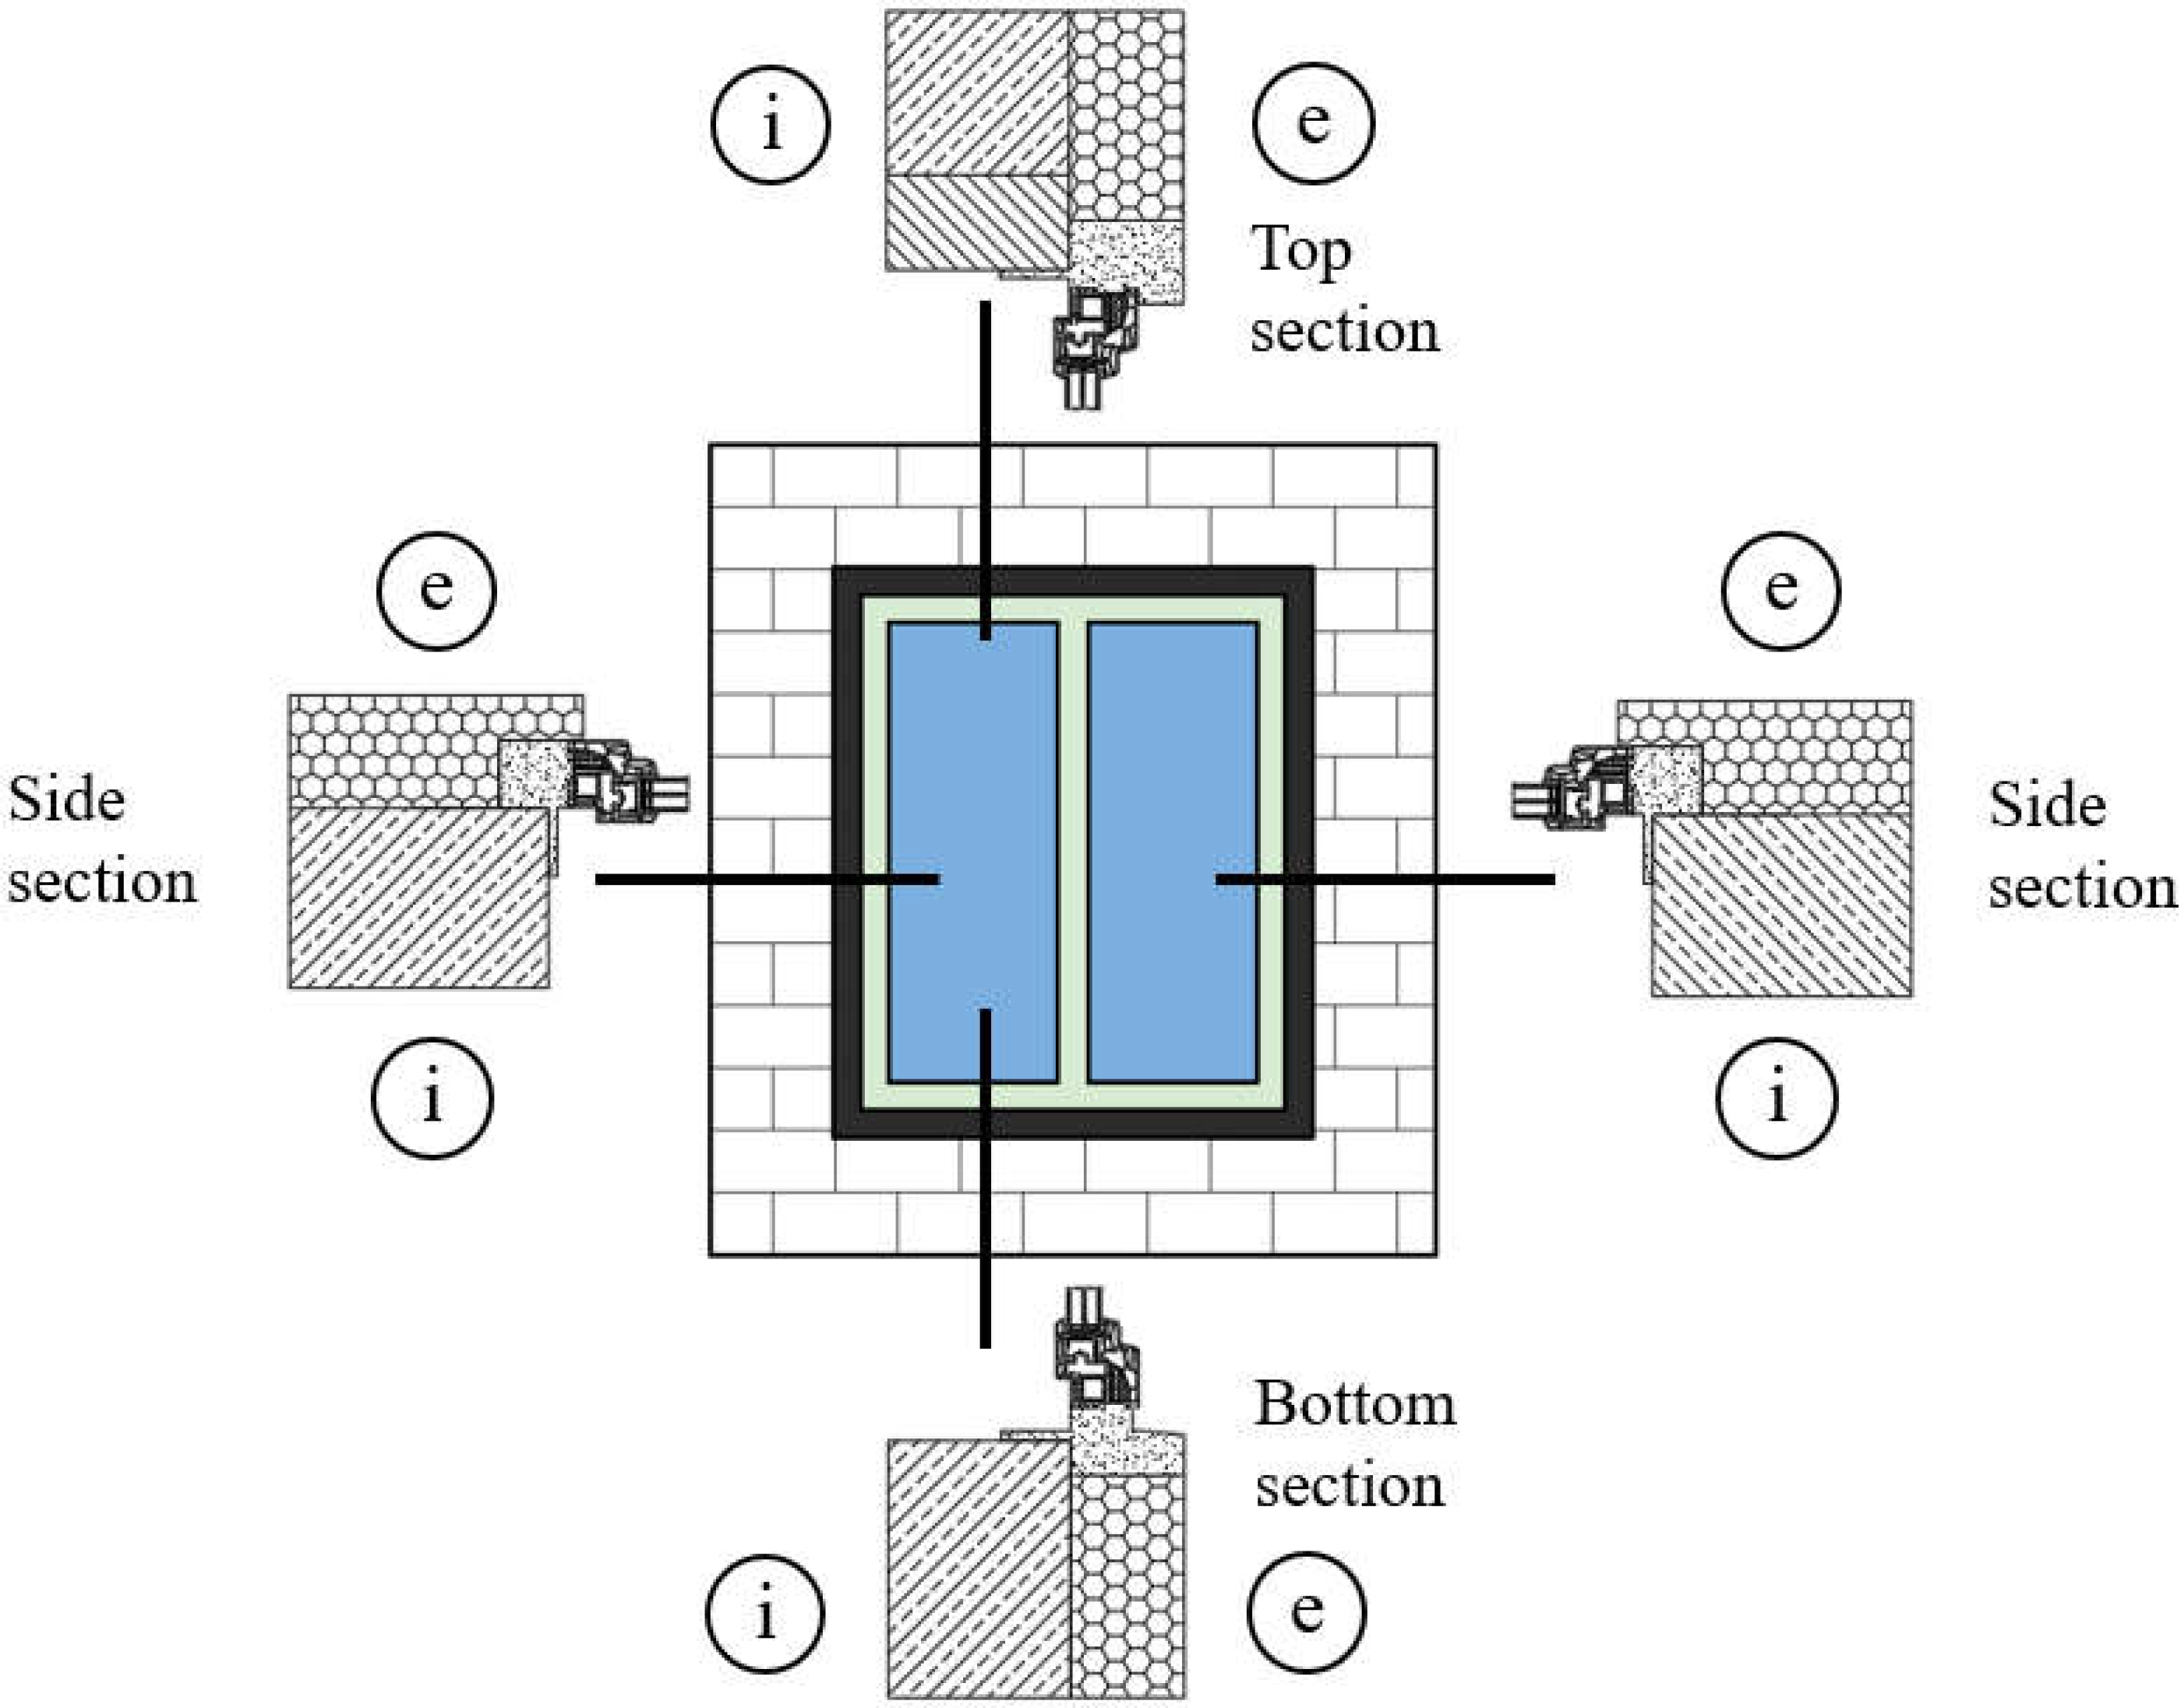
As part of this work, three sections of the window installation system were analysed: the bottom, sides and top (Figure 1).
Thermal analyses were carried out with TRISCO software [35], based on the finite element method. Some of the numerical calculation results were experimentally verified. The verification included temperature measurement at the selected points of the test stand, i.e., the external wall of one of the buildings on the Czestochowa University of Technology campus, with two windows installed in the abovementioned way. The analytical calculations of the linear heat transmittance coefficient were performed in accordance with the standard [15].
3. Description of the Analysed Installation System
According to the passive house requirements, the total heat transmittance coefficient of the window cannot exceed 0.8 W/(m2∙K) [33]. The window assembly should ensure air- and water-tightness as well as continuous insulation of the building envelope. Unfortunately, assembly systems available on the market, which are based on steel angles, wooden foundations or even special plastic consoles, do not ensure continuous thermal insulation of the outer wall. Most often, thermal bridges are formed at the window-to-wall interface, especially given that the mounting foam used for sealing degrades over time, and tends to soak up water at pruning sites. As a result, after a short period of use, especially in winter, linear thermal bridges appear around the windows. Additionally, anchors and other metal mounting elements contribute to the formation of point bridges. The resulting thermal bridges eliminate the energy benefits resulting from the use of windows with better energy parameters. A derivative of thermal bridges is the formation of dampness at jambs where fungus and moulds develop.
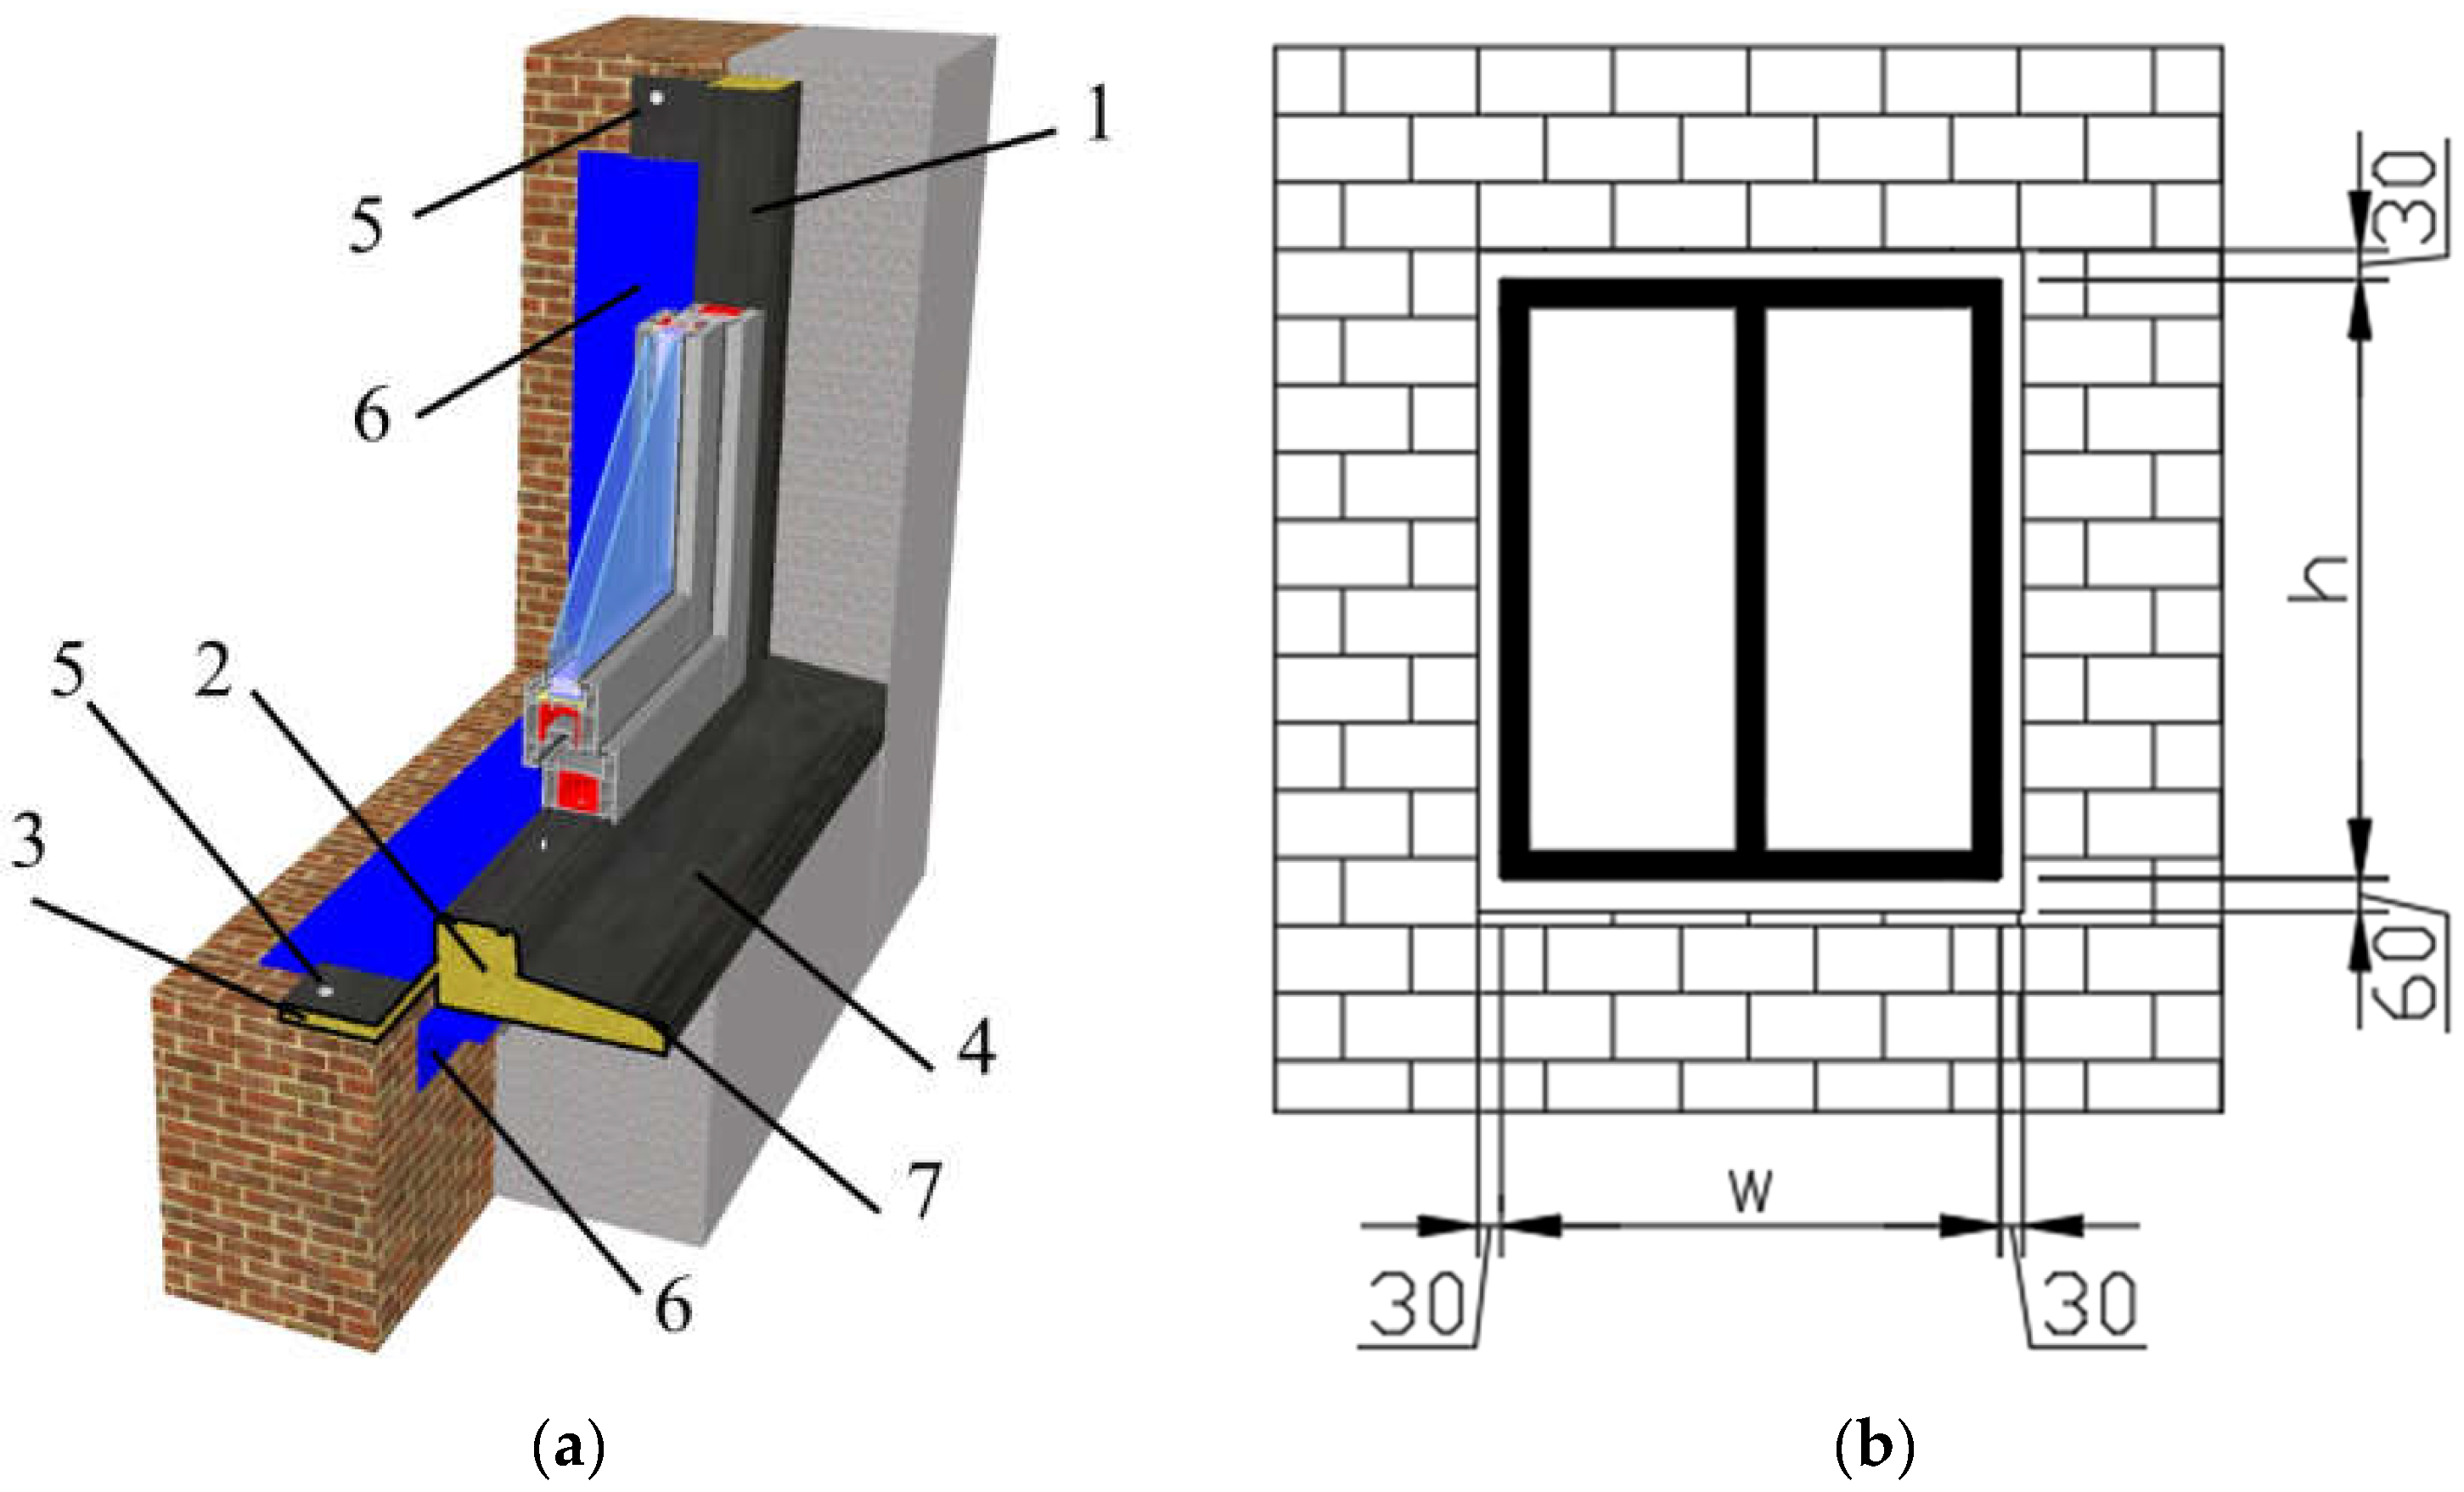
The analysed installation system (Figure 2) ensures continuity of thermal insulation. It is a modified solution of the window installation discussed in [32].
A window is mounted in a special composite frame (1), whose shape and dimensions depend on the window profile, the structure of the load-bearing wall and the thickness of the thermal insulation layer. The lower part of the frame is a sill beam (2) playing the role of the load-bearing and insulating part. The beam is widened in the place intended for the installation of the internal (3) and external (4) windowsills. The frame with the window is inserted into the window mounting space, which must be 60 mm wider than the window width w (30 mm at the left and 30 mm at the right side of the window) and 90 mm greater than the window height h (30 mm from the top and 60 mm from the bottom of the window). The shape of the frame is designed so that the frame overlaps the wall and closely fills the space between the wall and the window joinery. The frame is attached to the wall with expansion plugs (5) only from the inside of the room, as a result of which the plugs do not transfer heat from the room to the outside. The complete tightness of the assembly system is ensured by additional cover strips (6), which are glued to the frame after it has been installed in the wall. On the inside a vapour-proof tape is used, and on the outside, a vapour-permeable one. All parts of the frame are made of a rigid foamed composite having a heat transfer coefficient of 0.02 W/(m∙K). The special coating of polyester and polyurea resins (7) applied to the surface of the composite parts makes them resistant to moisture and UV radiation. The mounting composite frame can be freely configured depending on the shape and size of the window.
The proposed installation system is easy to implement and is only apparently more expensive than the conventional one. The additional cost of the composite frame is compensated by a three-times shorter installation time compared to the process which utilizes consoles for the purpose of mounting the same window in the thermal insulation layer. The shortening of the time results, among others, from the fact that the correct arrangement of the window with the mounting frame in the light of the jamb does not require special long-term levelling, so less time is spent on insulating the window-to-wall interface. Additionally, the proposed installation system significantly reduces human errors.
4. Experimental Verification of the Numerical Model of Heat Transfer
An experimental verification of the numerical calculations was performed. The numerical analyses were performed using the VOLTRA and TRISCO programs. VOLTRA is a thermal analysis program for transient heat transfer in three-dimensional rectangular objects. VOLTRA is an extension of TRISCO providing time-dependent boundary conditions.
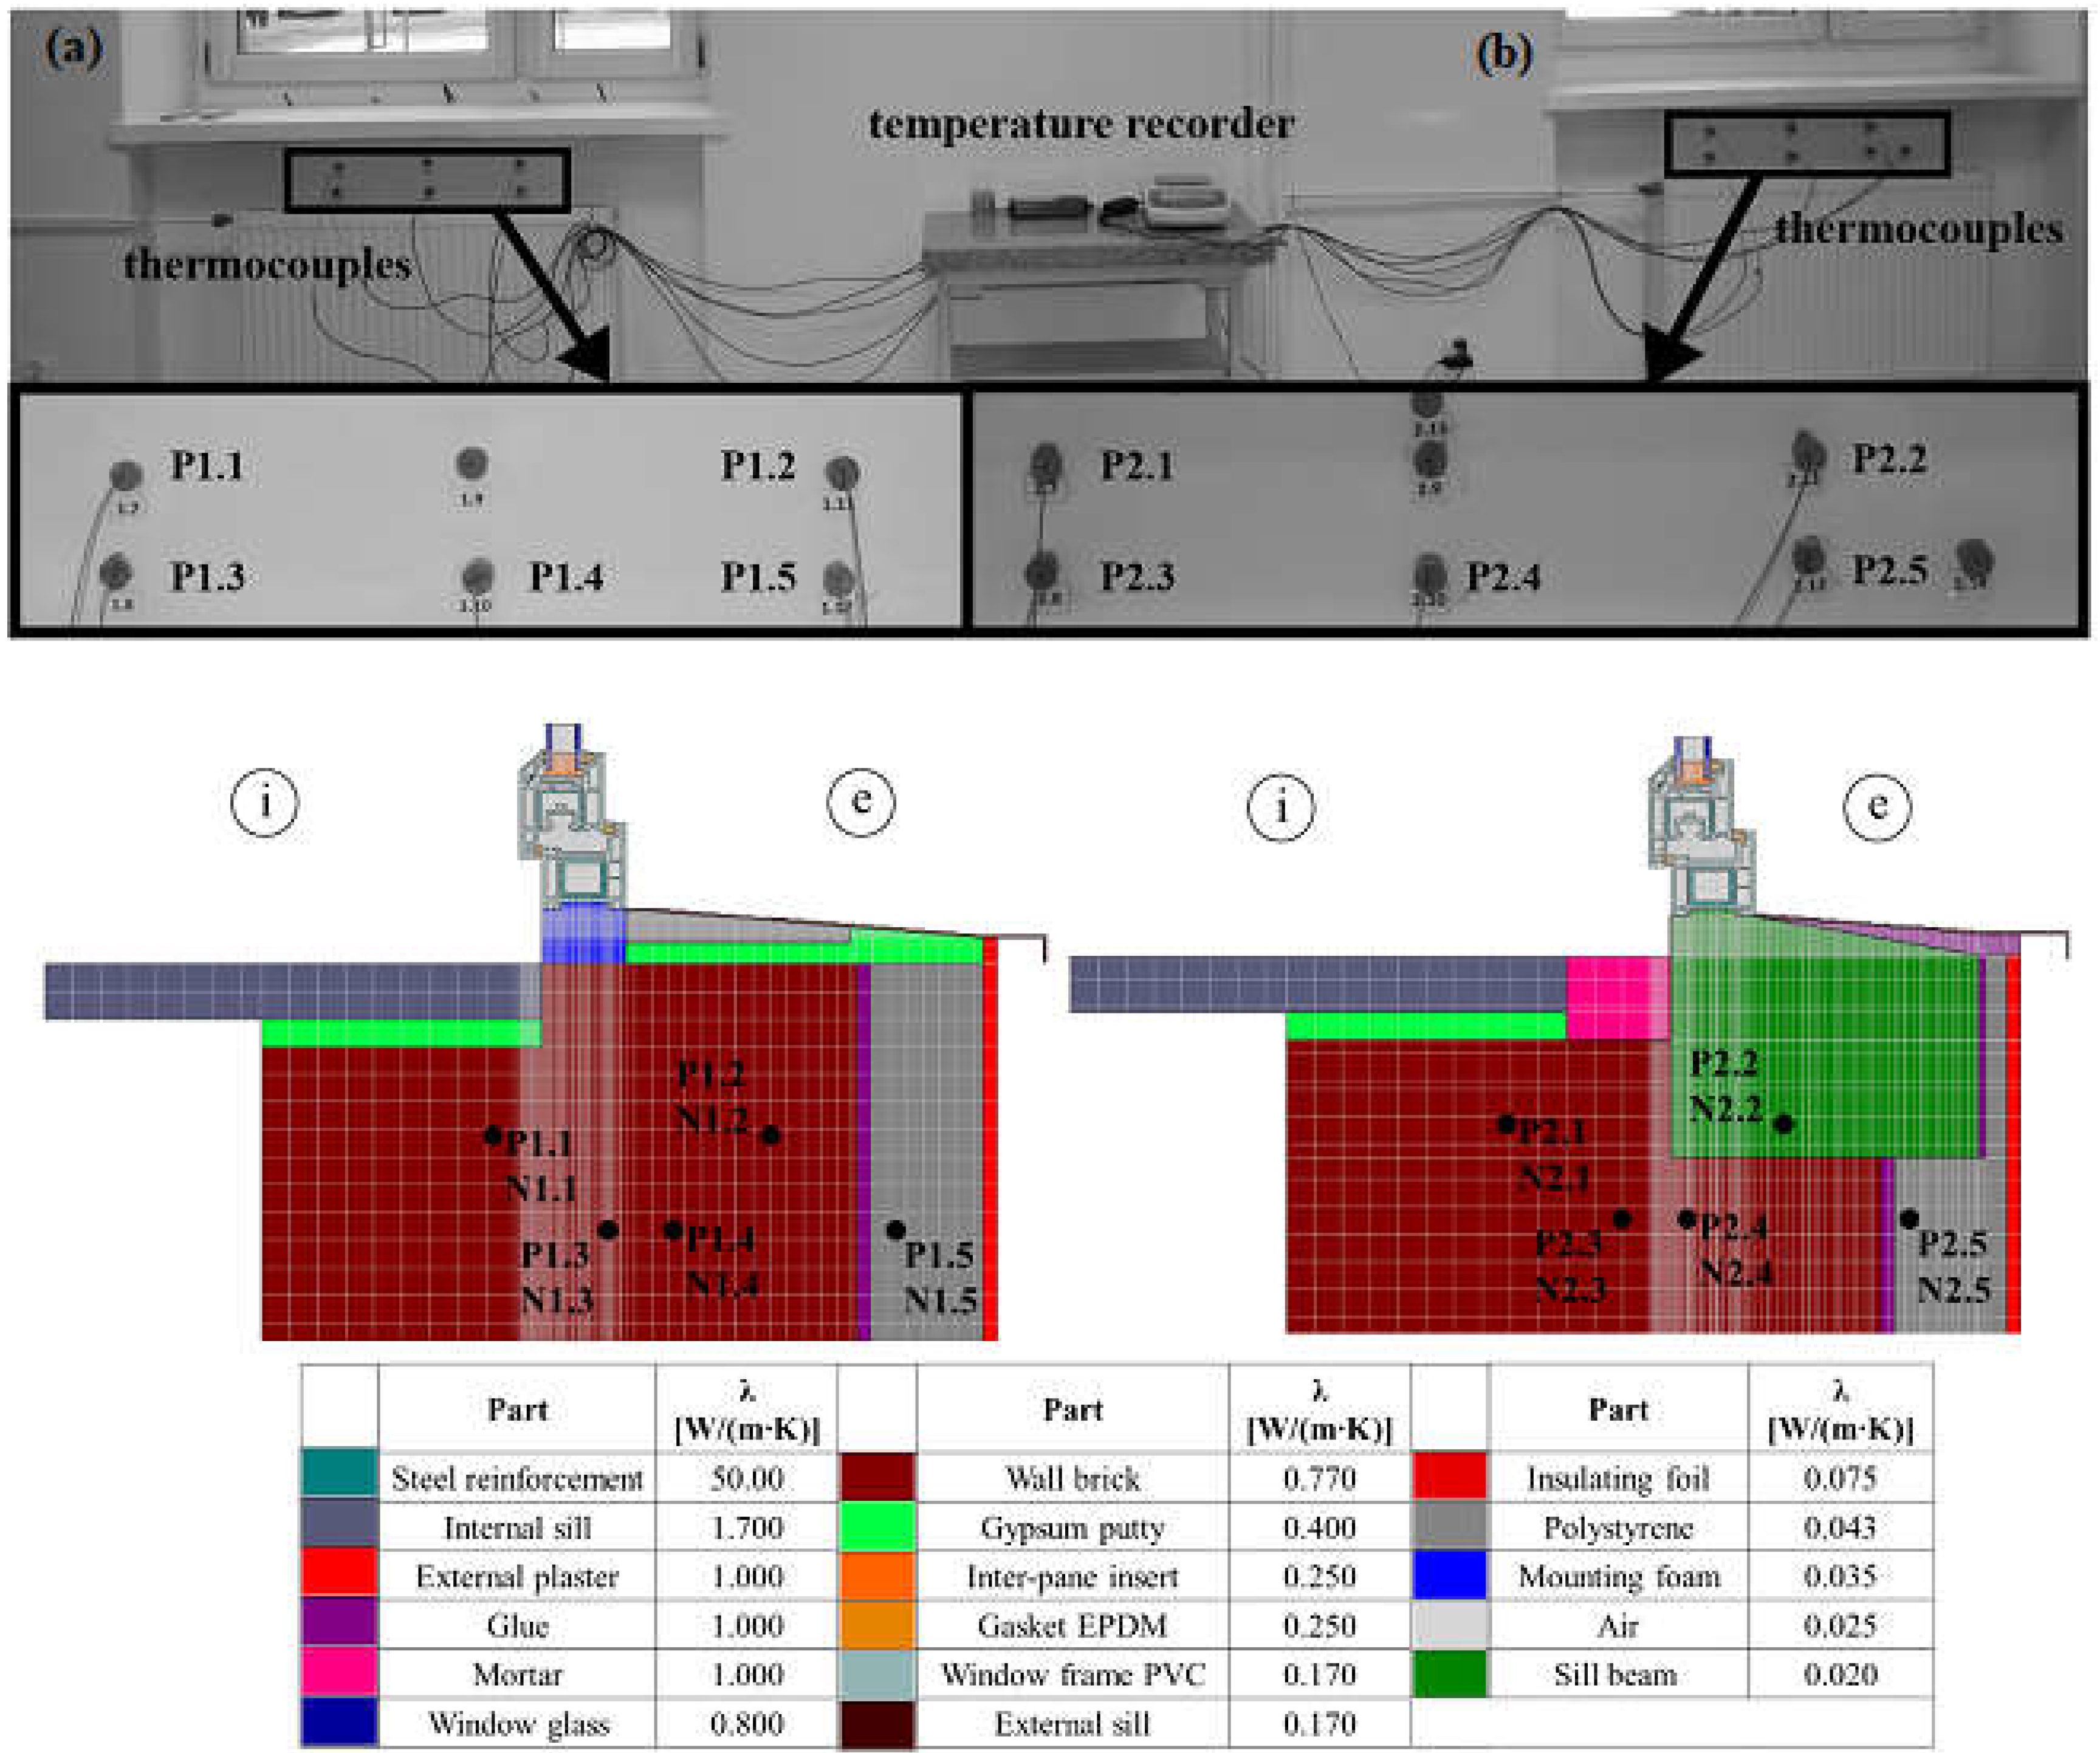
The numerical models analysing heat transfer through the wall separating a room, having a constant temperature of 20 °C and the external environment having a variable temperature, were verified. In the numerical simulations, the boundary conditions of the thermal resistances for horizontal heat flow were assumed to have Rsi = 0.13 and Rse = 0.04 (m2∙K)/W. Several 3D numerical models were developed, where materials with different thermal properties were denoted using different colours. For each material, appropriate properties were defined, i.e., thermal conductivity, material density and specific heat. The grid unit in the numerical models was 1 mm. The intersection points of three orthogonal grid planes inside or at the surface of material blocks were nodes of the system. A detailed description of the numerical models is given in [31]. The test stand and the numerical models for the bottom cross-section of the windows are presented in Figure 3.
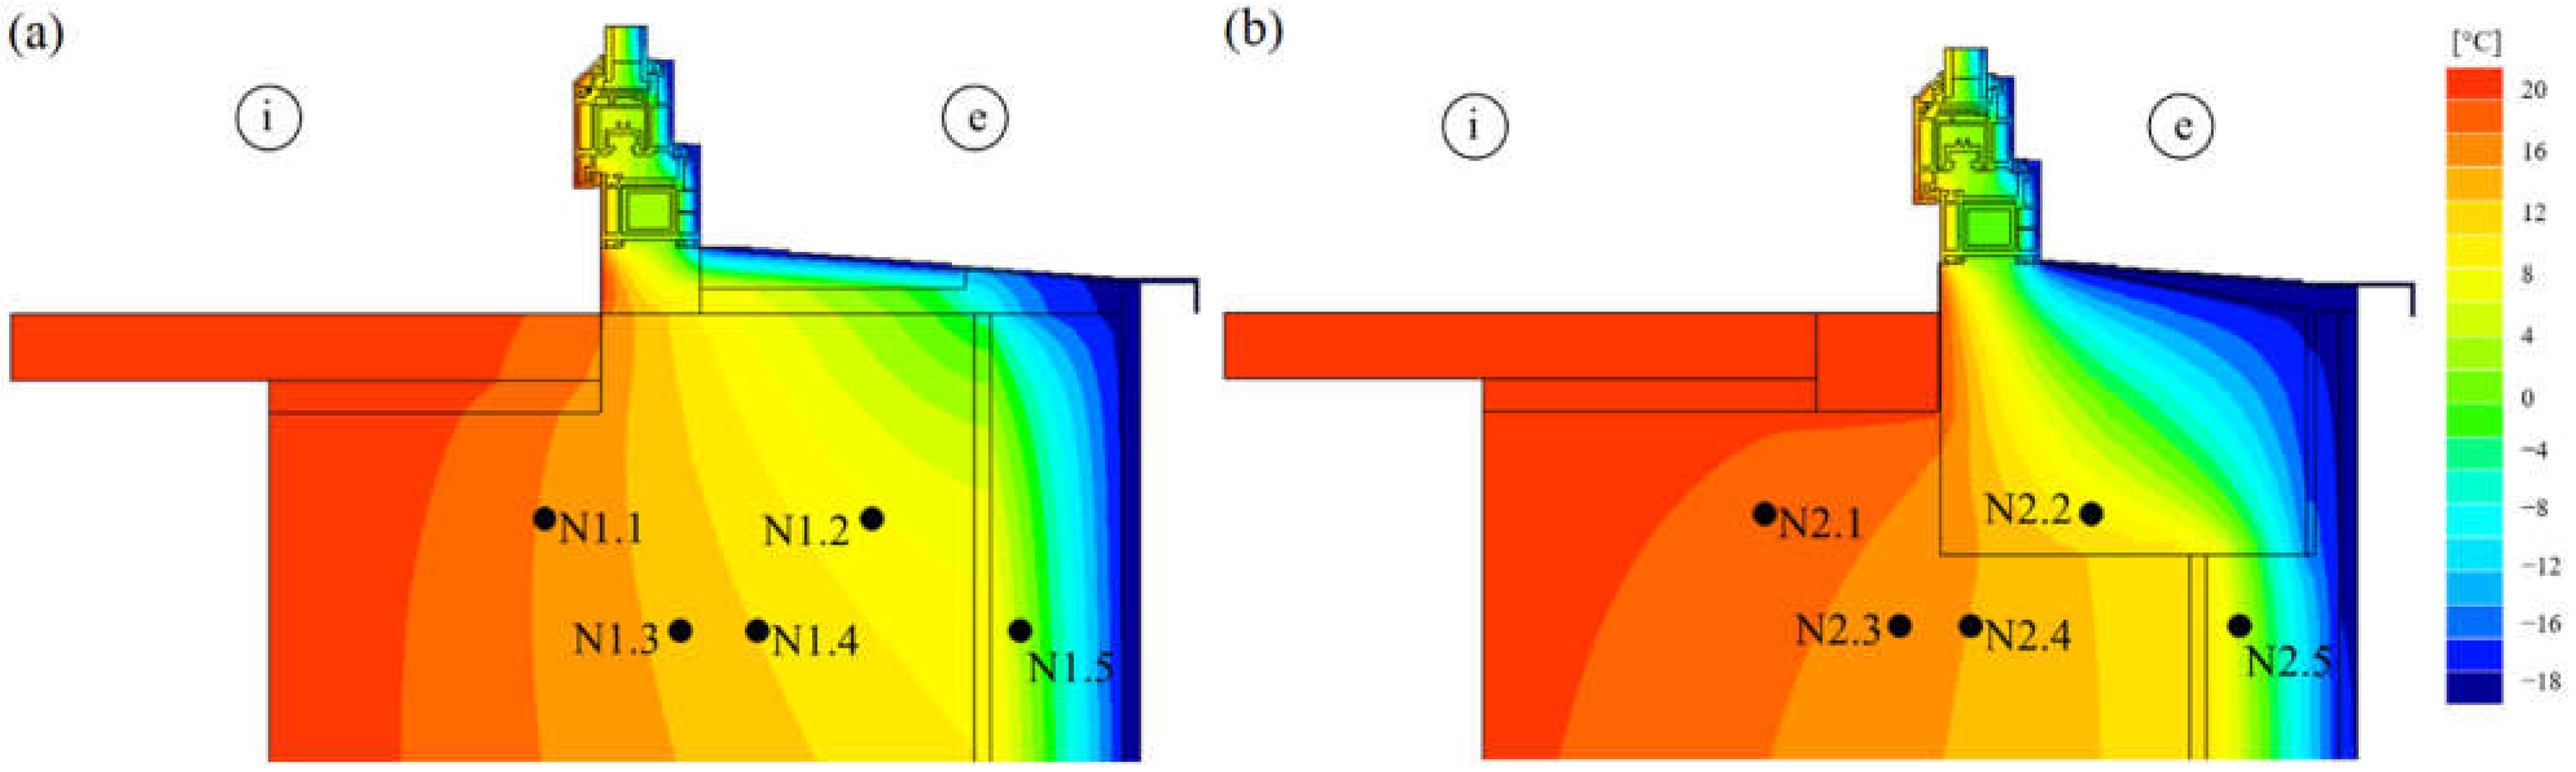
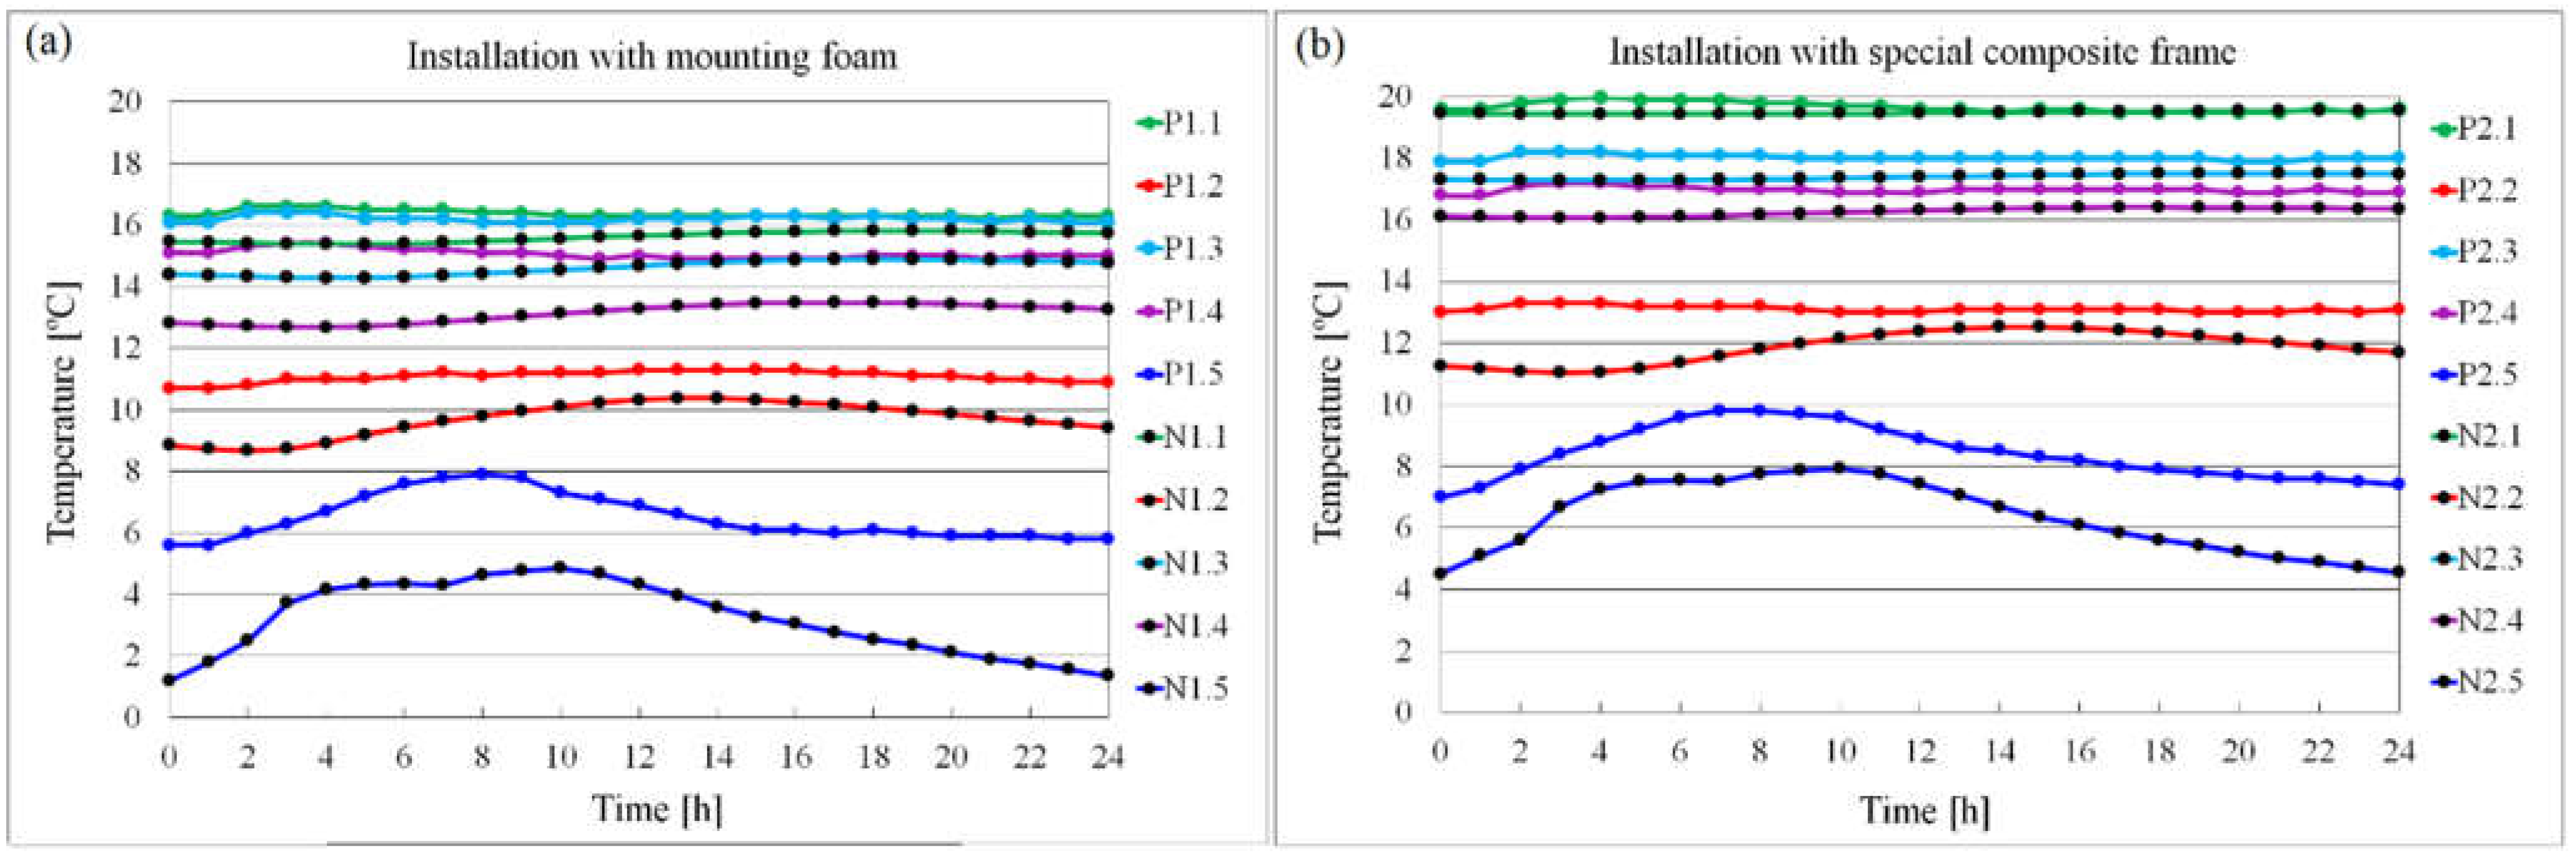
The numerically calculated temperature distribution in the wall for both considered cases is shown in Figure 4. The numerical results in the selected nodes were compared with the temperature recorded in the corresponding measurement points of the test stand (Figure 5). The figures show the analyses based on the external temperature measured every hour on 19 January 2021.
There was a clear difference whereby higher temperatures, by about 2 °C, occurred in the model of the window with the composite frame (Figure 4b). Due to lower heat transfer in this model, lower heat losses occurred at the window-to-wall interface. Similar differences were registered at the measuring points.
The average difference between the numerically calculated and the experimentally measured temperatures was 1.5 °C for the wall with the conventionally installed window, and 0.7 °C for the wall with the window installed using the composite frame. The temperature difference at points P1.4, P1.5, P2.4 and P2.5 resulted from the position of these points in the actual wall from 1920. In the case of point P1.4 and node N1.4 the difference of 1.9 °C was most likely due to the material heterogeneity of the wall. The numerical simulation takes into account a single thermal conductivity coefficient representing both bricks and mortar, while in the actual masonry, the bricks were joined with a mortar having a different thermal conductivity coefficient than the bricks. The thermocouple at the measurement point P1.4 was placed in the volume of the mortar. For the temperature differences of approximately 3 °C for the point P1.5 and node N1.5 and approximately 2 °C for the point P2.5 and node N2.5, both measurement points P1.5 and P2.5 were located in the styrofoam layer, which most likely lost its original insulating properties with the passage of time, especially since the thermal insulation of the building was made of white styrofoam in the 1990s, at a time when technological regimes were not strictly followed. The calculations were based on catalogue thermal conductivity coefficients. In order to avoid these inconveniences, it is planned to conduct similar experiments in a special “hot-box” in the future. The same analyses were performed for the side and top sections. The obtained results were similar to the results for the bottom section. The authors considered the consistency of the numerical and experimental results to be sufficient. Thus, further analyses of heat transmittance coefficient were only performed numerically.
5. Analysis of Heat Transfer in the Wall
5.1. Analytical Calculations
The values of the linear heat transmittance coefficient were determined based on the results of numerical analysis and on Formula (1) according to standard [16]:
where:
Ψ—linear heat transmittance coefficient [W/(m∙K)],
L2D—thermal coupling coefficient [W/(m∙K)],
Ui—wall heat transfer coefficient [W/(m2·K)],
li—length of wall for which value Ui is valid [m].
The thermal coupling coefficient was calculated from Formula (2) from the standard [16]:
where:
Φ—heat flow value [W] determined based on numerical calculations performed in the TRISCO program,
ΔT—temperature difference [°C].
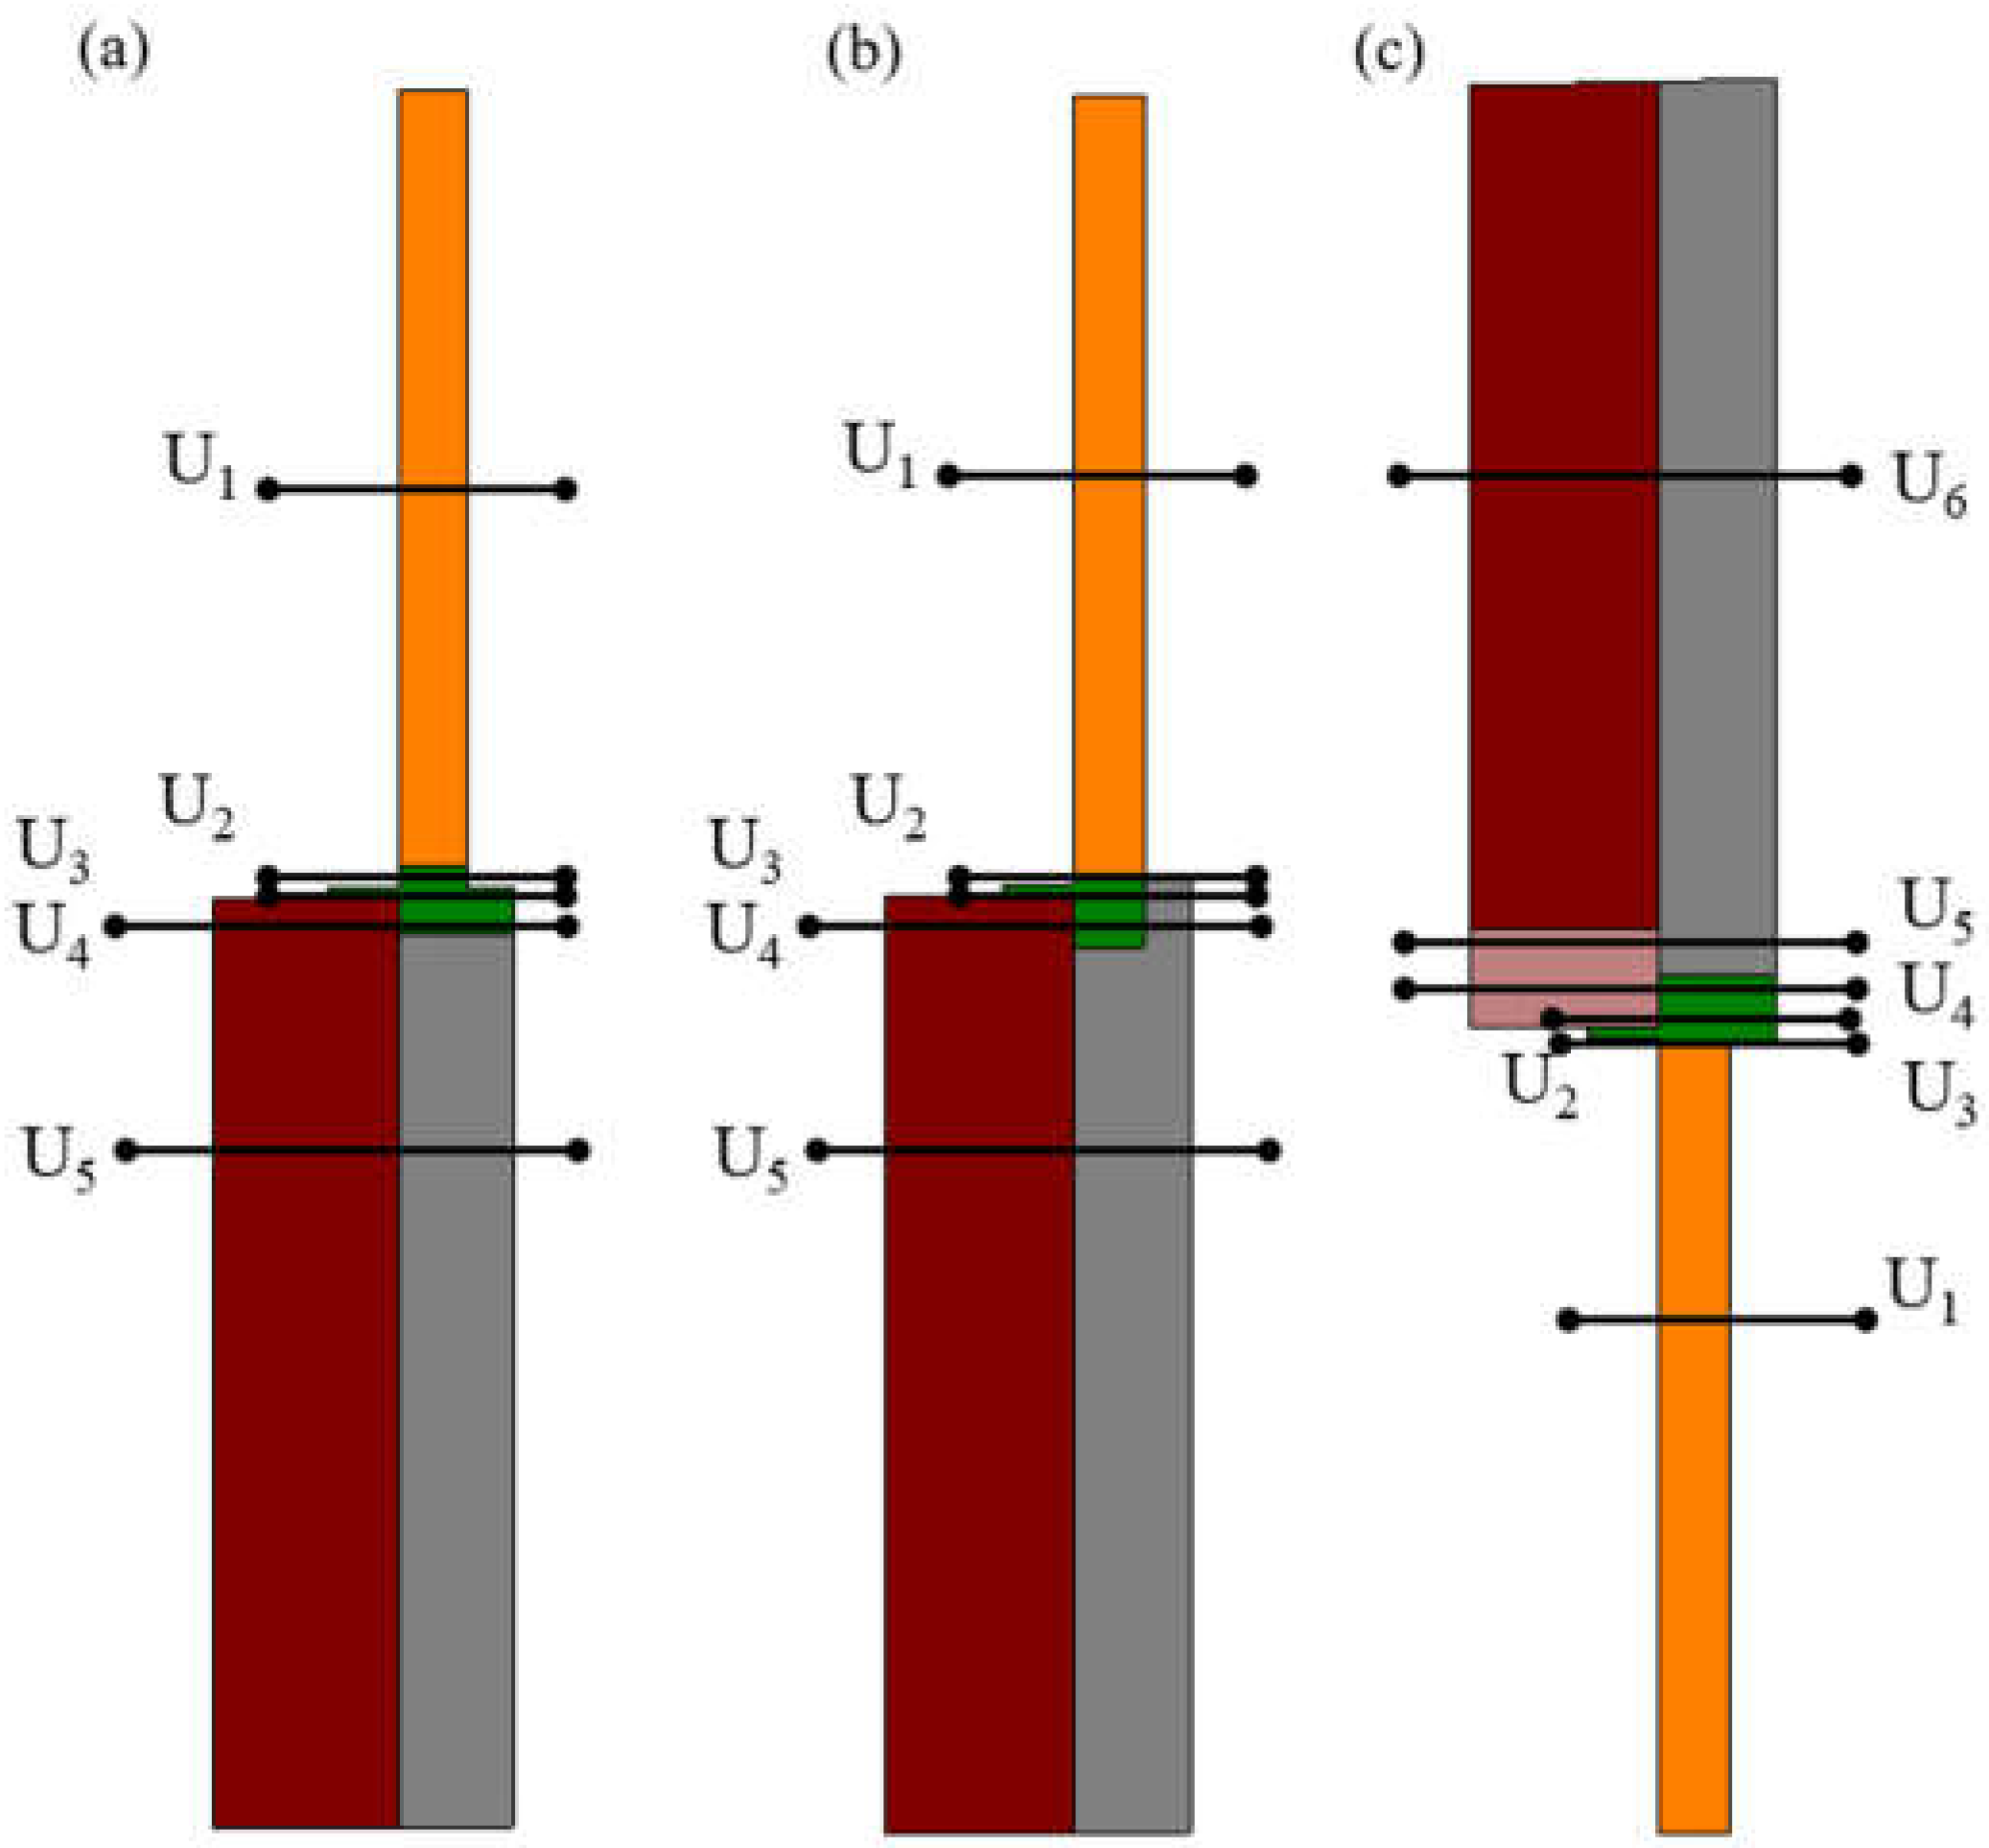
According to [37], the thermal calculations should also take into account the external wall composition and the values of the linear heat transmittance coefficient should be calculated for each section where it changes. The sections and the corresponding heat transfer coefficients Ui in the analysed numerical models are shown in Figure 6. A detailed description of the numerical models is provided in Section 5.2.
The guidelines of the Passive House Institute [33] as well as the PN-EN ISO 13788:2018 standard [38] indicate the need to verify whether there is a risk of mould and fungus growth in the area of the thermal bridges (hygiene criterion). To avoid it, the following condition must be met:
The temperature factor is determined according to Formula (4):
where:
fRsi—temperature factor at the internal surface [-],
Tsi,min—minimum interior surface temperature according to heat flow calculation [°C],
Te—outside temperature according to heat flow calculation [°C],
Ti—inside temperature according to heat flow calculation [°C].
On the other hand, the critical temperature factor fRsi(crit) can be defined in one of three ways:
- in a simplified way assuming room temperature Ti = 20 °C and humidity φ = 50%, fRsi(crit) = 0.72,
- in an exact way according to the procedure described in [38],
The quality of window installation can also be confirmed by the increase in the heat transfer coefficient ΔU (efficiency criterion) in the place of the thermal bridge at the interface between a wall and a window. According to [33] the heat transfer coefficient ΔU is calculated from Formula (5):
where:
∆U—increase in the heat transfer coefficient depending on the window installation [W/(m2·K)],
Ψinstall,i—linear heat transmittance coefficient of the respective installation situation [W/(m∙K)],
linstall,i—length of the relevant installation situation [m],
Aw—window area [m2]—the calculations were performed for the following window dimensions: 1.23 × 1.48 m.
The Passive House Institute recommends taking the efficiency criterion for the window installation system equal to ΔU = 0.05 W/(m2·K). According to the Institute recommendations [33], the heat transfer coefficient was calculated for the installed window as follows:
where:
Uinstalled—heat transfer coefficient of the installed window [W/(m2·K)],
Uw—heat transfer coefficient before installation [W/(m2·K)],
Ψinstall,i—linear heat transmittance coefficient of the respective installation situation [W/(m∙K)],
linstall,i—length of the respective installation situation [m],
Aw—window area [m2].
5.2. Calculation Variants
The numerical models developed to analyse and determine the best variant among the currently used window installation systems, consisted of the following parts:
- an external wall made of autoclaved aerated concrete blocks with conductivity coefficient λ = 0.22 W/(m∙K) and a thickness of 240 mm,
- polystyrene thermal insulation with conductivity coefficient λ = 0.036 W/(m∙K) and four thicknesses: 150, 200, 250 and 300 mm,
- two types of windows with heat transfer coefficients: Uw = 0.9 W/(m2∙K), λ = 0.096 W/(m∙K) for a standard window and Uw = 0.6 W/(m2∙K), λ = 0.06 W/(m∙K) for a passive window,
- a composite mounting frame with thermal conductivity coefficient λ = 0.02 W/(m∙K),
- a reinforced concrete lintel with thermal conductivity coefficient λ = 1.7 W/(m∙K).
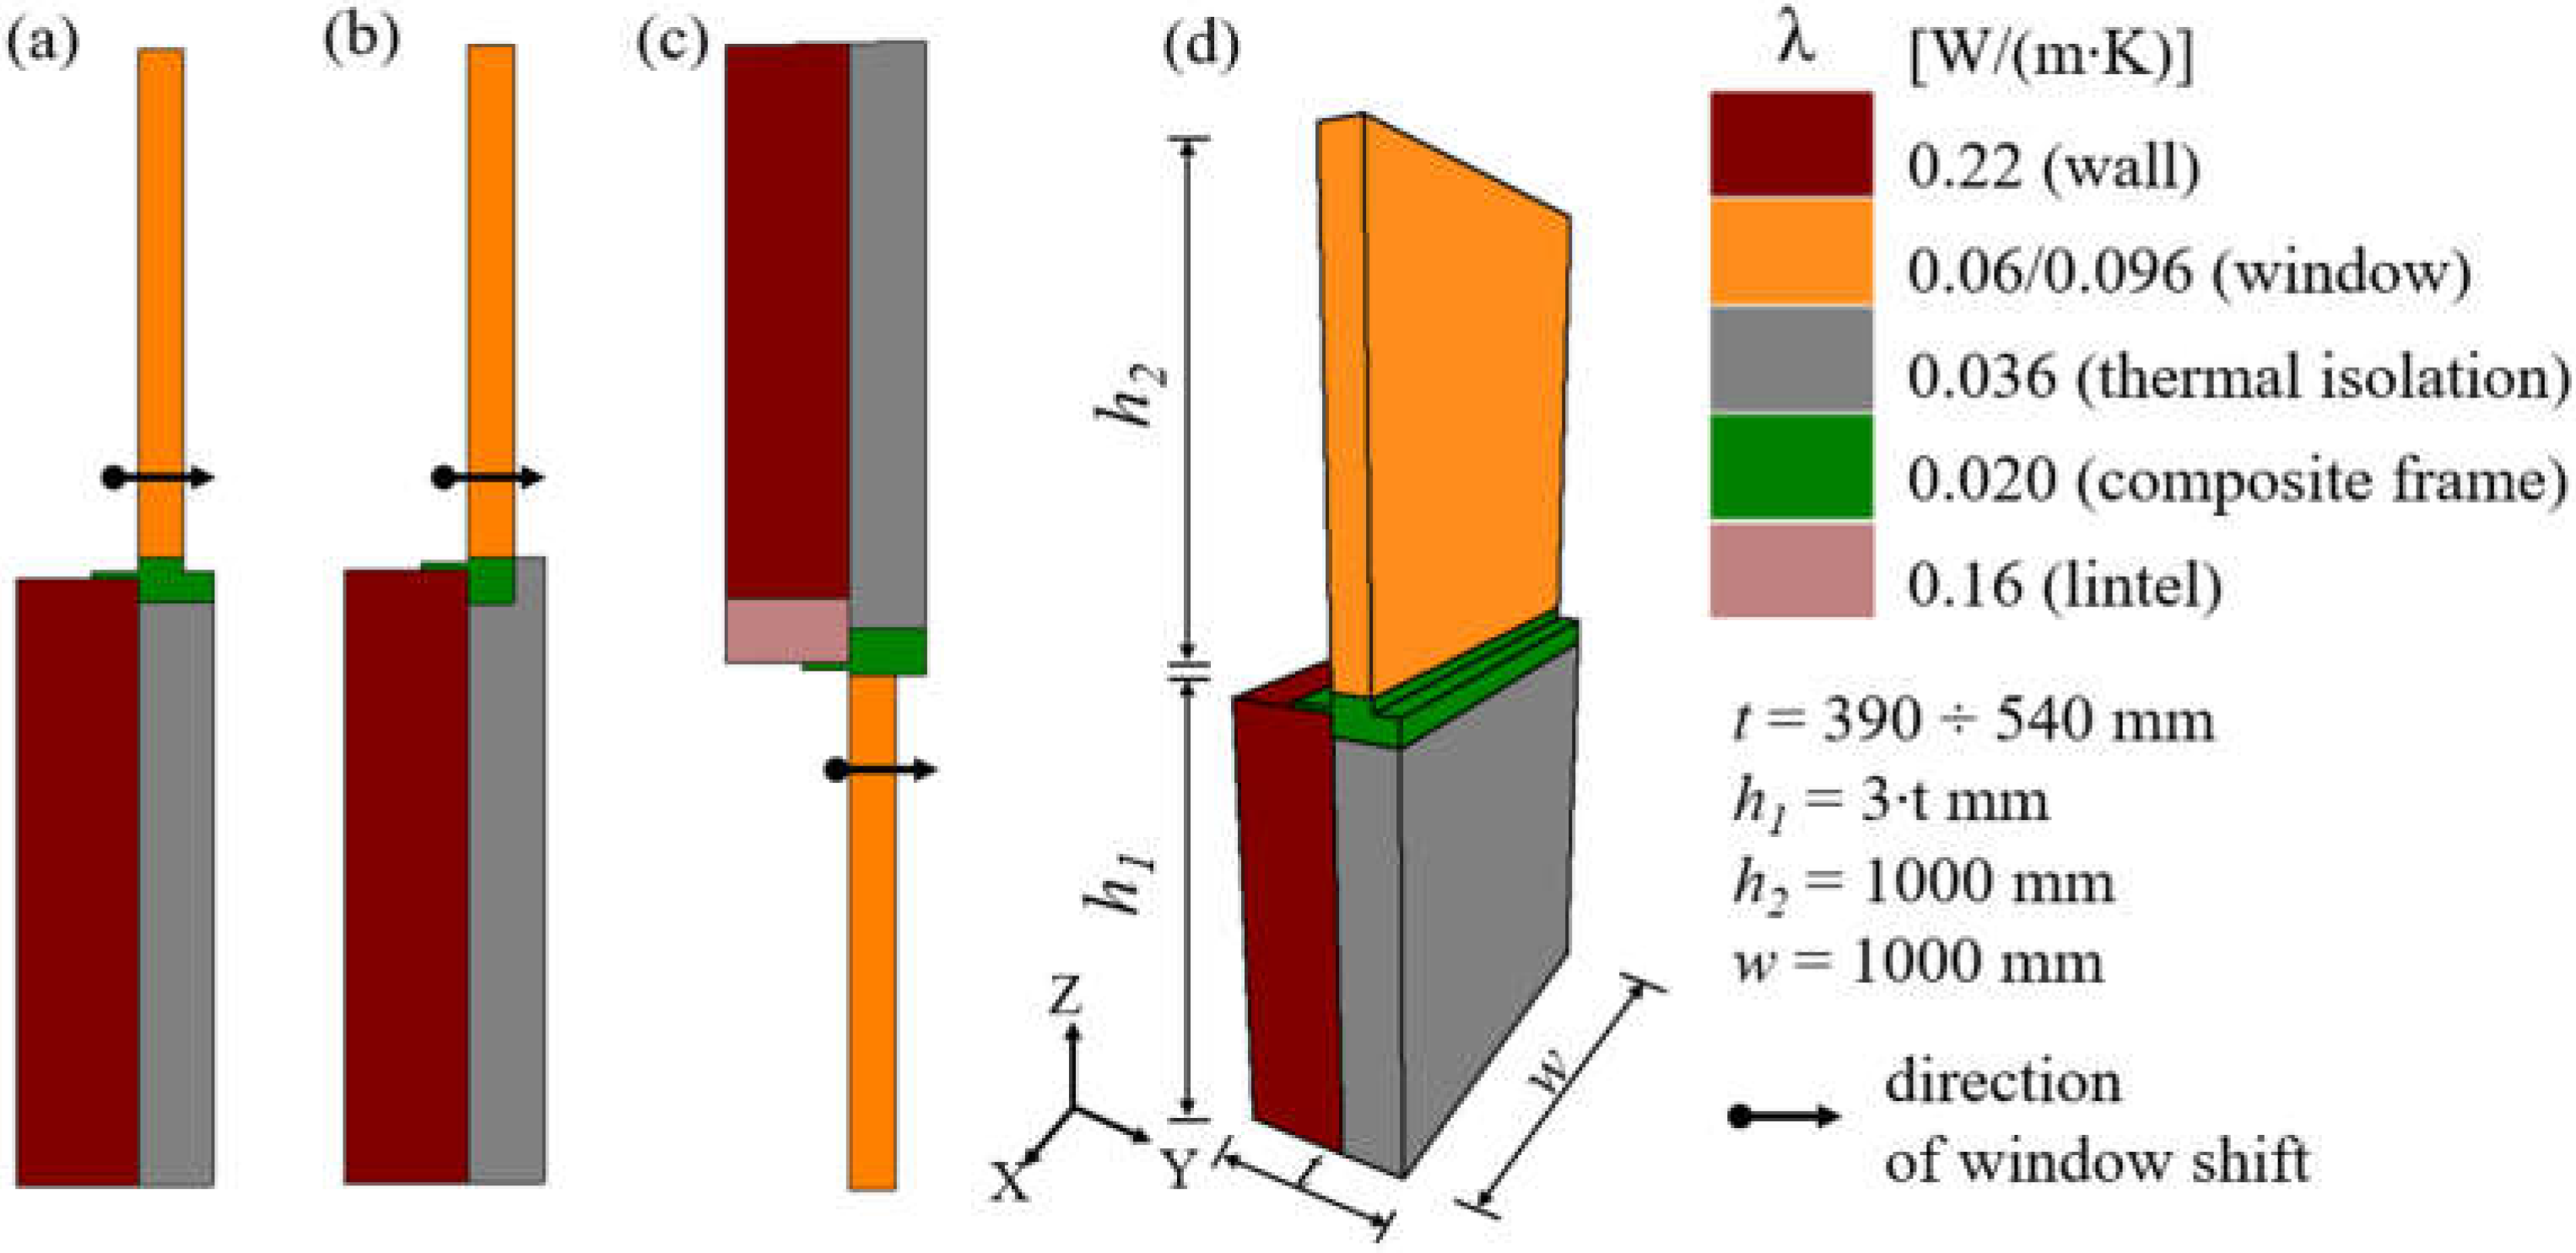
For each calculation variant, the impact of shifting the window relative to the thermal insulation layer was examined, starting from the position of the window flush aligned with the external face of the wall up to the window flush aligned with the external face of the insulation layer (Figure 7). It was assumed that the minimal wall height from the inside is h1= triple wall thicknesses [16] and the window length is h2 = 1000 mm. In the model, the wall had a width of w = 1000 mm. The wall thickness t changes depending on the adopted thermal insulation layer thickness. The model outline is presented in Figure 7.
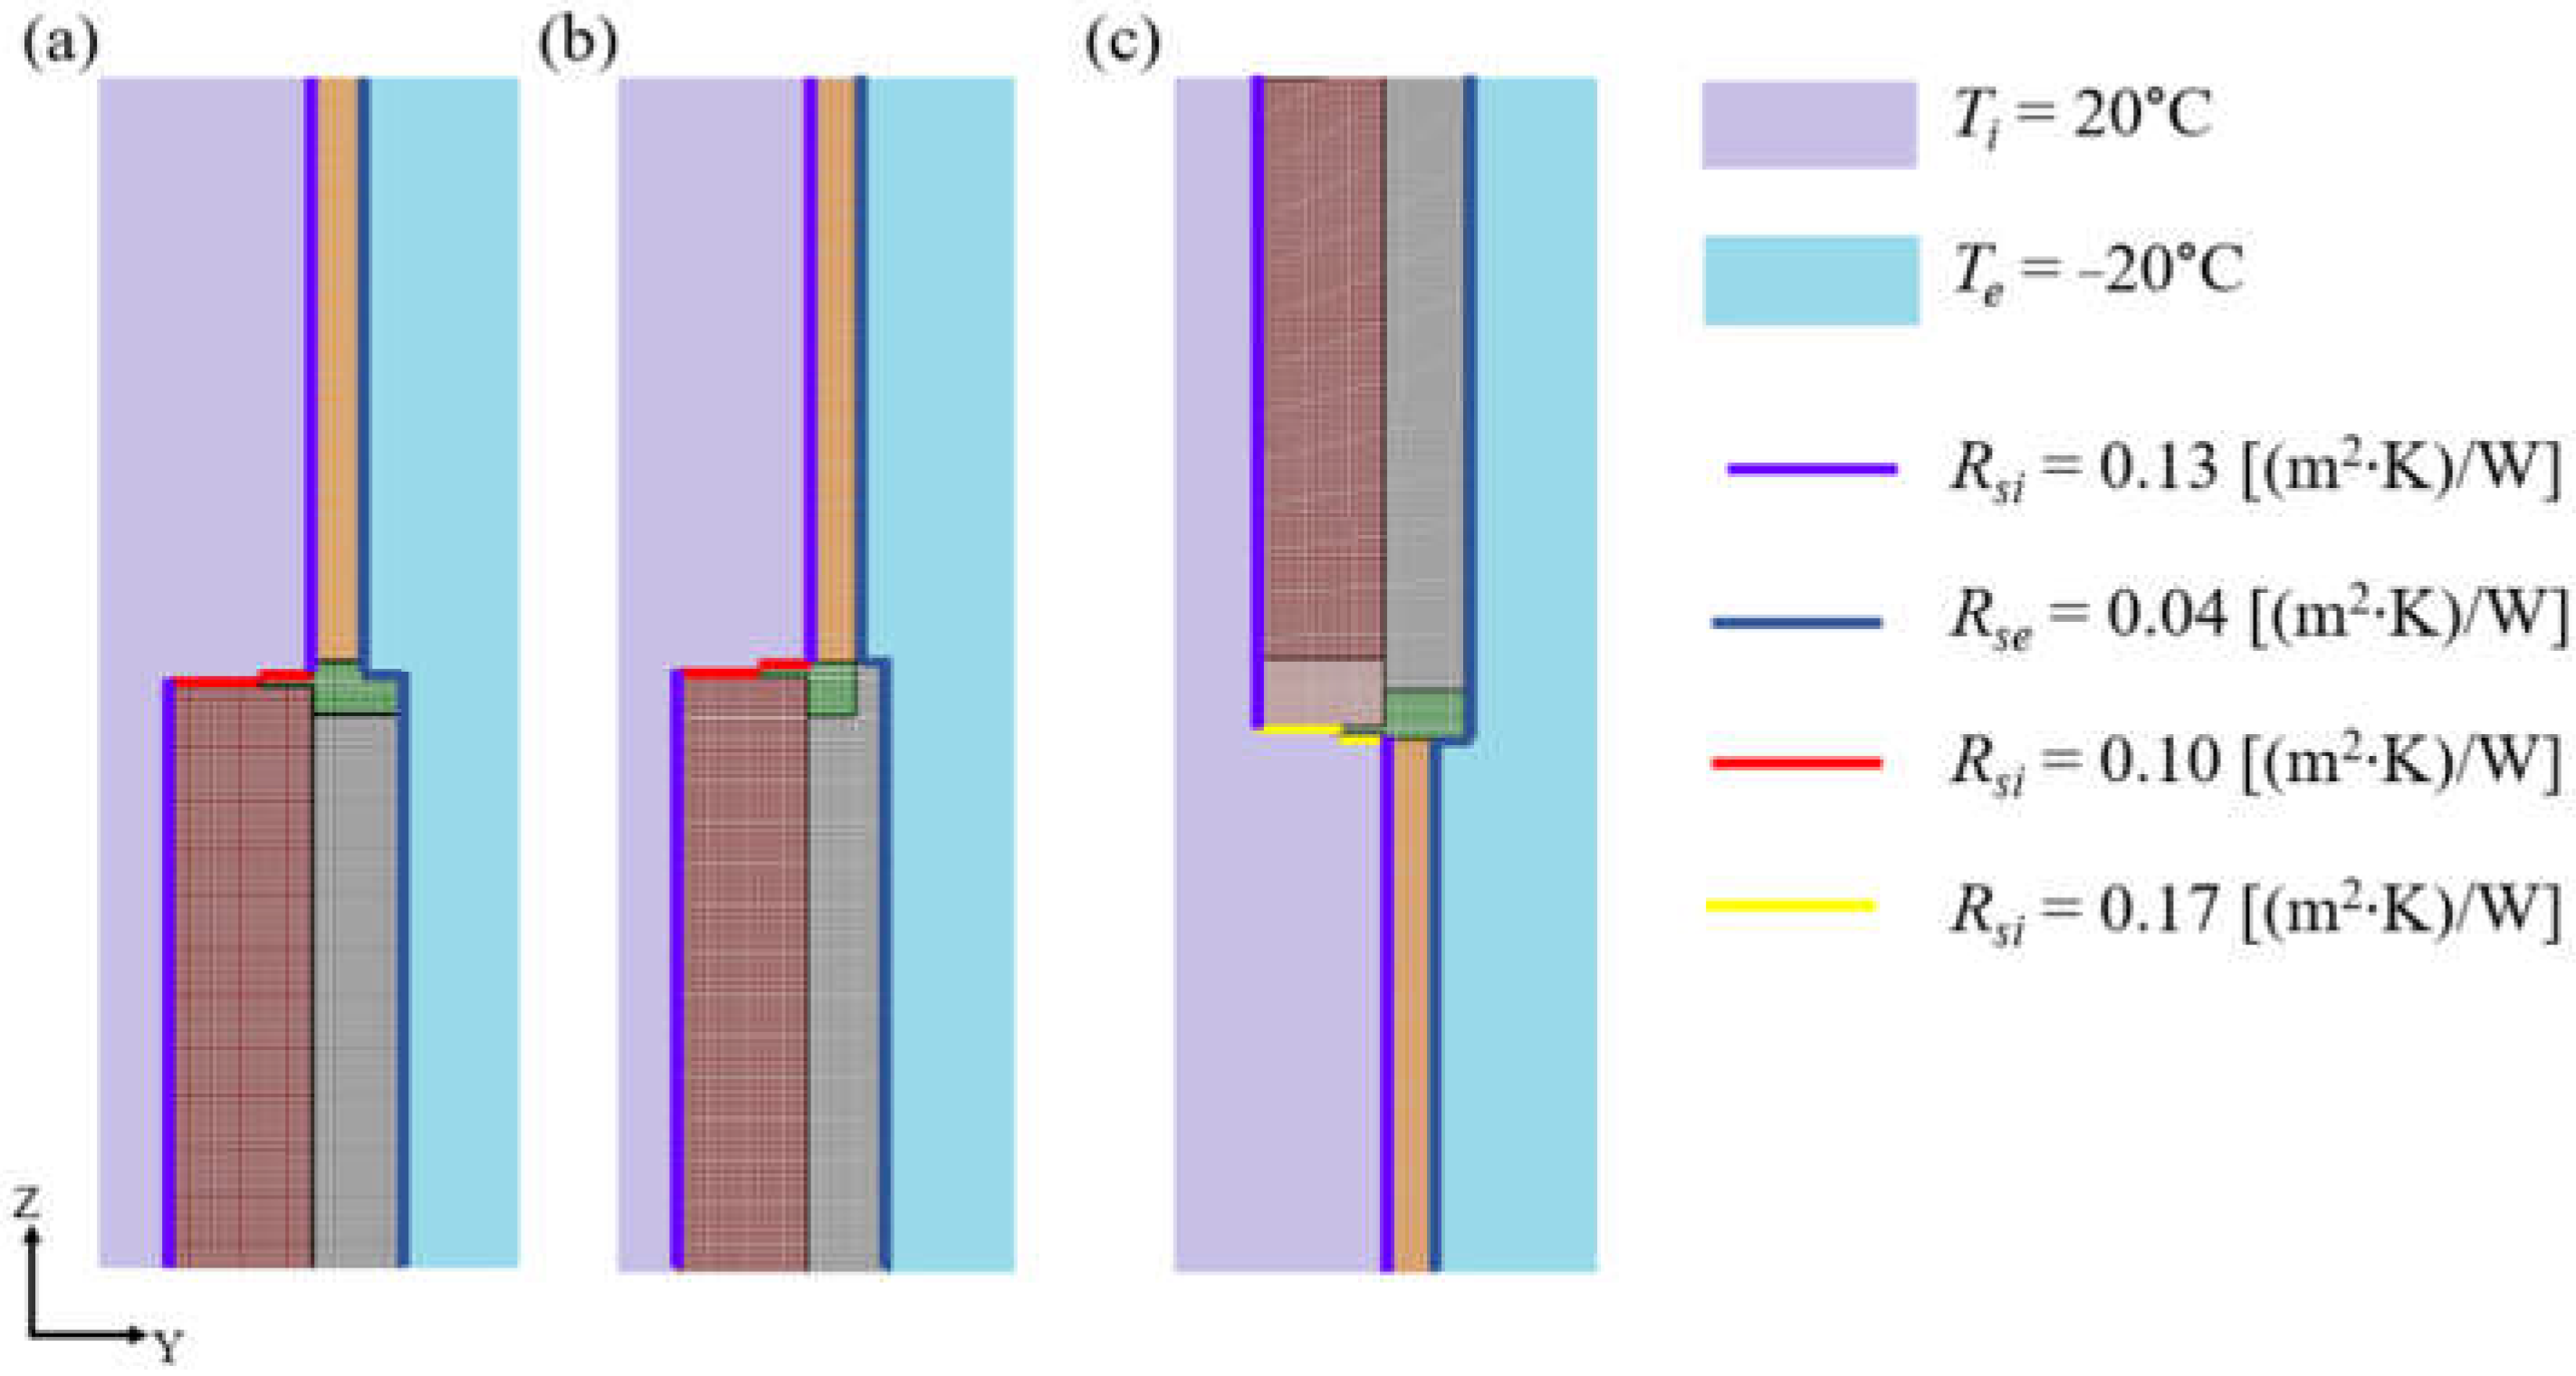
A 3D numerical analysis with steady-state heat flow was applied. The following boundary conditions were used: heat transfer resistances Rsi = 0.13 and Rse = 0.04 (m2∙K)/W for horizontal heat flow, Rsi = 0.10 (m2∙K)/W for upward and Rsi = 0.17 (m2∙K)/W for downward heat flow. The internal and external temperatures were assumed to be constant: Ti = 20 °C and Te = −20 °C. The wall and the mounting frame were modelled with hexahedral elements. In Figure 8, the materials and the surface boundary conditions are marked with different colours.
A system of linear equations was built based on the energy balance technique and solved using a fast iterative method. According to [35] potential non-linear problems were solved using different cycles of adjusted linear systems. In total, almost 350 variants were calculated for the three assembly sections. The numbering system was used whereby the three digits denote the cross-section, the thickness of the thermal insulation, and the window type respectively, (Figure 9).
5.3. Results and Discussion
The thermal and relative humidity parameters of the proposed installation system were analysed based on the numerical and analytical calculation results to verify whether this system met the efficiency and hygiene criterions required by the Passive House Institute. The obtained results were compared with the calculations performed for the conventional methods of installing windows using assembly foam.
5.3.1. Analysis of Temperature Parameters
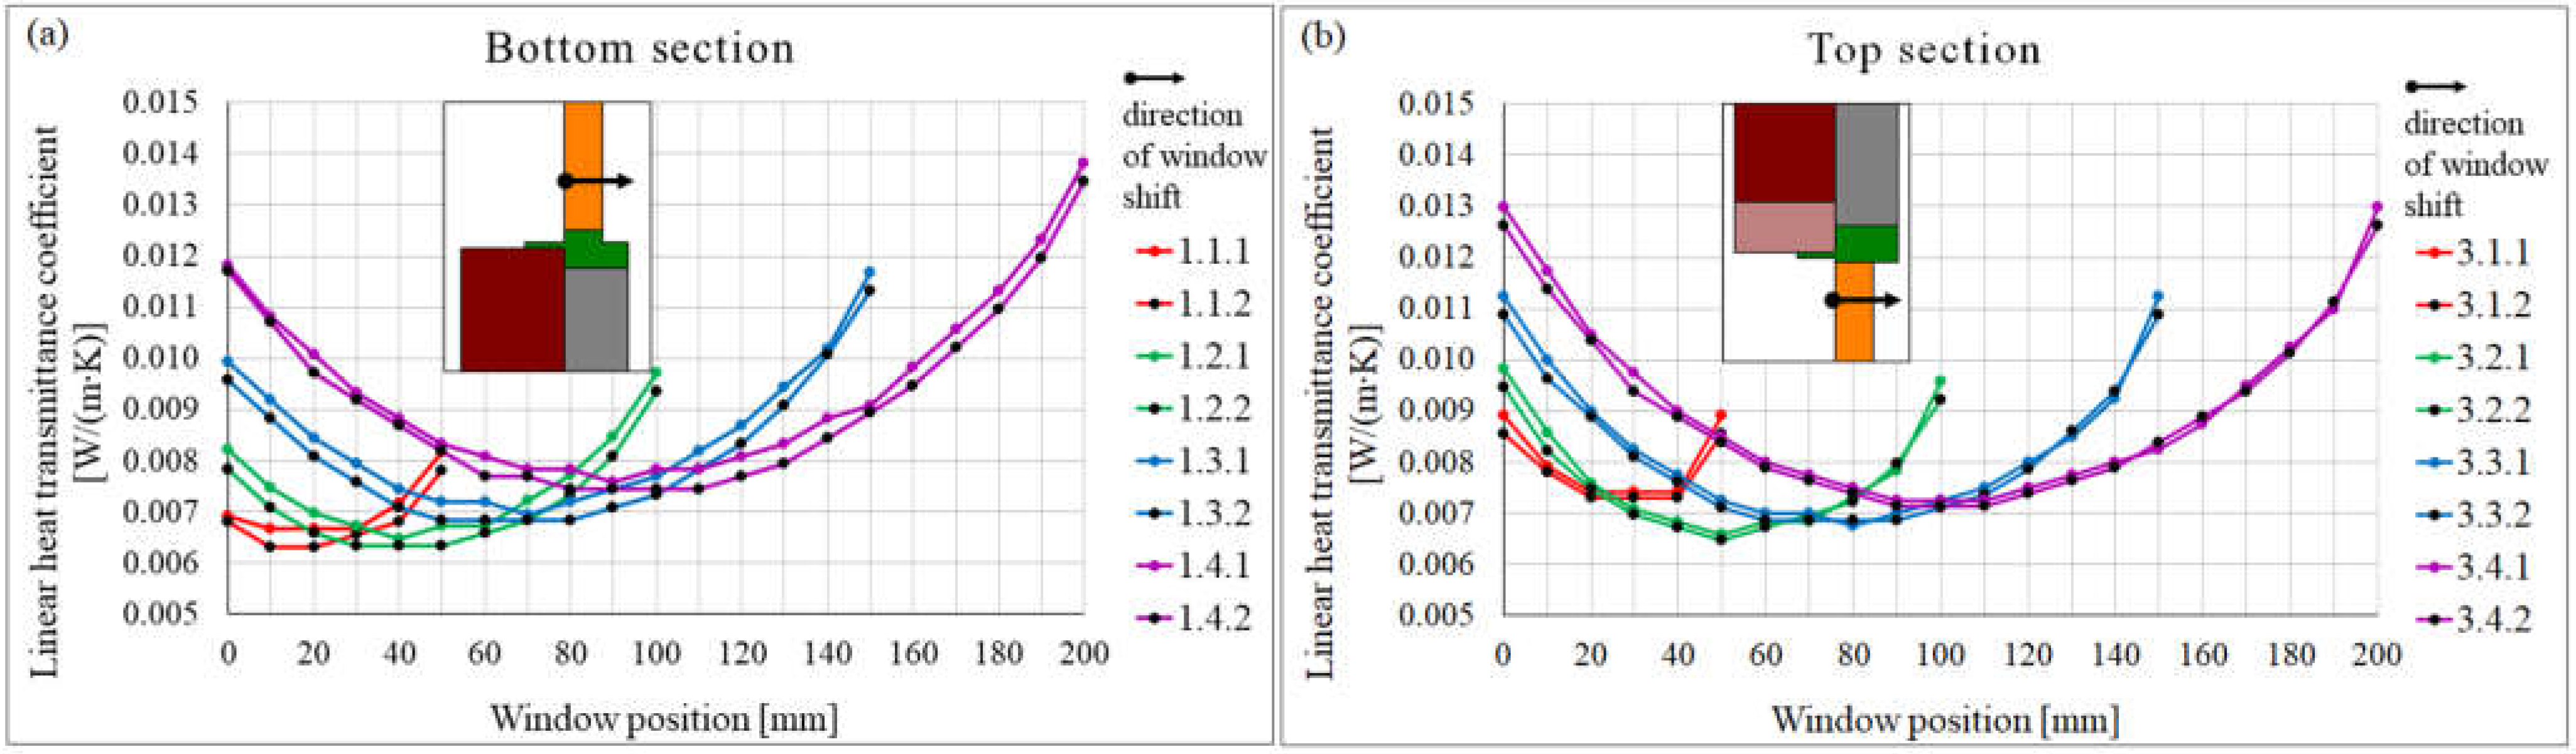
The change in the linear heat transmittance coefficient Ψ depending on the window shift relative to the external surface is presented in Figure 10, for example, for the bottom and top sections.
The results show that the linear heat transmittance coefficient Ψ changes as the window shifts relative to the wall face. The Ψ coefficient decreases as the window moves outwards, into the insulation layer, only up to a certain position. Further relocation causes the coefficient to grow again. When using 150- and 200-mm insulation layers, the optimal position of the window in the insulation layer is approximately 1/3 of the maximum possible shift of the window towards the outside. When using 250- and 300-mm insulation layers, this shift is about 1/2 of the possible window shift. Similar results were obtained for the side sections.
The window type has only a slight effect on the Ψ coefficient, especially for the side and top sections. For the bottom section, the average difference between the results for the window with a heat transfer coefficient of Uw = 0.9 W/(m2∙K) and Uw = 0.6 W/(m2∙K) was 0.0003 W/(m2∙K).
The lowest values of the linear heat transmittance coefficient Ψ were obtained for the wall with 150- and 200-mm thick layers of thermal insulation and the window with Uw = 0.6 W/(m2∙K), while the highest were for the wall with the 300 mm thick layer of thermal insulation and the window with Uw = 0.9 W/(m2∙K). The linear heat transmittance coefficient Ψ ranged within 0.006 to 0.015 W/(m∙K). Although the conclusion is that due to the linear bridges occurring at the window-to-wall interface, it is enough to use a layer of insulation with a thickness of 150 and 200 mm, it should be remembered that when designing walls, we cannot limit ourselves to the areas where the windows are installed. The heat loss over the entire wall area should be taken into account.
The Passive House Institute [33] assumes that the requirement of a “thermal-bridge-free design” for buildings with an ordinary geometry is met when:
The analysis of heat transfer showed that this requirement was fulfilled in over 80% of the analysed cases.
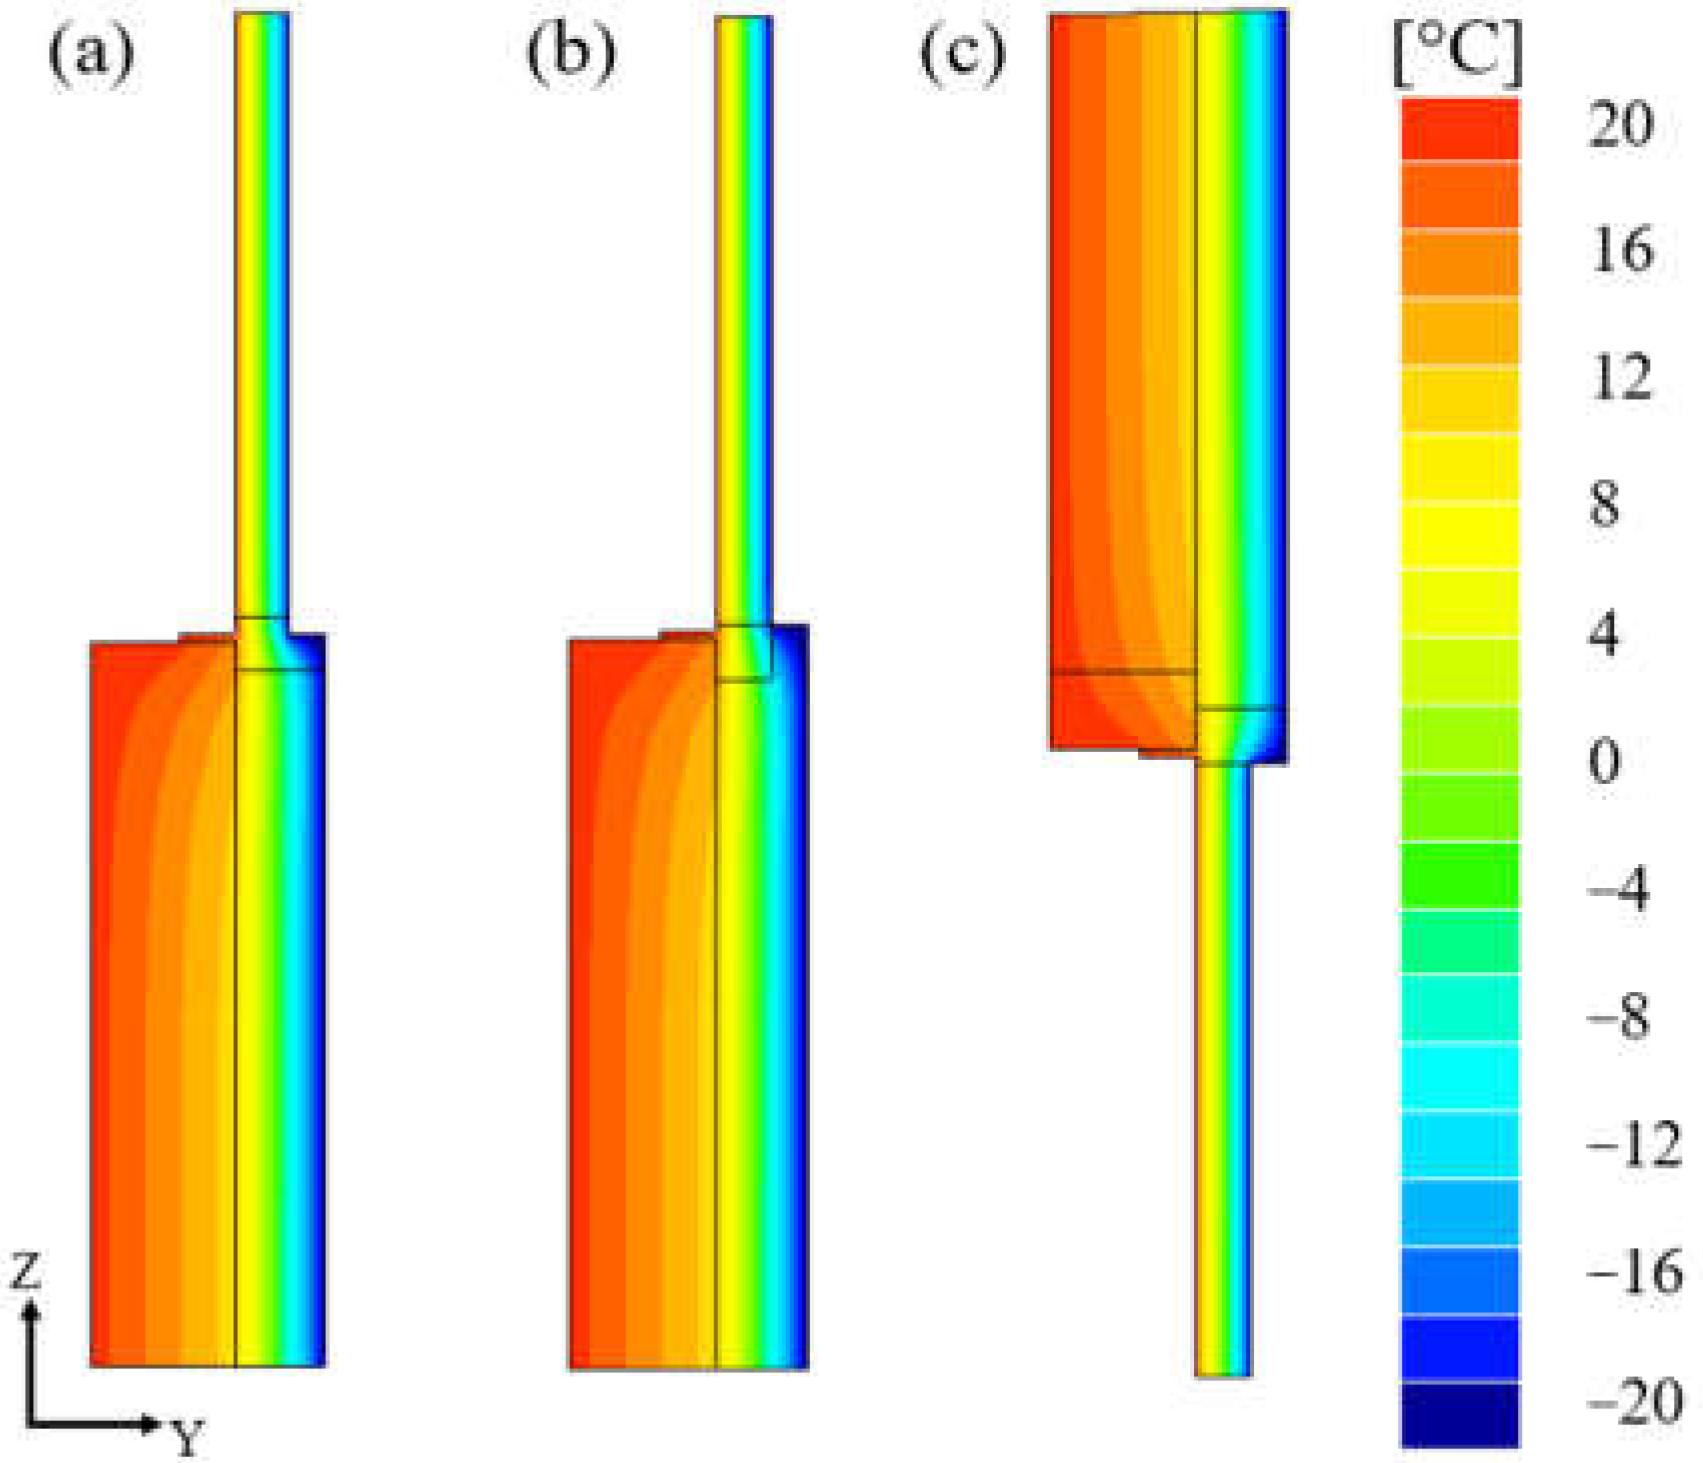
Figure 11 shows the temperature distribution for the bottom, side and top cross-sections for the wall with an insulation layer of 150 mm and window Uw = 0.9 W/(m2∙K), where the window flush was aligned with the face of the external wall.
The location of the window in the wall mainly affects the isotherms near the external part of the wall. The regions of non-linear heat flow with non-parallel isotherms are relatively small. Despite the differences in the sections of the assembly frame, the shape of the isotherms is similar. This means that around the window there are no places with a significantly reduced temperature, which could lead to condensation.
For all the analysed installation variants, the temperature factor fRsi was verified and the condition (3) was met, both when the critical temperature factor fRsi(crit) was equal to 0.72 and 0.75.
The heat transfer coefficient ΔU was calculated for 116 variants of the window installation. The window had dimensions of 1.23 × 1.48 m. In all cases, the calculated values were lower than the recommended value of 0.05 W/(m2·K) (see Equation (5)). The heat transfer coefficients Uinstalled were also calculated, as well as the percentage increase in the heat transfer coefficient of the window after installation relative to the non-installed window. The calculation results are presented in Table 1.
Considering the linear heat transmittance coefficient Ψ, the best results were obtained for the external wall with the 150 mm thick thermal insulation layer. With increase in the insulation thickness for both the analysed window types, the value of ΔU increases.
5.3.2. Comparison of Different Window Installation Systems
The analysed installation system was compared with the conventional installation of windows using assembly foam. The following installation variants were analysed:
- V1—installation system with composite sill beam and frame around the window,
- V2—installation of the window in the thermal insulation layer on the sill beam with insulation overlapping the window frame,
- V3—installation of the window flush aligned with the face of the wall using a foam assembly with an uninsulated frame,
- V4—installation of the window flush aligned with the face of the wall using a foam assembly with insulation overlapping the window frame,
- V5—installation of the window partly in the wall and partly in the thermal insulation layer using assembly foam and insulation overlapping the window frame.
For each analysed installation variant, the following data were assumed:
- external wall: autoclaved aerated concrete blocks, thickness: 240 mm, conductivity coefficient: λ = 0.22 W/(m∙K)
- insulation layer: styrofoam, thickness: 150 mm, conductivity coefficient: λ = 0.036 W/(m∙K)
- heat transfer coefficients of window: Uw = 0.9 W/(m2∙K)
- conductivity coefficient of assembly foam: λ = 0.035 W/(m∙K).
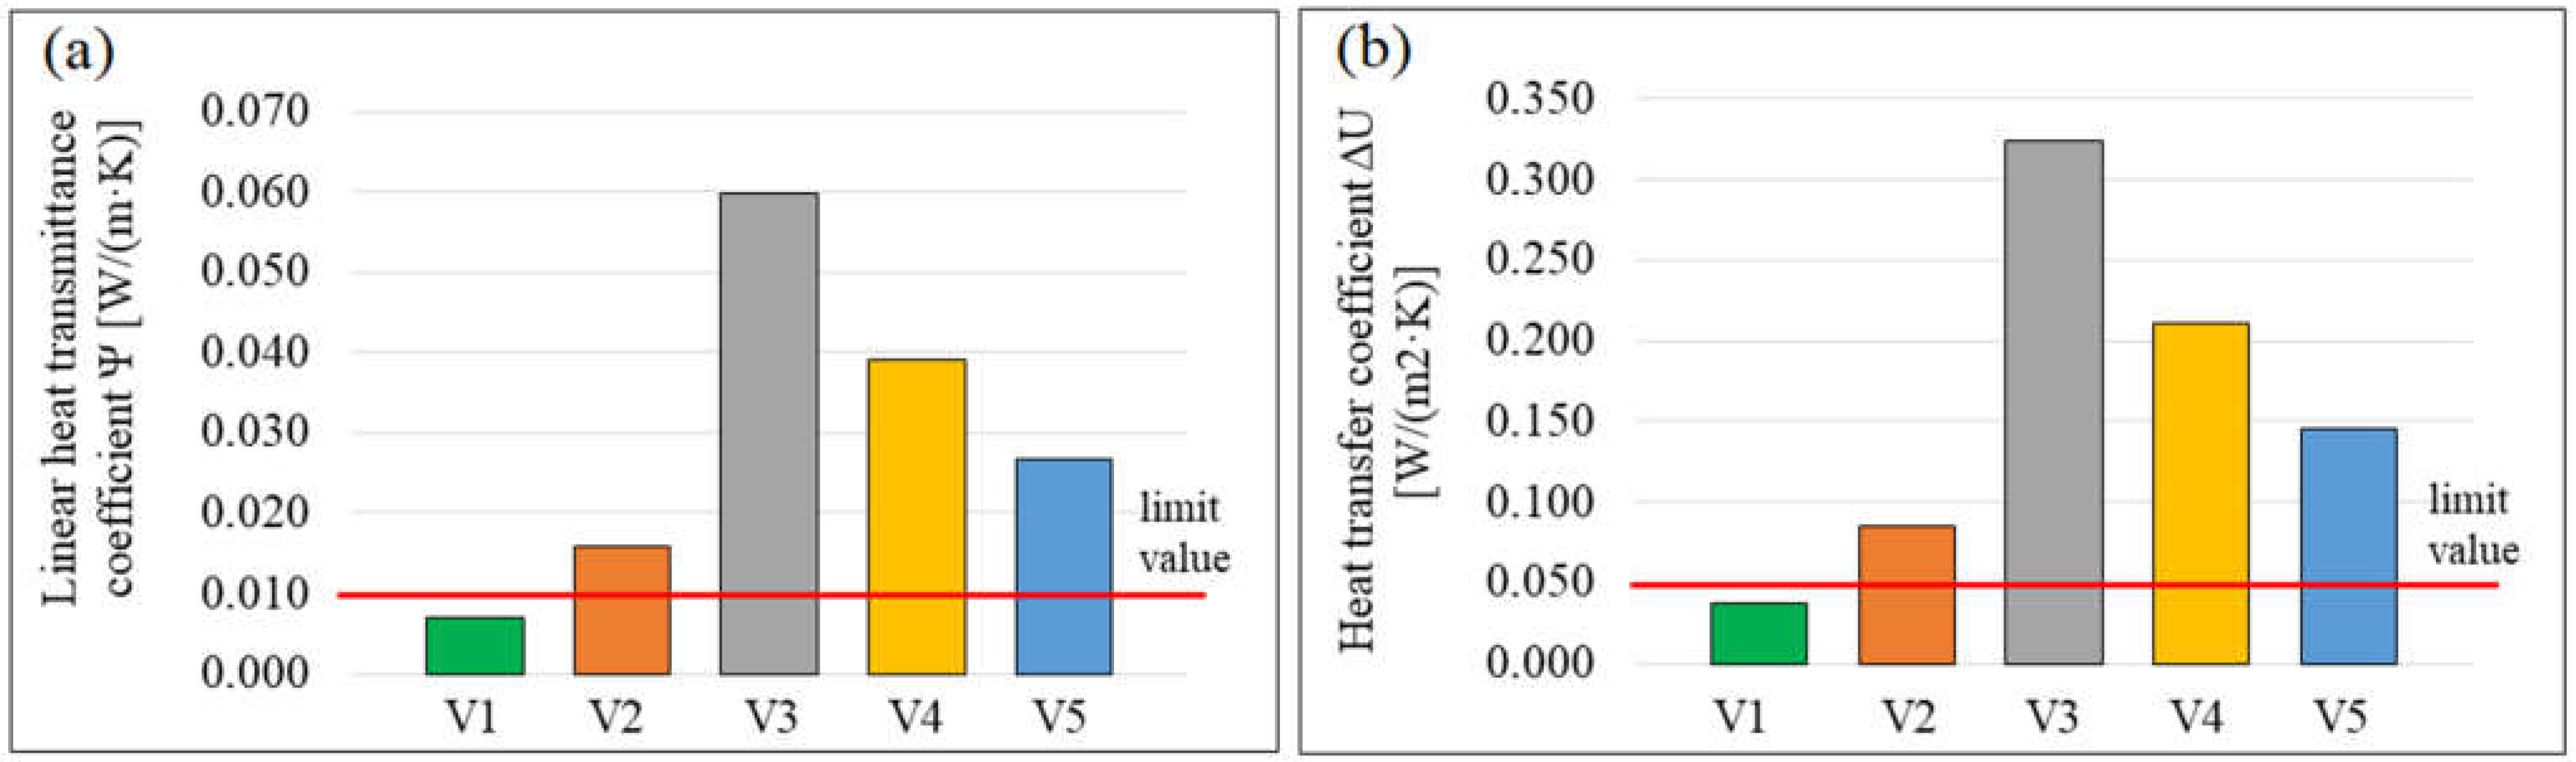
The calculation results for the individual installation variants are presented in Table 2 and Figure 12.
Among the analysed installation variants, the V1 variant exhibited the best hygrothermal parameters. This variant was the only one that met the requirements of the Passive House Institute. Compared to the conventional methods of window installation using mounting foam (V3, V4, V5), the linear heat transmittance coefficient Ψ was lower by approximately 88%, 82% and 74%, respectively, which means that heat losses due to the linear thermal bridges at the window-to-wall interface were about eight times lower for the V1 variant.
The installation of the window only on the composite sill beam (V2) allowed the heat transfer coefficient to be reduced compared to the V3, V4 and V5 variants by 73%, 59% and 41%, respectively. Installation of the window according to the V1 variant worsened the window parameter Uinstalled by only 4.5%, while the installation of windows with the assembly foam (V3 ÷ V5 variants) increased Uinstalled from 16.4% to 36.3%. Additionally, it should be noted that the mounting frame was more resistant to external factors (UV radiation, wind, moisture) than the mounting foam, as the properties of the latter tended to rapidly deteriorate.
6. Conclusions
Based on the performed analyses, it can be concluded that it is possible to eliminate the occurrence of linear thermal bridges at the window-to-wall interface (zero linear heat transmittance coefficient). The installation system proposed by the authors using the composite frame meets the efficiency and hygiene criteria required by the Passive House Institute. It was observed that:
- due to the linear heat transfer coefficient Ψ, a 150–200 mm thick insulation layer is sufficient, unless a thicker thermal insulation layer is required for other requirements for external walls;
- the windows thermal parameters do not have a significant influence on the heat loss at the window installation site, but the method of window installation (in the wall or in the insulation layer) has an impact on deterioration of the thermal properties of the windows; the Uw coefficient for the window after installation increases;
- considering the linear heat transmittance coefficient, there is an optimal position of window shift relative to the external face of the wall;
- in each of the analysed cases, there is no risk of mould or fungus growth on the inner surface of the window-to wall interface;
- the proposed installation system using a composite mounting frame, instead of mounting foam, results in almost eight times lower heat losses (occurring due to the linear thermal bridge at the window-to-wall interface).
Author Contributions
Conceptualization, J.A. and A.B.; methodology, M.P.; formal analysis, M.P.; investigation, J.A. and M.P.; resources, A.B.; writing—original draft preparation, M.P.; writing—review and editing, J.A.; supervision, J.A. All authors have read and agreed to the published version of the manuscript.
Funding
This research was funded by the Czestochowa University of Technology grant number PB-500-301/2022 WP 4.
Institutional Review Board Statement
Not applicable.
Informed Consent Statement
Not applicable.
Data Availability Statement
The data presented in this study are available on request from the corresponding author with the permission of Ergo Plus Poland LLC.
Conflicts of Interest
The authors declare no conflict of interest.
References
- Publications Office of the European Union. EU Energy in Figures: Statistical Pocketbook 2020. Available online: http://op.europa.eu/en/publication-detail/-/publication/87b16988-f740-11ea-991b-01aa75ed71a1/language-en (accessed on 15 September 2021).
- Guohui, F.; Sha, S.; Xu, X. Analysis of the Building Envelope Influence to Building Energy Consumption in the Cold Regions. Procedia Eng. 2016, 146, 244–250. [Google Scholar] [CrossRef] [Green Version]
- Nardi, I.; Lucchi, E.; de Rubeis, T.; Ambrosini, D. Quantification of heat energy losses through the building envelope: A state-of-the-art analysis with critical and comprehensive review on infrared thermography. Build. Environ. 2018, 146, 190–205. [Google Scholar] [CrossRef] [Green Version]
- Najjar, M.K.; Figueiredo, K.; Hammad, A.W.A.; Tam, V.W.Y.; Evangelista, A.C.J.; Haddad, A. A framework to estimate heat energy loss in building operation. J. Clean. Prod. 2019, 235, 789–800. [Google Scholar] [CrossRef]
- Lu, J.; Xue, Y.; Wang, Z.; Fan, Y. Optimized mitigation of heat loss by avoiding wall-to-floor thermal bridges in reinforced concrete buildings. J. Build. Eng. 2020, 30, 101214. [Google Scholar] [CrossRef]
- Liu, X.; Chen, Y.; Ge, H.; Fazio, P.; Chen, G. Numerical investigation for thermal performance of exterior walls of residential buildings with moisture transfer in hot summer and cold winter zone of China. Energy Build. 2015, 93, 259–268. [Google Scholar] [CrossRef]
- Alzetto, F.; Pandraud, G.; Fitton, R.; Heusler, I.; Sinnesbichler, H. QUB: A fast dynamic method for in-situ measurement of the whole building heat loss. Energy Build. 2018, 174, 124–133. [Google Scholar] [CrossRef]
- Arıcı, M.; Karabay, H.; Kan, M. Flow and heat transfer in double, triple and quadruple pane windows. Energy Build. 2015, 86, 394–402. [Google Scholar] [CrossRef]
- Hołownia, P. The influence of three-dimensional thermal bridges on the basic physical parameters of one-layer external. Tech. Trans. Civil. Eng. 2007, 104, 83–90. [Google Scholar]
- Hoła, A. Methodology for the In Situ testing of the moisture content of brick walls: An example of application. Arch. Civ. Mech. Eng. 2020, 20, 114. [Google Scholar] [CrossRef]
- Ujma, A.; Kysiak, A. Diagnostics of structural elements of buildings using a thermal camera. Constr. Optim. Energy Potential. 2018, 2015, 182–190. [Google Scholar]
- Housing, B.C. Building Envelope Thermal Bridging Guide. Available online: https://www.bchousing.org/research-centre/library/residential-design-construction/building-envelope-thermal-bridging-guide (accessed on 15 September 2021).
- Isover, Catalog of Thermal Bridges. Available online: https://www.isover.com/ (accessed on 16 September 2021).
- The Passive House Institute (PHI). Thermal Bridges Catalogue. Available online: http://www.sinfonia-smartcities.eu/en/knowledge-center/thermal-bridges-catalogue (accessed on 16 September 2021).
- PN-EN ISO 14683:2017; Thermal Bridges in Building Construction—Linear Thermal Transmittance—Simplified Methods and Default Values. European Committee for Standardization: Brussels, Belgium, 2017.
- PN-EN ISO 10211:2017; Thermal Bridges in Building Construction—Heat Flows and Surface Temperatures—Detailed Calculations. European Committee for Standardization: Brussels, Belgium, 2017.
- Pawłowski, K. Design of the Walls in Energy-Efficient Construction; Medium Group: Warsaw, Poland, 2017. (In Polish) [Google Scholar]
- Martin, K.; Erkoreka, A.; Flores, I.; Odriozola, M.; Sala, J.M. Problems in the calculation of thermal bridges in dynamic conditions. Energy Build. 2011, 43, 529–535. [Google Scholar] [CrossRef]
- Viot, H.; Sempey, A.; Pauly, M.; Mora, L. Comparison of different methods for calculating thermal bridges: Application to wood-frame buildings. Build. Environ. 2015, 93, 339–348. [Google Scholar] [CrossRef]
- Ascione, F.; Bianco, N.; De Masi, R.F.; Mauro, G.M.; Musto, M.; Vanoli, G.P. Experimental validation of a numerical code by thin film heat flux sensors for the resolution of thermal bridges in dynamic conditions. Appl. Energy 2014, 124, 213–222. [Google Scholar] [CrossRef]
- Taoum, S.; Lefrançois, E. Dual analysis for heat exchange: Application to thermal bridges. Comput. Math. Appl. 2018, 75, 3471–3487. [Google Scholar] [CrossRef]
- Zalewski, L.; Lassue, S.; Rousse, D.; Boukhalfa, K. Experimental and numerical characterization of thermal bridges in prefabricated building walls. Energy Convers. Manag. 2010, 51, 2869–2877. [Google Scholar] [CrossRef]
- O’Grady, M.; Lechowska, A.A.; Harte, A.M. Application of infrared thermography technique to the thermal assessment of multiple thermal bridges and windows. Energy Build. 2018, 168, 347–362. [Google Scholar] [CrossRef] [Green Version]
- Cappelletti, F.; Gasparella, A.; Romagnoni, P.; Baggio, P. Analysis of the influence of installation thermal bridges on windows performance. Energy Build. 2011, 43, 1435–1442. [Google Scholar] [CrossRef]
- Misiopecki, C.; Bouquin, M.; Gustavsen, A.; Jelle, B.P. Thermal modeling and investigation of the most energy-efficient window position. Energy Build. 2018, 158, 1079–1086. [Google Scholar] [CrossRef]
- Sierra, F.; Gething, B.; Bai, J.; Maksoud, T. Impact of the position of the window in the reveal of a cavity wall on the heat loss and the internal surface temperature of the head of an opening with a steel lintel. Energy Build. 2017, 142, 23–30. [Google Scholar] [CrossRef]
- Pawłowski, K.; Krajewska, M. The thermal quality of housing elements and energy consumption of low-energy buildings—Selected aspects. Constr. Optim. Energy Potential. 2019, 2, 27–35. [Google Scholar] [CrossRef]
- Van Den Bossche, N.; Huyghe, W.; Moens, J.; Janssens, A.; Depaepe, M. Airtightness of the window-wall interface in cavity brick walls. Energy Build. 2012, 45, 32–42. [Google Scholar] [CrossRef]
- Van Linden, S.; Van Den Bossche, N. Watertightness performance of face-sealed versus drained window-wall interfaces. Build. Environ. 2021, 196, 107824. [Google Scholar] [CrossRef]
- Konstantinov, A.; Safiullov, T. Energy-efficient installation of windows in multi-storey residential buildings. IOP Conf. Ser. Mater. Sci. Eng. 2018, 365, 022017. [Google Scholar] [CrossRef]
- Adamus, J.; Pomada, M. Analysis of heat flow in composite structures used in window installation. Compos. Struct. 2018, 202, 127–135. [Google Scholar] [CrossRef]
- Adamus, J.; Pomada, M. Selected issues of choosing composite materials for window supporting beams. J. Build. Eng. 2020, 32, 101542. [Google Scholar] [CrossRef]
- The Passive House Institute, Information, Criteria and Algorithms for Certified Passive House Components: Sun Protection and Window Installation Systems, September 2021. Available online: https://passiv.de/downloads/03_certification_criteria_window-installation-system.pdf (accessed on 9 October 2021).
- Ergo Plus Poland LCC. Set of Assembly Profiles and Elements of the Windows, Doors or Facade Frames and Method for Assembling of Windows, Doors and Facades. Patent Number Pat.236131, 14 December 2020. Available online: https://api-ewyszukiwarka.pue.uprp.gov.pl/api/collection/d71d7b21d5b4830a3d1fde9018f0a0d3 (accessed on 21 May 2022). (In Polish).
- Manual of TRISCO Program: Steady-State Thermal Simulation of 2D & 3D. Available online: https://www.physibel.be/en/products/trisco (accessed on 9 October 2021).
- Ergo Plus Poland. Available online: https://ergoplus.pl/ (accessed on 9 October 2021).
- PN-EN 12831-1:2017; Energy Performance of Buildings—Method for Calculation of the Design Heat Load—Part 1: Space Heating Load, Module M3-3. European Committee for Standardization: Brussels, Belgium, 2017.
- PN-EN ISO 13788:2013; Hygrothermal Performance of Building Components and Building Elements—Internal Surface Temperature to Avoid Critical Surface Humidity and Interstitial Condensation—Calculation Methods. European Committee for Standardization: Brussels, Belgium, 2013.
Figure 1.
Diagram of analysed sections of the window installation system: i—internal, e—external.

Figure 2.
Analysed installation system: (a) components of the installation system; (b) dimensions of the window mounting space [36].
Figure 2.
Analysed installation system: (a) components of the installation system; (b) dimensions of the window mounting space [36].

Figure 3.
Test stand and numerical models for bottom sections of windows installed in (a) a conventional way and (b) using a composite frame: P1.1 ÷ 5 and P2.1 ÷ 5—measurement points in wall, N1.1 ÷ −5 and N2.1 ÷ −5—corresponding numerical nodes (i—internal, e—external).
Figure 3.
Test stand and numerical models for bottom sections of windows installed in (a) a conventional way and (b) using a composite frame: P1.1 ÷ 5 and P2.1 ÷ 5—measurement points in wall, N1.1 ÷ −5 and N2.1 ÷ −5—corresponding numerical nodes (i—internal, e—external).

Figure 4.
Temperature distribution in external wall (for bottom section) with window installed (a) in conventional way, (b) using composite frame (i—internal, e—external).
Figure 4.
Temperature distribution in external wall (for bottom section) with window installed (a) in conventional way, (b) using composite frame (i—internal, e—external).

Figure 5.
Temperature vs. time for bottom sections of windows installed in external wall: (a) in conventional way, (b) using composite frame. Points P1.1 ÷ P2.5—experimental results, nodes N1.1 ÷ N2.5—numerical results.
Figure 5.
Temperature vs. time for bottom sections of windows installed in external wall: (a) in conventional way, (b) using composite frame. Points P1.1 ÷ P2.5—experimental results, nodes N1.1 ÷ N2.5—numerical results.

Figure 6.
Heat transfer coefficient Ui in wall sections: (a) bottom, (b) side, (c) top.

Figure 7.
The model outline for cross-sections: (a) bottom, (b) side, (c) top, (d) wall dimensions.

Figure 8.
Numerical model and boundary conditions for cross-sections: (a) bottom, (b) side, (c) top.
Figure 8.
Numerical model and boundary conditions for cross-sections: (a) bottom, (b) side, (c) top.

Figure 9.
Numbering system for calculation variants.

Figure 10.
Linear heat transmittance coefficient for: (a) bottom, (b) top section—numerical calculation results.
Figure 10.
Linear heat transmittance coefficient for: (a) bottom, (b) top section—numerical calculation results.

Figure 11.
Sample temperature distribution, wall sections for model 1.1.1: (a) bottom, (b) side, (c) top.
Figure 11.
Sample temperature distribution, wall sections for model 1.1.1: (a) bottom, (b) side, (c) top.

Figure 12.
Comparison of: (a) linear heat transmittance coefficient Ψ, (b) heat transfer coefficient ΔU.
Figure 12.
Comparison of: (a) linear heat transmittance coefficient Ψ, (b) heat transfer coefficient ΔU.


Table 1.
Results of efficiency criterion.
| Heat Transfer Coefficient ΔU [W/(m2·K)] | ||||||||
|---|---|---|---|---|---|---|---|---|
| Isolating layer thickness [mm] | 150 | 150 | 200 | 200 | 250 | 250 | 300 | 300 |
| Window Uw [W/(m2·K)] | 0.9 | 0.6 | 0.9 | 0.6 | 0.9 | 0.6 | 0.9 | 0.6 |
| Average ΔU [W/(m2·K)] | 0.0213 | 0.0208 | 0.0221 | 0.0217 | 0.0248 | 0.0244 | 0.0279 | 0.0275 |
| Average percentage increase in Uinstalled [%] | 2.4 | 3.5 | 2.5 | 3.6 | 2.8 | 4.1 | 3.1 | 4.6 |
Table 2.
Comparison of thermal parameters of analysed variants of window installation.
| Variants of Window Installation | |||||
|---|---|---|---|---|---|
| V1 | V2 | V3 | V4 | V5 | |
| Installation scheme |  |  |  |  |  |
| Ψinstall [W/(m·K)] | 0.007 | 0.016 | 0.060 | 0.039 | 0.027 |
| fRsi [-] | 0.965 | 0.963 | 0.873 | 0.911 | 0.920 |
| ∆U [W/(m2·K)] | 0.038 | 0.085 | 0.324 | 0.211 | 0.145 |
| Uinstalled [W/(m2·K)] | 0.941 | 0.988 | 1.227 | 1.114 | 1.048 |
| Average percentage increase in Uinstalled [%] | 4.5 | 9.8 | 36.3 | 23.8 | 16.4 |
| Temperature distribution |  |  |  |  |  |
Publisher’s Note: MDPI stays neutral with regard to jurisdictional claims in published maps and institutional affiliations. |
© 2022 by the authors. Licensee MDPI, Basel, Switzerland. This article is an open access article distributed under the terms and conditions of the Creative Commons Attribution (CC BY) license (https://creativecommons.org/licenses/by/4.0/).
Share and Cite
MDPI and ACS Style
Pomada, M.; Adamus, J.; Boruszewski, A. Numerical and Experimental Analysis of Heat Flow at Window-to-Wall Interface. Energies 2022, 15, 3837. https://0-doi-org.brum.beds.ac.uk/10.3390/en15103837
AMA Style
Pomada M, Adamus J, Boruszewski A. Numerical and Experimental Analysis of Heat Flow at Window-to-Wall Interface. Energies. 2022; 15(10):3837. https://0-doi-org.brum.beds.ac.uk/10.3390/en15103837
Chicago/Turabian StylePomada, Marta, Janina Adamus, and Artur Boruszewski. 2022. "Numerical and Experimental Analysis of Heat Flow at Window-to-Wall Interface" Energies 15, no. 10: 3837. https://0-doi-org.brum.beds.ac.uk/10.3390/en15103837
Note that from the first issue of 2016, this journal uses article numbers instead of page numbers. See further details here.