1. Introduction
The development of renewable energy is becoming an urgent issue as global warming is accelerated due to resource depletion and environmental pollution. Geothermal energy, which is one of the renewable energy sources recently receiving attention, can be used to run an energy saving cooling and heating system. The system is called the geothermal energy heat pump system. The geothermal heat pump system has high capability of utilization in both the summer and winter. Its annual cost of maintenance is low compared to present cooling and heating apparatus. It is also environmentally friendly as it emits less household gases such as CO2. However, despite these benefits, various limits are involved in the ground heat exchanger installation site and the initial installation cost.
On the other hand, the air source heat pump, which can perform heating and cooling alternatively with a simple directional diverter valve, is acknowledged as a typical energy saving device and is widely used in leading countries. Ground heat, which is used as the heat source for the heat pump, is superior to other heat sources in its ease of applicability and lower maintenance cost. However, the weakness of the air source heat pump is that the heat pump performance is greatly influenced by the outdoor air temperature condition [
1].
Thus, in order to supplement the weaknesses of the ground source and air source heat pumps and to improve system performance, a hybrid ground source heat pump was developed. The ground heat exchanger and a hybrid heat pump with an assistant heat source are widely used in America and Europe. Generally, a hybrid ground source heat pump is a system that uses a ground heat exchanger along with an assistant heat source apparatus such as a cooling tower and boiler. The ground heat exchanger is utilized at a certain load, and the cooling tower is utilized simultaneously when the load is higher than that of the selected load. During heating, the boiler or solar panels used for general heating facilities are additionally installed in the geothermal heat pump and utilized as the assistant heat source. A system using a ground heat exchanger and an air source as the assistant heat source can also be considered as a hybrid geothermal heat pump system. These systems are developed to assist condenser heat radiation during cooling and evaporator heat absorption during heating, thus increasing system efficiency, resulting in a saving in electricity.
Previous studies include geothermal heat pump system design [
2], heat pump system efficiency and economic feasibility analysis [
3], hybrid geothermal system performance analysis [
4] and design construction and construction criteria [
5].
Healy
et al. [
3] analyzed a geothermal heat pump operation and performance characteristic through a numerical study of various parameters that effect geothermal heat pump performance. Stoecker [
6] proposed a data processing model for a vapor compression system simulation analysis. The model is used to predict the total system performance based on the performance characteristics of each component (evaporator, condenser, compressor, and expansion devices).
Mei
et al. [
7] conducted a study on a high-efficiency ground coil heat exchanger, analyzing the water phase change and the ground temperature variation of the horizontal ground coil due to the seasonal change in the soil.
In America, research carried out on geothermal energy increased after the 1980s. In 1984, Bose [
8,
9] proposed that for a vertical ground heat exchanger it is valid to use an equivalent diameter and to consider the two tubes in the U-tube as one tube while deriving heat characteristics. Later, in 1988, Bose was also the first to describe soil temperature variation around a vertical heat exchanger using an analytical method. Kavanaugh [
10] constructed a test module for measuring pipe pressure loss and various heat losses in a geothermal heat pump system pipe design, thus describing the actual operation and yielding design values that can be utilized. It should be noted that Bose [
8,
9] and Kavanaugh [
2] proposed the design criteria in the geothermal heat pump system, and provided the data of various examples of installed heat pump systems, thus accelerating the use of the geothermal heat pump [
11].
Lund [
12] showed a 58% growth in geothermal heat pump system usage after 1995, and that the growth was 9.8% annually, and around five million heat pump systems in use in America and European countries by the beginning of 2000s. Lund
et al. [
13] estimated the increase in the numbers of geothermal heat pump system being installed. Around 4.5 million geothermal heat pump systems were installed in America in 2005, with an increase of 0.5 million each year. The increase rates of installation were as follows: encapsulated type vertical heat exchanger, 46%; encapsulated type horizontal heat exchanger, 38%; open type system, 15%; and overall installation, 10%. In 2005, the number of 12 kW capacity geothermal heat pump systems installed had doubled compared to that in 2000 and by 2010, about 15 million geothermal heat pump systems had been installed.
Zeng
et al. [
14] analyzed borehole heat transfer in a vertical ground heat exchanger while utilizing single U-tube and double U-tube units. Hepbasli
et al. [
15] conducted experimental research on geothermal heat pump performance with an encapsulated vertical ground heat exchanger. Bi
et al. [
16] analyzed the temperature distribution around a ground heat exchanger through theory and experiment. İnallı
et al. [
17] analyzed seasonal ground temperature distribution and system performance while varying the burying depth of the ground heat exchanger in the horizontal geothermal heat pump system. Esen
et al. [
18] analyzed heat pump system performance of the horizontal geothermal heat pump system in cases where the heat exchanger burying depth was 1.0 m and 2.0 m.
In this study, a fuel cell system was combined with a heat pump system and hybrid heat pump system currently in use. The fuel cell system transforms chemical energy directly to electrical energy, thus yielding higher efficiency compared to other electricity generating technologies. The cost is less than that of late-night electricity due to its capability to generate electricity on its own. Also, the waste heat from the fuel cell operation can be stored in the heat storage tank and used as a heat source, thus increasing the heat pump system coefficient of performance (COP) during heating.
3. Numerical Analysis of Geothermal Heat Pump
3.1. Ground Source Heat Pump System
A schematic of the fuel cell driven ground source heat pump system in this study, which is the object of the numerical analysis, is shown in
Figure 1.
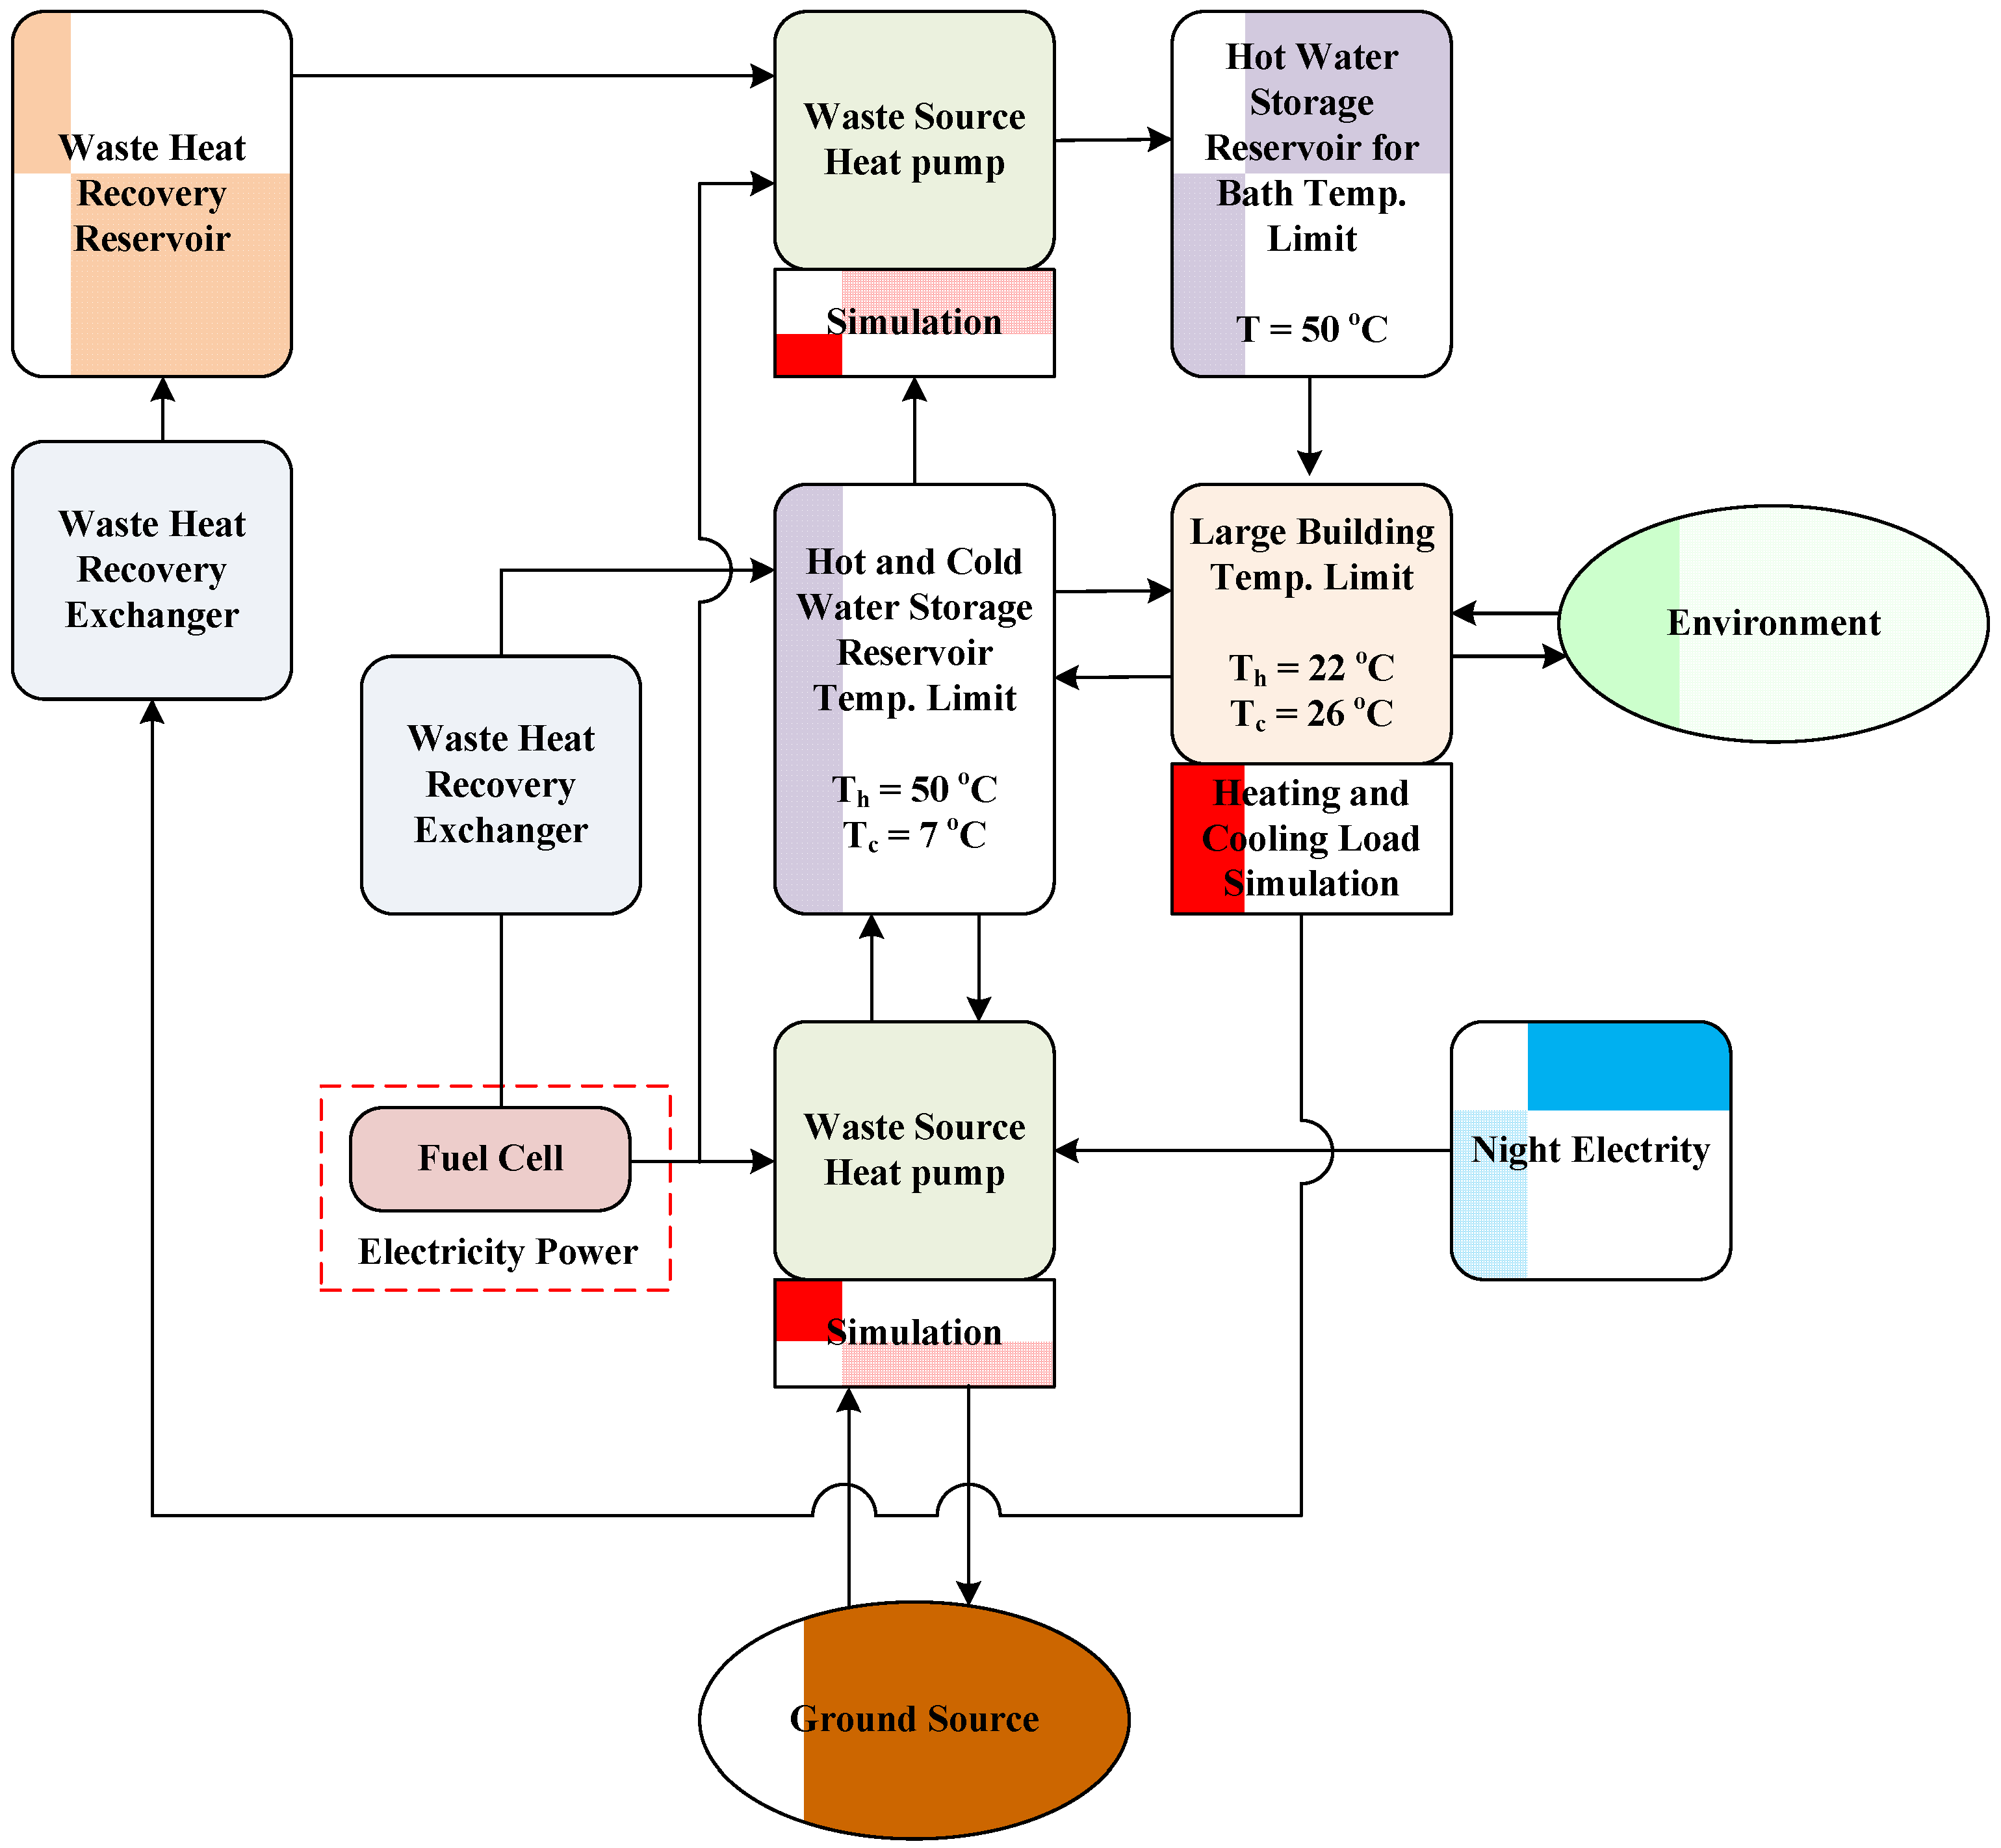
Figure 1.
Schematic diagram of the fuel cell driven ground source heat pump heating and cooling system.
Figure 1.
Schematic diagram of the fuel cell driven ground source heat pump heating and cooling system.
The heat pump system is a system combining a chilled water storage tank, a ground source heat pump, and a heat pump using bath water waste as a heat source. It consists of two heat pumps, while one heat pump can alternatively use the ground source and the waste heat as a source. In more detail, in the heat pump system, heat is stored in a chilled water storage tank with late-night electricity and heat from the fuel cell operation to be used during heating. Waste heat from the shower and bath water is stored in the hot water storage reservoir through the water source heat pump. Waste heat from the shower and bath water is stored in the hot water storage reservoir through the water source heat pump. In the case of cooling, the heat from the chilled water storage tank is pumped to the hot water storage reservoir using the water source heat pump so that both cold and hot heats are utilized simultaneously by a single heat pumping operation. This combined load system increases double the COP of the system. For numerical analysis of the heat pump system, the heating and cooling load calculation of the building, the heat pump capacity calculation, and the sub-program to predict ground temperature variation through the heat pump energy equilibrium equation are used to analyze two-dimensional heat transfer.
3.2. Fuel Cell System Waste Heat Recovery Apparatus
In a fuel cell system, waste heat recovery is more important than simply improving energy efficiency. According to the American DOE report [
19], a polymer electrolyte membrane fuel cell system with 30% fuel-to-electricity efficiency can save up to 40% gas fuel when a waste heat recovery system with 65% efficiency is installed. In the actual fuel cell systems, water or air is used for cooling in order to maintain the optimal operation temperature, and pipelines are also already in the system. Thus, simple heat exchangers are added as shown in
Figure 1 to store the heat generated during the fuel cell operation.
3.4. Analysis of GSHP Cycle
In order to simulate the heat pump system, the cycles for the air source heat pump and water source heat pump must be simulated. In this study, the Engineering Equation Solver (EES) is used to simulate the heat pump cycle. Assumptions for the cycle simulation are as follows:
- (1)
Temperature difference between condenser and water is ±5 °C in the heat pump heat storage tank or chilled cooling storage tank heat exchanger.
- (2)
Temperature difference between the outdoors and the evaporator or condenser is ±10 °C for the evaporation and condensing in water-air heat exchange.
Procedures for simulating the heat pump with the EES code are as follows.
- (1)
Determine the evaporator temperature and condenser temperature and then calculate the R-22 refrigerant heat pump system coefficient of performance (COP) with the EES program.
- (2)
Ground brine temperature is altered automatically in response to the ground heat conduction condition until the total heat absorbed or emitted from the entire pipeline becomes 2RT. 2RT is the postulated heating or cooling capacity of a module ground pipe hole.
3.5. Ground Heat Exchange Analysis
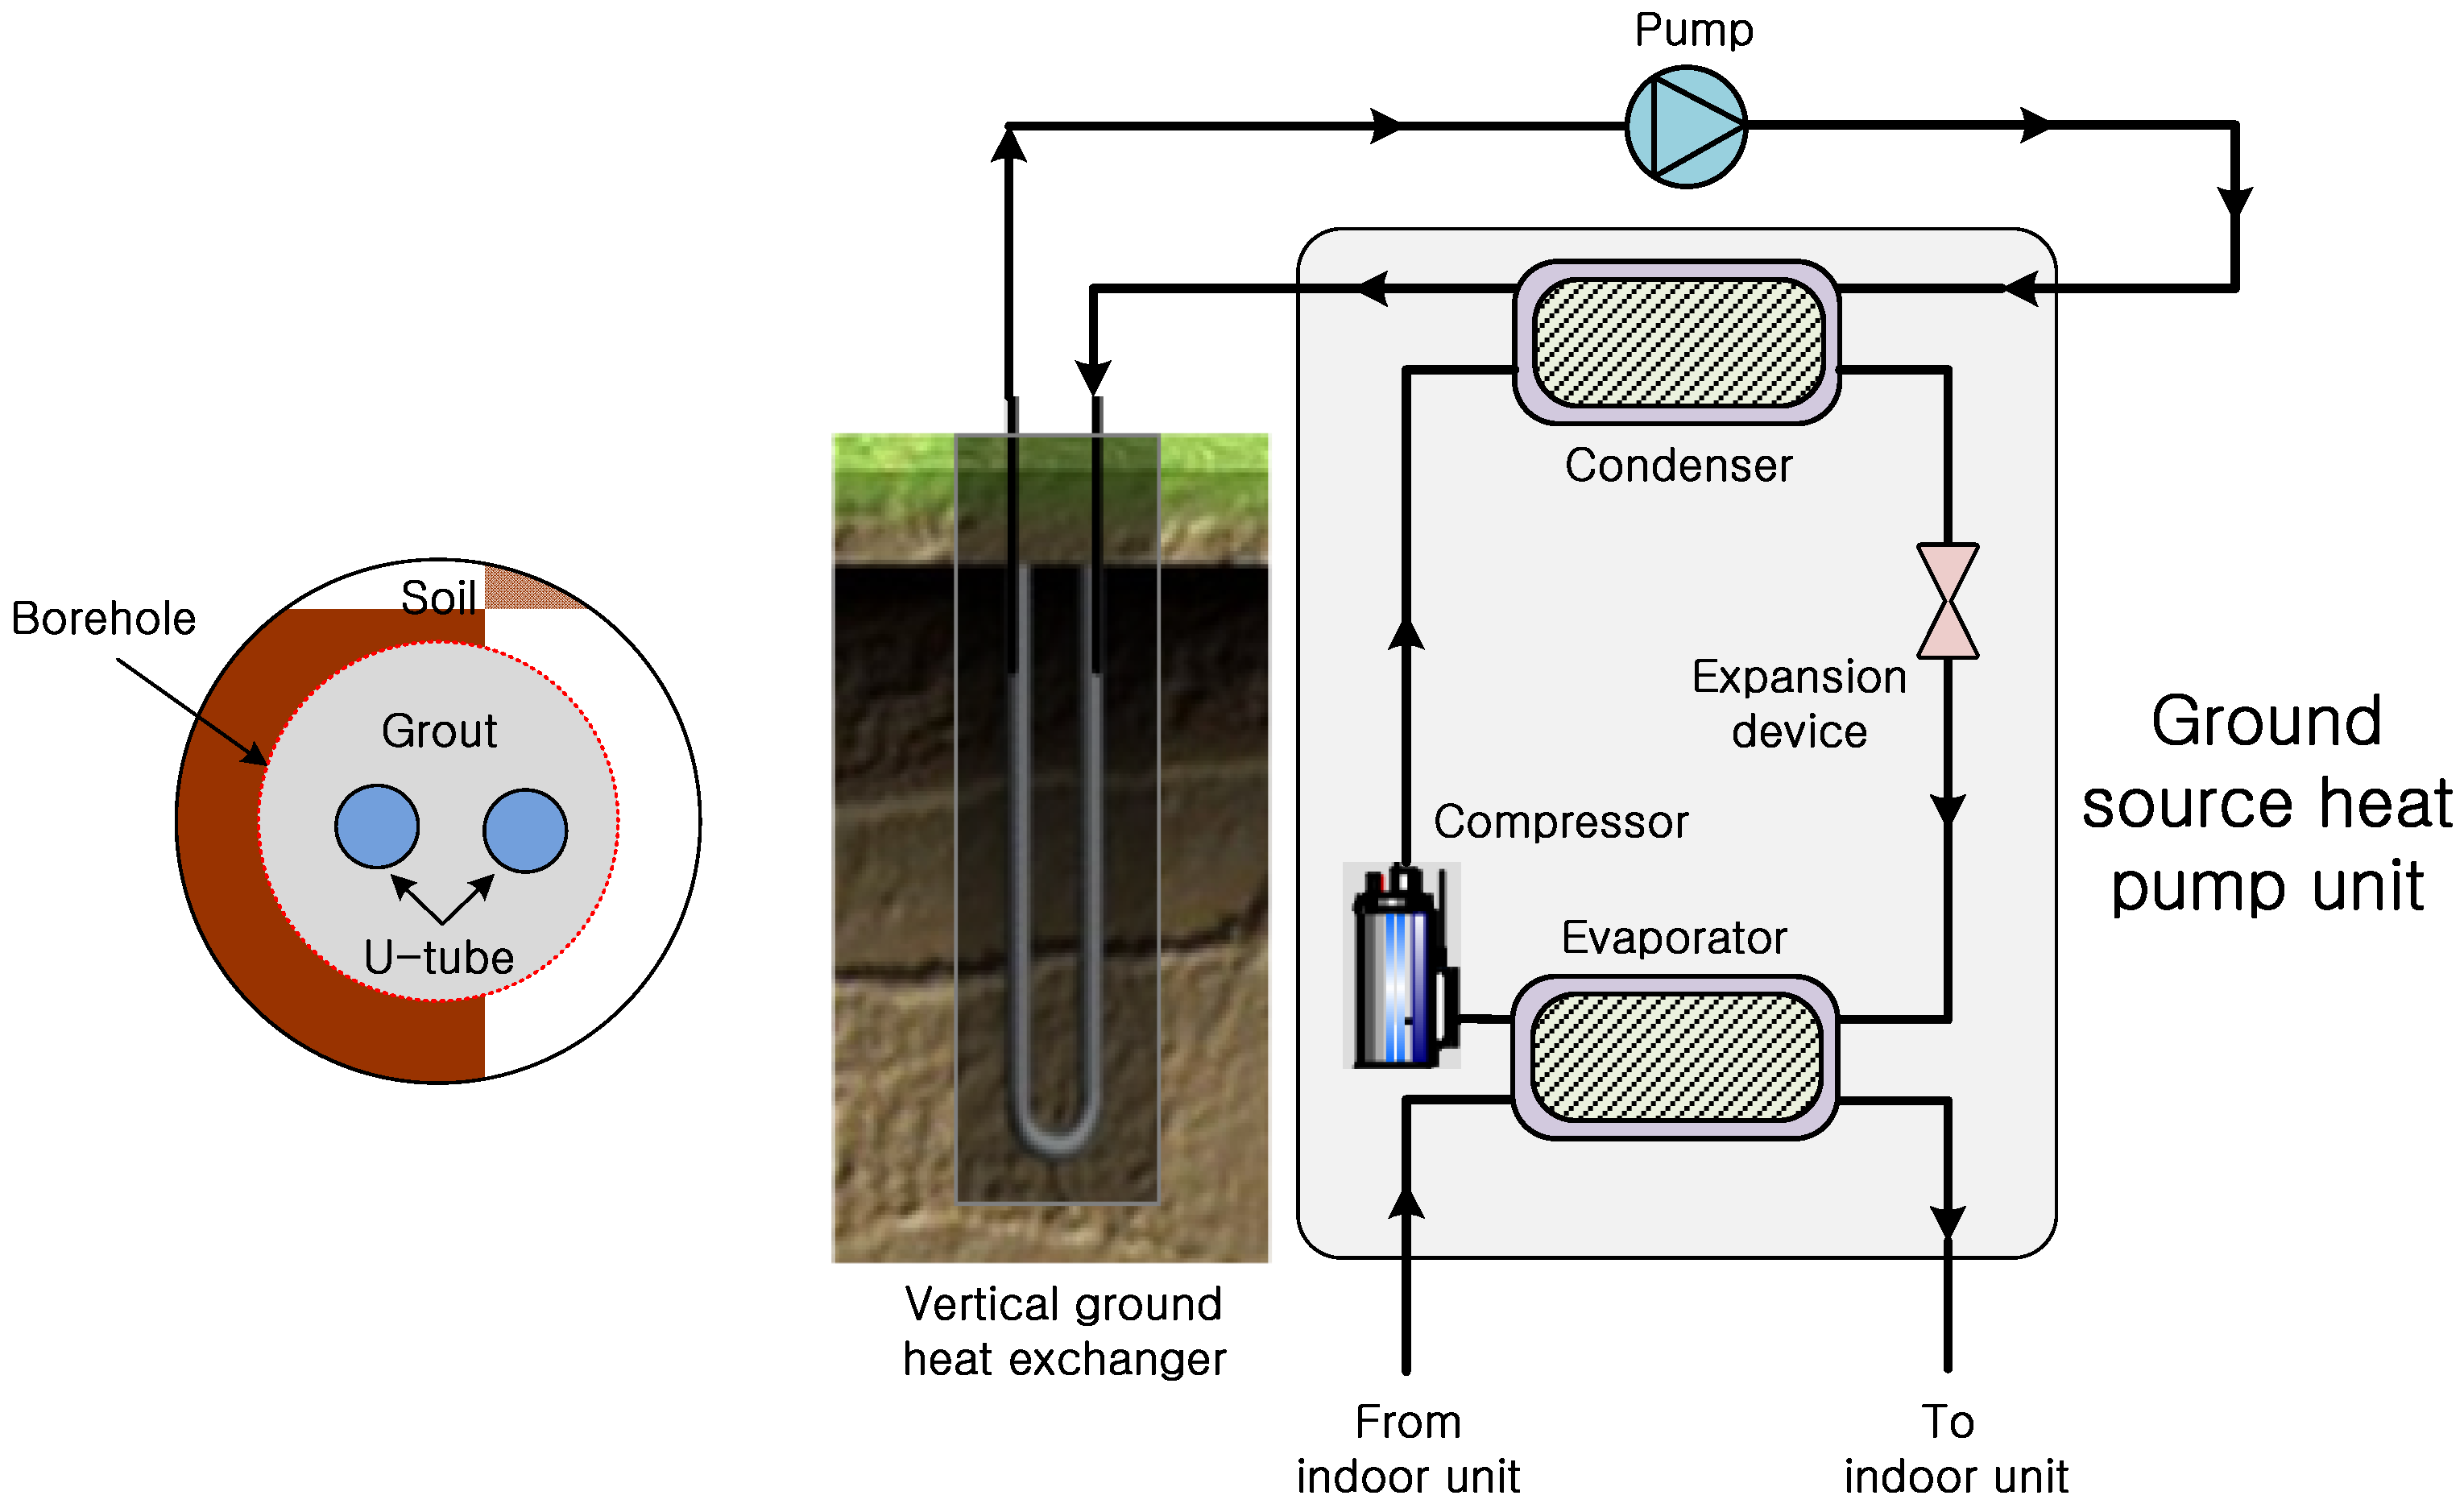
Figure 2 shows a schematic of a ground source heat pump system in a geothermal heat pump system with a vertical ground heat exchanger. The single U-tube vertical ground heat exchanger consists of two tubes with flowing fluid, grout, and a borehole which is the boundary of the soil and grout. In the case of the heat pump cooling operation, discharged fluid flows through the pipeline and passes through the tube and grout, emitting heat to the soil, and returns to the heat pump. In reverse, during the heating operation, the fluid discharged from the heat pump flows through the tube and absorbs heat from the soil and returns to the heat pump.
Figure 2.
Schematic of a ground source heat pump system.
Figure 2.
Schematic of a ground source heat pump system.
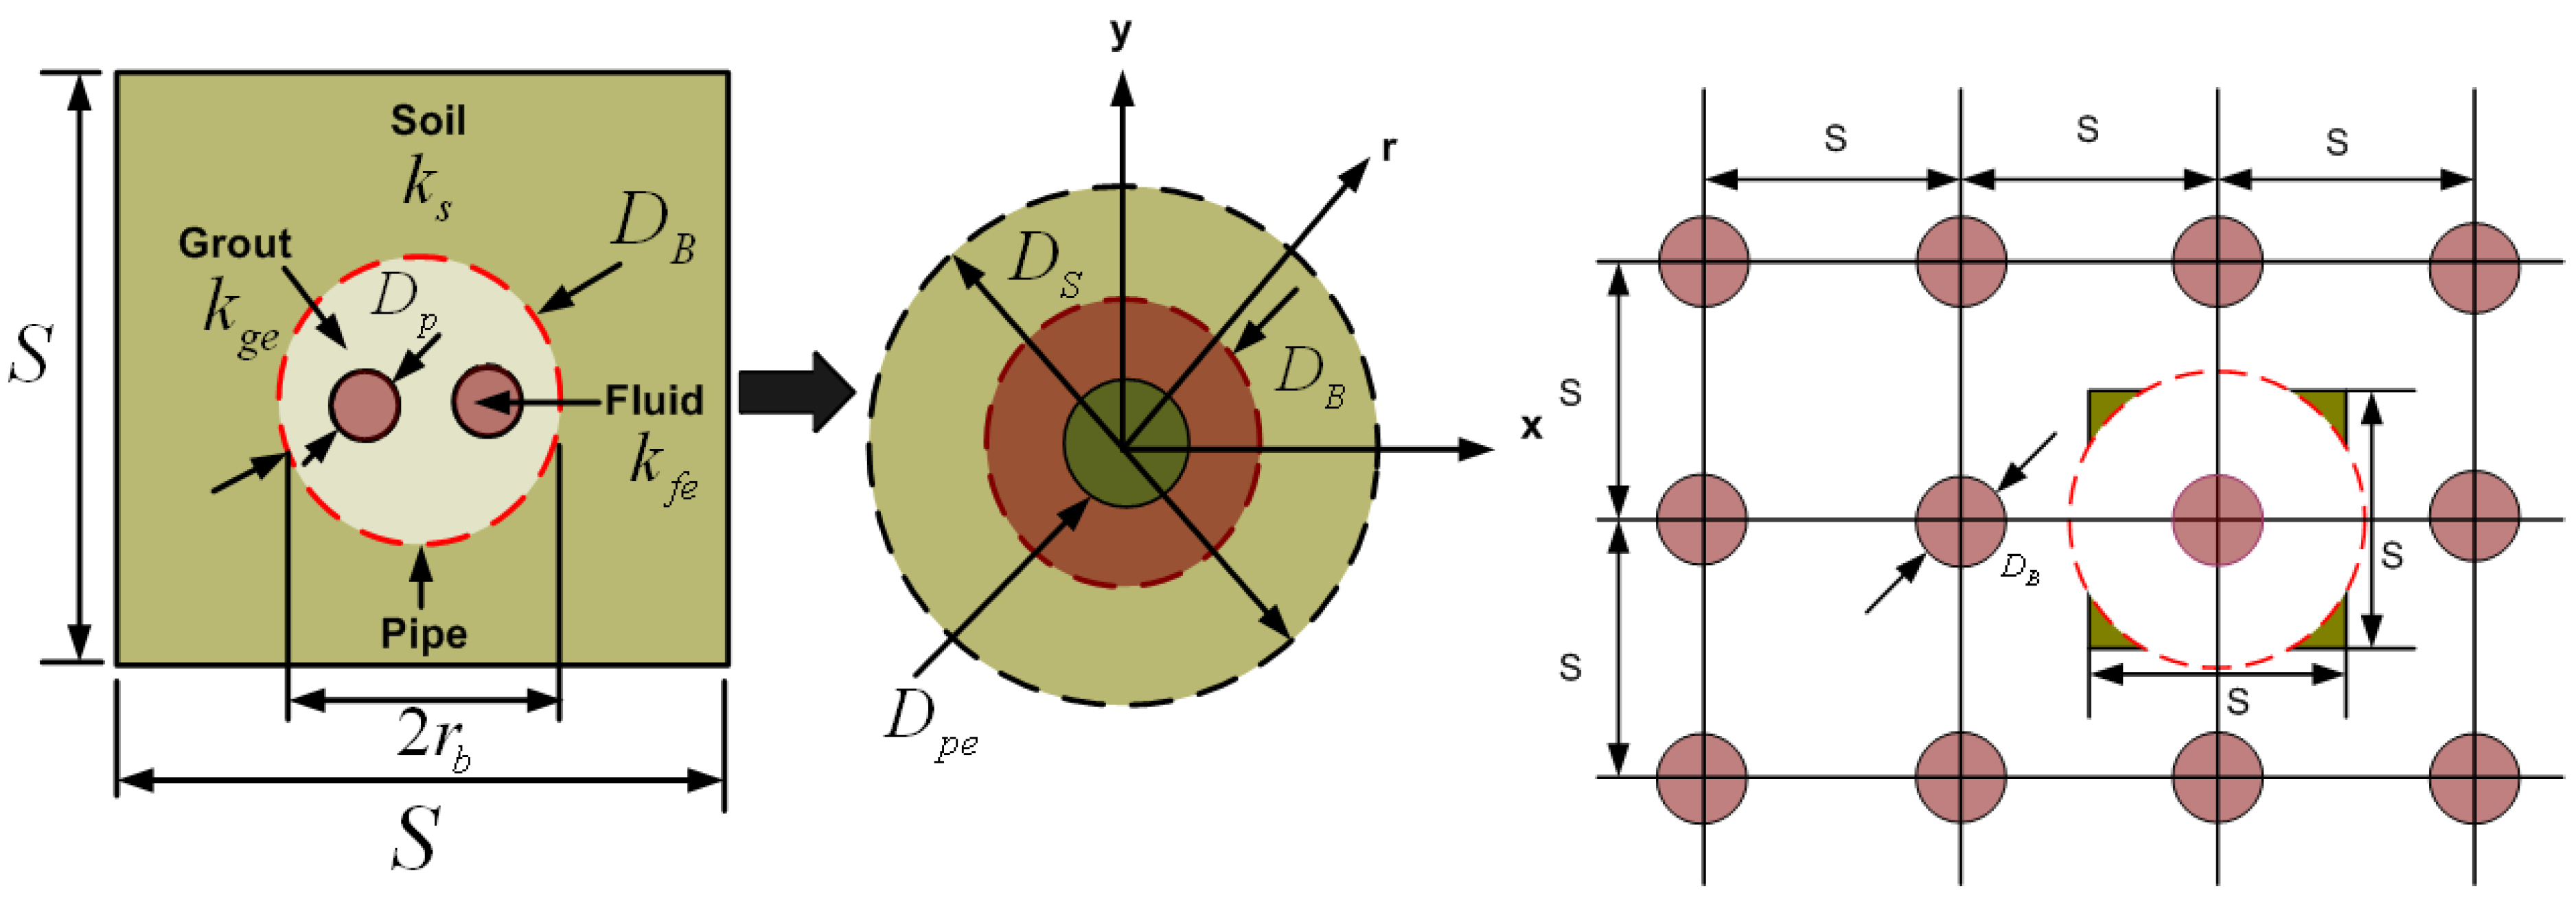
In this study, an equivalent tube is used to substitute the U-tubes, and the square calculation region is changed to a circular region, to simplify the simulation, as shown in
Figure 3. Borehole pitch is assumed to be 4.5 m and borehole depth is 100 m. The properties of the underground soil and bentonite, which fills the borehole, were selected as shown in
Table 2. Equation (1) is used to calculate the valid thermal conductivity in the soil. Water contained in the underground soil was assumed to be 35% and 75% [
24].
Figure 3.
Transformation of a square domain to an equivalent concentric domain.
Figure 3.
Transformation of a square domain to an equivalent concentric domain.
Table 2.
Properties of the element of the ground heat exchanger.
Table 2.
Properties of the element of the ground heat exchanger.
| Material | Soil | Refrigerant (R-22) [27] | Grout (Bentonite) |
|---|
| ρ (kg/m3) | 2600 | 1133 | 1800 |
| Cp (J/(kg K)) | 837 | 1332 | 500 |
| k (W/(m K)) | 3.1 | 0.077 | 2.66 |
The valid thermal conductivity of the soil is:
where
F = 0.5(
ε + 0.014)
0.25;
ε =
Sa·Φ. Here
ks,
ka,
kw represent the thermal conductivity of soil particle, air, and water, respectively. Φ is underground soil porosity and
Sa is the degree of saturation. The single module for the ground heat exchanger is a square with the length of each side
S as shown in
Figure 3.
DB is the grout diameter and
Dp is the ground pipe diameter. The square region is substituted for the circular region with equivalent diameter
Ds, while the two circular tubes with diameter
Dp are substituted for the equivalent tube with diameter
Dpc. The equivalent diameter
Dpc is calculated as
, while the ground equivalent diameter
Ds is
.
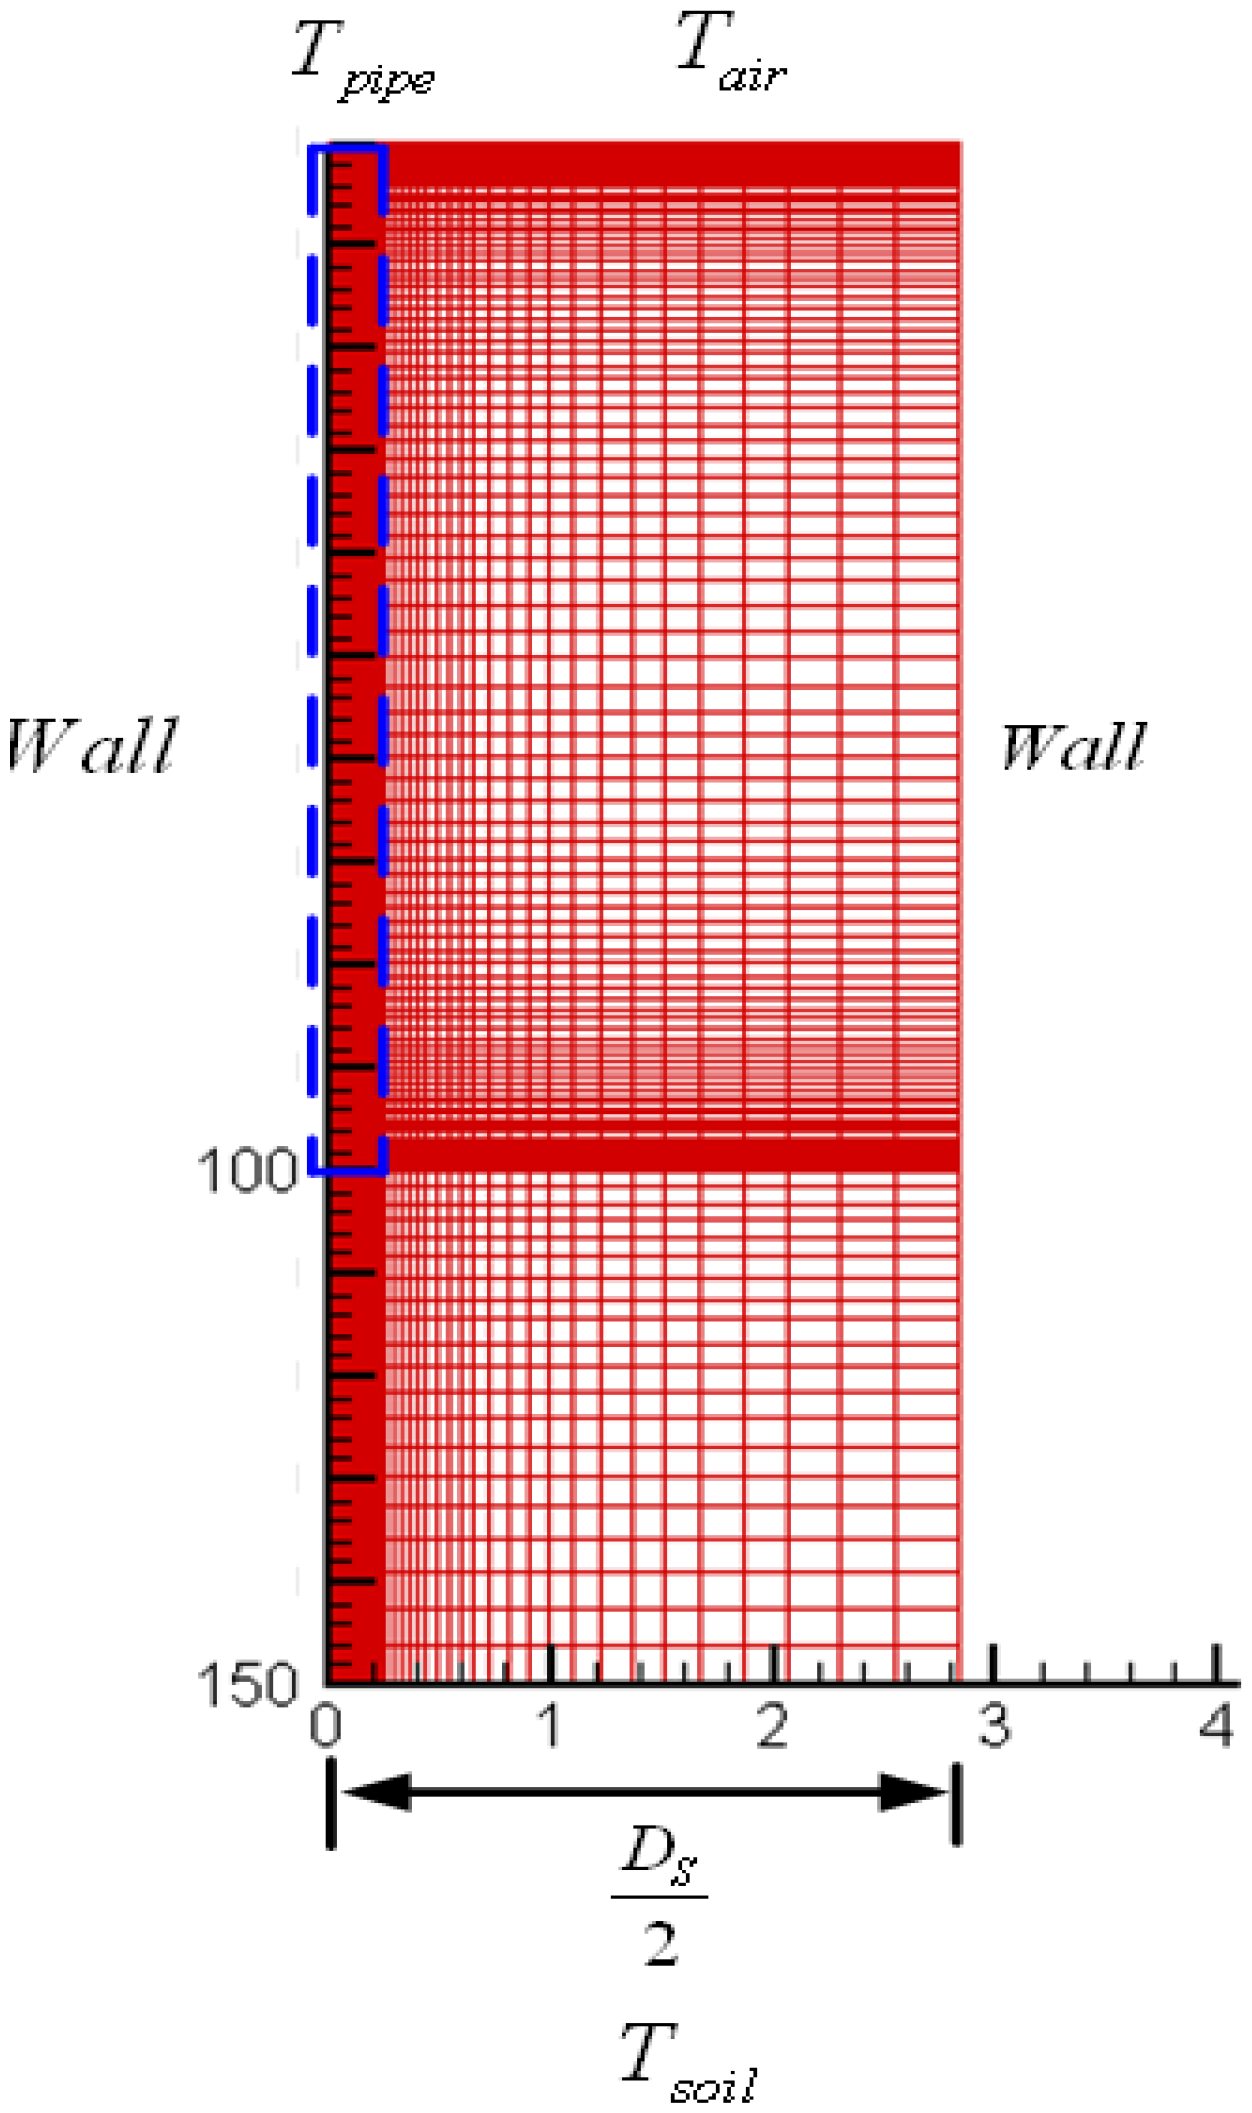
Figure 4 shows the mesh generated to analyze ground temperature distribution. Fine mesh is used for regions where rapid temperature variation due to heat pump system operation is expected to occur. The TEACH code program was used for the ground heat transfer method [
27] during simulation. A pipe depth of 100 m and a ground depth 150 m were analyzed, while the borehole pitch
S varied.
Figure 4.
Transformation of a square domain to an equivalent concentric domain.
Figure 4.
Transformation of a square domain to an equivalent concentric domain.
3.6. Governing Equation and Boundary Condition
The U-tubes are substituted for an equivalent tube as shown in
Figure 3, and an assumption is made that the heat velocity originated from the equivalent tube and was transferred to the ground through the grout. The heat velocity has a positive value when the heat is transferred from a refrigerant tube to the ground, and has a negative value when heat is transferred from ground to refrigerant tube.
The heat conduction equation in the axis-symmetric coordinate is shown as follows [
29]:
Heat conduction equation for grout is with
rfe <
r <
rb:
Here,
rfe is radius of equivalent refrigerant tube; and
rb is radius of grout, with
rb <
r < ∞:
Boundary condition at the outermost boundary of domain is:
Boundary condition at the surface of refrigerant tube is:
with an initial condition
Tpipe = 14.2 °C.
Ground surface boundary condition is:
Boundary condition for the bottom of the domain is:
Computational analysis is conducted for Equations (2)–(8) by discretization using finite volume method. Ground temperature is continuously varied according to depth, as time changes. However, after the depth reaches a certain value, the ground temperature variation maintains a constant annual temperature.
In this study, such a depth is defined as 150 m, and the temperature at the depth is assumed to be
Ts,∞ = 14.2 °C [
24]. The ground heat exchanger is axis-symmetric, thus a two-dimensional analysis is conducted for computation analysis, while the boundary condition at the symmetric surface around the borehole is defined as zero gradient of temperature [
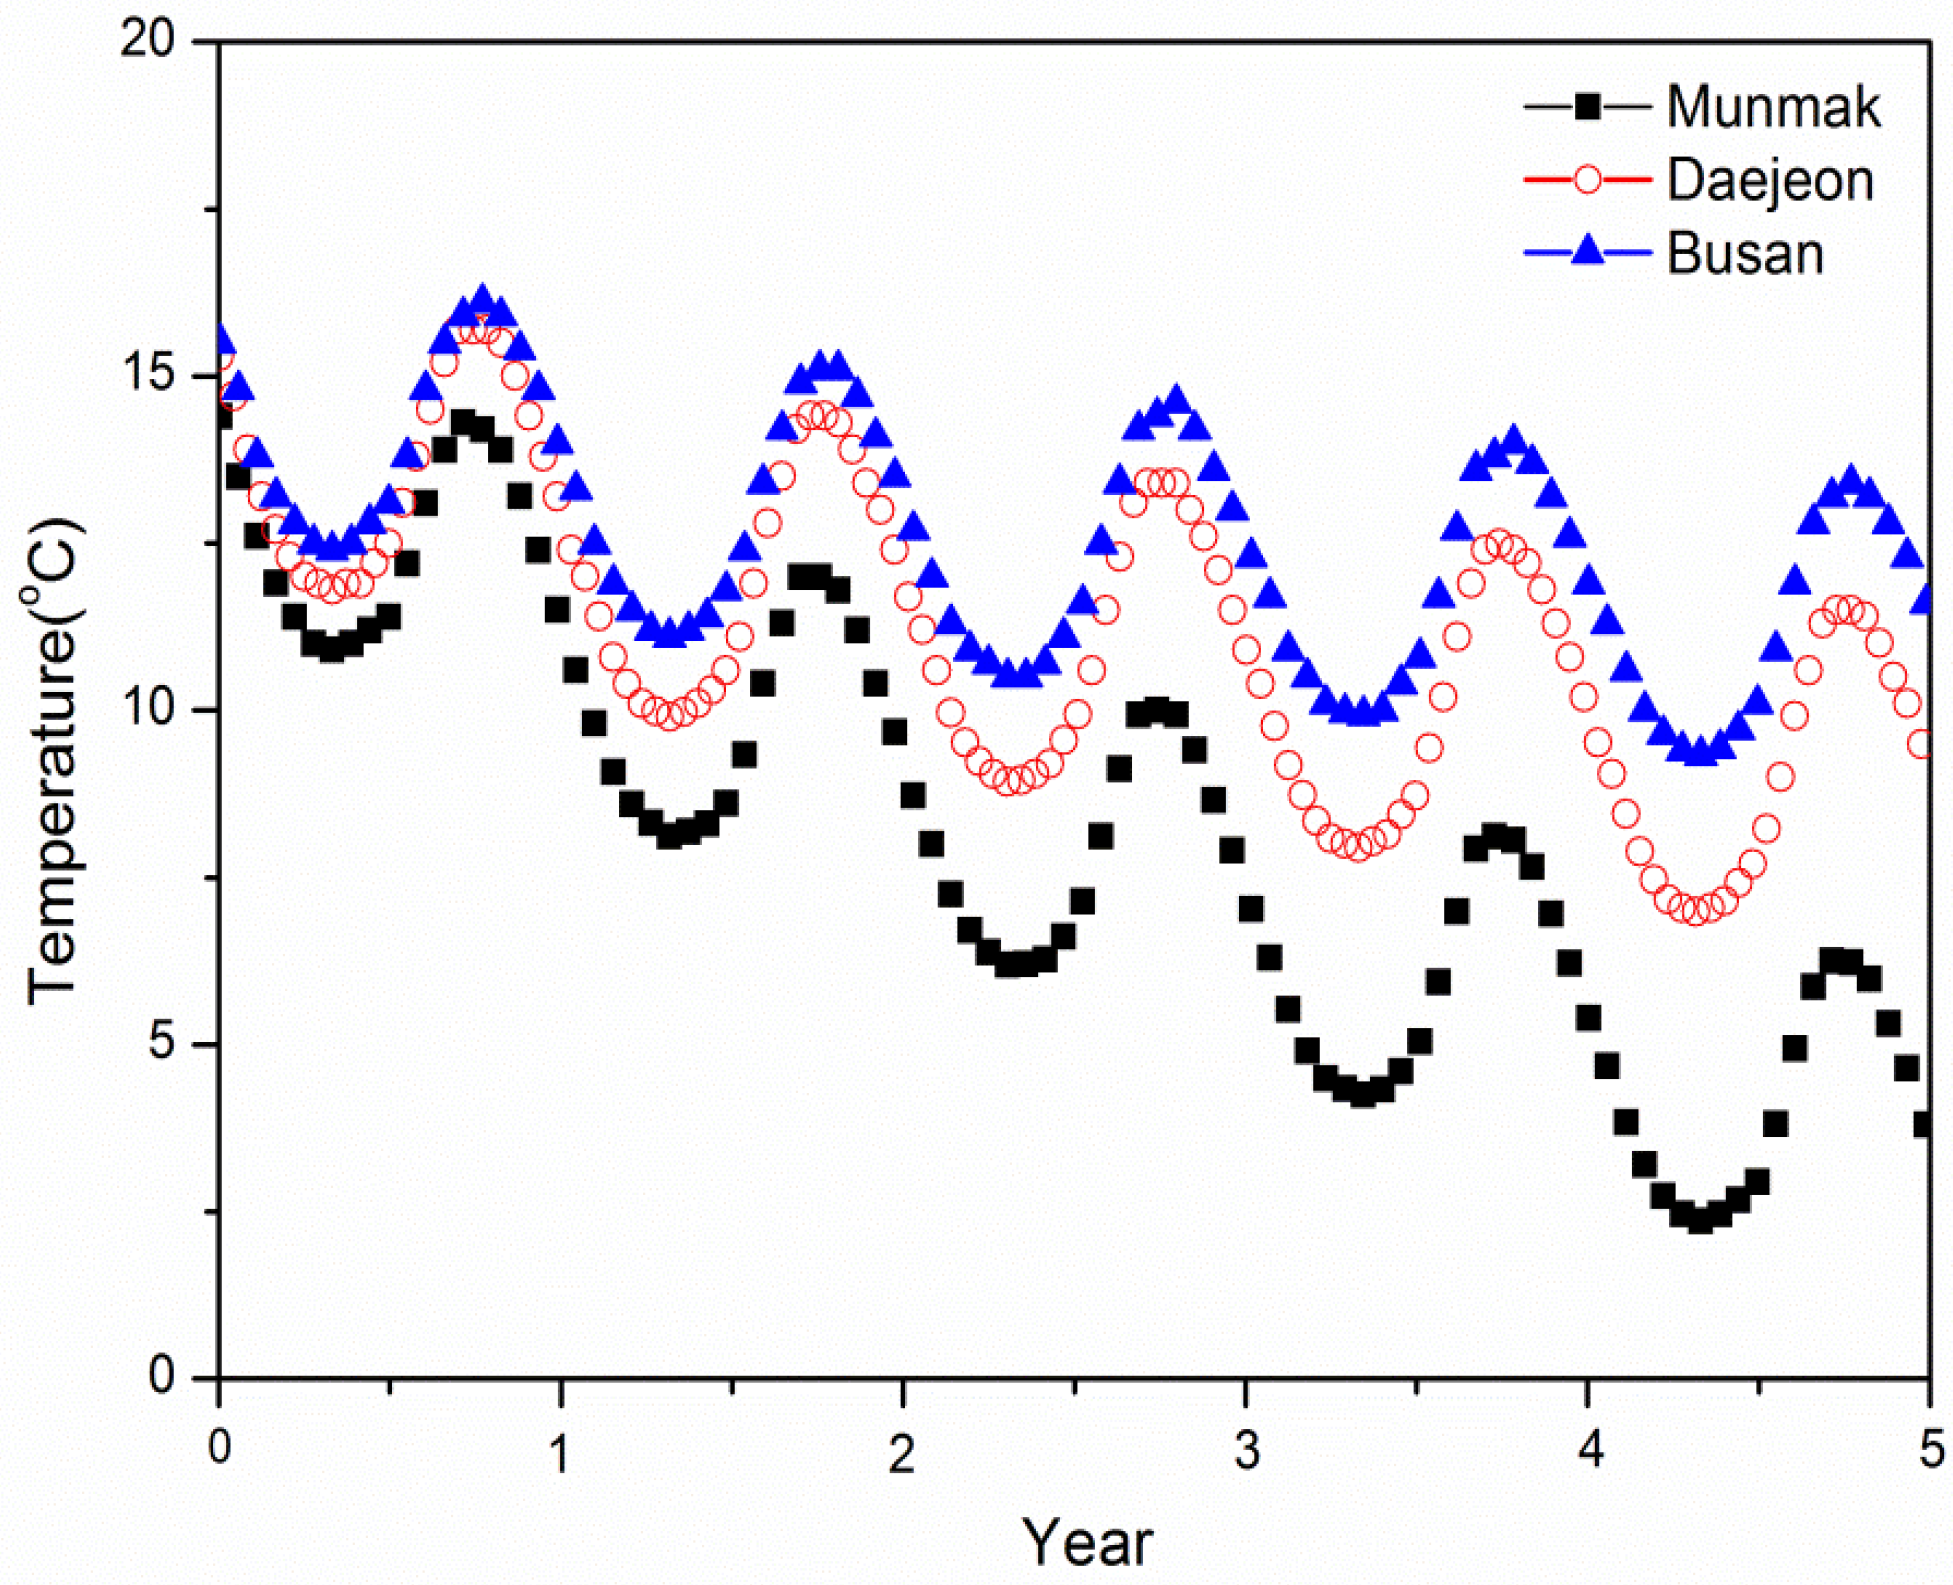
29]. To analyze the ground heat conduction equation, the ground surface condition is needed along with the boundary condition. Thus, in this study, the regional annual climate data is used as the outdoor condition [
30] and air is assumed to have the same properties as the outdoor condition [
31].
3.7. Cost of Electricity and Fuel
A comparison of the late night electricity cost and the heat pump system operational cost is shown in
Table 3. The cost of electricity generated from the fuel cell system is calculated using 46 won/kWh for hydrogen cost and 40% for fuel cell efficiency.
In this study, the energy cost is computed from the hydrogen cost and fuel cell efficiency, without taking into account the installation cost of the fuel cell. Also, the operational cost of the machines is excluded and only net energy cost is computed. The base price of late night electricity
costbase is computed from the following equation. In Equation (9), the
COPbath is the average of the hot water supply heat pump
COP, while
COPheating is the average of the heat pump heating
COP:
where cost
b = basic cost.
3.8. Heat Pump Capacity and Heat Storage Tank Calculation
Heat pump capacity (HPC) is calculated from Equation (10) with the maximum daily load during a year obtained from the heating and cooling load program. The heat storage tank capacity is calculated from Equation (11):
Here, PL is maximum daily load; SR is excess rate; OT is heat source apparatus operating time; NT is operating time during night; NL is night load; RT is temperature difference due to heat storage tank usage, and RE is heat storage tank efficiency.
The temperature difference due to heat storage tank usage was assigned as 5 °C, with a 10 h operating time during the night, a heat storage tank efficiency of 95%, and an excess rate of 10%. The amount of waste water was assigned as 1.8 times that of daily heated water, while heat storage tank capacity was the amount of the daily heated water, and the waste water storage tank capacity was 1.8 times that of the heat storage tank.


