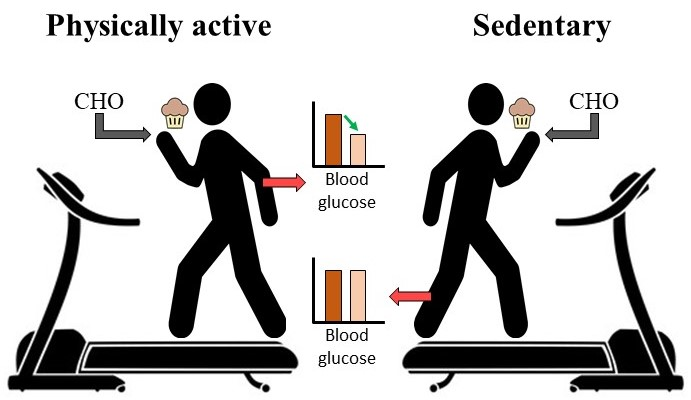
Effects of Eating While Walking on Blood Glucose Concentrations


Department of Kinesiology, Nutrition and Recreation, Southeast Missouri State University, Cape Girardeau, MO 63701, USA
*
Author to whom correspondence should be addressed.
Endocrines 2020, 1(1), 13-21; https://0-doi-org.brum.beds.ac.uk/10.3390/endocrines1010002
Submission received: 27 December 2019
/
Revised: 2 March 2020
/
Accepted: 5 March 2020
/
Published: 10 March 2020
Abstract
:Eating while walking is a commonly growing practice in the United States, in part due to an increase in the number of convenient dietary products (i.e., snack bars, shakes, drinks, etc.). Although eating while walking has been shown to increase total food consumption and weight gain, the acute effects of eating while walking on blood glucose (BG) concentrations are still unknown. The purpose of this study was to investigate the acute effects of eating while walking on BG. Twenty-two apparently healthy, male, physically active (PA, n = 10) and sedentary (Sed, n = 12) individuals volunteered for this study. Participants randomly performed the control [sit+snack (SS)] and experimental [walk+snack (WS)] protocol, with one week between protocols. Both protocols showed a significant increase in post-BG concentrations [SS (p < 0.001); WS (p < 0.01)], but post-BG concentrations for WS were significantly lower (p < 0.001) than SS. During SS, significantly higher post-BG concentrations were exhibited for the PA (p < 0.05) and Sed (p < 0.01) groups, whereas the WS protocol post-BG concentrations were significantly increased for the Sed group (p < 0.01). Lastly, individuals who exercised more and had a lower body mass index (BMI) were significantly correlated to lower BG concentrations in response to the 47 g carbohydrate (CHO) snack. However, these data are preliminary and may need further investigation.

1. Introduction
Eating while walking has become a common practice in the United States and in other parts of the world, especially among younger adults. This is in part due to an increase in the number of commercially available convenient dietary products like snack bars, shakes, and other food products that are “to go” or “grab and go” [1,2,3]. Higher food and caloric intake [4], and lack of physical activity [5,6], result in elevated blood glucose (BG) concentrations, typically peaking 60 min [7,8] post-meal consumption. These factors generally lead to increased storage of energy in the form of fat (i.e., adipose tissue) regardless of the macronutrient source. However, when physical activity, either moderate [9,10] or vigorous-intensity [11,12], is performed before [11,13,14,15,16,17] or after [11,13] meals, BG concentrations can be significantly reduced by 17–26% [7,8,9,11,13,18]. This effect is most likely due to an increase in exercise-induced uptake of BG by skeletal muscles. Reductions in BG are consistent even when exercise is performed 12 h prior to the consumption of a carbohydrate-rich meal [11], among individuals of different ethnicities [19], and across different baseline physical activity statuses, i.e., healthy [18], recreationally active [9,20], strength-trained [11,21,22,23], endurance-trained [24] and athletes [11]. However, the aforementioned studies failed to assess the effects of eating while walking on post-exercise BG concentrations in college-aged sedentary individuals.
A recent study by Ogden et al. reported an increase in body weight, primarily due to increased food and calorie consumption during the rest of the day, in adult female participants (24.0 ± 3.3 years old, n = 60), who consumed 21 g of carbohydrates (CHO) while eating and walking [25]. To our knowledge, the acute effects of eating while walking on BG concentrations have not been thoroughly studied. Specifically, past research has assessed the effects of walking on glucose before or after, but not during the meal [9]. However, a concurrent increase in convenient foods and obesity rates demands the need for a better understanding of glucose metabolism after eating while walking. Therefore, the purpose of this study was to investigate the acute effects of eating while walking [moderate intensity 40–60% maximal oxygen consumption (VO2max)] on BG concentrations after consuming a 47-gram CHO (47 g CHO) snack in physically active (PA) and sedentary (Sed) individuals. It was hypothesized that eating while walking would cause a reduced 60-min post-snack BG concentration in collegiate male participants, especially in PA participants.
2. Materials and Methods
2.1. Study Participants
Twenty-two young male, apparently healthy, sedentary Division I University students voluntarily participated in the study (age: 23.3 ± 3.8 years, mean ± SD). Participants were recruited through classroom announcements, word of mouth, and flyers posted around campus. All participants provided Institutional Review Board-approved written informed consent prior to participation. For sampling purposes, participants who reported performing 1-3 h of physical activity per day were classified as PA (n = 10) and those reporting <1 h per week of physical activity were classified as Sed (n = 12).
2.2. Study Protocol
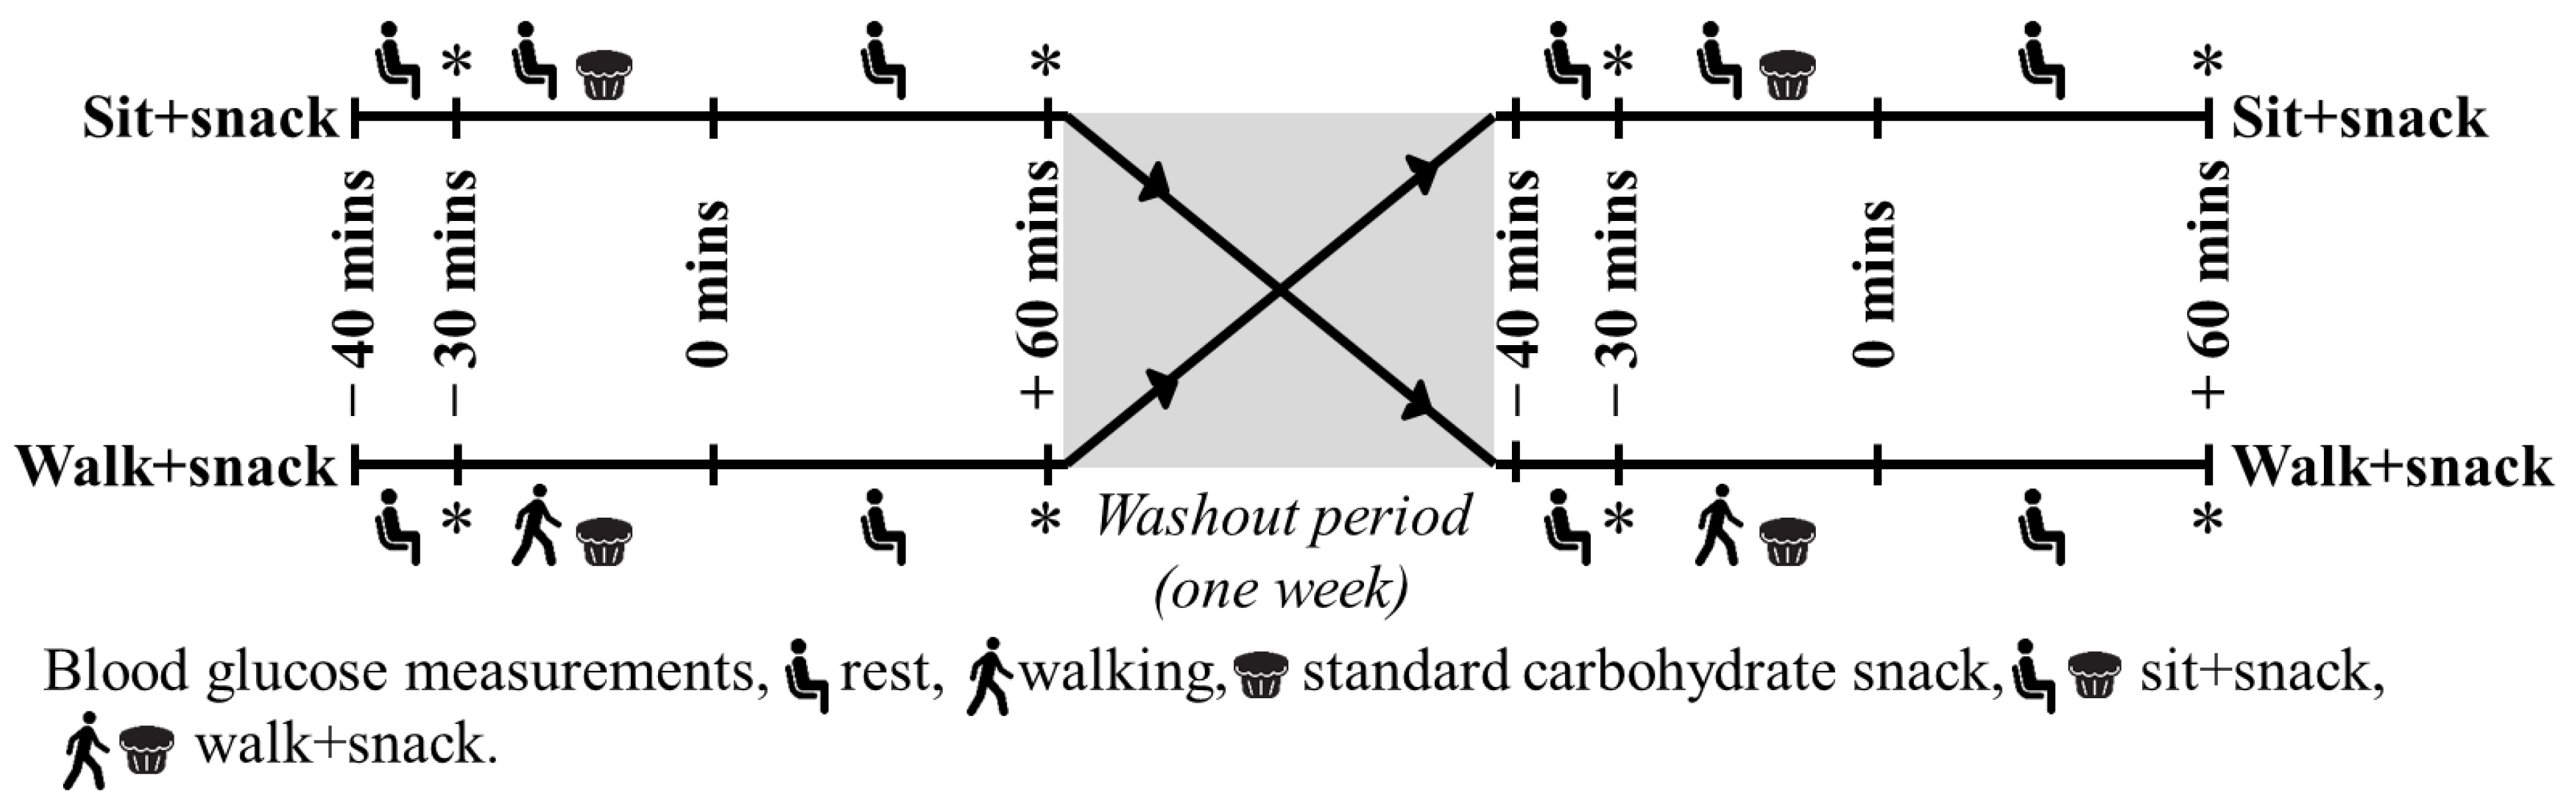
The recruited participants were asked to visit the laboratory in a fasted state (i.e., overnight fasting, 10–12 h) during the morning hours on two different days, separated by at least one week (washout period) [26]. At the first laboratory visit, each participant was randomly assigned, then performed the sit + snack (SS) or walk + snack (WS) protocol (Figure 1). During the second visit, after one week, participants performed the alternate protocol. Each laboratory visit had the participant rest in a seated position for 10 min prior to obtaining a baseline (i.e., pre-) BG concentration. After completing each protocol, a 60 min seated rest period was conducted, followed by the obtainment of a BG concentration (i.e., post).
2.2.1. The 47 g CHO Snack
Previous studies have assessed different quantities of pre- or post-exercise CHO intake on BG concentrations [7,16,17]. For the most part, past research has supported a standardized CHO intake of 50 g. Therefore, a standard muffin, containing 47 g of CHO (nutrition label value, supplementary Table S1) was purchased from a local grocery store and refrigerated 12–24 h prior to consumption.
2.2.2. Blood Glucose Measurements
Pre- and post-BG concentrations were collected using an Accu-Chek Nano Blood Glucose Monitoring System (Roche Diagnostics, Indianapolis, IN, USA). Capillary BG was measured by piercing the skin (on the finger). The participant’s finger was cleaned using alcohol swabs prior to the needle prick and all BG concentrations were recorded.
2.2.3. SS Protocol
After the pre-BG concentrations were recorded, each participant consumed a 47 g CHO snack while seated for 30 min. Participants were recommended to consume the 47 g CHO snack at a tolerable pace (i.e., slowly), finishing close to the end of the 30 min time period. Participants were allowed to drink two to three ounces (60–90 mL) of water while consuming the 47 g CHO snack. Finally, a 60-min seated rest period, during which no food or water was allowed, was conducted followed by the obtainment of a post-BG value (Figure 1).
2.2.4. WS Protocol
After the pre-BG concentrations were recorded, each participant began walking on a motorized treadmill (Full Vision Model No.TMX425CP, Newton, KS, USA), at a speed invoking moderate intensity, based upon the rate of perceived exertion (RPE). Specifically, the treadmill speed was adjusted to produce an RPE between 9 and 12 (i.e., light to fairly hard) on the Borg scale [27]. Once intensity was accurately adjusted, a 30-min walking session was completed. During the 30 min of walking, the participants were required to consume the 47 g CHO snack (i.e., the aforementioned standardized muffin) at a tolerable pace. Participants were allowed to drink two to three ounces of water while eating the 47 g CHO snack (finishing near the end of the walking protocol). Finally, a 60 min seated rest period, during which no food or water was allowed, was conducted followed by the obtainment of a post-BG concentration (Figure 1).
2.2.5. Sampling and Confidentiality
In a random and counterbalanced manner, all participants performed the SS and WS protocol. To maintain anonymity, each participant was assigned a code number on the data collection sheet. The key was stored in a locked filing cabinet by the principal investigator and subsequently destroyed after data collection was complete.
2.3. Statistical Analyses and Calculations
Pre-BG concentrations between protocols were compared using a Pearson Product Moment Correlation and Student’s t-test. Repeated measures analyses of variance (ANOVA) were conducted on BG concentrations within and between protocols as well as within and between the PA and Sed groups. All analyses were performed using SPSS v24.0 statistical software package (SPSS Inc., Chicago, IL, USA) with statistical significance set at p < 0.05. The following formulas were utilized to measure basal metabolic rate (BMR) [Formula (1)], resting metabolic rate (RMR) [Formula (2)], total daily energy expenditure (TDEE) [Formula (3)], and the effect of walking on BG concentrations [Formula (4)].
Formula (1): BMR = Men: 66 + (6.23 x weight in pounds) + (12.7 x height in inches) − (6.8 x age in years)
Formula (2): RMR = 10 x weight (kg) + 6.25 x height (cm) − 5 x Age + 5
Formula (3): BMR*Activity factor [hours of activity <1=activity factor 1.2; ≥ 1 or <3 =1.375; ≥3 =1.55; ≥ 5 =1.725)
Formula (4): BG concentration: post-BG (SS) − post-BG (WS)
3. Results
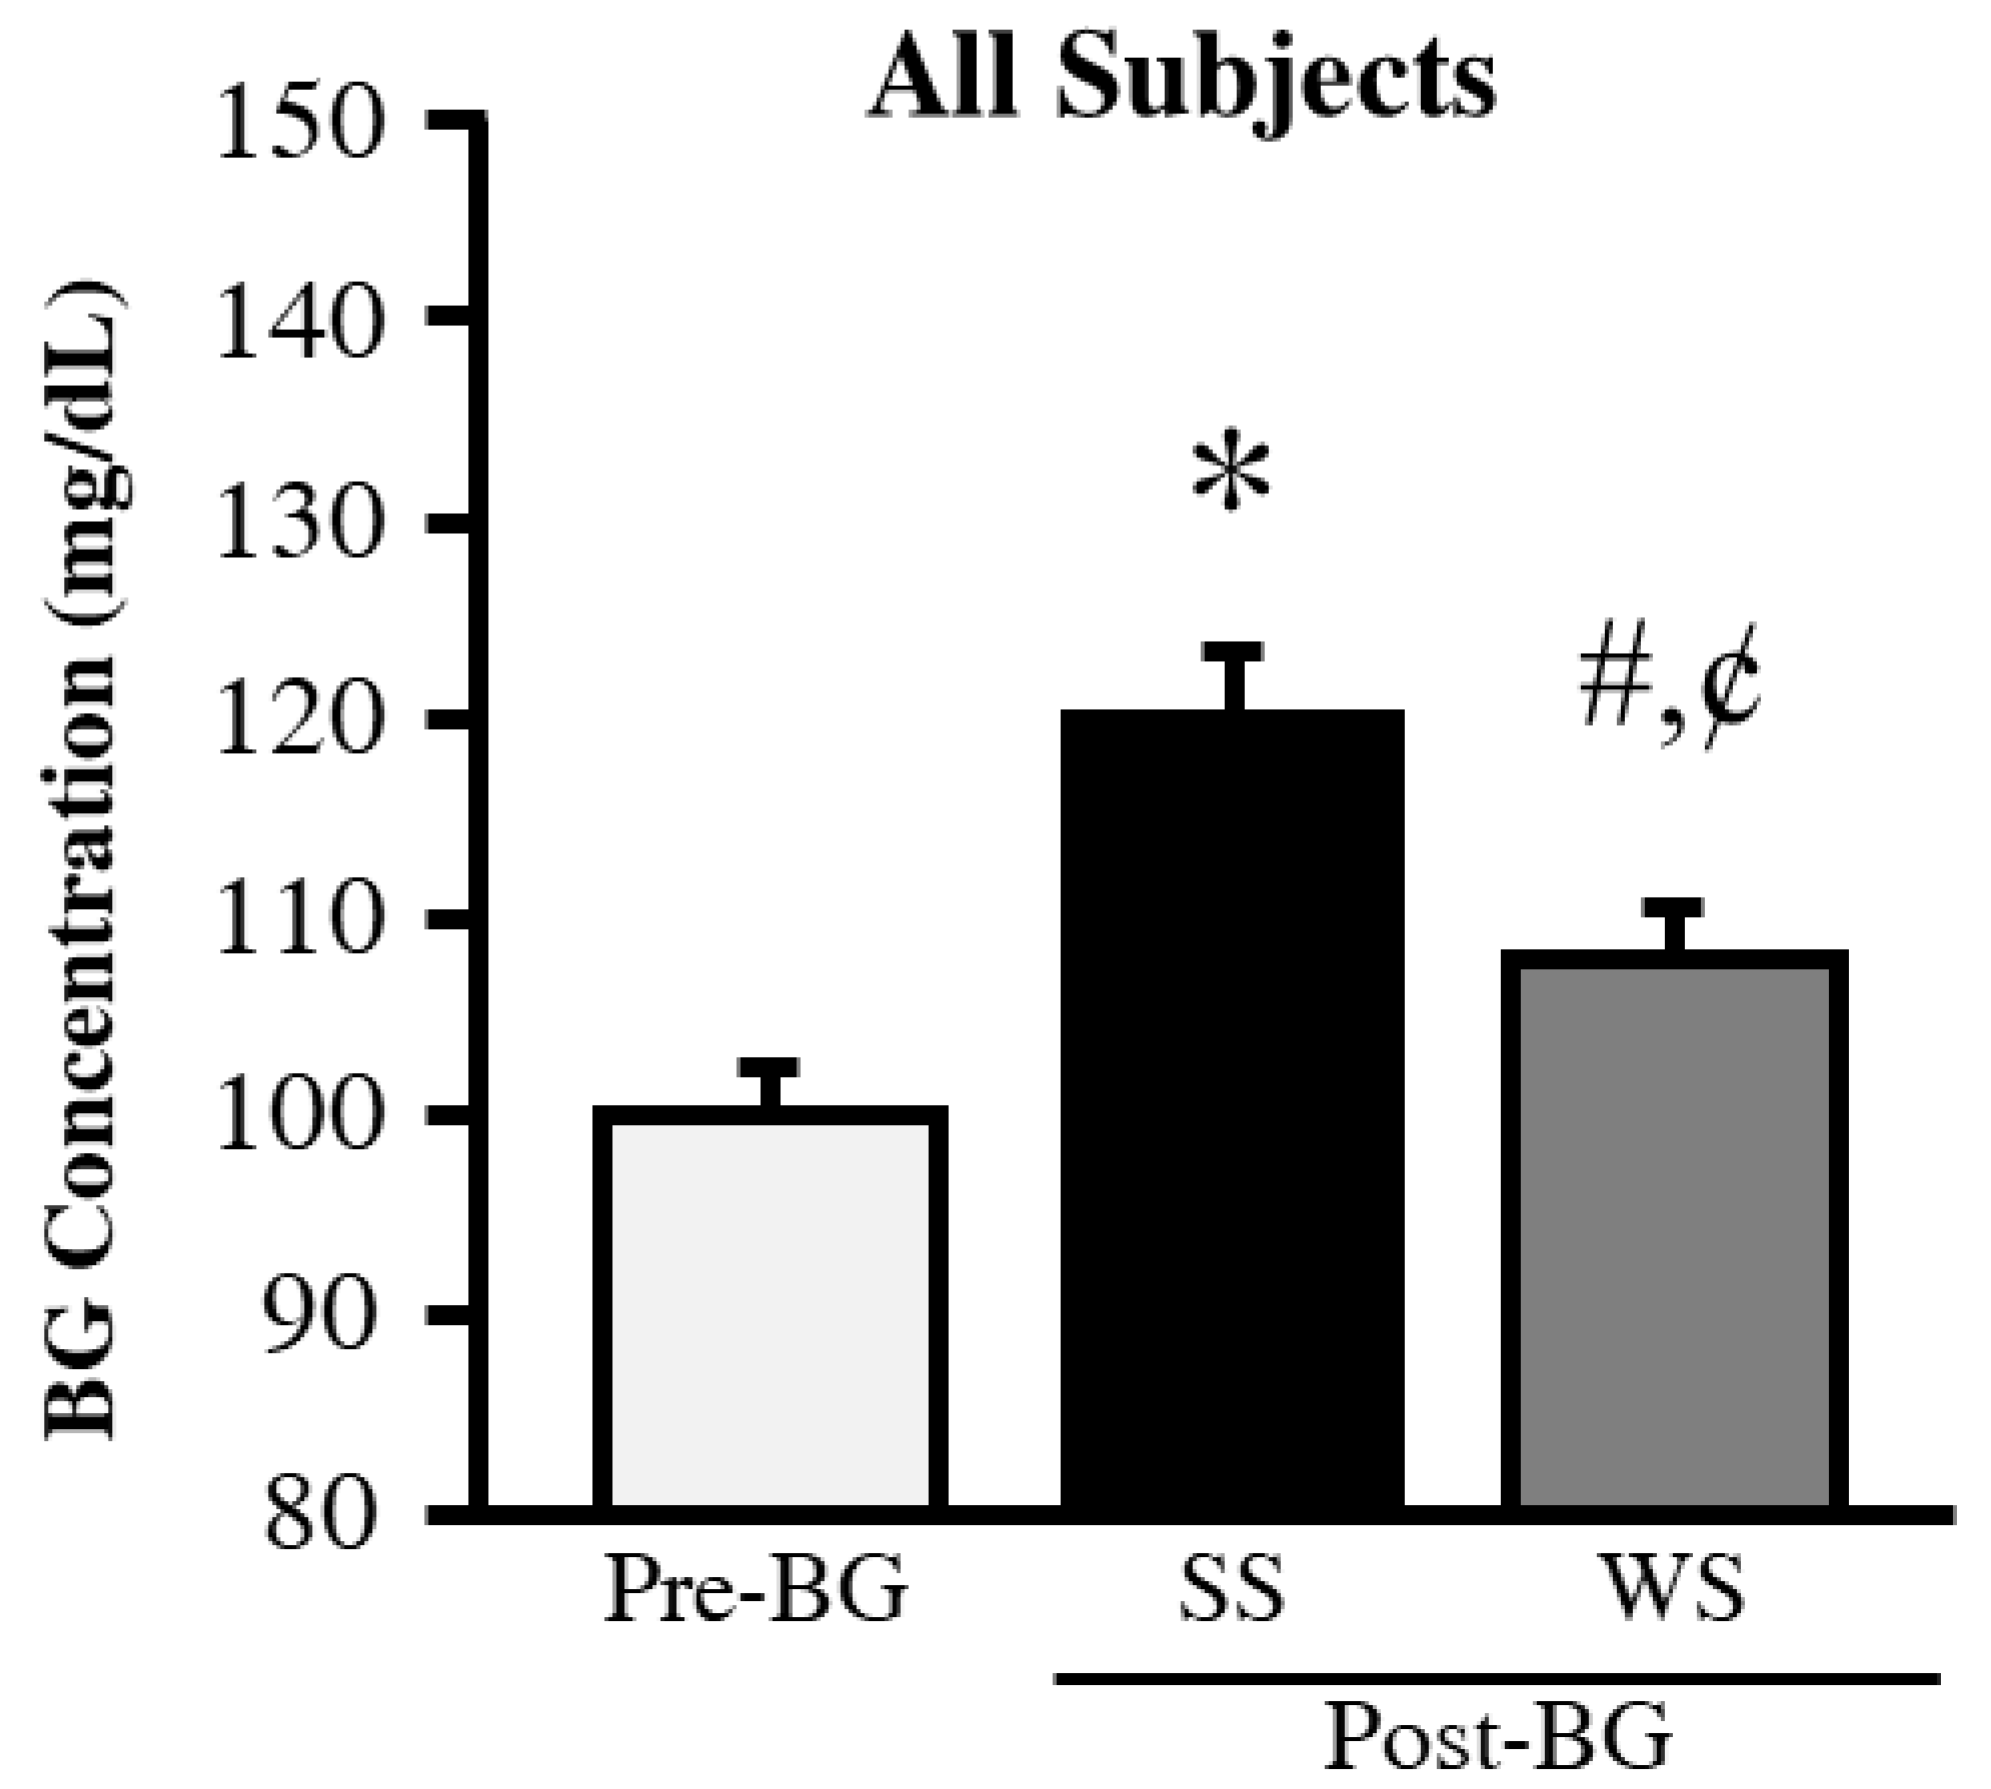
Baseline characteristics data for all the participants are listed in Table 1. PA levels (p < 0.001) and total daily energy expenditure (TDEE, p < 0.01) were significantly higher in the PA compared to the Sed group. The pre-BG concentrations obtained prior to each protocol were not significantly different between the groups. Therefore, to simplify the data for readers’ convenience and to compare both groups, the pre-BG concentrations were adjusted to 100 mg/dL (5.56 mmol/L) and post-BG levels were compared relative to the adjusted pre-BG concentrations. As expected, the SS (p < 0.001) and WS (p < 0.01) protocols produced significantly higher pre- vs. post-BG concentrations (Figure 2). The WS post-BG concentrations were significantly lower than the SS post-BG concentrations (p < 0.01).
Further analysis revealed a significant increase in SS post-BG concentrations in the PA (p < 0.01) and Sed (p < 0.01) groups. The WS post-BG concentrations were significantly higher for the Sed group (p < 0.01) but no change was observed for the PA group (Figure 3).
Correlation analysis revealed that SS (r = −0.499, p = 0.017) and WS post-BG concentrations (r = −0.464, p = 0.028) were significantly associated with past physical activity levels (i.e., number of days per week) (Figure 4a,b). Further, the BG reduction due to walking during the WS protocol was significantly associated with the participants’ BMI (r = −0.471, p = 0.026, Figure 4c). This relationship was much stronger in the PA but not significant (r= −0.577, p = 0.082, Figure 4d) compared to the Sed group (r= −0.410, p = 0.19).
4. Discussion
The main purpose of this study was to investigate the effects of eating a 47 g CHO snack while walking vs. seated rest on BG concentrations in college-aged PA and Sed participants. All participants exhibited a significant increase between pre- vs. post-BG concentrations for the SS protocol (Figure 2). These results were expected and are consistent with previous research [7,16,17] when considering that consuming a 47 g CHO snack in the seated position will not stimulate a significant glucose uptake response [30]. Conversely, in the WS protocol, only in the PA group, post-BG levels showed no change, which is consistent with previous research [9,11,14,15]. This is most likely due to the glucose uptake stimulated by the 30-min walk. Interestingly, the significant increase in post-BG concentrations in the Sed group is possibly due to downregulation of Glucose Transporter 4 (GLUT 4) in skeletal muscles [20,31], greater insulin resistance [10,12,32,33,34], and/or lack of energy metabolism, peroxisome proliferator-activated receptor-γ coactivator-1α (PPARgC1A), gene expression [35]. Overall, these findings suggest that one session of eating while walking may not be sufficient to restore the metabolic insufficiencies associated with a sedentary lifestyle.
Lastly, the correlation analysis revealed a significant effect of BMI and previous history of physical activity on changes in BG levels in response to the 47 g CHO snack. Participants who were more physically active exhibited the lowest post-BG concentrations for both protocols. This finding is most likely due to past physical activity levels stimulating a greater baseline metabolic activity and/or increased GLUT-4 function resulting in greater glucose uptake [13,15,16,35]. The lack of difference between the post-BG concentrations for the WS and SS protocols in individuals with greater BMI was possibly due to the fact that increased BMI increases insulin resistance [30,36], which may lead to reduced glucose uptake. However, it is beyond the scope of this study to determine if this outcome was due to excess glycogen depletion [21,37], decreased skeletal muscle function [20,32,37], or a reduced GLUT-4 mechanism of glucose uptake [12]; therefore, a more in-depth investigation is warranted. On another note, this finding could be, at least partially, due to the difference in ethnic groups [19] between past studies (i.e., American, African American, and Hispanics) compared to the participants in this study (i.e., Middle-Eastern and Asian).
To our knowledge, this is the first study addressing the effects of eating a CHO snack while walking on BG concentrations in PA and Sed individuals. Due to the limitations of facilities and funding, the study had a smaller sample size which limited the comparison based on BMI. Body composition was not measured and this study was restricted to capillary BG measurements in men. Additionally, the data on the snack reported were not confirmed by a centesimal composition measured in the lab. However, the increase in the practice of eating while walking and differences observed in BG concentration between the two protocols in the current study suggest the need for a basic understanding of glucose metabolism during eating while walking. The preliminary data reported in this study can be utilized by other institutes and labs to extensively study the mechanism of eating while walking, especially among the sedentary population.
In summary, lower post-BG concentrations were observed in adult participants after eating 47 g CHO snack during the WS protocol. These results are consistent among PA participants. Conversely, the Sed group exhibited an increase in post-BG concentrations even after the WS protocol. Furthermore, the relationships observed between past history of physical activity, BMI and BG response during eating while walking are intriguing and demand further investigation. Since data are lacking, the primary goal of this study was to establish a foundation for future studies examining the effects of eating while walking on BG concentrations, after consuming a standardized CHO snack within and between PA and Sed individuals.
Supplementary Materials
The following are available online at https://0-www-mdpi-com.brum.beds.ac.uk/2673-396X/1/1/2/s1, Table S1 Nutrition Profile.
Author Contributions
Conceptualization, M.M.S.-A. and J.D.W.; methodology, M.M.S.-A. and J.D.W.; validation, M.M.S.-A., D.S.S., X.L. and J.D.W.; formal analysis, M.M.S.-A. and J.D.W.; investigation, M.M.S.-A. and D.S.S.; resources, J.D.W.; data curation, M.M.S.-A., D.S.S. and X.L.; writing—original draft preparation, M.M.S.-A., D.S.S. and J.D.W.; writing—review and editing, M.M.S.-A. and J.D.W.; visualization, M.M.S.-A.; supervision, J.D.W.; project administration, M.M.S.-A. and D.S.S.; All authors have read and agreed to the published version of the manuscript.
Funding
This study was funded by the Department of Kinesiology, Nutrition and Recreation, Southeast Missouri State University, Cape Girardeau, MO, USA 63701.
Acknowledgments
Authors would like to thank the Departments of Health, Human Performance, and Recreation at Southeast Missouri State University for their support during this study.
Conflicts of Interest
No conflict of interest was declared by all the authors of this study.
References
- Guthrie, J.F.; Lin, B.H.; Frazao, E. Role of food prepared away from home in the American diet, 1977–1978 versus 1994–1996: Changes and consequences. J. Nutr. Educ. Behav. 2002, 34, 140–150. [Google Scholar] [CrossRef]
- Family Food 2012; Department for Environment Food and Rural Affairs: London, UK, 2013.
- Whitehouse, A.; Simon, A.; French, S.A.; Wolfson, J. Availability of snacks, candy and beverages in hospital, community clinic and commercial pharmacies. Public Health Nutr. 2012, 15, 1117–1123. [Google Scholar] [CrossRef] [PubMed] [Green Version]
- Akabas, S.R.; Lederman, S.A.; Moore, B.J. Textbook of Obesity: Biological, Psychological, and Cultural Influences; Wiley-Blackwell: Chichester, West Sussex, UK; Ames, IA, USA, 2012; p. 479. [Google Scholar]
- Cecchini, M.; Sassi, F.; Lauer, J.A.; Lee, Y.Y.; Guajardo-Barron, V.; Chisholm, D. Chronic Diseases: Chronic Diseases and Development 3 Tackling of unhealthy diets, physical inactivity, and obesity: Health effects and cost-effectiveness. Lancet 2010, 376, 1775–1784. [Google Scholar] [CrossRef]
- Eckardt, K.; Taube, A.; Eckel, J. Obesity-associated insulin resistance in skeletal muscle: Role of lipid accumulation and physical inactivity. Rev. Endocr. Metab. Disord. 2011, 12, 163–172. [Google Scholar] [CrossRef]
- Flint, A.; Moller, B.K.; Raben, A.; Pedersen, D.; Tetens, I.; Holst, J.J.; Astrup, A. The use of glycaemic index tables to predict glycaemic index of composite breakfast meals. Br. J. Nutr. 2004, 91, 979–989. [Google Scholar] [CrossRef] [Green Version]
- Jenkins, D.J.; Wolever, T.M.; Taylor, R.H.; Barker, H.; Fielden, H.; Baldwin, J.M.; Bowling, A.C.; Newman, H.C.; Jenkins, A.L.; Goff, D.V. Glycemic index of foods: A physiological basis for carbohydrate exchange. Am. J. Clin. Nutr. 1981, 34, 362–366. [Google Scholar] [CrossRef] [Green Version]
- Farah, N.M.F.; Gill, J.M.R. Effects of exercise before or after meal ingestion on fat balance and postprandial metabolism in overweight men. Br. J. Nutr. 2013, 109, 2297–2307. [Google Scholar] [CrossRef] [Green Version]
- Malin, S.K.; Gerber, R.; Chipkin, S.R.; Braun, B. Independent and combined effects of exercise training and metformin on insulin sensitivity in individuals with prediabetes. Diabetes Care 2012, 35, 131–136. [Google Scholar] [CrossRef] [Green Version]
- Andersen, E.; Hostmark, A.T. Effect of a single bout of resistance exercise on postprandial glucose and insulin response the next day in healthy, strength-trained men. J. Strength Cond. Res. 2007, 21, 487–491. [Google Scholar]
- Ren, J.M.; Semenkovich, C.F.; Gulve, E.A.; Gao, J.P.; Holloszy, J.O. Exercise Induces Rapid Increases in Glut4 Expression, Glucose-Transport Capacity, and Insulin-Stimulated Glycogen-Storage in Muscle. J. Biol. Chem. 1994, 269, 14396–14401. [Google Scholar]
- Bina, D.M.; Anderson, R.L.; Johnson, M.L.; Bergenstal, R.M.; Kendall, D.M. Clinical impact of prandial state, exercise, and site preparation on the equivalence of alternative-site blood glucose testing. Diabetes Care 2003, 26, 981–985. [Google Scholar] [CrossRef] [PubMed] [Green Version]
- Chacko, E. Timing and intensity of exercise for glucose control. Diabetologia 2014, 57, 2425–2426. [Google Scholar] [CrossRef] [PubMed]
- Colberg, S.R.; Hernandez, M.J.; Shahzad, F. Blood Glucose Responses to Type, Intensity, Duration, and Timing of Exercise. Diabetes Care 2013, 36, E177. [Google Scholar] [CrossRef] [PubMed] [Green Version]
- Wolever, T.M. Carbohydrate and the regulation of blood glucose and metabolism. Nutr. Rev. 2003, 61, S40–S48. [Google Scholar] [CrossRef] [PubMed]
- Wolever, T.M.; Vorster, H.H.; Bjorck, I.; Brand-Miller, J.; Brighenti, F.; Mann, J.I.; Ramdath, D.D.; Granfeldt, Y.; Holt, S.; Perry, T.L.; et al. Determination of the glycaemic index of foods: Interlaboratory study. Eur. J. Clin. Nutr. 2003, 57, 475–482. [Google Scholar] [CrossRef] [Green Version]
- Francois, M.E.; Baldi, J.C.; Manning, P.J.; Lucas, S.J.E.; Hawley, J.A.; Williams, M.J.A.; Cotter, J.D. ‘Exercise snacks’ before meals: A novel strategy to improve glycaemic control in individuals with insulin resistance. Diabetologia 2014, 57, 1437–1445. [Google Scholar] [CrossRef]
- Razak, F.; Anand, S.; Vuksan, V.; Davis, B.; Jacobs, R.; Teo, K.K.; Yusuf, S.; Invest, S. Ethnic differences in the relationships between obesity and glucose-metabolic abnormalities: A cross-sectional population-based study. Int. J. Obes. 2005, 29, 656–667. [Google Scholar] [CrossRef] [Green Version]
- Manabe, Y.; Gollisch, K.S.; Holton, L.; Kim, Y.B.; Brandauer, J.; Fujii, N.L.; Hirshman, M.F.; Goodyear, L.J. Exercise training-induced adaptations associated with increases in skeletal muscle glycogen content. FEBS J. 2013, 280, 916–926. [Google Scholar] [CrossRef]
- Essen, B.; Kaijser, L. Regulation of glycolysis in intermittent exercise in man. J. Physiol. 1978, 281, 499–511. [Google Scholar] [CrossRef] [Green Version]
- Strasser, B.; Siebert, U.; Schobersberger, W. Resistance training in the treatment of the metabolic syndrome: A systematic review and meta-analysis of the effect of resistance training on metabolic clustering in patients with abnormal glucose metabolism. Sports Med. 2010, 40, 397–415. [Google Scholar] [CrossRef]
- Williams, M.A.; Haskell, W.L.; Ades, P.A.; Amsterdam, E.A.; Bittner, V.; Franklin, B.A.; Gulanick, M.; Laing, S.T.; Stewart, K.J. Resistance exercise in individuals with and without cardiovascular disease: 2007 update—A scientific statement from the American Heart Association Council on Clinical Cardiology and Council on Nutrition, Physical Activity, and Metabolism. Circulation 2007, 116, 572–584. [Google Scholar] [CrossRef] [PubMed] [Green Version]
- Wu, C.L.; Williams, C. A low glycemic index meal before exercise improves endurance running capacity in men. Int. J. Sport Nutr. Exerc. Metab. 2006, 16, 510–527. [Google Scholar] [CrossRef] [PubMed] [Green Version]
- Ogden, J.; Oikonomou, E.; Alemany, G. Distraction, restrained eating and disinhibition: An experimental study of food intake and the impact of “eating on the go”. J. Health Psychol. 2017, 22, 39–50. [Google Scholar] [CrossRef]
- Chothia, M.Y.; Halperin, M.L.; Rensburg, M.A.; Hassan, M.S.; Davids, M.R. Bolus administration of intravenous glucose in the treatment of hyperkalemia: A randomized controlled trial. Nephron Physiol. 2014, 126, 1–8. [Google Scholar] [CrossRef] [PubMed] [Green Version]
- Borg, G.A. Psychophysical bases of perceived exertion. Med. Sci. Sports Exerc. 1982, 14, 377–381. [Google Scholar] [CrossRef] [PubMed]
- Roza, A.M.; Shizgal, H.M. The Harris Benedict equation reevaluated: Resting energy requirements and the body cell mass. Am. J. Clin. Nutr. 1984, 40, 168–182. [Google Scholar] [CrossRef] [PubMed]
- Mifflin, M.D.; St Jeor, S.T.; Hill, L.A.; Scott, B.J.; Daugherty, S.A.; Koh, Y.O. A new predictive equation for resting energy expenditure in healthy individuals. Am. J. Clin. Nutr. 1990, 51, 241–247. [Google Scholar] [CrossRef]
- Dunstan, D.W.; Kingwell, B.A.; Larsen, R.; Healy, G.N.; Cerin, E.; Hamilton, M.T.; Shaw, J.E.; Bertovic, D.A.; Zimmet, P.Z.; Salmon, J.; et al. Breaking Up Prolonged Sitting Reduces Postprandial Glucose and Insulin Responses. Diabetes Care 2012, 35, 976–983. [Google Scholar] [CrossRef] [Green Version]
- Holmes, B.; Dohm, G.L. Regulation of GLUT4 gene expression during exercise. Med. Sci. Sports Exerc. 2004, 36, 1202–1206. [Google Scholar] [CrossRef]
- Friedrichsen, M.; Mortensen, B.; Pehmoller, C.; Birk, J.B.; Wojtaszewski, J.F. Exercise-induced AMPK activity in skeletal muscle: Role in glucose uptake and insulin sensitivity. Mol. Cell Endocrinol. 2013, 366, 204–214. [Google Scholar] [CrossRef]
- Lee, S.; Bacha, F.; Hannon, T.; Kuk, J.L.; Boesch, C.; Arslanian, S. Effects of Aerobic Versus Resistance Exercise Without Caloric Restriction on Abdominal Fat, Intrahepatic Lipid, and Insulin Sensitivity in Obese Adolescent Boys A Randomized, Controlled Trial. Diabetes 2012, 61, 2787–2795. [Google Scholar] [CrossRef] [PubMed] [Green Version]
- Hamburg, N.M.; McMackin, C.J.; Huang, A.L.; Shenouda, S.M.; Widlansky, M.E.; Schulz, E.; Gokce, N.; Ruderman, N.B.; Keaney, J.F., Jr.; Vita, J.A. Physical inactivity rapidly induces insulin resistance and microvascular dysfunction in healthy volunteers. Arterioscler. Thromb. Vasc. Biol. 2007, 27, 2650–2656. [Google Scholar] [CrossRef] [PubMed] [Green Version]
- Alibegovic, A.C.; Sonne, M.P.; Hojbjerre, L.; Bork-Jensen, J.; Jacobsen, S.; Nilsson, E.; Faerch, K.; Hiscock, N.; Mortensen, B.; Friedrichsen, M.; et al. Insulin resistance induced by physical inactivity is associated with multiple transcriptional changes in skeletal muscle in young men. Am. J. Physiol. Endocrinol. Metab. 2010, 299, E752–E763. [Google Scholar] [CrossRef] [PubMed] [Green Version]
- Gannon, M.C.; Nuttall, F.Q. Factors affecting interpretation of postprandial glucose and insulin areas. Diabetes Care 1987, 10, 759–763. [Google Scholar] [CrossRef] [PubMed]
- Crowther, G.J.; Kemper, W.F.; Carey, M.F.; Conley, K.E. Control of glycolysis in contracting skeletal muscle. II. Turning it off. Am. J. Physiol. Endocrinol. Metab. 2002, 282, E74–E79. [Google Scholar] [CrossRef] [PubMed] [Green Version]
Figure 1.
Experimental protocol design. * blood glucose measurements

Figure 2.
Blood glucose concentrations. Data for BG are reported in mg/dL (for BG, 100 mg/dL = 5.56 mmol/L). * Different from Pre-BG (p < 0.001). # Different from Pre-BG (p < 0.01). ¢ Different from SS (p < 0.01). BG = blood glucose, SS = 60 min after eating while sitting for 30 min, WS = 60 min after eating while walking for 30 min.

Figure 3.
Blood glucose concentrations in PA and Sed participants. Data for BG are reported in mg/dL (for BG, 100 mg/dL = 5.56 mmol/L). * Different from PA Pre-BG (p < 0.01). † Different from PA Post-BG (WS) protocol (p < 0.05). # Different from Sed Pre-BG (p < 0.01). BG = blood glucose, PA = physically active, Sed = Sedentary, SS = 60 min after eating while sitting for 30 min, WS = 60 min after eating while walking for 30 min.

Figure 4.
Relationship between PA and BMI to post-BG concentrations. BG change was calculated by using the following formula: post-BG (SS)−post-BG (WS).
Figure 4.
Relationship between PA and BMI to post-BG concentrations. BG change was calculated by using the following formula: post-BG (SS)−post-BG (WS).


Table 1.
Baseline participant characteristics
| Participant | Physically Active (n =10) | Sedentary (n = 12) | p-Value |
|---|---|---|---|
| Age (years) | 23.4 ± 1.4 | 23.4 ± 1.1 | 0.992 |
| Height (meters) | 1.72 ± 0.02 | 1.73 ± 0.02 | 0.617 |
| Weight (kg) | 70.0 ± 4.0 | 71.1 ± 4.1 | 0.866 |
| BMI (kg/m2) | 23.7 ± 1.4 | 23.8 ± 1.6 | 0.990 |
| Level of Physical Activity (days/week) | 4.10 ± 0.74 | 0.00 ± 0.00 | <0.001 |
| Level of Physical Activity (hours/day) | 2.20 ± 0.36 | 0.00 ± 0.00 | <0.001 |
| Basal Metabolic Rate (kcal/day) | 1725 ± 49 | 1746 ± 62 | 0.805 |
| Resting Metabolic Rate (kcal/day) | 1662 ± 36 | 1680 ± 46 | 0.768 |
| Total Daily Energy Expenditure (kcal/day) | 2455 ± 67 | 2059 ± 74 | 0.002 |
Data are represented in mean ± SEM. Basal metabolic rate (BMR) was calculated using the Harris–Benedict equation [28], resting metabolic rate was calculated using the Mifflin St. Jeor equation [29], and total daily energy expenditure was calculated by multiplying BMR with the Harris–Benedict activity factor.
© 2020 by the authors. Licensee MDPI, Basel, Switzerland. This article is an open access article distributed under the terms and conditions of the Creative Commons Attribution (CC BY) license (http://creativecommons.org/licenses/by/4.0/).
Share and Cite
MDPI and ACS Style
Syed-Abdul, M.M.; Soni, D.S.; Liu, X.; Wagganer, J.D. Effects of Eating While Walking on Blood Glucose Concentrations. Endocrines 2020, 1, 13-21. https://0-doi-org.brum.beds.ac.uk/10.3390/endocrines1010002
AMA Style
Syed-Abdul MM, Soni DS, Liu X, Wagganer JD. Effects of Eating While Walking on Blood Glucose Concentrations. Endocrines. 2020; 1(1):13-21. https://0-doi-org.brum.beds.ac.uk/10.3390/endocrines1010002
Chicago/Turabian StyleSyed-Abdul, Majid Mufaqam, Dhwani Satishkumar Soni, Xin Liu, and Jason Daniel Wagganer. 2020. "Effects of Eating While Walking on Blood Glucose Concentrations" Endocrines 1, no. 1: 13-21. https://0-doi-org.brum.beds.ac.uk/10.3390/endocrines1010002