A Comparative Analysis of Septage Management in Five Cities in the Philippines
by
 ,
,
Dalton Erick Baltazar
1,*, 
Hidenori Harada
2,
Shigeo Fujii
2,
Maria Francesca Tan
3 and
Shatirah Akib
4 1
School of Animal, Rural, and Environmental Sciences, Brackenhurst Campus, Nottingham Trent University, Brackenhurst Ln, Southwell NG25 0QF, UK
2
Environmentally-Friendly Industries for Sustainable Development Laboratory, Graduate School of Global Environmental Studies, Kyoto University, Yoshidahonmachi, Sakyo Ward, Kyoto 606-8501, Japan
3
Community Innovations Studies Center, College of Public Affairs and Development, University of the Philippines Los Banos, Los Baños, Laguna 4031, Philippines
4
Department of Civil Engineering, School of Architecture, Design and the Built Environment, Nottingham Trent University, Nottingham NG1 4FQ, UK
*
Author to whom correspondence should be addressed.
Eng 2021, 2(1), 12-26; https://0-doi-org.brum.beds.ac.uk/10.3390/eng2010002
Submission received: 3 December 2020
/
Revised: 25 January 2021
/
Accepted: 25 January 2021
/
Published: 30 January 2021
(This article belongs to the Special Issue Advanced Research in Hydraulics and Water Engineering)
Abstract
:This study assessed and compared septage management systems in Baliwag, Calamba, Muntinlupa, Pasig, and San Fernando, the Philippines, using fecal waste flow diagrams and service delivery scorecards. According to the fecal waste flow diagrams, San Fernando is the most successful in preventing its environment’s pollution. It is followed by Baliwag, Muntinlupa, and Pasig. In Calamba, all of the fecal waste is disposed of to the environment. According to the scorecards, Pasig has the most efficient septage management service, followed by San Fernando, Baliwag, Muntinlupa, and Calamba. Among the five areas, San Fernando can be considered to have the most efficient septage management system as it had the best fecal waste flow diagram and second highest ratings in the service delivery scorecard. It might have been an advantage that the city itself is managing the whole system—from implementing rules for septic tank plans, to the collection, treatment, and disposal of septage.
1. Introduction
In 2000, the United Nations (UN) crafted eight Millennium Development Goals (MDGs) to battle the multiple poverty dimensions. One of the targets of the seventh goal (Ensure Environmental Sustainability) is “to halve, by 2015, the proportion of the population without sustainable access to safe drinking water and basic sanitation.” Based on the 2015 Millennium Development Goals Report [1], “147 countries have met the drinking water target, 95 countries have met the sanitation target, and 77 countries have met both.” Despite this progress, two billion people still lack basic sanitation services [2]. As defined by the UN (2012), an improved sanitation facility is a facility that hygienically separates human excreta from human, animal, and insect contact. As a response, in September 2015, the UN created the 17 Sustainable Development Goals (SDGs) with one goal focusing on access to water and sanitation—sixth goal [3]. One of its targets is “by 2030, to achieve access to adequate and equitable sanitation and hygiene for all and end open defecation, paying special attention to the needs of women and girls and those in vulnerable situations.” Unlike the MDG which only used the proportion of the population with improved toilet facilities as an indicator, SGD will be using the percentage of wastewater (sewage and fecal sludge) safely treated as an indicator, giving importance to fecal sludge management [4].
For developing countries to improve their sanitation conditions, they would have to choose between two sanitation systems: centralized and decentralized. Centralized systems convey wastewater to a central location for treatment and disposal. It is the case where households (HHs) are connected to a network of pipes directed to a central wastewater treatment facility. These systems could provide a complete treatment of wastewater, but are costly because of pipe network construction, energy requirements, and other engineering interventions that they require [5,6]. This is the main reason why most developing countries use decentralized systems that treat and dispose of wastewater onsite or near the point of generation [7]. One of the most commonly used decentralized systems is the septic tank, a settling tank where toilet wastewater is temporarily stored. Compared to centralized systems, septic tanks are cheaper and have a simpler design [8]. However, one problem is that septic tank design in developing countries does not usually include a leach field—a series of trenches where the water from the tank is further treated as it slowly seeps through the soil. When the tanks get full, a part of the contents drains directly to nearby canals or water bodies, posing health and environmental risks. A solution is to desludge the septic tanks regularly and to treat the collected septage. Septage is the partially decomposed fecal waste in a septic tank.
An emerging problem now in developing countries is that more and more HHs are using septic tanks, but septage management systems to desludge tanks and to treat collected septage are not well established. This results in a very small percentage of septage treated effectively and a considerable percentage of septage disposed of into the environment, leading to water pollution and health problems.
In the Philippines, only 10% of the 98 million people are connected to a piped sewerage, and 84% of the population is disposing toilet wastewater to septic tanks. The inconvenient fact is that only 30% of septage is treated in Metro Manila, and only 5% outside Metro Manila [9]. Based on USAID and the Philippine Department of Interior and Local Government (DILG) assessment in 2007, more than 11,338 Filipinos die yearly from diarrhea and about 55 daily from all water-borne diseases [10]. Moreover, up to 58% of groundwater is contaminated with coliform, and 64% of rivers fail water quality standards (mainly coliform and BOD) for Class C water (for fisheries, agriculture, or recreational activities). These are several reasons why, in 2013, the Philippines implemented a national strategy for sewage and septage management that requires local government units (LGUs) to establish septage management systems [11]. To guide these LGUs in deciding the appropriate septage management system for them, it is of great significance to assess and understand existing systems’ strengths and weaknesses.
Several tools have been developed to assess the overall state of sanitation in an area (e.g., SaniPath, Urban Sanitation Status Index), but only a few have been devised to focus on septage management. For example, the SaniPath Tool (developed by Emory University) is designed to evaluate public health risks from poor sanitation to better plan sanitation investments [12]. The Urban Sanitation Status Index, on the other hand, is used to measure the sanitation status of the lowest administrative unit within a city, through several indicators [13]. This research hopes to provide insights on the usefulness and limitations of adapted versions of two World Bank Water and Sanitation Program (WSP) tools, Fecal Waste Flow Diagram and Service Delivery Scorecard, developed by Peal et al. in 2014 [14] to assess septage management specifically. The Fecal Waste Flow Diagram is now named Shit Flow Diagram by a promotion initiative managed by Deutsche Gesellschaft für Internationale Zusammenarbeit (GIZ) under the umbrella of the Sustainable Sanitation Alliance (SuSanA) [15].
This study aimed to (1) assess and compare existing septage management systems in the municipality of Baliwag, Bulacan and the cities of Calamba, Muntinlupa, Pasig, and San Fernando; (2) determine the configuration of factors leading to the success or failure of the septage management systems; and (3) propose interventions for improving the septage management systems.
2. Materials and Methods
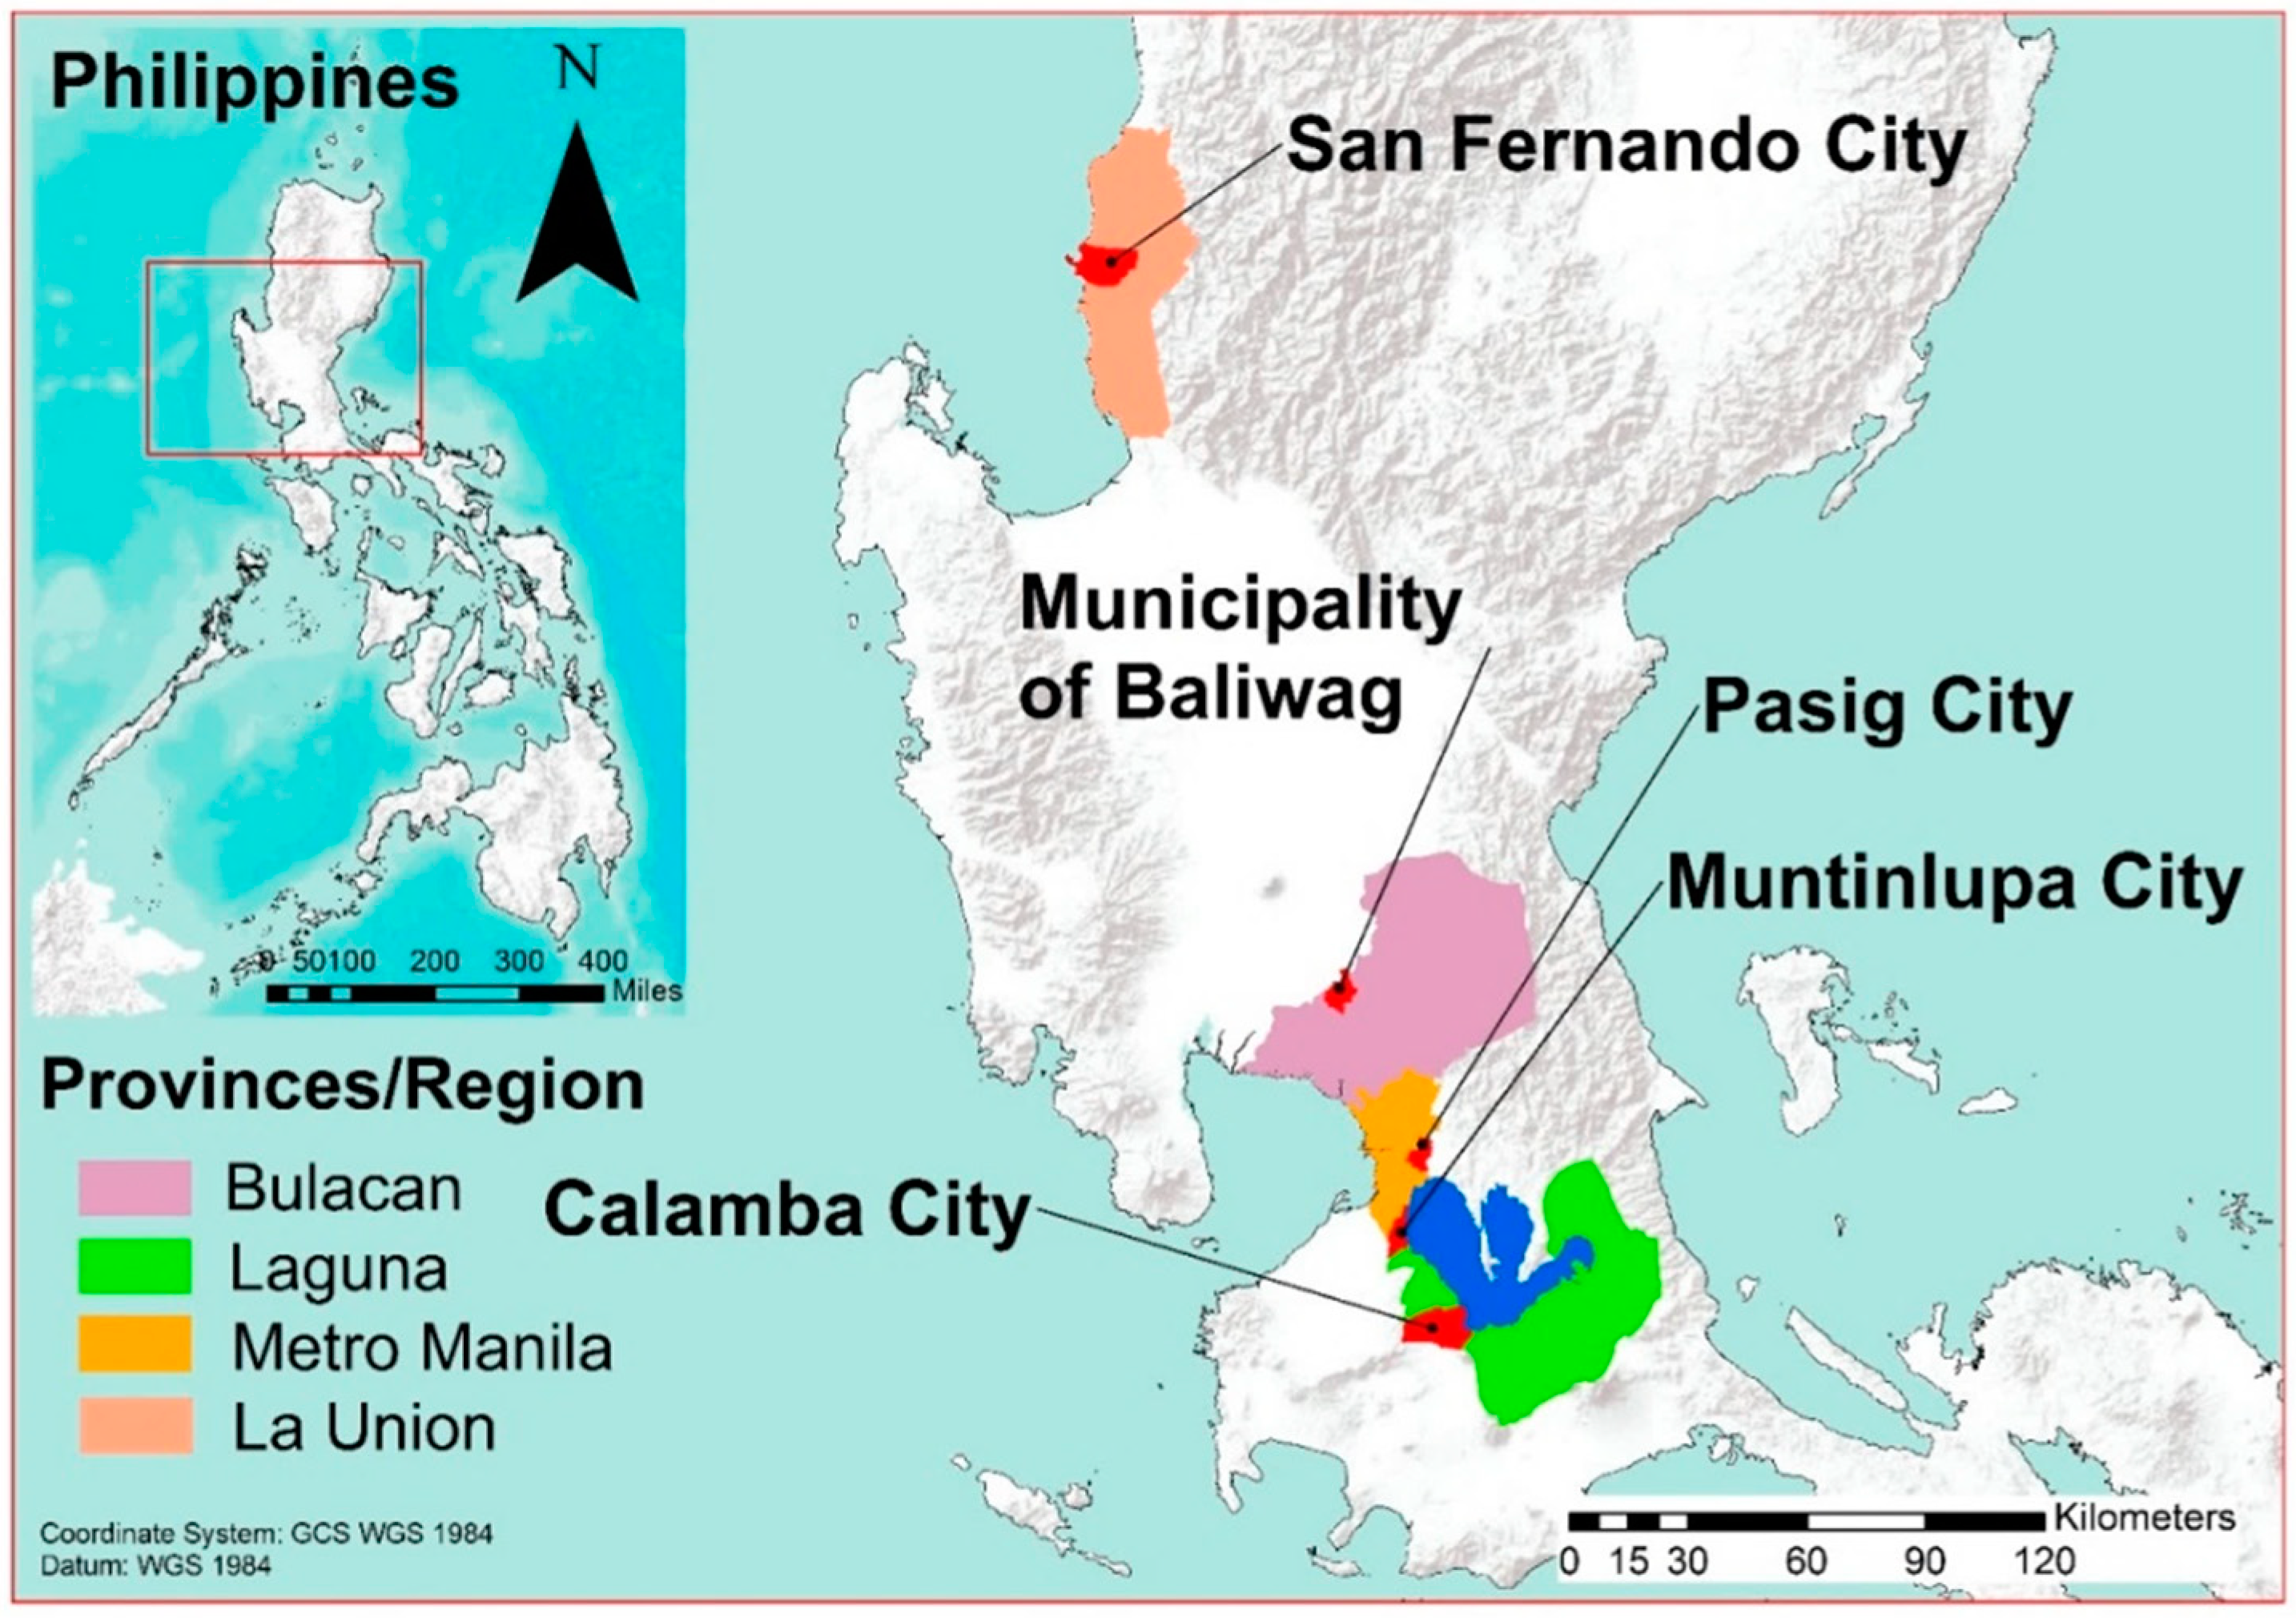
2.1. Location and Description of the Study Areas
This study was conducted in the municipality of Baliwag, and the cities of Calamba, Muntinlupa, Pasig, and San Fernando (Figure 1). These areas were chosen to represent septage management systems managed differently—Baliwag: water district; Calamba: no specific unit; Muntinlupa: Maynilad Water Services Inc. (MWSI); Pasig: Manila Water Company Inc. (MWCI) [15]; and San Fernando: city office. All the study areas are located in the northern group of Philippine islands called Luzon. Other characteristics of the study areas are presented in Table 1.
2.2. Fecal Waste Flow Diagram
Peal et al. (2014) [14] described two tools that can be used in assessing septage management in a city: the Fecal Waste Diagram and the Service Delivery Assessment (SDA) scorecard. These tools are presently used by the World Bank’s Water and Sanitation Program (WSP) to compare septage management in cities across developing countries [18]. In this study, these tools were modified to increase their assessment efficiency.
The first tool, Fecal Waste Flow Diagram, was used to visualize the overall flow of fecal waste in the study areas. It categorizes fecal wastes into safely managed and unsafely managed. Safely managed fecal wastes are those that have been properly collected, transported, and reused or disposed of. This safely managed fecal waste can be represented by the proportion of the population (a) connected to a central sewerage system, (b) having septic tanks desludged by a company with a septage treatment facility, and (c) utilizing closed pits. Unsafely managed fecal wastes are directly or eventually disposed of to residential environment, drainage systems, and water bodies. These can be represented by the proportion of the population (a) having septic tanks desludged by a company without a septage treatment facility, (b) desludging their septic tanks by themselves, (c) abandoning their septic tanks when full, (d) utilizing open pits, (e) disposing directly to drainage canals and rivers, and (f) practicing open defecation. These sets of information were acquired through a specific department in municipal/city offices, i.e., Sanitation Department, Water District or sanitation reports produced by the municipal/city offices. These proportions were then transformed into a diagram, modifying the layout proposed by Peal et al. (2014) [14]. Fecal waste containment mechanisms were specified into septic tanks, open and closed pits, pail system, and others according to available information unlike in Peal’s layout in which all the containment mechanisms were aggregated into a single “onsite facility” unit.
2.3. Service Delivery Assessment Scorecard
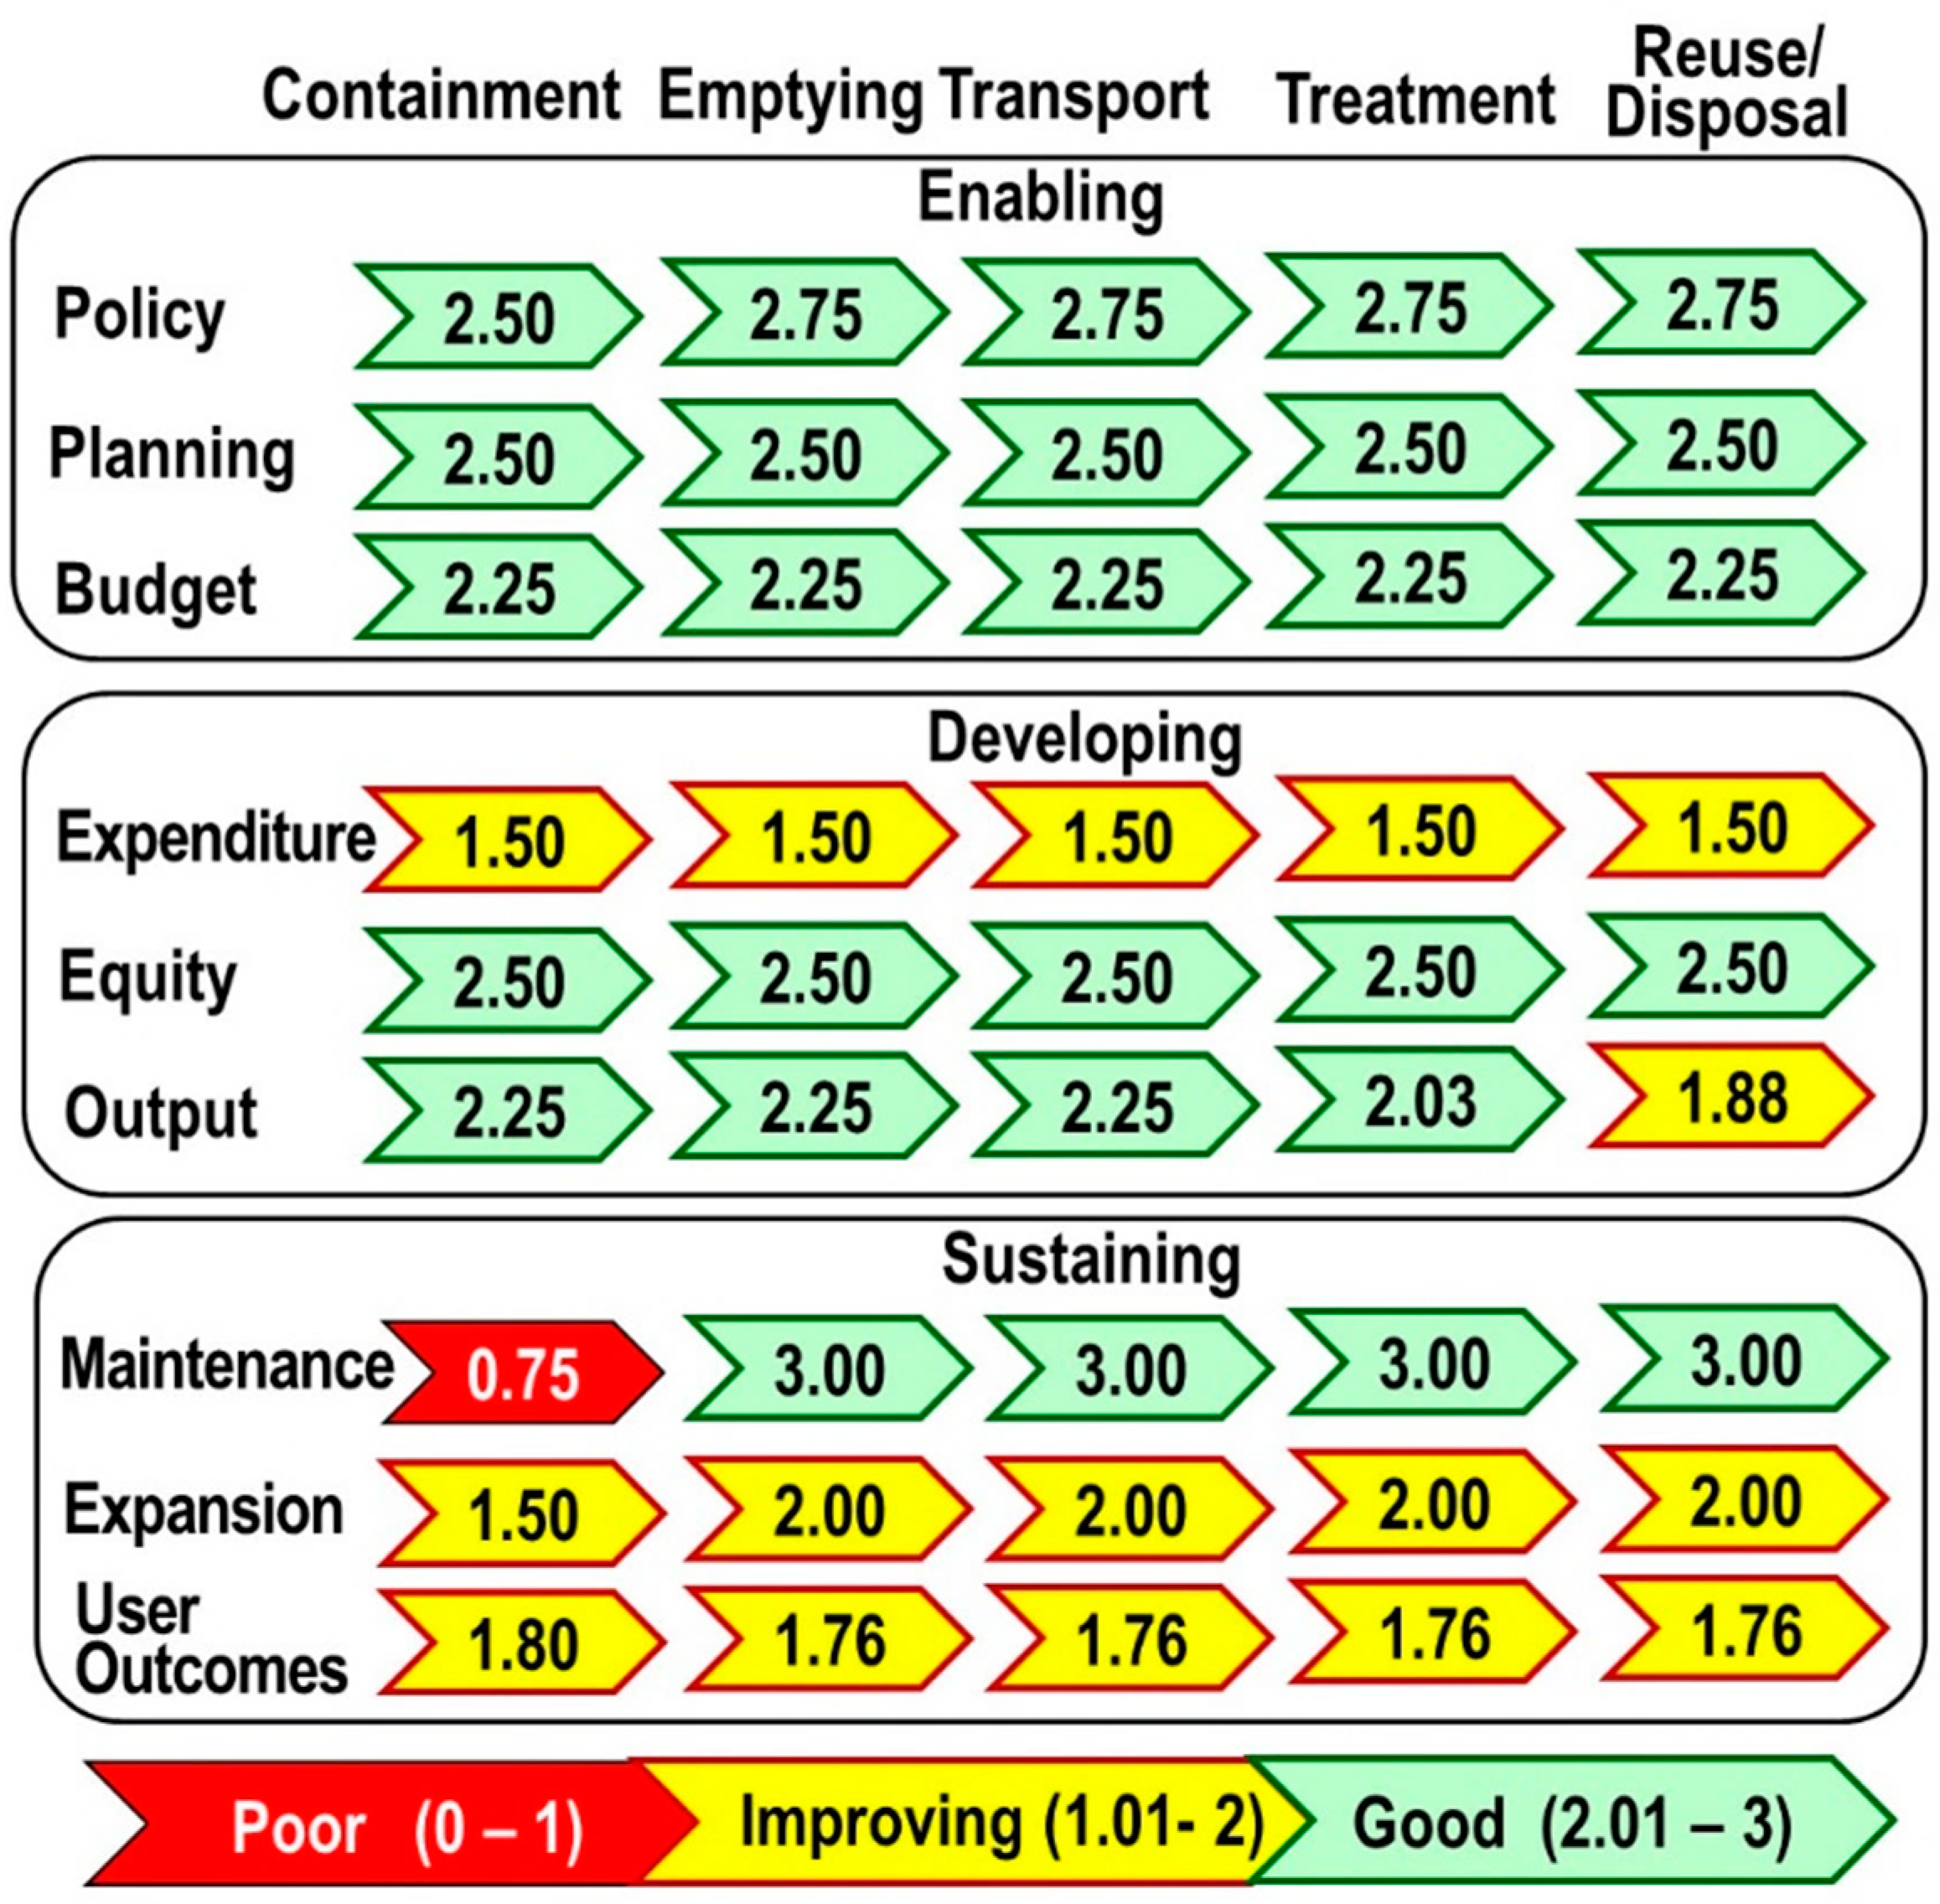
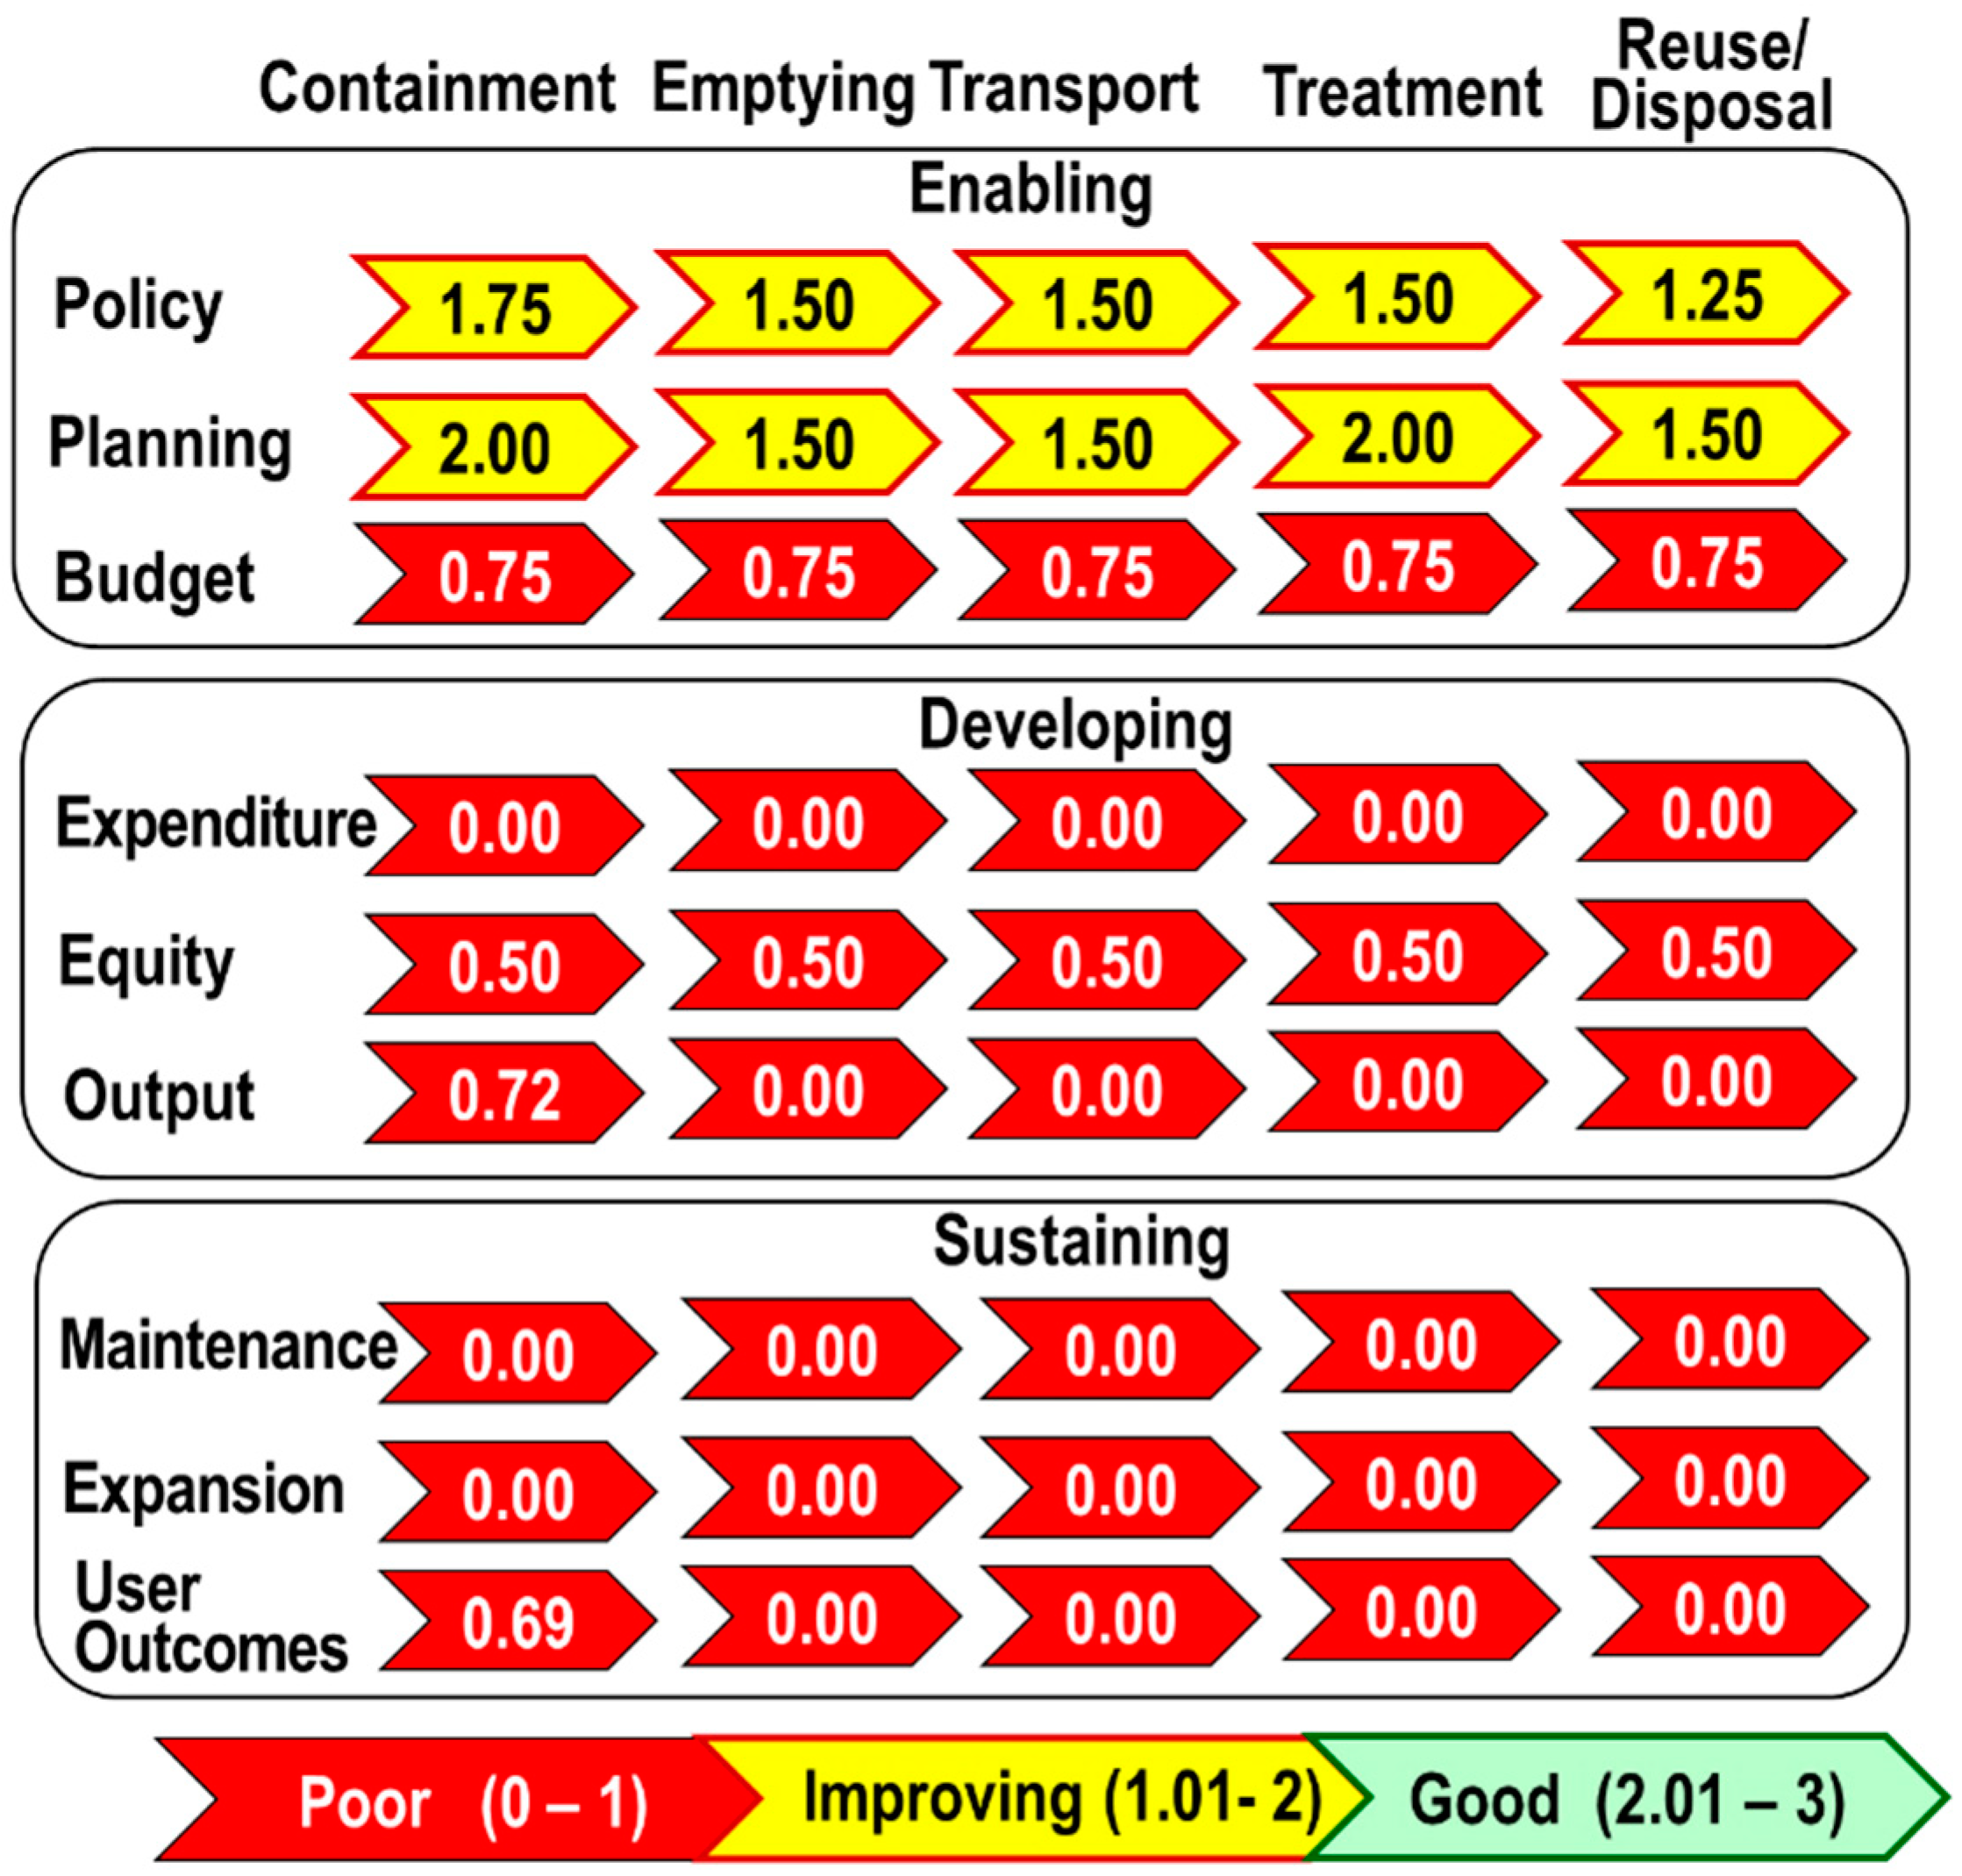
The second tool, SDA scorecard was used to understand why septage management is working well or is neglected in the study areas. The SDA scorecard analyzes three pillars for an effective septage management strategy: enabling environment, development of services, and sustainability of service. These three pillars are further divided into building blocks. These building blocks are analyzed in each of the stages of the septage management service chain using a set of questions to become a matrix of scores (Table 2). The questions for each building block are provided in the supplementary materials (Table S1). For this study, a question that reflects the population’s willingness to receive and pay for the service was added in the policy building block to emphasize the importance of service consumers’ attitude towards effective service delivery. Score descriptions were also developed for each question to standardize the scoring procedure (Supplementary Materials, Table S2). A score of zero (indicating no progress or poor performance), 0.5 (intermediate performance), or 1 (indicating good performance) was given for each question except for D1-1, S3-1, and S3-2. Question D1-1 required the percentage of annual budget spent for septage management, S3-1 required the percentage of safely managed septage from the fecal waste flow diagram, and S3-2 required the percentage of low-income communities served by the septage management service. The overall score for each building block was then computed by taking the average of the block’s scores and scaling it from 0 to 3. The rescaling was accomplished using the formula:
where Xnew = new value, Xold = old value, A = old minimum value (0), B = old maximum value (1), C = new minimum value (0), and D = new maximum value (3). To highlight the scores, they were colored red (0–1.00, poor), yellow (1.01–2.00, improving), and green (2.01–3.00, good). The scores were decided through documents from the service provider and a series of interviews with the heads of city office departments: Administration, City Planning and Development Office, Budget Management Office, City Environment and Natural Resources Office, and Engineering and Infrastructure Development Department.
3. Results and Discussion
3.1. The Five Septage Management Systems
Baliwag. Septage management in the municipality of Baliwag is handled by Baliwag Water District (BWD). A local septage management ordinance was created in 2009 to designate BWD to operate and manage the system (following the provisions of the Presidential Decree 198) [19]. BWD started its desludging service in 2013. The municipality was divided into five zones, and the desludging cycle was set to five years. BWD targets to finish one zone per year. HHs pay for the service through a fixed charge of 10% in their water bills. BWD currently has two 5-m3 vacuum trucks and operates one treatment facility with 30 m3/day capacity. The current utilization of the facility is 70%.
Calamba. The city passed a septage management ordinance in 2009. The ordinance called for establishing a sewage and septage management system in the city, giving a significant role to the water district. Unfortunately, due to insufficient funds, the establishment of the system did not push through [20]. For this reason, people, up to the present, rely on the service of private desludging companies to desludge clogged septic tanks. The service costs from around PhP 3000 to PhP 4500 (~USD 63.30–94.95). These companies do not have treatment facilities and dispose of collected septage into drainage canals or water bodies. There were several cases when these companies were penalized because they were caught disposing collected septage into a river or a lake (The Philippine Star, 2013) [21].
Muntinlupa. MWSI manages septage collection, treatment, and disposal in Muntinlupa City. The city does not have a local ordinance for septage management. MWSI started its desludging service in the western side of Metropolitan Manila in 2009. The desludging cycle is every three to five years. HHs pay for the service through a fixed 20% environmental charge (for desludging and other environment-related costs) in their water bills. MWSI now has 25 vacuum tankers and two septage treatment facilities with a total capacity of 700 m3/day (MWSS, 2012) [22].
Pasig. MWCI manages the collection, treatment, and disposal of septage in Pasig City. The city septage management ordinance was passed in 2008. MWCI started its desludging service in 1997 with a cycle of three to five years. Similar to MWSI, HHs pay for the service through a 20% environmental charge (for desludging and other environment-related costs) in their water bills. MWCI currently has 78 vacuum trucks and two septage treatment facilities with a total capacity of 1400 m3/day (MWSS, 2012) [23].
San Fernando. The city office manages septage management in San Fernando. The septage management ordinance in the city was passed in 2010. The city also started its desludging service in 2013 with a cycle of five years. Service consumers pay for the service through a fixed amount added to their real property tax, which is paid annually: (1) Residential buildings: PhP 600.00 (~USD 12.66), (2) Commercial Establishments (excluding malls): PhP 1000.00 (~USD 21.10), (3) Malls and Institutions: PhP 1500.00 (~USD 31.65), and (4) Industrial Establishments: PhP 2000.00 (~USD 42.20). The city currently uses one vacuum truck for desludging and manages a treatment facility with a capacity of 30 m3/day. According to the City Environment and Natural Resources Office (2015) [24], the facility’s utilization is 100%.
3.2. Fecal Waste Flow Diagrams
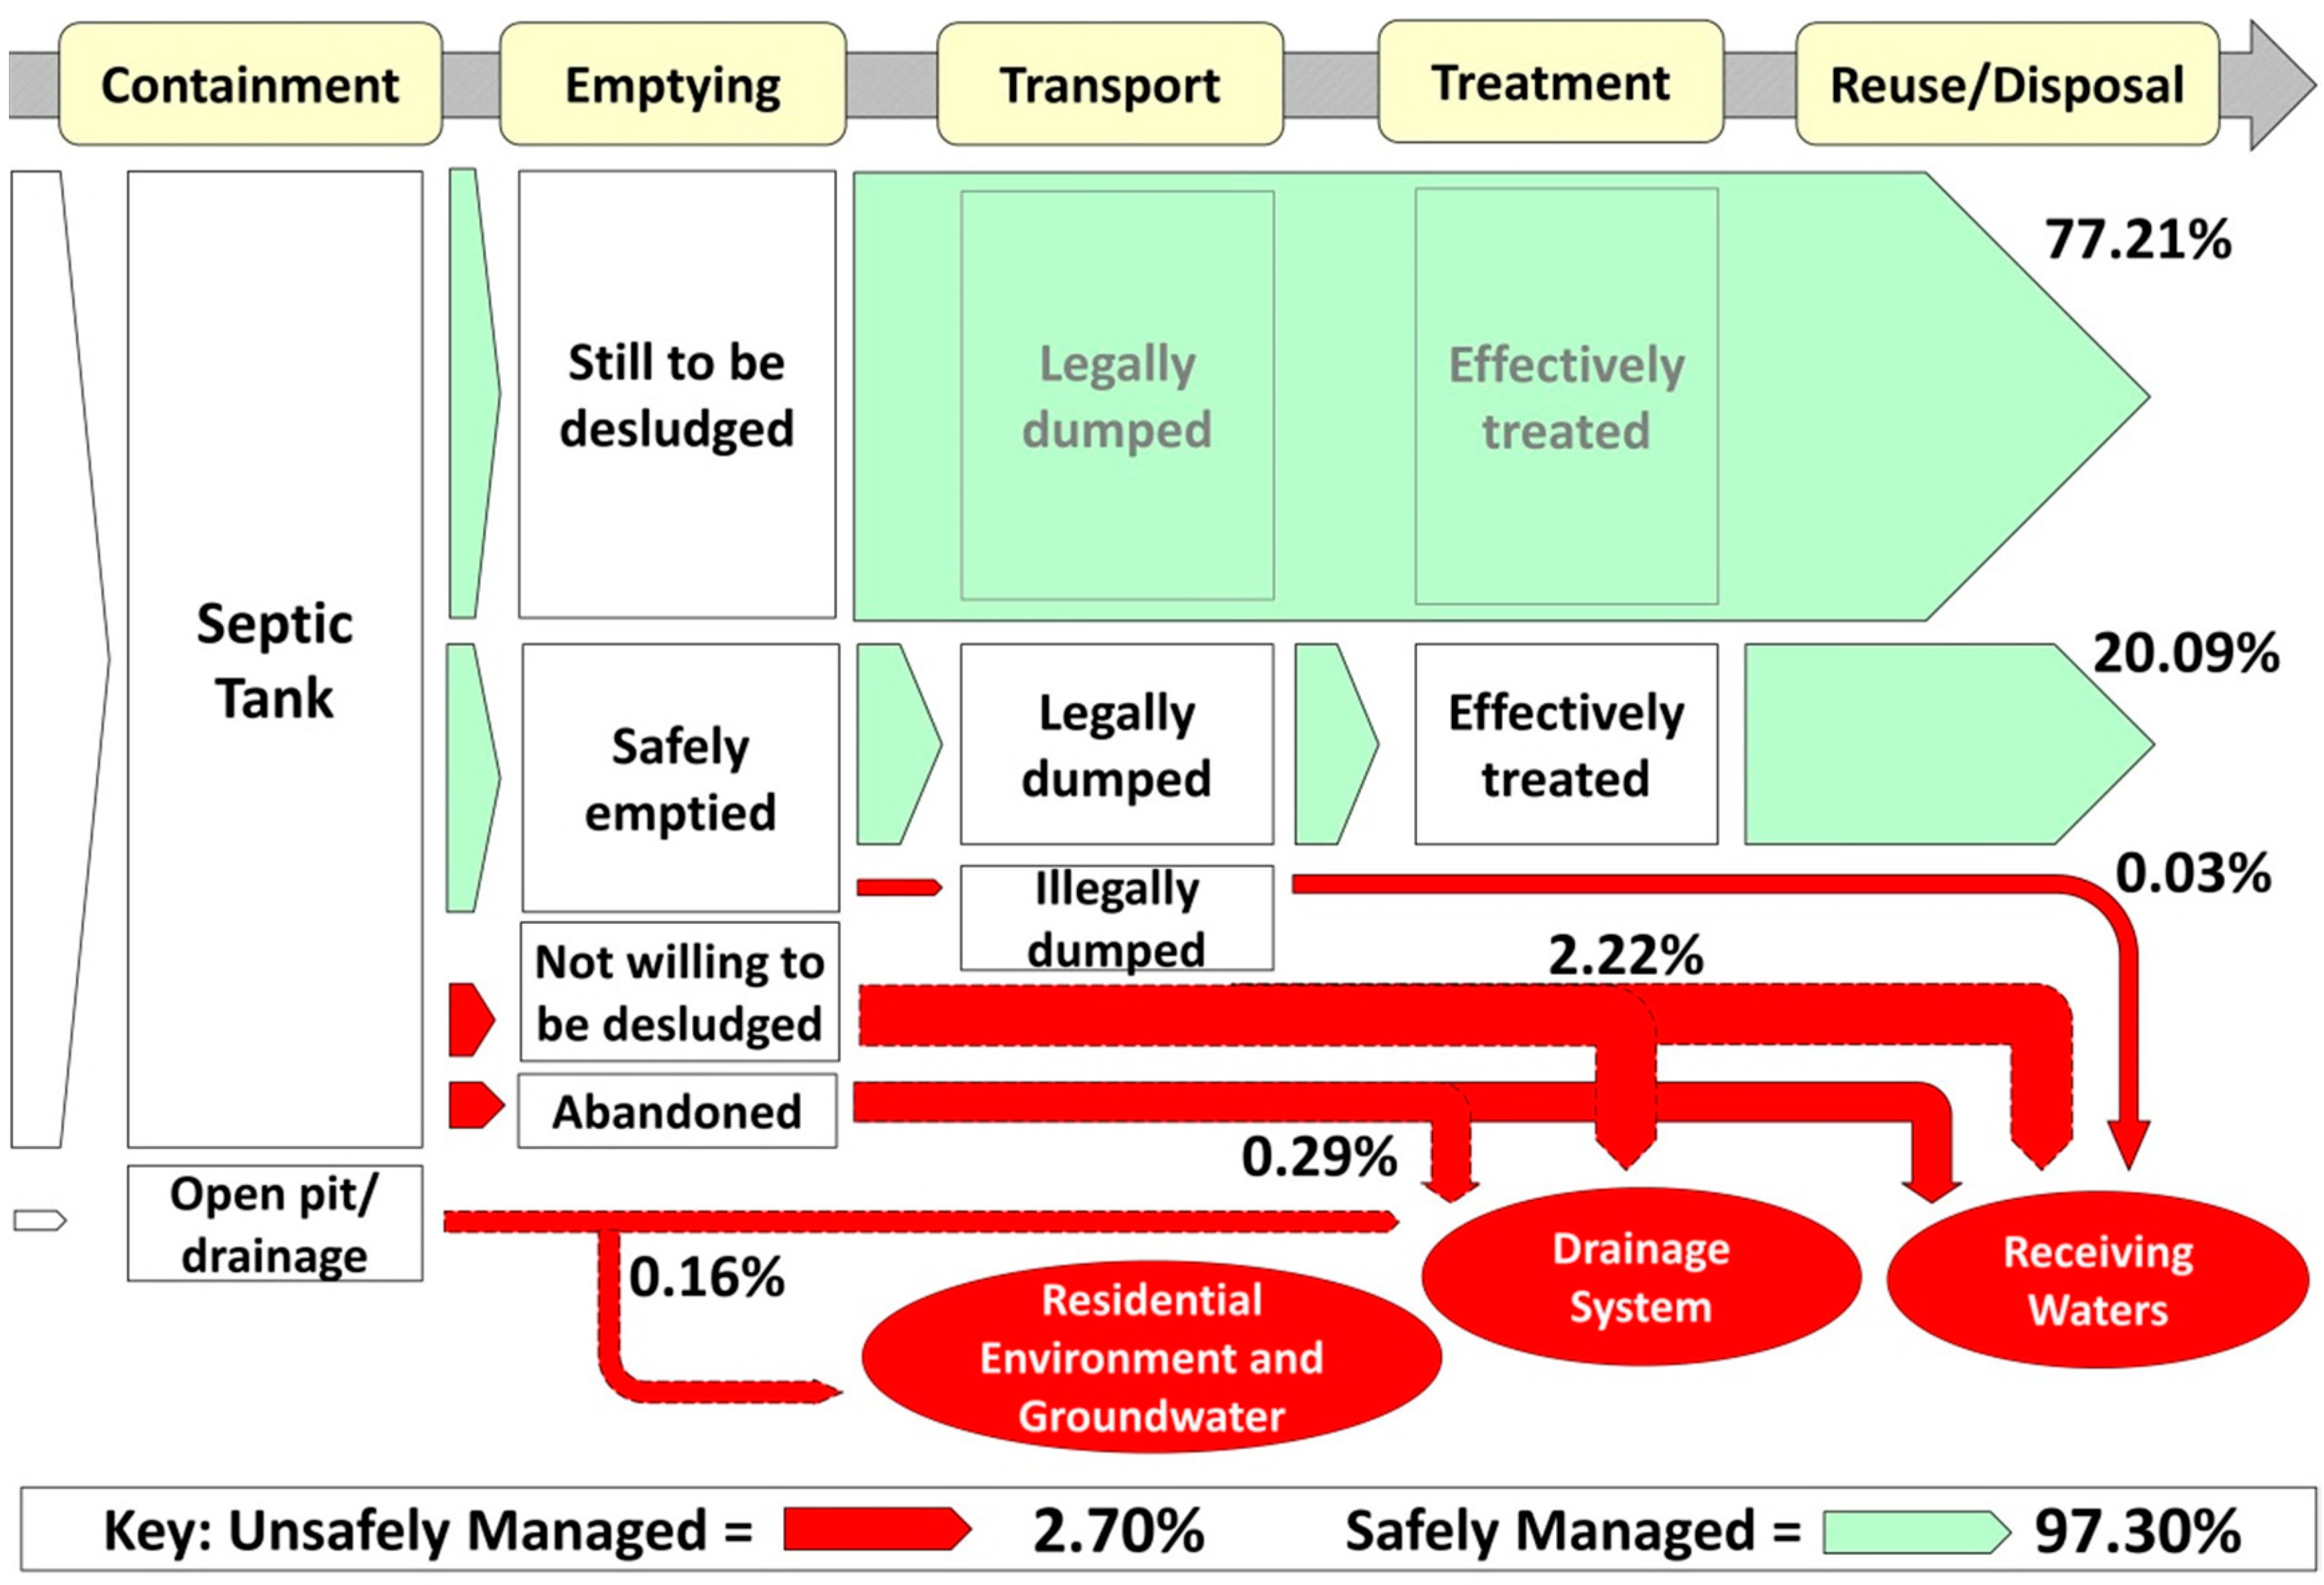
The data obtained from BWD is shown in Table 3, and Baliwag’s fecal waste flow diagram is presented in Figure 2. The data from BWD contained a percentage of HHs who have already paid for the service but have not availed it yet (77.21%). It was assumed in this study that the water district could desludge all the septic tanks of these HHs on time, eliminating the possibility of them hiring a private siphoning company or abandoning the tanks. The diagram shows a higher percentage of septage managed safely due to the high coverage of BWD’s desludging service. A very small proportion (0.03%) of HHs still opted to avail the service of a private siphoning company in the area. The 2.70% of unsafely managed septage come from HHs who (a) were not willing to have their septic tanks desludged, (b) abandoned clogged septic tanks, and (c) used open pits or disposed septage directly to drainage canals.
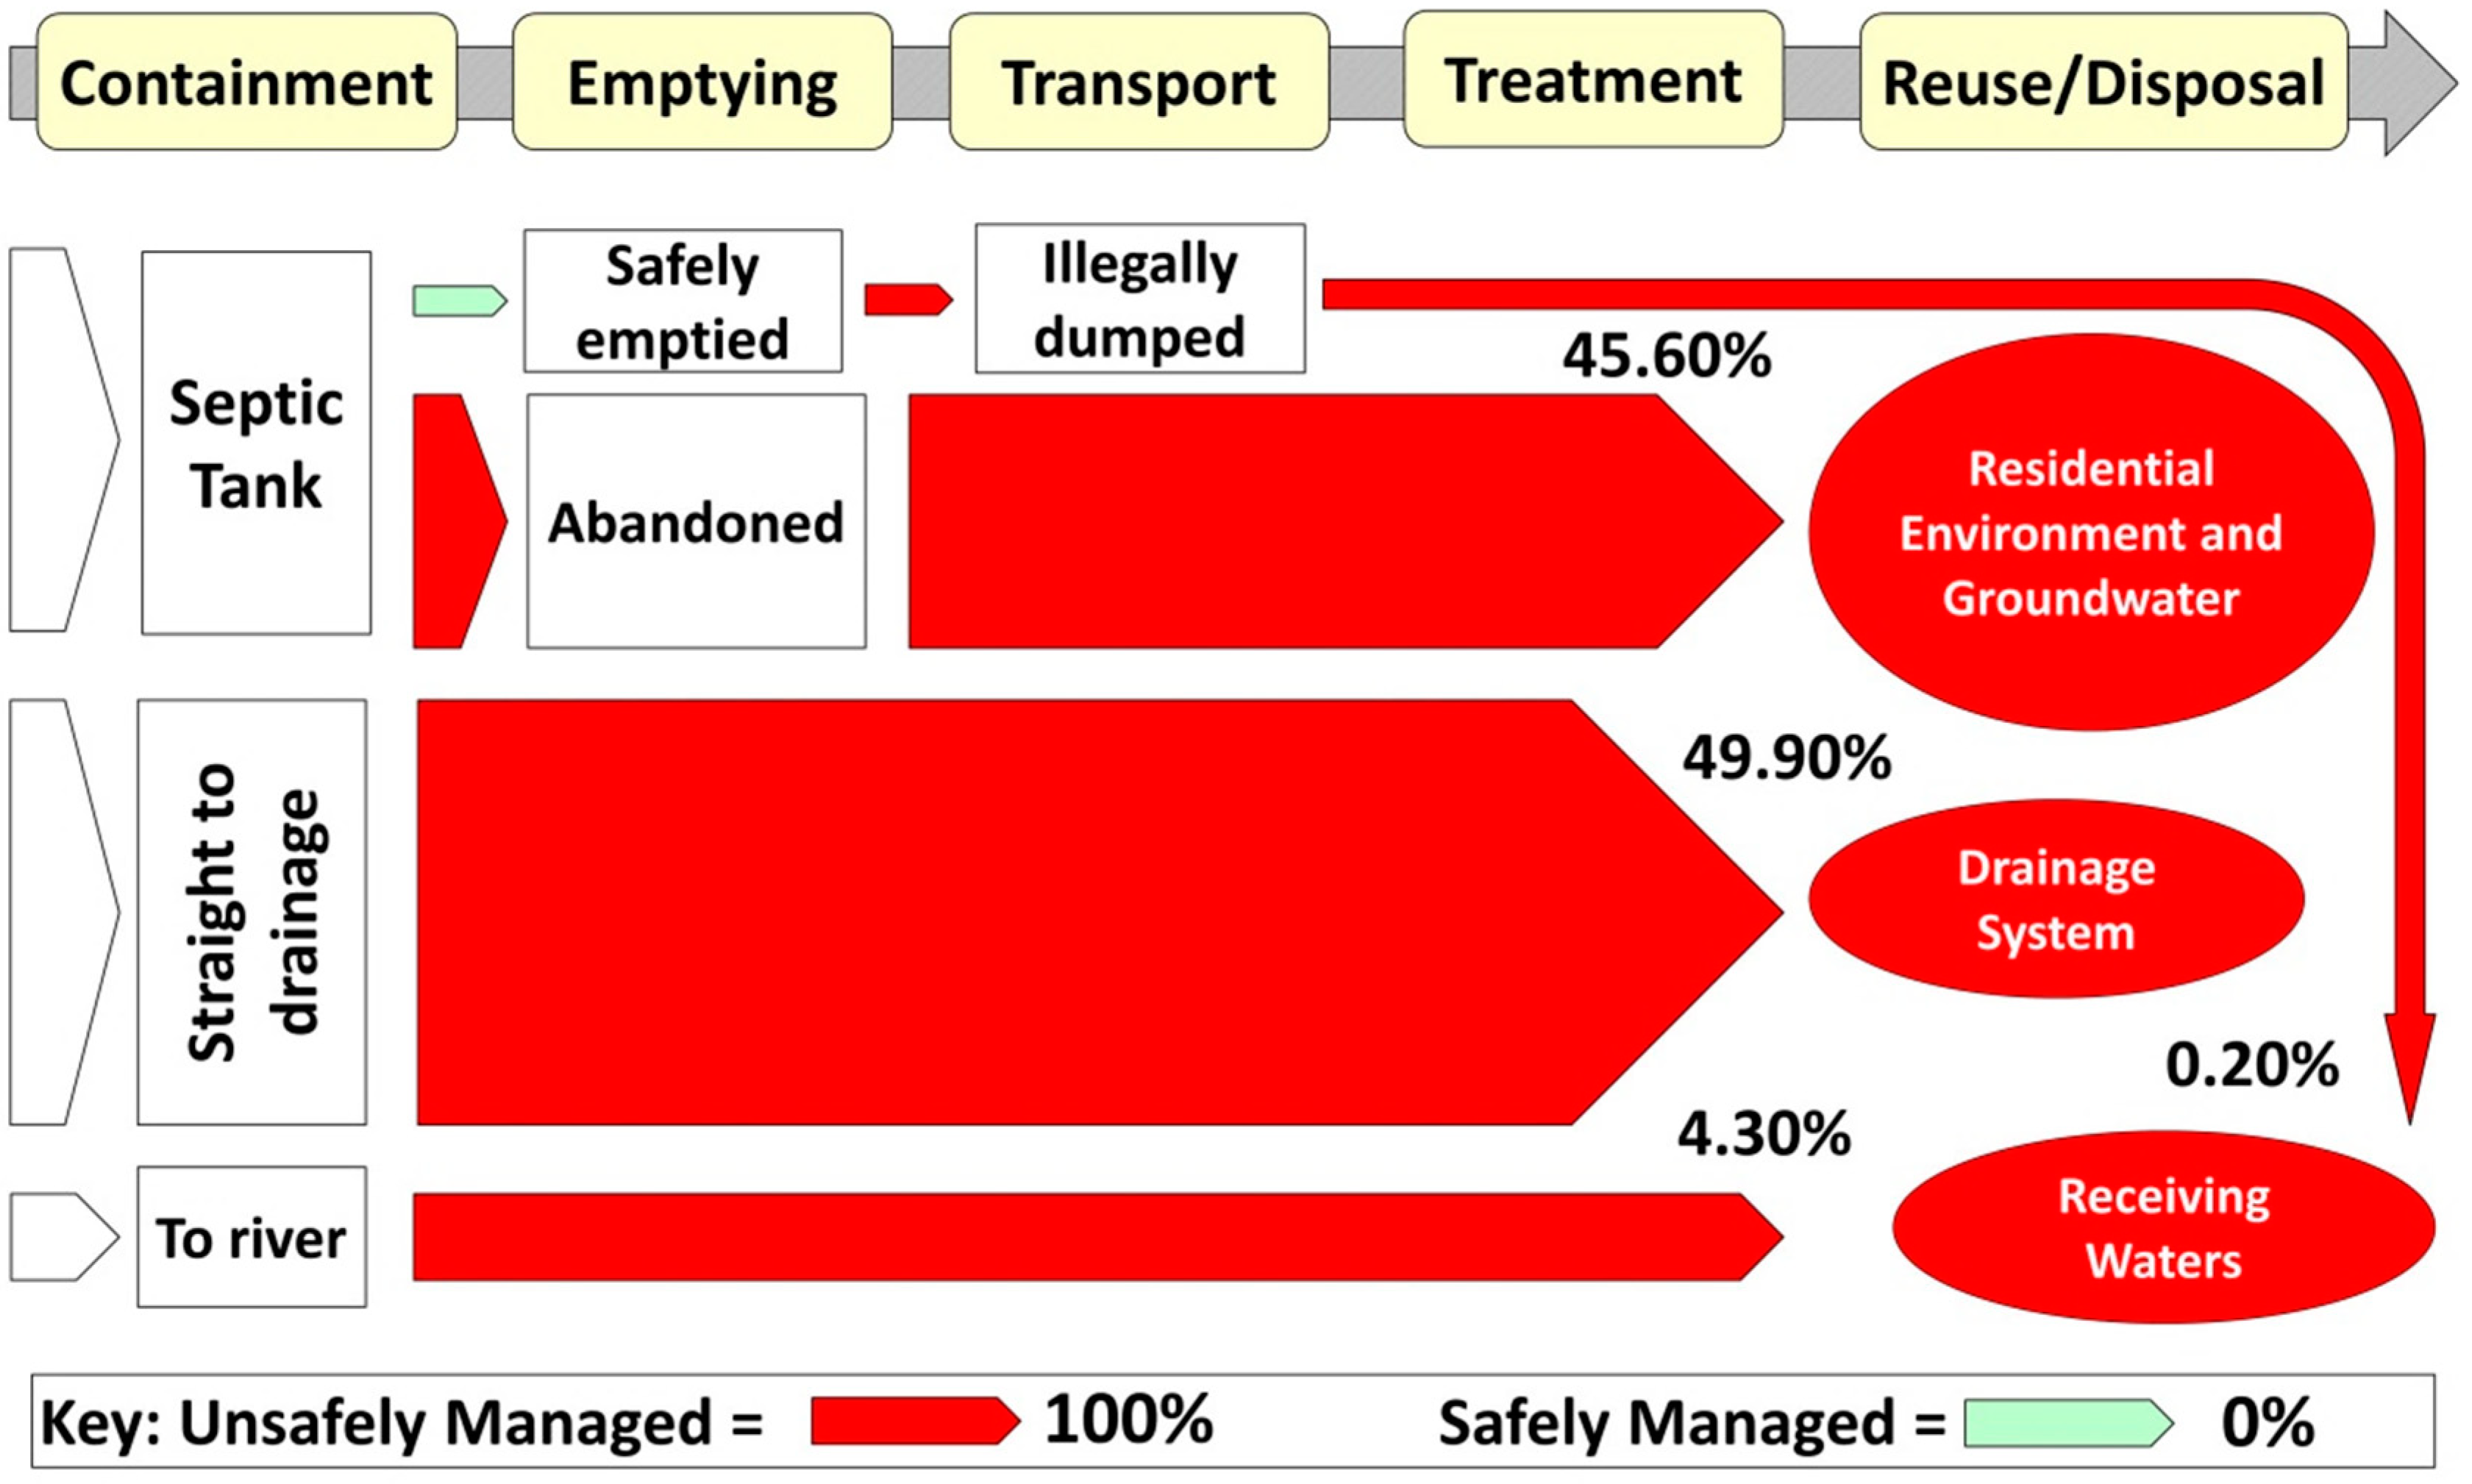
Table 4 presents the data used to make Calamba’s fecal waste flow diagram (Figure 3). The diagram shows that all the fecal waste is terminally disposed of to the residential environment/groundwater (45.60%), drainage canals (49.90%), and receiving water bodies (4.50%). Only 0.20% of the HHs had experienced desludging, and all of them availed the service of a private siphoning company which was penalized in 2011 for dumping septage in Laguna Lake. For this reason, it was assumed that the septage from these HHs was terminally disposed of illegally and not treated effectively. More than forty-five percent (45.60%) of the HHs abandoned the tanks when they become clogged. Although this proportion of septage in the abandoned septic tanks can be considered safely managed [14], it was considered otherwise in this study since there were no reports to prove that septage effectively decomposes and percolates to the ground in the area.
Muntinlupa’s fecal waste flow diagram (see Supplementary Materials, Figure S1) had a higher percentage of septage managed safely (90.30%), contributed mainly by the HHs covered by the desludging service of MWSI. The HHs connected to the central sewerage system (4.35%) and the HHs using closed pits (0.97%) also contributed to the septage safely managed. The percentage of HHs using closed pits added to the safely managed septage as the Philippine Department of Health considers closed pits as sanitary for HHs usually cover the pits with soil after they have been filled with septage. On the other hand, the 9.70% of unsafely managed septage was from HHs who use other depositories (7.65%), pail system (1.16%), and open pits (0.30%) and those who practice open defecation (0.59%).
Pasig’s fecal waste flow diagram (see Supplementary Materials, Figure S2) had a higher percentage of the septage managed properly (64.50%) while a part is disposed of to the residential environment/groundwater, drainage system, and receiving waters (35.50%). Out of the HHs who have septic tanks, 64.02% availed the desludging service of MWCI and 18.06% of a private siphoning company that does not provide any information on how it treats the septage after collection. For this reason, this percentage of septage was considered illegally dumped and ineffectively treated. The percentage of HHs using closed pits (0.48%) added to the safely managed septage. The percentage of HHs using open pits (0.04%), draining straight to rivers/drainages (17.17%), and practicing open defecation (0.23%) contributed to the inefficiently managed septage. An interview from an officer from DILG Pasig confirmed that most HHs in the mentioned categories are located at illegal settlements in the city. Unlike in Baliwag, Muntinlupa, and San Fernando, the proportion of HHs who are still to receive the desludging service was not included in the diagram since MWCI did not release desludging statistics in Pasig. The percentage of HHs availing MWCI’s desludging service and the percentage of HHs opting for the service of a private siphoning company that were used in the diagram were from a separate survey done in October and November 2014. Thirty-five (35) HHs were interviewed in Pasig to know if they have experienced desludging and which company they hired for the service. Out of the 35 HHs, only 18 have experienced desludging, of which 78% availed the service of MWCI and 22% of a private siphoning company.
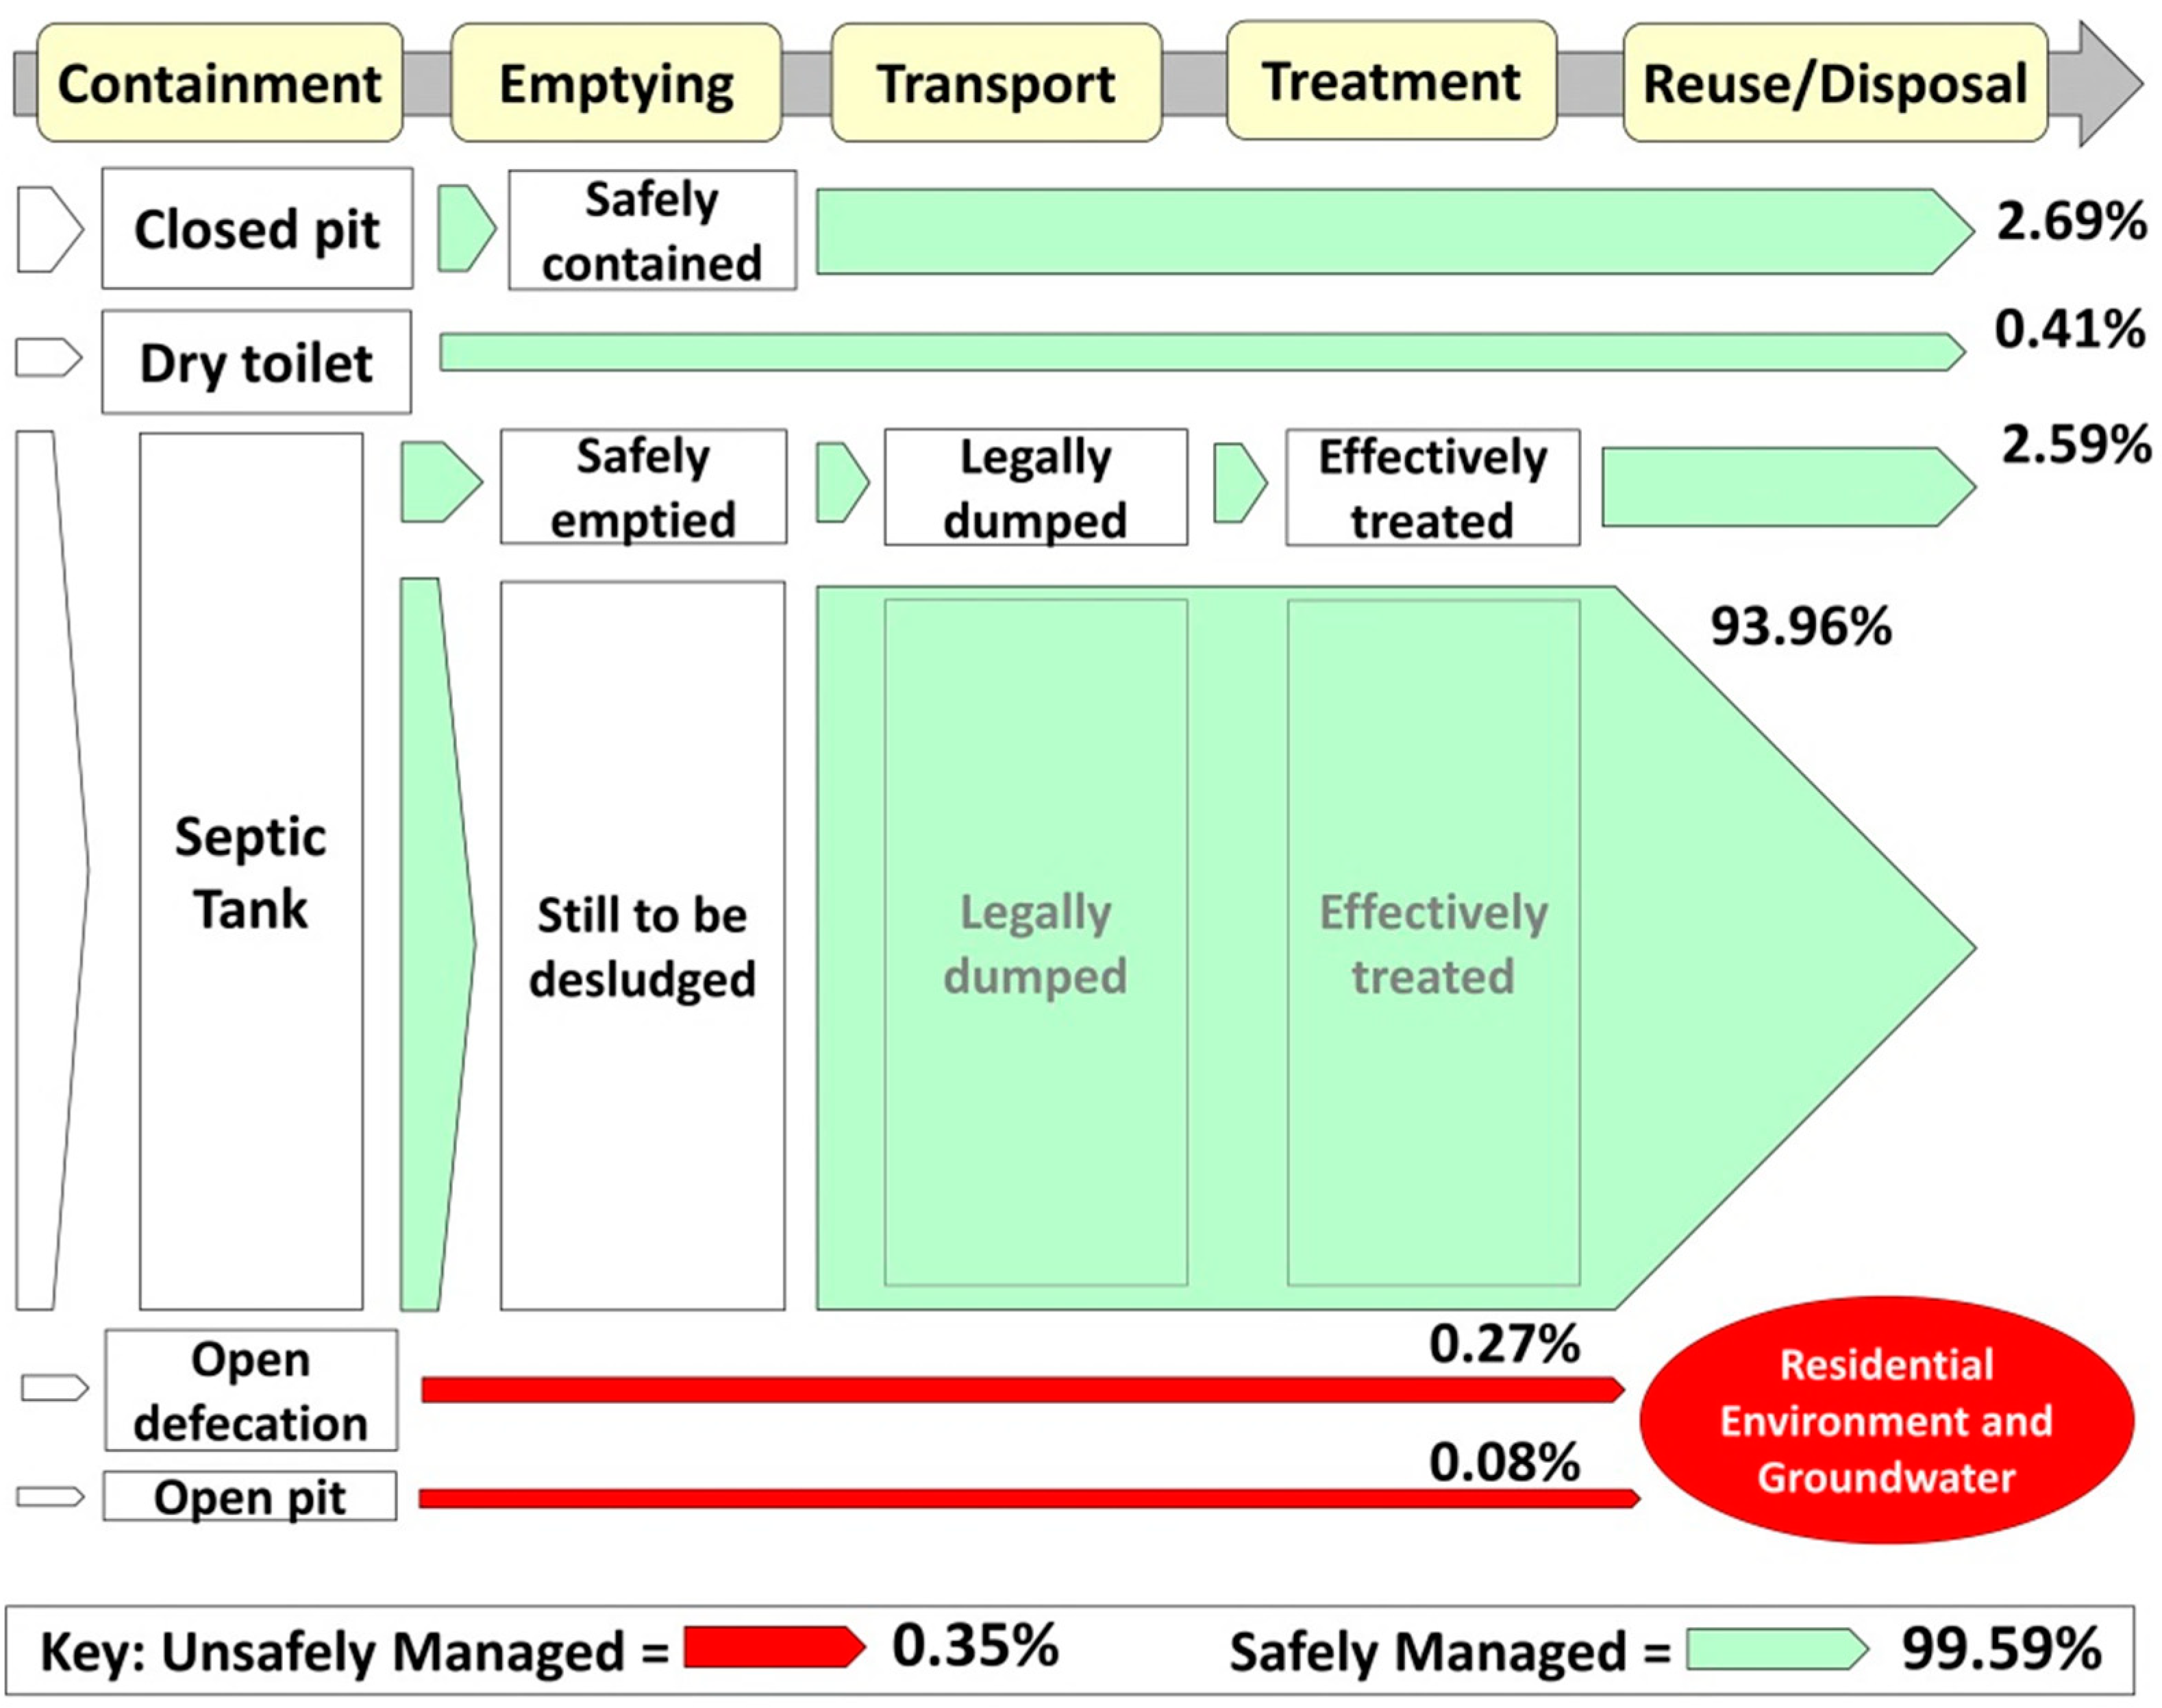
Table 5 presents the data used to make San Fernando’s fecal waste flow diagram (Figure 4). Like Baliwag and Muntinlupa, the data from La Union Provincial Health Office and City Environment and Natural Resources Office contained a proportion of HHs who have paid for the service but have not received it yet (93.96%). The same assumption was made for these HHs. The diagram shows a higher percentage of septage safely managed (99.59%). This percentage is comprised of HHs covered by the desludging service of the city (96.55%) and the HHs using closed pits (2.69%) and dry toilets (0.41%). The dry (urine diversion) toilets were constructed in the city through ecological sanitation projects in 2004 and 2007. Fecal waste from these toilets is composted and used as fertilizer by farmers in the city (CAPS, 2011) [27]. A small percentage of septage in the city is still disposed of in the residential environment, from HHs practicing open defecation (0.27%) and those using open pits (0.08%).
Comparing the percentage of safely managed septage in the study areas, it can be generalized that San Fernando is the most successful in preventing pollution in its environment. It is followed by Baliwag, Muntinlupa, and Pasig. In Calamba, all of the fecal waste is disposed of to the environment. Due to the lack of data, HHs using closed pits (if there is such) were not accounted for and represented in Calamba’s diagram. These HHs could have increased the percentage of fecal waste safely managed.
3.3. Service Delivery Scorecards
Baliwag’s service delivery scorecard is shown in Figure 5. The scorecard had relatively high scores in the enabling pillar, particularly in the policy block. This is due to the presence of a septage management ordinance that appoints the BWD as the system’s head. The ordinance allowed BWD to formulate its policies for setting system targets and mechanisms for acquiring funds. In the developing pillar, scores were lower in the expenditure block because BWD is still limited by its financial resources as reflected by the slow rate of the service expansion. The reuse/disposal stage had a low score because BWD has not yet developed a means to reuse all the sludge produced in the treatment facility effectively. In the sustaining pillar, maintenance block, the containment stage had a low score because the municipal office does not have a program to ensure that HHs in the area are using septic tanks or they are following the regulations set for septic tank construction. The other stages in the maintenance block had perfect scores because BWD effectively collects user fees and monitors system performance through monthly reports. Both expansion and user outcome blocks had improving scores because BWD has plans of expanding the service coverage, and the service covers over 80% of the HHs in the area. The user outcome block scores were a little bit lower because BWD serves only 20% of its low-income communities [25].
The service delivery scorecard of Calamba is illustrated in Figure 6. It can be seen from the enabling pillar that the current policies and planning initiatives for septage management are generally enabling for the success of the service. This is primarily because of the city’s existing ordinance, which emphasizes the importance of the proper construction and management of septic tanks, the mandates of the Clean Water Act of 2004, and the water district and local government’s roles unit in septage management. High scores occurred in the containment and treatment stages under policy and planning blocks because these are the focus of the local ordinance. Moreover, an interview with an officer from the City Planning and Development Office confirmed that the budget for the lot acquisition for the septage treatment facility is still intact and that the city office is waiting for the water district’s request to purchase a lot. For the developing pillar, expenditure block, it was assumed that the access of the HHs to the septage management service reflects the capital expenditure value. Expenditure block scores were all zeroes because the city and the water district currently do not have investment plans for septage management in the city. The equity block had 0.50s because national regulations on environmental impact assessment, i.e., evaluation of positive and negative impacts of a project, require stakeholder participation [24]). In the output block, only the containment stage had a score because the city monitors the number of HHs with septic tanks as directed by the Supreme Court Decision in 2008. For the same reason, the containment stage under the containment block in the sustaining pillar had a score.
Muntinlupa’s scorecard (see Supplementary Materials, Figure S3) only had poor scores in the containment stage, suggesting mismanagement on the city office’s side. The city does not have programs and does not allocate budget for monitoring and improving septic tank use. An interview with a health officer confirmed a confusion on the city office’s roles and MWSI for septage management: the city does not create and allocate budget for such programs because officials think it is the responsibility of MWSI. The city now is in the process of reviewing a proposed local ordinance for septage management that would transfer this responsibility to MWSI. Perfect scores in the planning and budget blocks under the enabling pillar and equity block under the developing pillar show MWSI’s effective schemes for fund flow coordination and programs for local participation and service provision to the urban poor. Improving scores in the expenditure block under the developing pillar reflect the insufficient financial capacity of MWSI as demonstrated by a slow rate of service coverage expansion. Output block did not have perfect scores because MWSI could desludge only 32,535 septic tanks out of its target of 52,800 in 2013 [28,29]. Maintenance block under the sustaining pillar had perfect scores because operation and management costs are recovered through user fees in water bills. Another reason is that MWSI monitors key business performance indicators as part of its concession agreement with MWSS. Based on these performance indicators, the company could be given penalties by MWSS. Scores in the expansion block were lower than those in maintenance because the government does not provide programs or measures to strengthen domestic private partnership for septage management service provision. User outcome scores were even lower because the service reaches only around 3% of the low-income communities.
Pasig City’s scorecard (see Supplementary Materials, Figure S4) had the most number of good (2.01–3.00) scores. Like Muntinlupa, the containment stage of the service is the city’s responsibility while the rest of the stages are managed by the service provider, MWCI. In the enabling pillar, policy block, all of the service chain stages had relatively high scores. The only reason why these scores were lower than the other blocks is that the city does not have its own septage management ordinance. For the planning and budget blocks, all the stages had a perfect score. This is because the MWCI has a process for coordinating septage management investments in the subsector (e.g., domestic or national grants, state budgets, donor loans, and grants). A number of MWCI’s projects were part of the second and third Manila Sewerage projects and the fourth Metro Manila Wastewater Management project funded through loans from the World Bank. The company continually sets targets for septage management goals and invests so that the targets could be reached. MWCI also ensures that their human resources have the full capacity in fulfilling responsibilities for their septage management goals.
In the developing pillar, almost all of the stages in each block had a perfect value of 3.00. This shows that the MWCI is efficient in allocating funds for its septage management services, ensuring that the service reaches the whole city, and improving its facilities to serve all of its consumers. In 2014, the company desludged 48,384 septic tanks out of its target of 57,159 [30]. The city also makes efforts to ensure HHs and establishments meet sanitary requirements through its sanitary permit office. The reuse/disposal stage had a low score since the MWCI has just started looking into opportunities for reusing sludge. In 2005, the company started studies and experiments using treated septage as a soil conditioner for sugarcane growth in lahar-laden areas in Pampanga Philippines.
In the sustaining pillar, maintenance block had high scores since MWCI’s operational and management costs are fully met through user fees and other revenues (based on MWCI’s Securities and Exchange Commission 17-A Annual Report 2014 [31]). The company annually prepares financial reports in pursuant to Section 17 of the Securities Regulation Code and Section 141 of the Corporation Code of the Philippines. Similar to MWSI [32], MWCI also monitors key business performance indicators as part of their concession agreement with MWSS and could be given penalties by MWSS. The expansion block scores were a bit lower because the government does not provide training and programs for implementing policies related to fecal waste containment (e.g., septic tank construction, use of closed pits, etc.) and reusing sludge. The programs for septage management training were irregular and were funded mostly by international organizations. In the user outcomes block, all the value chains had high values because of the high service coverage of MWCI and a high percentage of low-income communities it serves.
In San Fernando City’s scorecard (see Supplementary Materials, Figure S5), the dominance of good scores in the enabling pillar indicates the city’s effective development and implementation of its septage management policies and fund flow coordination for the development of the service. In the developing pillar, improving scores in the expenditure block reveal that the city is still limited by its financial resources in improving the service coverage. The equity block also had improving scores because the city does not have its own procedures for involving stakeholders in septage management decision-making. All the service details, from choosing the process to use for the treatment, to the payment system, and location of the facility were decided by the city. In the sustaining pillar, the absence of city programs to stimulate demand for septage management services and the lack of government measures to encourage companies to invest into septage management provision caused the low scores in the expansion block. However, high scores in the user outcomes block were caused by the high percentage of septage managed efficiently (99.59%) and service provision to low-income communities.
Comparing the scorecards, it can be generalized that Pasig (0 poor, 12 improving, and 33 good scores) has the most efficient septage management service, followed by San Fernando (0 poor, 15 improving, and 30 good scores), Baliwag (1 poor, 16 improving, and 28 good scores), Muntinlupa (6 poor, 19 improving, and 20 good scores), and Calamba (35 poor, 10 improving, and 0 good scores) [33].
3.4. Safely Managed Fecal Waste and Scorecard Ratings
Table 6 presents the percentage of safely managed fecal wastes in the study areas and their corresponding average ratings in the three scorecard pillars. It can be noted that the top two areas with higher safely managed fecal waste, San Fernando and Baliwag, also had higher enabling pillar scores. This indicates that policies, planning initiatives, and financial framework might be the more important factors influencing the delivery of septage management service, especially to HHs utilizing septic tanks. The table also shows that Muntinlupa had a higher percentage of safely managed fecal waste than Pasig but had lower scorecard ratings. The low scorecard ratings were caused by the absence of a septage management ordinance in the city, resulting in confusion of the responsibilities between the city office and the service provider, MWSI. Muntinlupa is now making improvements as the city has recently drafted a local septage management ordinance to resolve the issues. Based on the scorecard ratings, it can be inferred that MWCI is already efficient in providing the service; however, the city still had a relatively lower percentage of safely managed fecal waste. This is because HHs in the city still hire private desludging companies that dispose of collected septage into nearby water bodies. All the fecal waste in Calamba is unsafely managed, signifying that the city is stuck in the service development phase although it already has enabling policies for its establishment.
4. Conclusions
Among the five areas, San Fernando can be considered to have the most efficient septage management system as it had the highest percentage of safely managed fecal waste (99.65%) and high scores in the scorecards. It might have been an advantage that the whole system is being managed by the city itself—from implementing rules for septic tank plans to the collection, treatment, and disposal of septage. This completely eliminates possible institutional conflicts and makes system monitoring centralized for efficiency. Comparing the two cities in Metropolitan Manila (Muntinlupa and Pasig), managed by the two concessionaires of MWSS, it can be said that MWCI is more successful than MWSI. It is reasonable since MWSI just started its desludging service in 2009 [31]. There might be a need for these two concessionaires to align sector targets and interventions to achieve a wider coverage of septage management services. Baliwag just needs to continue investing in the expansion of the service since it already has a progressing system. On the other hand, Calamba City already has enabling policies for the system; thus, it should start driving investments to the development of the service.
This study demonstrates that the fecal waste flow diagram and the service delivery scorecard can be effective tools to compare septage management in cities/municipalities. The two tools are complementary as the scorecard could give insights to why cities have a high or low percentage of safely managed fecal waste (based on the enabling and developing pillar scores). The fecal waste flow diagrams were effective in elucidating the overall flow of fecal waste. However, the precision of these diagrams would still depend on the available data from the city. Local government units should be encouraged to monitor toilet, septic tank, and desludging characteristics of HHs under their jurisdiction. The scorecards were also able to point out the strengths and weaknesses of the current septage management service delivery in each stage of the service chain. The score descriptions for the scorecard should be continually improved for more uniform assessments. More case studies could be done to explore the use of other indicators.
Supplementary Materials
The following are available online at https://0-www-mdpi-com.brum.beds.ac.uk/2673-4117/2/1/2/s1. Table S1: The modified SDA questions from Peal et al., 2014 [13], Table S2: Score descriptions for the SDA Scorecard, Table S3: Data for Muntinlupa City’s Fecal Waste Flow Diagram, Figure S1: The fecal waste flow diagram of Muntinlupa, Table S4: Data for Pasig City’s Fecal Waste Flow Diagram, Figure S2. The fecal waste flow diagram of Pasig, Figure S3: Service delivery scorecard for Muntinlupa City, Figure S4: Service delivery scorecard for Pasig City, Figure S5: Service delivery scorecard for San Fernando City.
Author Contributions
Conceptualization, D.E.B. and H.H.; data curation, D.E.B.; formal analysis, D.E.B.; funding acquisition, H.H. and S.F.; investigation, D.E.B.; methodology, D.E.B.; resources, S.F.; supervision, H.H. and S.F.; validation, D.E.B. and S.A.; visualization, D.E.B.; writing—review & editing, M.F.T. and S.A. All authors have read and agreed to the published version of the manuscript.
Funding
This research was funded by the Environmentally-friendly Industries for Sustainable Development Laboratory, Graduate School of Global Environmental Studies, Kyoto University.
Institutional Review Board Statement
The study was conducted according to the guidelines of the Declaration of Helsinki, and approved by the Institutional Review Board of the Graduate School of Global Environmental Sciences at Kyoto University, Japan.
Informed Consent Statement
Informed consent was obtained from all subjects involved in the study.
Conflicts of Interest
The authors declare no conflict of interest.
References
- United Nations. The Millennium Development Goals Report; United Nations: New York, NY, USA, 2015. [Google Scholar]
- WHO/UNICEF. Progress on Sanitation and Drinking Water; WHO/UNICEF: New York, NY, USA, 2019. [Google Scholar]
- United Nations. Goal 6: Ensure Access to Water and Sanitation for All. From UN Sustainable Development Goals. 2015. Available online: http://www.un.org/sustainabledevelopment/water-and-sanitation/ (accessed on 19 January 2016).
- United Nations. Metadata on Suggested Indicators for Global Monitoring of the Sustainable Development Goal 6 on Water and Sanitation; UN-Water: New York, NY, USA, 2015. [Google Scholar]
- Musiyarira, H.; Reynders, C.; Marjanovic, P. Decision Making Support in Wastewater Management-Comparative analysis of techniques and tools used in centralized and decentralized system layouts, UDK 628.2. J. Econ. Dev. Environ. People 2012, 1, 71–90. [Google Scholar] [CrossRef]
- Szántó, G.; Letema, S.C.; Tukahirwa, J.T.; Mgana, S.; Oosterveer, P.J.M.; van Buuren, J.C.L. Analyzing sanitation characteristics in the urban slums of East Africa. J. World Water Counc. 2012, 14, 613–624. [Google Scholar] [CrossRef]
- Massoud, M.A.; Tarhini, M.; Nasra, J.A. Decentralized approaches to wastewater treatment and management: Applicability in developing countries. J. Environ. Manag. 2009, 90, 652–659. [Google Scholar] [CrossRef] [PubMed]
- US Environmental Protection Agency (USEPA). Onsite Wastewater Treatment Systems Manual; EPA: Washington, DC, USA, 2002. [Google Scholar]
- World Bank and Australian Aid. East Asia and the Pacific Urban Sanitation Review: Philippines Country Study; World Bank and Australian Aid: Manila, Philippines, 2013. [Google Scholar]
- USAID and Department of the Interior and Local Government (DILG) Philippines. Septage Management in the Philippines, Current Practices and Lessons Learned; USAid: Manila, Philippines, 2007. [Google Scholar]
- Department of Public Works and Highways, Government of Philippines. Support for the Nationwide Roll-Out of the National Sewerage and Septage Management Program; DPWH: Manila, Philippines, 2013. [Google Scholar]
- SaniPath.org. Overview. From SaniPath. Available online: http://sanipath.org/about/overview/ (accessed on 19 January 2016).
- Hawkins, P.; Muxímpua, O. Developing Business Models for Fecal Sludge Management in Maputo; World Bank Water and Sanitation Program: Maputo, Philippines, 2015. [Google Scholar]
- Peal, A.; Evans, B.; Blackett, I.; Hawkins, P.; Heymans, C. Fecal sludge management (FSM): Analytical tools for assessing FSM in cities. J. Water Sanit. Hyg. Dev. 2014, 4, 371–383. [Google Scholar] [CrossRef] [Green Version]
- SFD Promotion Initiative. The SFD Promotion Initiative. Available online: http://www.sfd.susana.org/about/the-sfd-promotion-initiative (accessed on 19 January 2016).
- Philippine Statistics Authority (PSA). Population and Housing. From Philippine Statistics Authority. 2010. Available online: https://psa.gov.ph/statistics/census/population-and-housing (accessed on 11 December 2015).
- Philippine Statistics Authority (PSA). Poverty Incidence among Filipinos Registered at 25.8%, As of First Semester of 2014—PSA. From Philippine Statistics. 2015. Available online: http://www.nscb.gov.ph/poverty/ (accessed on 6 December 2015).
- Water and Sanitation Program (World Bank). The Missing Link in Sanitation Service Delivery: A Review of Fecal Sludge Management in 12 Cities; Water and Sanitation Program (World Bank): Washington, D.C., USA, 2014. [Google Scholar]
- Republic of the Philippines. Presidential Decree No. 198, 25 May 1973. From the LawPhil Project: Arellano Law Foundation. Available online: http://www.lawphil.net/statutes/presdecs/pd1973/pd_198_1973.html (accessed on 22 March 2015).
- Boholano, C. Engineer; Baltazar, D.E., Interviewer; City Planning and Development Office: Calamba, Philippines, 2015. [Google Scholar]
- Philippine Star. (2013, June 28). From Manila Water Spends P346M for Sewer Network. Available online: http://www.philstar.com/business/2013/06/28/959319/manila-water-spends-p346m-sewer-network (accessed on 21 February 2015).
- Metropolitan Waterworks and Sewerage System (MWSS). Metropolitan Waterworks and Sewerage System Annual Report; Metropolitan Waterworks and Sewerage System: Manila, Philippines, 2012. [Google Scholar]
- Manila Water Company Inc. 2012 Sustainability Report; Manila Water Company Inc.: Manila, Philippines, 2012. [Google Scholar]
- Department of Environment and Natural Resources Environment Management Bureau (DENR-EMB). Overview of the Philippine EIS System. from the Philippine Environmental Impact Assessment System; 2015. Available online: http://www.emb.gov.ph/eia-adb/basics.html (accessed on 1 December 2015).
- Baliwag Water District Sewerage and Sanitation Division. Baliwag Fecal Waste Report; Baliwag Water District Sewerage and Sanitation Division: Baliwag, Philippines, August 2015. [Google Scholar]
- Department of Internal and Local Government Region IV (DILG IVA); Department of Internal and Local Government Region IV. Manila Bay Clean-up, Rehabilitation, and Preservation. 2011. Available online: http://calabarzon.dilg.gov.ph/index.php/dilg-programs/254-manila-bay (accessed on 19 February 2015).
- Center for Advanced Philippine Studies (CAPS). 17 Case Studies about Sustainable Sanitation Projects in the Philippines; Center for Advanced Philippine Studies: Manila, Philippines, 2011. [Google Scholar]
- Manila Water Company Inc. Securities and Exchange Commission Sec Form 17-A Annual Report Pursuant to Section 17 of The Securities Regulation Code and Section 141 of The Corporation Code of the Philippines; From Manila Water Disclosures; Manila Water Company Inc.: Manila, Philippines, 2013; Available online: http://manilawater.com/ir/IRPages/Disclosures.aspx (accessed on 17 February 2015).
- Maynilad Water Services Inc. Annual Report. Manila; Maynilad Water Services Inc.: Maynilad, Philippines, 2013. [Google Scholar]
- Manila Water Company Inc. Securities and Exchange Commission 17-Q Report; Manila Water Company Inc.: Manila, Philippines, 2014. [Google Scholar]
- Muntinlupa City Government. 2014 Highlights of Accomplishments Report. From Muntinlupa City Website. 2015. Available online: http://www.muntinlupacity.gov.ph/index.php?target=aboutdetails¶ms=request_._resord_.._id_._28 (accessed on 14 December 2015).
- Manila Water Company Inc. Manila Water Financial Highlights 2013; Manila Water Company Inc.: Manila, Philippines, 2013. [Google Scholar]
- Calamba City Government. Calamba City Septage Management Ordinance; Calamba City Office: Calamba, Philippines, 2009.
Figure 1.
Map of the study areas.

Figure 2.
The fecal waste flow diagram of Baliwag.

Figure 3.
The fecal waste flow diagram of Calamba.

Figure 4.
The fecal waste flow diagram of San Fernando.

Figure 5.
Service delivery scorecard for Baliwag.

Figure 6.
Service delivery scorecard for Calamba City.


Table 1.
Characteristics of the study areas.
| Characteristics | Baliwag | Calamba | Muntinlupa | Pasig | San Fernando |
|---|---|---|---|---|---|
| Area (km2) | 45.05 | 149.50 | 46.07 | 48.46 | 105.26 |
| Number of barangays * | 27 | 54 | 9 | 30 | 59 |
| Population * | 143,565 | 389,377 | 459,941 | 669,773 | 114,963 |
| Population density (inhabitants/km2) * | 3187 | 2605 | 9800 | 13,821 | 1100 |
| Poverty index ** | 0.1702 | 0.0828 | 0.0955 | 0.0533 | 0.1460 |
Table 2.
The Service Delivery Assessment (SDA) scorecard: Pillars, Building Blocks, and Septage Management Service Chain [14].
Table 2.
The Service Delivery Assessment (SDA) scorecard: Pillars, Building Blocks, and Septage Management Service Chain [14].
| Pillars | Building Blocks | Questions/Elements | Stages of Septage Management Service Chain * | ||||
|---|---|---|---|---|---|---|---|
| A | B | C | D | E | |||
| Enabling Services | Policy | E1-1~6 ** | |||||
| Planning | E2-1~3 | ||||||
| Budget | E3-1~2 | ||||||
| Developing Services | Expenditure | D1-1-1 | |||||
| Equity | D2-1~3 | ||||||
| Output | D3-1~4 | ||||||
| Sustaining Services | Maintenance | S1-1~2 | |||||
| Expansion | S2-1~3 | ||||||
| Outcomes | S3-1~2 | ||||||
* A: Containment; B: Emptying; C: Transport; D: Treatment; E: Disposal or Reuse. ** One question for service consumers’ attitude was added in the policy building block.
Table 3.
Data for the Municipality of Baliwag’s Fecal Waste Flow Diagram.
| Category | Number of HHs | Percentage |
|---|---|---|
| 1. Use septic tank: | ||
| - Desludged by Baliwag Water District | 6494 | 20.09 |
| - Desludged by private desludging company | 10 | 0.03 |
| - Still to be desludged | 24,960 | 77.21 |
| - Not willing to avail the service | 717 | 2.22 |
| - Abandoned when clogged | 95 | 0.29 |
| 2. Use open pits/dispose directly to drainage canal | 52 | 0.16 |
| Total | 32,327 |
Source: August 2015 Baliwag Water District Sewerage and Sanitation Division [25].
Table 4.
Data for Calamba City’s Fecal Waste Flow Diagram.
| Category | Number of HHs | Percentage |
|---|---|---|
| 1. Use septic tank: | ||
| - Desludged by Malabanan Siphoning Services | 15 | 0.20 |
| - Abandoned when clogged | 3417 | 45.60 |
| 2. Dispose straight to drainage canals | 3732 | 49.90 |
| 3. Dispose straight to rivers | 324 | 4.30 |
| Total | 7489 |
Source: 2011 City Environment and Natural Resources Office records for Manila Bay Clean-Up, Rehabilitation and Preservation Project [26].
Table 5.
Data for San Fernando City’s Fecal Waste Flow Diagram.
| Category | Number of HHs | Percentage |
|---|---|---|
| 1. Use septic tank: | ||
| - Desludged by city desludging service | 713 | 2.59 |
| - Still to be desludged | 25,862 | 93.96 |
| 2. Use closed pit | 741 | 2.69 |
| 3. Use urine diversion toilets provided by city | 112 | 0.41 |
| 4. Use open pit | 22 | 0.08 |
| 5. Practice open defecation | 74 | 0.27 |
| Total | 27,524 |
Source: 2015 La Union Provincial Health Office sanitation monitoring data and 2015 San Fernando CENRO sanitation report (Supplementary materials).
Table 6.
Safely managed fecal waste and average ratings for the three scorecard pillars.
| Study Areas | Safely Managed Fecal Waste (%) | Enabling | Developing | Sustaining |
|---|---|---|---|---|
| San Fernando | 99.65 | 2.70 | 2.17 | 2.48 |
| Baliwag | 97.3 | 2.56 | 2.19 | 2.05 |
| Muntinlupa | 90.3 | 2.21 | 2.21 | 1.90 |
| Pasig | 64.5 | 2.43 | 2.81 | 2.22 |
| Calamba | 0 | 1.42 | 0.26 | 0.04 |

Publisher’s Note: MDPI stays neutral with regard to jurisdictional claims in published maps and institutional affiliations. |
© 2021 by the authors. Licensee MDPI, Basel, Switzerland. This article is an open access article distributed under the terms and conditions of the Creative Commons Attribution (CC BY) license (http://creativecommons.org/licenses/by/4.0/).
Share and Cite
MDPI and ACS Style
Baltazar, D.E.; Harada, H.; Fujii, S.; Tan, M.F.; Akib, S. A Comparative Analysis of Septage Management in Five Cities in the Philippines. Eng 2021, 2, 12-26. https://0-doi-org.brum.beds.ac.uk/10.3390/eng2010002
AMA Style
Baltazar DE, Harada H, Fujii S, Tan MF, Akib S. A Comparative Analysis of Septage Management in Five Cities in the Philippines. Eng. 2021; 2(1):12-26. https://0-doi-org.brum.beds.ac.uk/10.3390/eng2010002
Chicago/Turabian StyleBaltazar, Dalton Erick, Hidenori Harada, Shigeo Fujii, Maria Francesca Tan, and Shatirah Akib. 2021. "A Comparative Analysis of Septage Management in Five Cities in the Philippines" Eng 2, no. 1: 12-26. https://0-doi-org.brum.beds.ac.uk/10.3390/eng2010002