1. Introduction
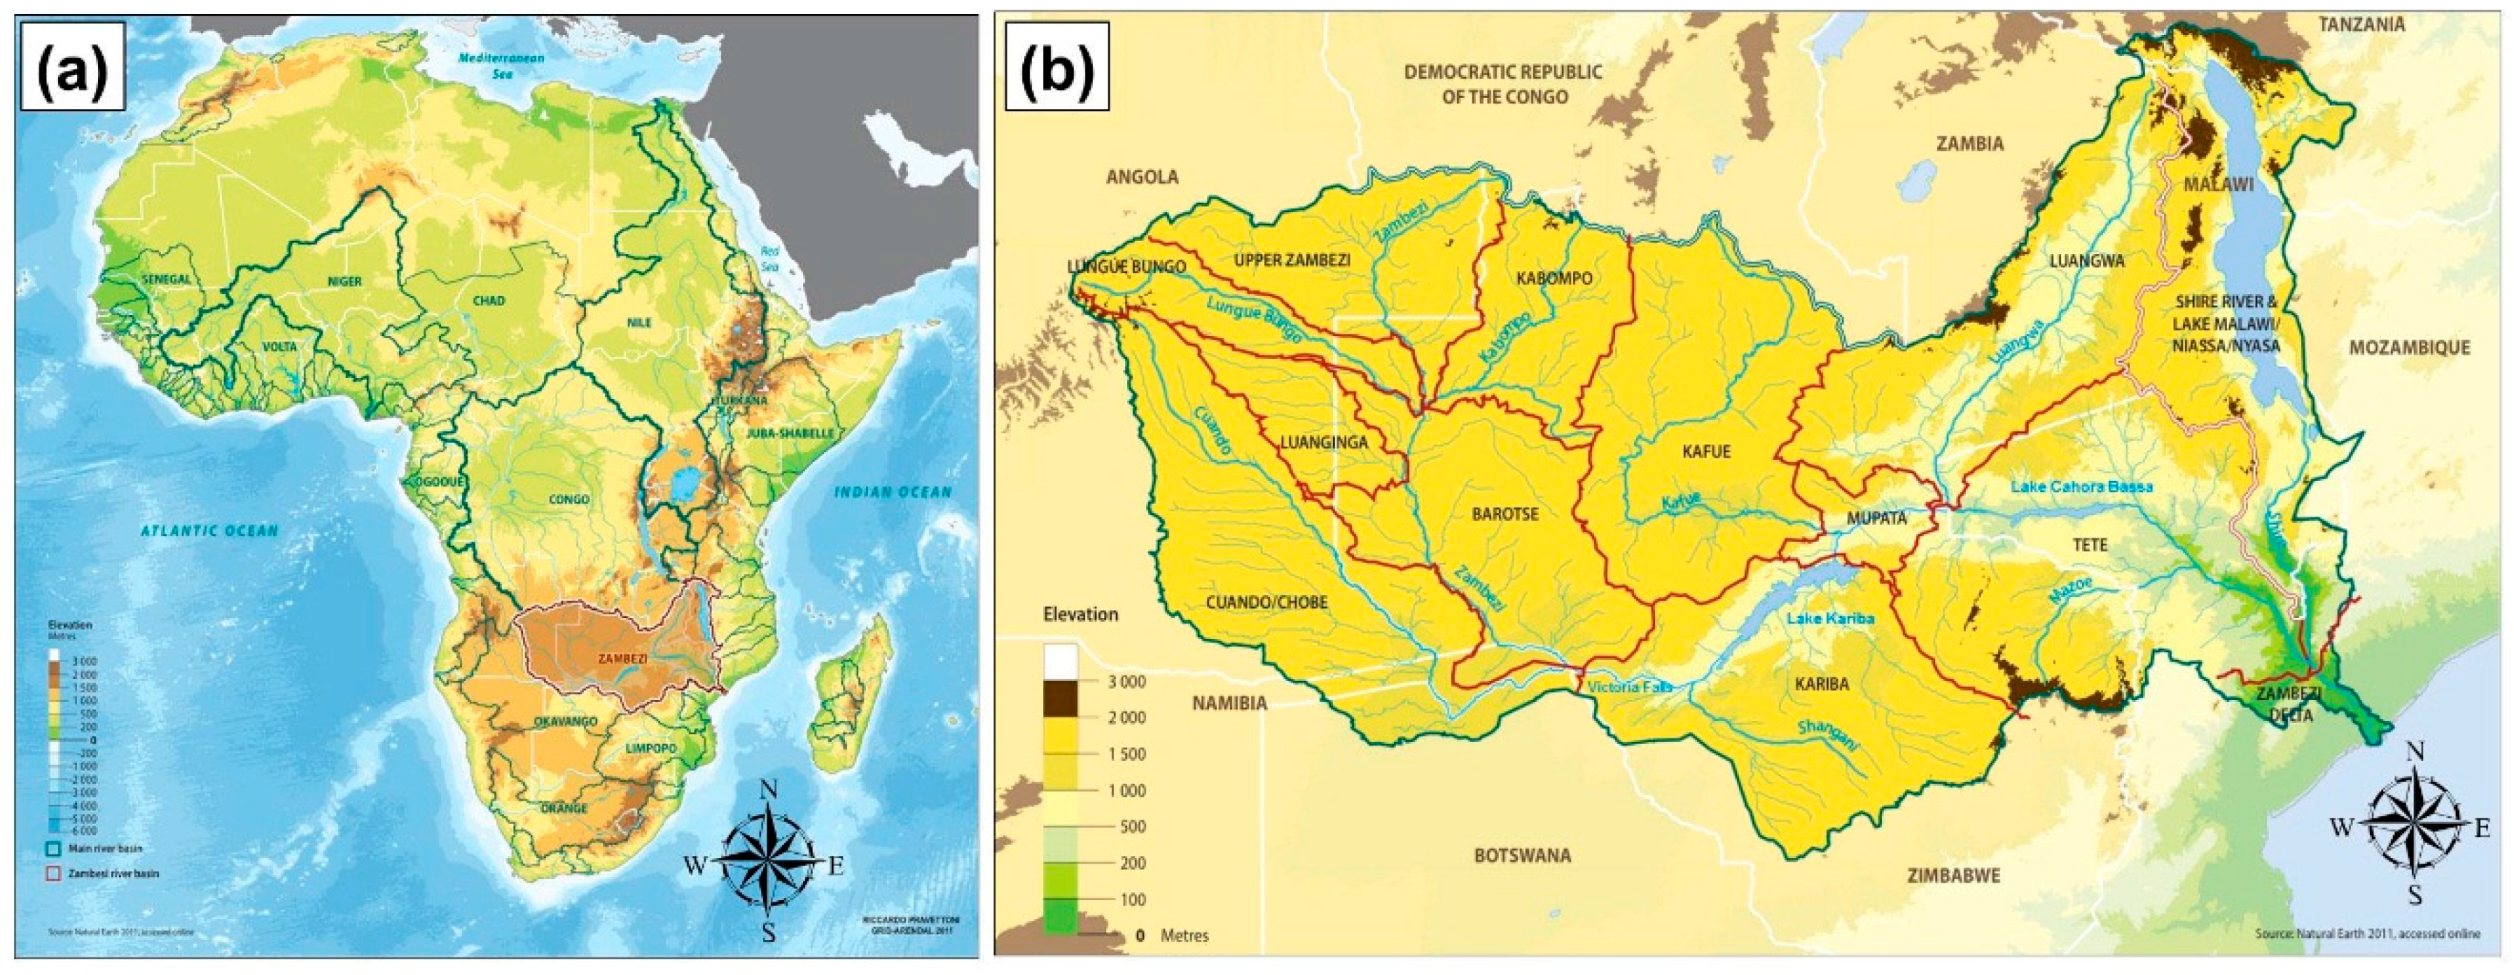
The Zambezi River is one of the main rivers in southern Africa and the longest African river flowing into the Indian Ocean. The river basin, lying between latitudes 9–20° South and longitudes 18–36° East, covers an area about 1.4 million km
2 wide, and is the fourth-largest catchment area in Africa after the Congo, Nile, and Niger watersheds. It is shared by eight countries (Angola, Botswana, Malawi, Mozambique, Namibia, Tanzania, Zambia, and Zimbabwe), and has an estimated population of 30 million people.
Figure 1 illustrates the major African river basins and the Zambezi river basin, divided into its main sub-basins, representative of major tributaries and drainage areas [
1].
A large body of literature exists on the Zambezi River system, dealing with its geological, hydrological, morphological, ecological, and socio-economic aspects [
2,
3,
4,
5,
6,
7,
8]. The main stem of the river has an estimated length of 2524 km [
2], subdivided into three major segments (upper, middle and lower Zambezi), each having distinct geomorphological and hydrological features.
The upper Zambezi, about 1078 km long [
2], flows from the river source near Kalene Hill (in Zambia, at an altitude of 1450 m) to Victoria Falls. In this reach, the river flows across a vast plateau with low gradients and is, to a large extent, confined in a well-defined channel; exceptions are the Barotse and Chobe swamps, two extended flood plains in which the river cross-section locally widens up to tens of kilometres. The upper Zambezi abruptly ends at the well-known Victoria Falls (Mosi-oa-Tunia, “the smoke that thunders” in the local idiom), with a drop of 108 m and a width of 1700 m.
The middle Zambezi is comprised of the stretch between Victoria Falls and the Cahora Bassa Lake, with an approximate length of 853 km [
2]. This is the reach with the steepest gradient of the entire course of the Zambezi, characterized by narrow gorges and rapids. Along this reach in the second half of the last century, the Kariba and the Cahora Bassa dams were built for hydroelectric energy production. The Kariba dam, along the border between Zambia and Zimbabwe, was completed in 1959 and created an artificial lake with a storage capacity of 180.6 billion m
3 and a surface area of 5364 km
2 [
9]. The Cahora Bassa dam, in Mozambique, was completed at the end of 1974; it gives rise to an artificial lake that, according to data provided by the electrical company
Hidroeléctrica de Cahora Bassa [
10], has a useful capacity of 52 billion m
3, a length of 270 km, a width of 30 km, and a surface area of 2900 km
2 at maximum water level. Other minor dams are present in the basin of the middle Zambezi; among them, the most important are the Kafue Gorge dam and the Itezhi-Tezhi dam, on the Kafue river, which flows into the main stem of the Zambezi, about 80 km downstream of the Kariba dam.
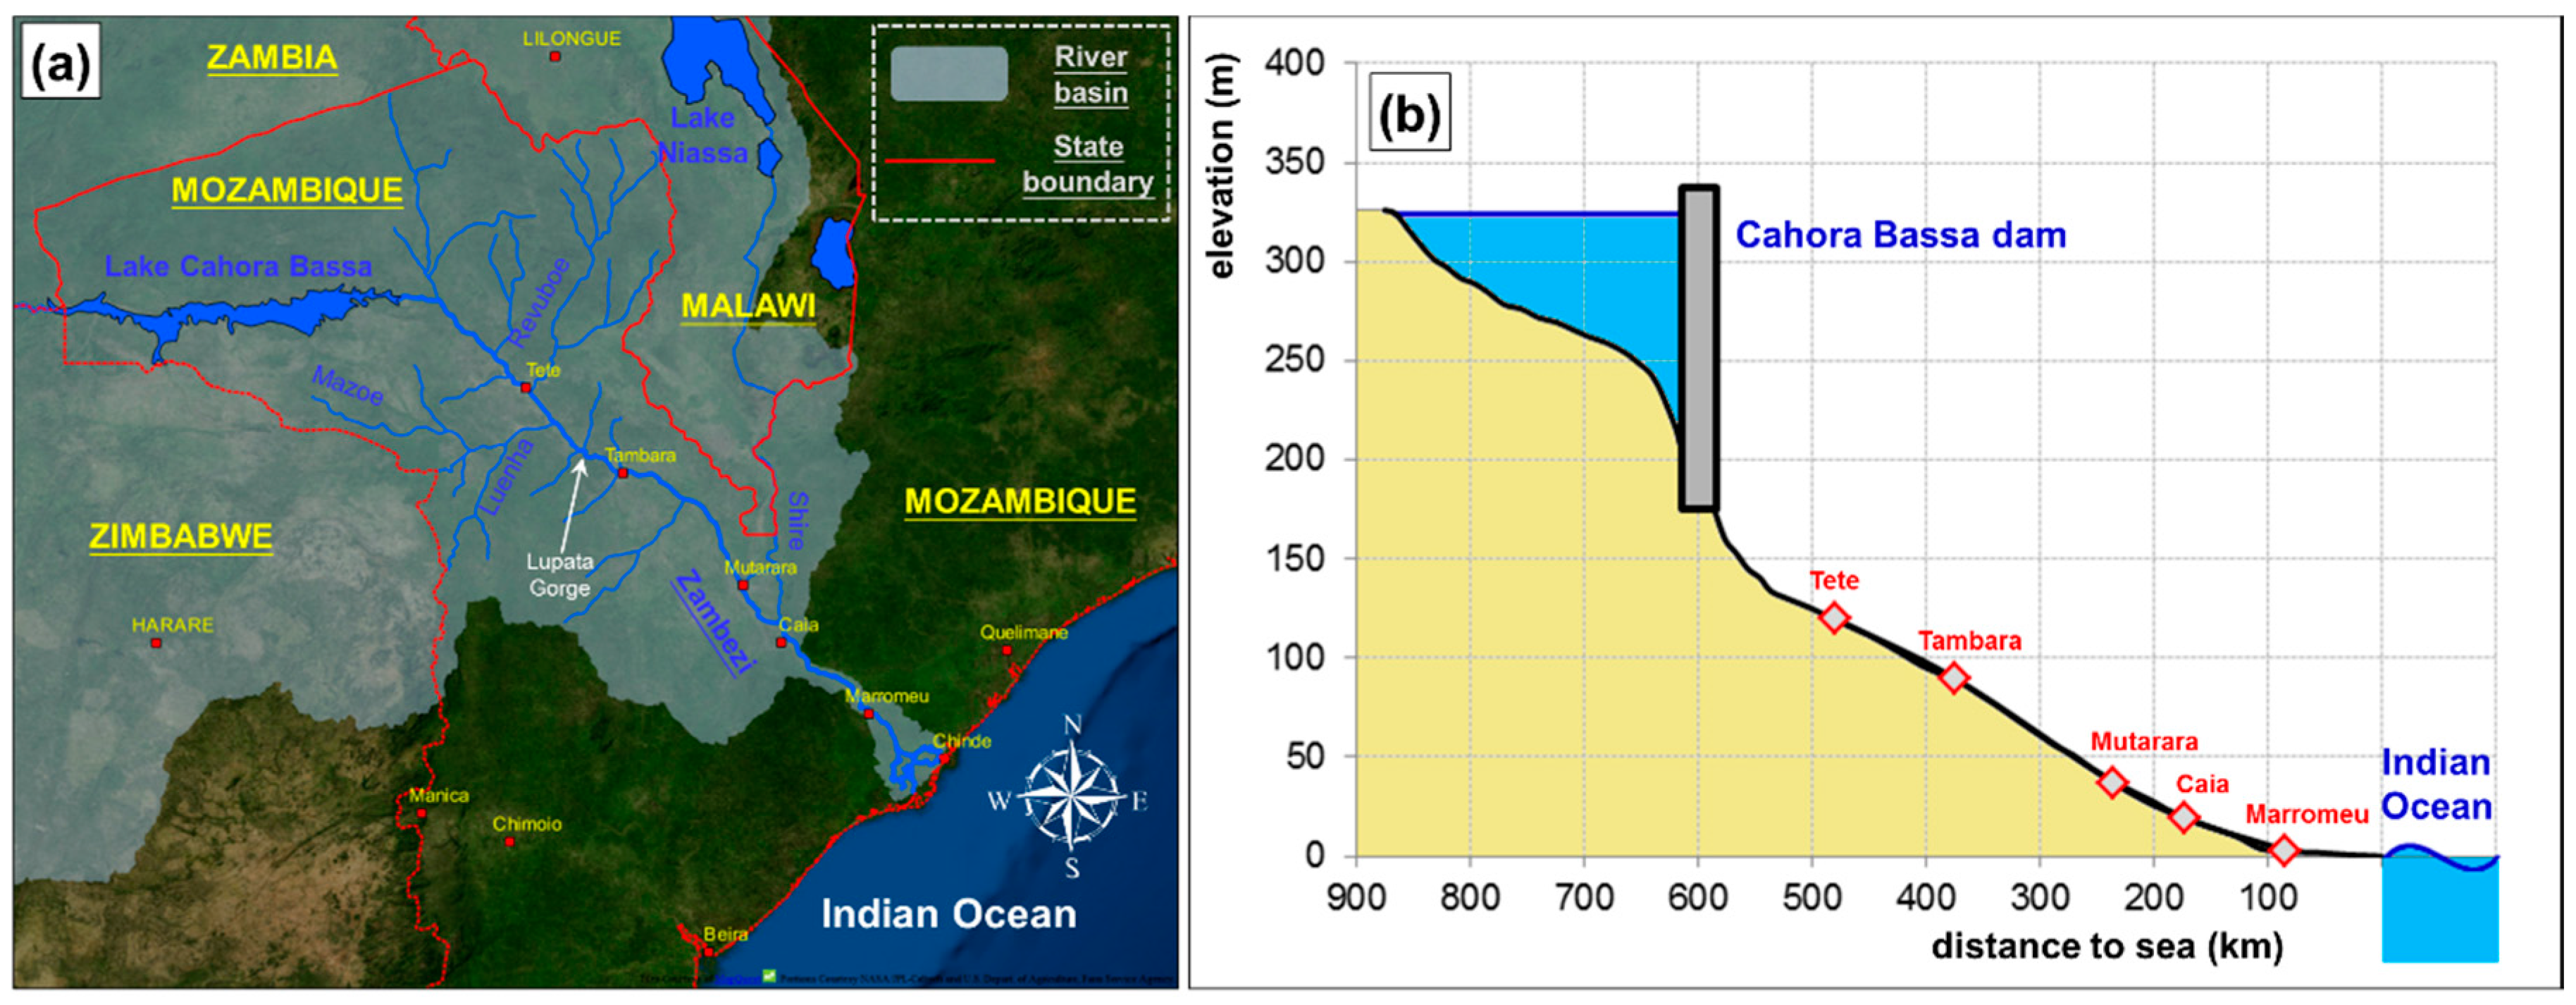
The lower Zambezi, about 593 km long [
2], is the segment of the river downstream of the Cahora Bassa dam, descending from the Central African Plateau to the Mozambique coastal plain and the Indian Ocean. The first reach, upstream of Tete, is characterized by boulder and bedrock outcrops with gorges and rapids [
9]. The alluvial plain begins downstream of Tete, where the river flows on Karoo sediments and is interrupted at Lupata gorge, near Mount Nhamalongo, where the river cuts volcanic rock outcrops (basalt and rhyolite) [
11,
12,
13] and the cross-section narrows to a few hundred meters. Downstream of the Lupata gorge, a large low-gradient alluvial plain characterizes the course of the river with multiple channels and islands covered by vegetation. The mouth of the Zambezi is a wide delta with very low gradients and altitudes, frequently subjected to flooding, depending on river flow and tide, which can extend up to 40–50 km inland [
7]. The delta is characterized by a rich alluvial soil with flooded grasslands near the banks and mangroves in the coastal zone.
The banks and riverbed of the lower course of the Zambezi are incised on the Cretaceous and Tertiary sedimentary cover of the alluvial plain, and are mostly composed of unconsolidated gravel and sand [
7,
9]. Unpublished previous results of grain size analyses on sediment samples taken on Zambezi river banks near Tete confirm the predominance of coarse sand, with an average of 76% of sediment in the range 0.5–1.0 mm.
Figure 2a reports a map of the lower Zambezi region, created using QGIS software and OpenLayers plugin with MapQuest-Open Aerial and OpenStreetMap data. In
Figure 2b, a longitudinal profile of the main stem of the river is plotted, derived from Ronco
et al. data [
14].
Regarding hydrology [
6], the rainfall is not uniform over the river basin, due to its wide extension. Estimated mean annual precipitation is about 950 mm/year; the highest values of rainfall (up to 1400 mm/year) occur in the northern parts of the basin and around Niassa Lake, while the lowest values are observed in Zimbabwe and the southern areas of the basin (about 500 mm/year). The climate of the basin is influenced by the movement of air masses in the Intertropical Convergence Zone (ITCZ), with major precipitations occurring during the summer months (November to March), while winter months (April to October) are generally dry. The mean annual runoff is estimated by different authors as either 103 billion·m
3 [
6], or 97 billion·m
3 [
7], or 130 billion·m
3 [
8]; the above values correspond to mean annual flows at the river mouth of 3264 m
3/s, 3074 m
3/s, and 4134 m
3/s, respectively.
Besides the main stem, the Zambezi River system comprises many important tributaries which can be regarded as major rivers on their own. The main tributaries are: the Kabompo, Lungue-Bunguo, Luanginga, and Cuando in the upper Zambezi; the Sanyati, Kafue, and Luangwa in the middle Zambezi, and the Luia, Revuboe, Luenha-Mazoe, and Shire in the lower Zambezi.
2. Impacts of Large Dams on the Lower Zambezi River
The construction of large dams in the middle Zambezi valley has profoundly altered the flow pattern of the river downstream [
5]. At present, with the only exception of contributions from Shire and minor tributaries, the course of the lower Zambezi is substantially regulated by the outflow at the Cahora Bassa dam, having lost the natural variability due to seasonal distribution of rainfall and runoff.
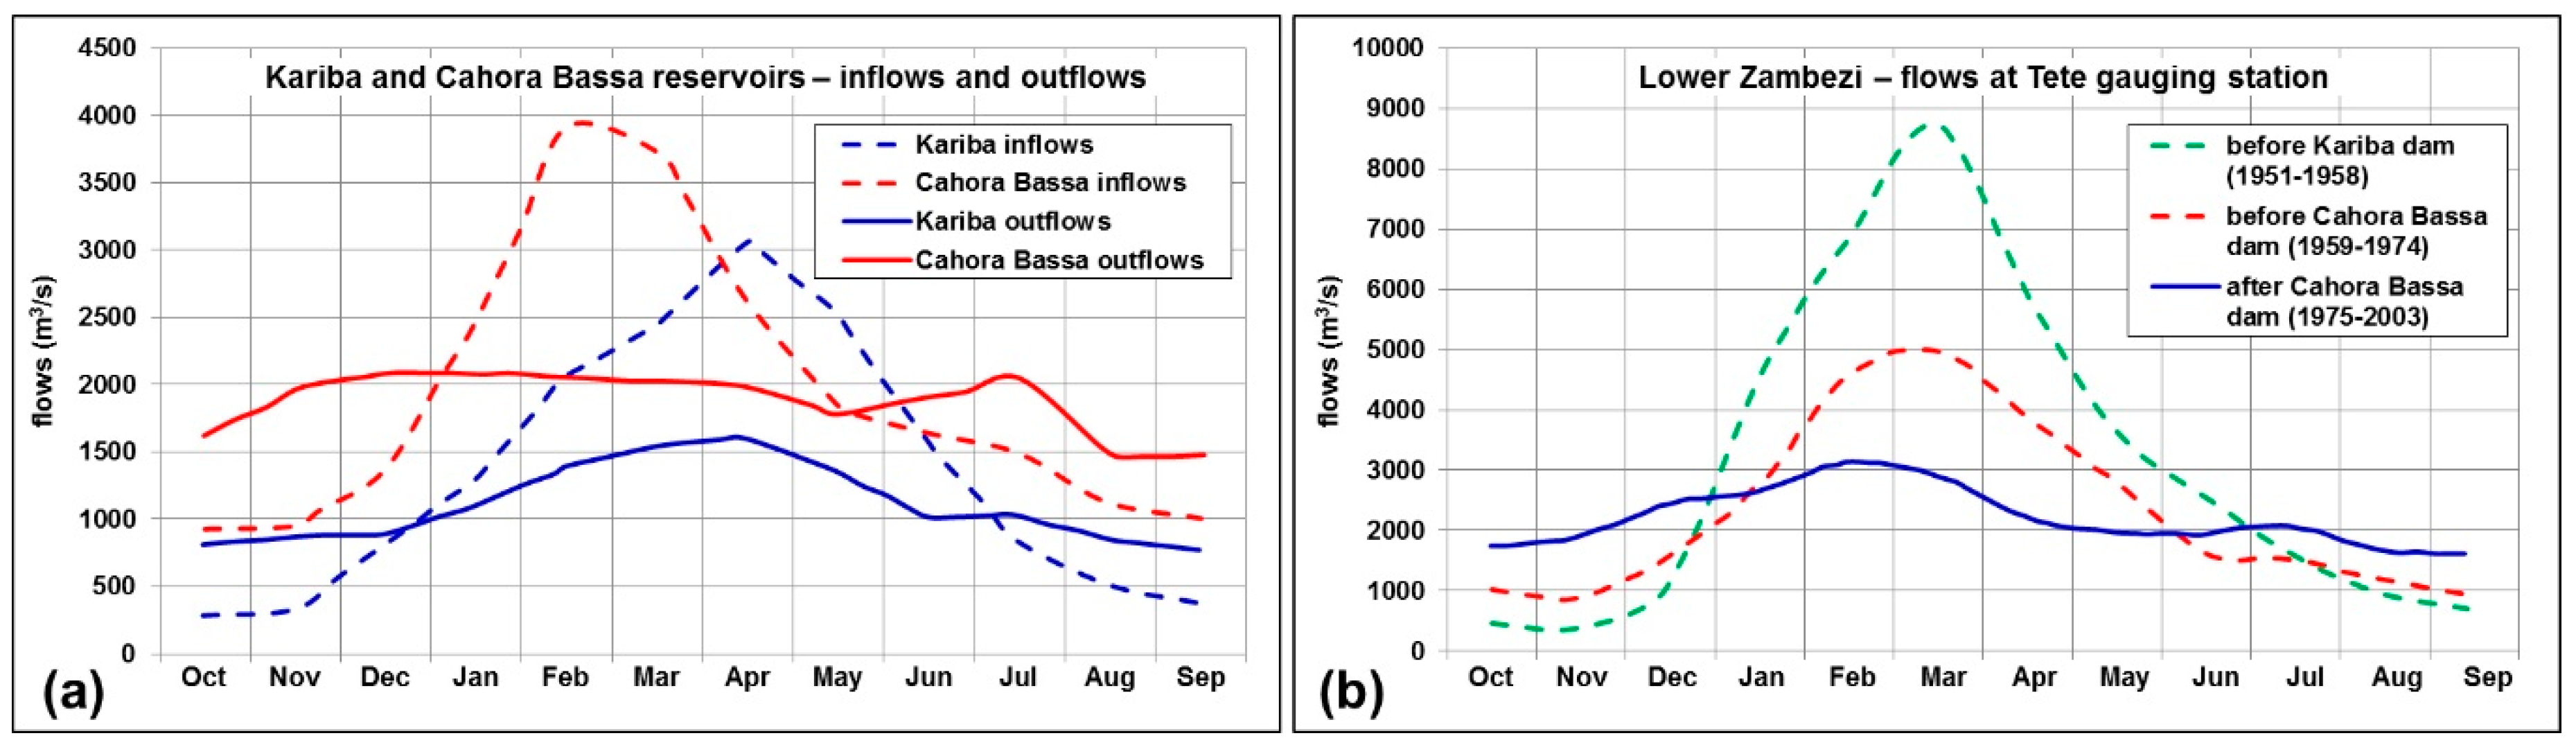
The change in the hydrological regime is clearly evident in
Figure 3. On the left (
Figure 3a), hydrographs of mean monthly inflows and outflows at the Kariba (1958–1998) and the Cahora Bassa (1975–1999) reservoirs are plotted [
5]. On the right,
Figure 3b illustrates the mean monthly discharges at the Tete gauging station [
15], about 130 km downstream of the Cahora Bassa dam, referring to three different periods, namely: before the Kariba dam construction (1951–1958), after the Kariba and before the Cahora Bassa dam construction (1959–1974), and after the Cahora Bassa dam construction (1975–2003). A strong reduction of maximum flows in the rainy months and an increase of minimum flows in the dry season are observed. As a result, discharges tend to be rather uniformly distributed during the year. From
Figure 3b data, considering the period after the Cahora Bassa dam construction, a mean annual runoff at the Tete gauging station of 69.4 billion·m
3 can be estimated, corresponding to a mean annual flow of 2198 m
3/s.
The effects of evaporation from the reservoir lakes are also to be considered. Regarding the Kariba reservoir, it can be estimated that about 11% of inflows are lost during the peak flooding months, with a mean annual net evaporation rate of 955 mm/year, whereas an annual net evaporation rate of 1523 mm/year can be assumed at the Cahora Bassa reservoir [
5]. Overall, the mean annual volume of water lost at the Cahora Bassa reservoir can be estimated as about 4.7 billion·m
3, approximately equal to 7% of the total inflows [
5].
Another important consequence of the impoundments is the trapping of sediments in the reservoirs. As reported by Bolton [
16,
17], the rate of sediment accumulation in Kariba Lake was briefly considered in the pre-impoundment studies based on a limited number of samples, whereas no quantitative estimations of sediment transport were reported for the Cahora Bassa dam at the design stage. The author performed an independent study and estimated a mean annual sediment input in the range 7–70 million·m
3/year at Kariba Lake, and 20–200 million·m
3/year at Cahora Bassa Lake. More recently, Ronco
et al. [
15], combining previous turbidity measures and hydrological data, estimated the total sediment input at Cahora Bassa Lake as 28.6 million·m
3/year, of which 14.6 million·m
3/year flows in from the main stem of the middle Zambezi and 14.0 million·m
3/year from the Luangwa tributary. Unfortunately, the above estimations cannot be confirmed by direct measures, since no data from bathymetric surveys or other monitoring activities aimed to quantify the sediment deposition at the Kariba and Cahora Bassa reservoirs are reported in literature.
The construction of large dams had important consequences on the morphology of the river downstream. According to the classical Lane’s formulation [
15,
18,
19], the flow regulation and the reduction of sediment load alter the natural equilibrium of the river with two opposite effects. Namely, considering the sediment grain size and stream slope constant, the peak flow reduction lowers the transport capacity and would tend to cause sediment deposition and aggradation of the riverbed, whereas the reduction in sediment load would induce riverbed erosion downstream. Thus, the actual morphological changes are the result of complex interactions between different components affecting the equilibrium conditions of the river.
Based on aerial photographs and field measures, Guy [
20] reported severe erosion of the southern banks of the middle Zambezi valley downstream of the Kariba dam. The author concluded that, besides the nature of soil, erosion can be due to out-of-season floods, induced by dam operation and the release of sediment-free water downstream.
Suschka and Napica [
21] discussed the modifications induced on the lower Zambezi by the Cahora Bassa dam, reporting an almost complete lack of investigation during the 10 years after the construction of the dam. The authors concluded that, despite some consequences which were obviously expectable, no evident changes in the riverbed morphology could have been estimated, and a much longer period of observation should have been necessary to find noticeable effects.
Davies
et al. [
9] distinguished different macro-scale morphological zones in the lower Zambezi River, comprising narrow gorges, transitional zones referred to as “mobile sands zones”, an anabranching zone, and a coastal distributary zone. Based on observations from an aerial survey conducted in 1996, dramatic changes in the river system were reported due to flow regulation, with a different response for each of the above morphological zones. Namely, erosion of the bars in the gorges was noticed, with removal of larger sediment stores due to the increase of low flows during the dry season. Sediments eroded in the gorges were conveyed in the mobile sands zones, causing stabilization of the braids and bar and increasing areas of stable floodplain. In the anabranching and distributary zone, even with slight differences, the reduction in the magnitude and frequency of inundation in the rainy period seemed to cause the dominance of one main channel, with isolation and progressive obliteration of small secondary channels. Finally, the authors reported a huge erosion in the delta and coastal zone, with significant coastline retreat due to reduction of sediment supply.
It is to be noted that the studies summarized above are mainly based either on macro-scale observations or on first-approximation measures. As for siltation at water impoundments, no bathymetric surveys of riverbed or systematic in situ monitoring studies, aimed at a quantitative estimation of geomorphological changes after the construction of dams, are available in literature.
Ronco
et al. [
14,
15] applied a simplified one-dimensional mathematical model based on the “local uniform flow” hypothesis to simulate the sediment transport and long-term morphological evolution of the Zambezi River between the Cahora Bassa dam and the Indian Ocean. Simulations were performed, both in the present condition (with dams), and by assuming that the dams were not built. Simulations without dams showed a general tendency toward bottom aggradation for the largest part of the lower Zambezi, especially in the flat areas downstream of the gorges. As regards the effects of the dams, for the first time after the start of the simulations, the flow reduction seemed to prevail, inducing an increase in the sediment deposition rate in the flat areas, whereas a reduction in sediment load due to siltation in the reservoirs began to show its influence at a longer simulation time, with a smaller aggradation or a higher erosion rate of the riverbed compared to the natural conditions. The computed reduction of sediment supply to the deltaic area yielded results satisfactorily consistent with the rates of coastal erosion estimated from satellite images.
The one-dimensional model described above was recently implemented by adding a quasi-two-dimensional module which simulates the evolution of the cross-section shape, also taking into account the dynamics of riparian vegetation [
22]. Simulations in the presence of the dams showed that the river would tend to simplify its path, with the deepening of a main channel, and the increase of vegetation density and progressive obliteration of secondary channels, in agreement with Davies
et al. [
9]. The simplified formulation of the model allows us to significantly reduce the amount and resolution of input data for simulations, making it possible to use remote sensing images and large-scale digital elevation models derived by satellite observations [
23].
More generally, the overall impact of water impoundments on the Zambezi River system and community is an interesting matter of debate among scientists, practitioners, politicians, and both governmental and non-governmental organizations—sometimes with very different opinions. The debate deals with different topics such as ecology, agriculture, fishery, and other economic activities, as well as ethical, social and cultural issues, which are not discussed in the present paper. It is just noteworthy to mention that the first concerns about potential impacts of the Cahora Bassa dam were expressed even before the filling of the reservoir [
24,
25], and that the discussion is still open as documented, besides already cited works, by a number of papers, dealing with both the evaluation of impacts and the proposal of mitigation measures, considering expected climate change scenarios as well [
26,
27,
28,
29,
30,
31,
32,
33].
3. The Field Activities
During March 2013, a bathymetric survey was performed along a reach of the lower Zambezi River near Tambara, about 230–240 km downstream of the Cahora Bassa dam. The survey was conducted in the framework of a wider research program, in cooperation with
Minas Rio Bravo Lda., a mining company based in Mozambique. A detailed description of operations and results can be found in an ENEA technical report, in Italian [
34]. The month of March, immediately after the end of the rainy reason, was chosen in order to work with both dry weather, and because the expected high water level would enhance navigability.
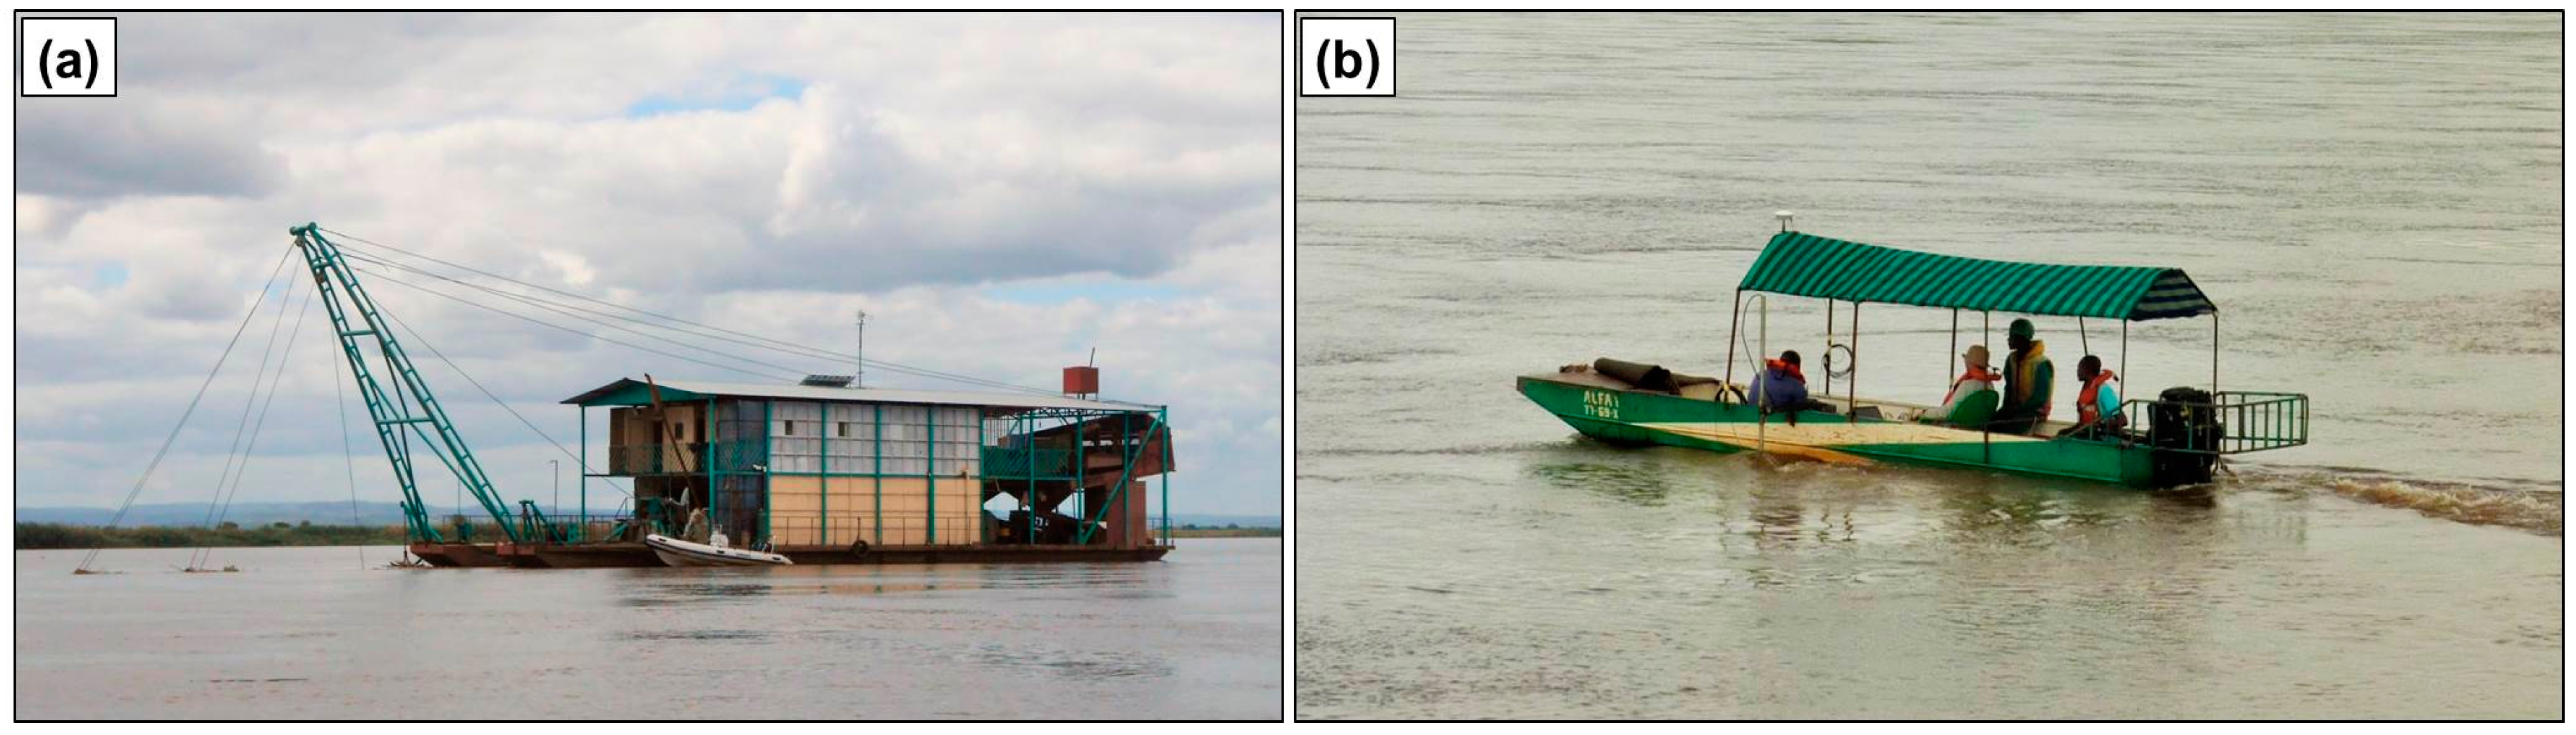
The
Rio Bravo dredging platform, about 30 m long and 10 m wide (
Figure 4a), was used to transport personnel and instrumentation along the Zambezi and served as a logistic base during the field survey.
The main resources used for hydrographic surveys are listed as follows:
- ▪
Single-beam echo sounder Odom Echotrac DF3200 MKII, dual frequencies 24–200 kHz, for bathymetric measures.
- ▪
Trimble Modular GPS receiver SPS461 (72-channel L1 C/A Code, L1/L2 Full Cycle Carrier GPS receiver) for positioning.
- ▪
Trimble HydroPro software for survey planning, integrated real-time navigation-acquisition and first data processing.
- ▪
Golden Software Surfer for data elaboration, construction of riverbed digital models through interpolation and graphic presentation of results.
The survey vessels and personnel for navigation were provided by Minas Rio Bravo Lda., whereas the authors attended to the navigation plan and equipment setup and operation, providing real-time instructions to the helmsman during the surveys, based on GPS data.
According to indications provided by the authors, two steel work boats (
Alfa1 and
Alfa2) were adapted to place equipment and surveyors (
Figure 4b). The echo sounder transducer was mounted at the port side of the survey vessels using a pole and an
ad hoc designed steel framework.
According to the state of the art [
35], the sound velocity in the echo sounder was calibrated prior to each survey. Both the bar check technique and indirect estimations based on water temperature and salinity obtained by multi-parameter probes were used for calibration. Bar check calibration was performed by lowering an iron plate at known depths below the transducer, and regulating the sound speed in the echo sounder as an adjustment parameter. Eutech PH600 and Eutech COND600 probes were used to measure the water temperature and conductivity, respectively.
More details on the instruments’ calibration and measurement techniques are given in the next section which is dedicated to discussion of the results.
Depths below the river surface were simultaneously acquired using both frequencies of the echo sounder referred to as high frequency (200 kHz) and low frequency (24 kHz), respectively.
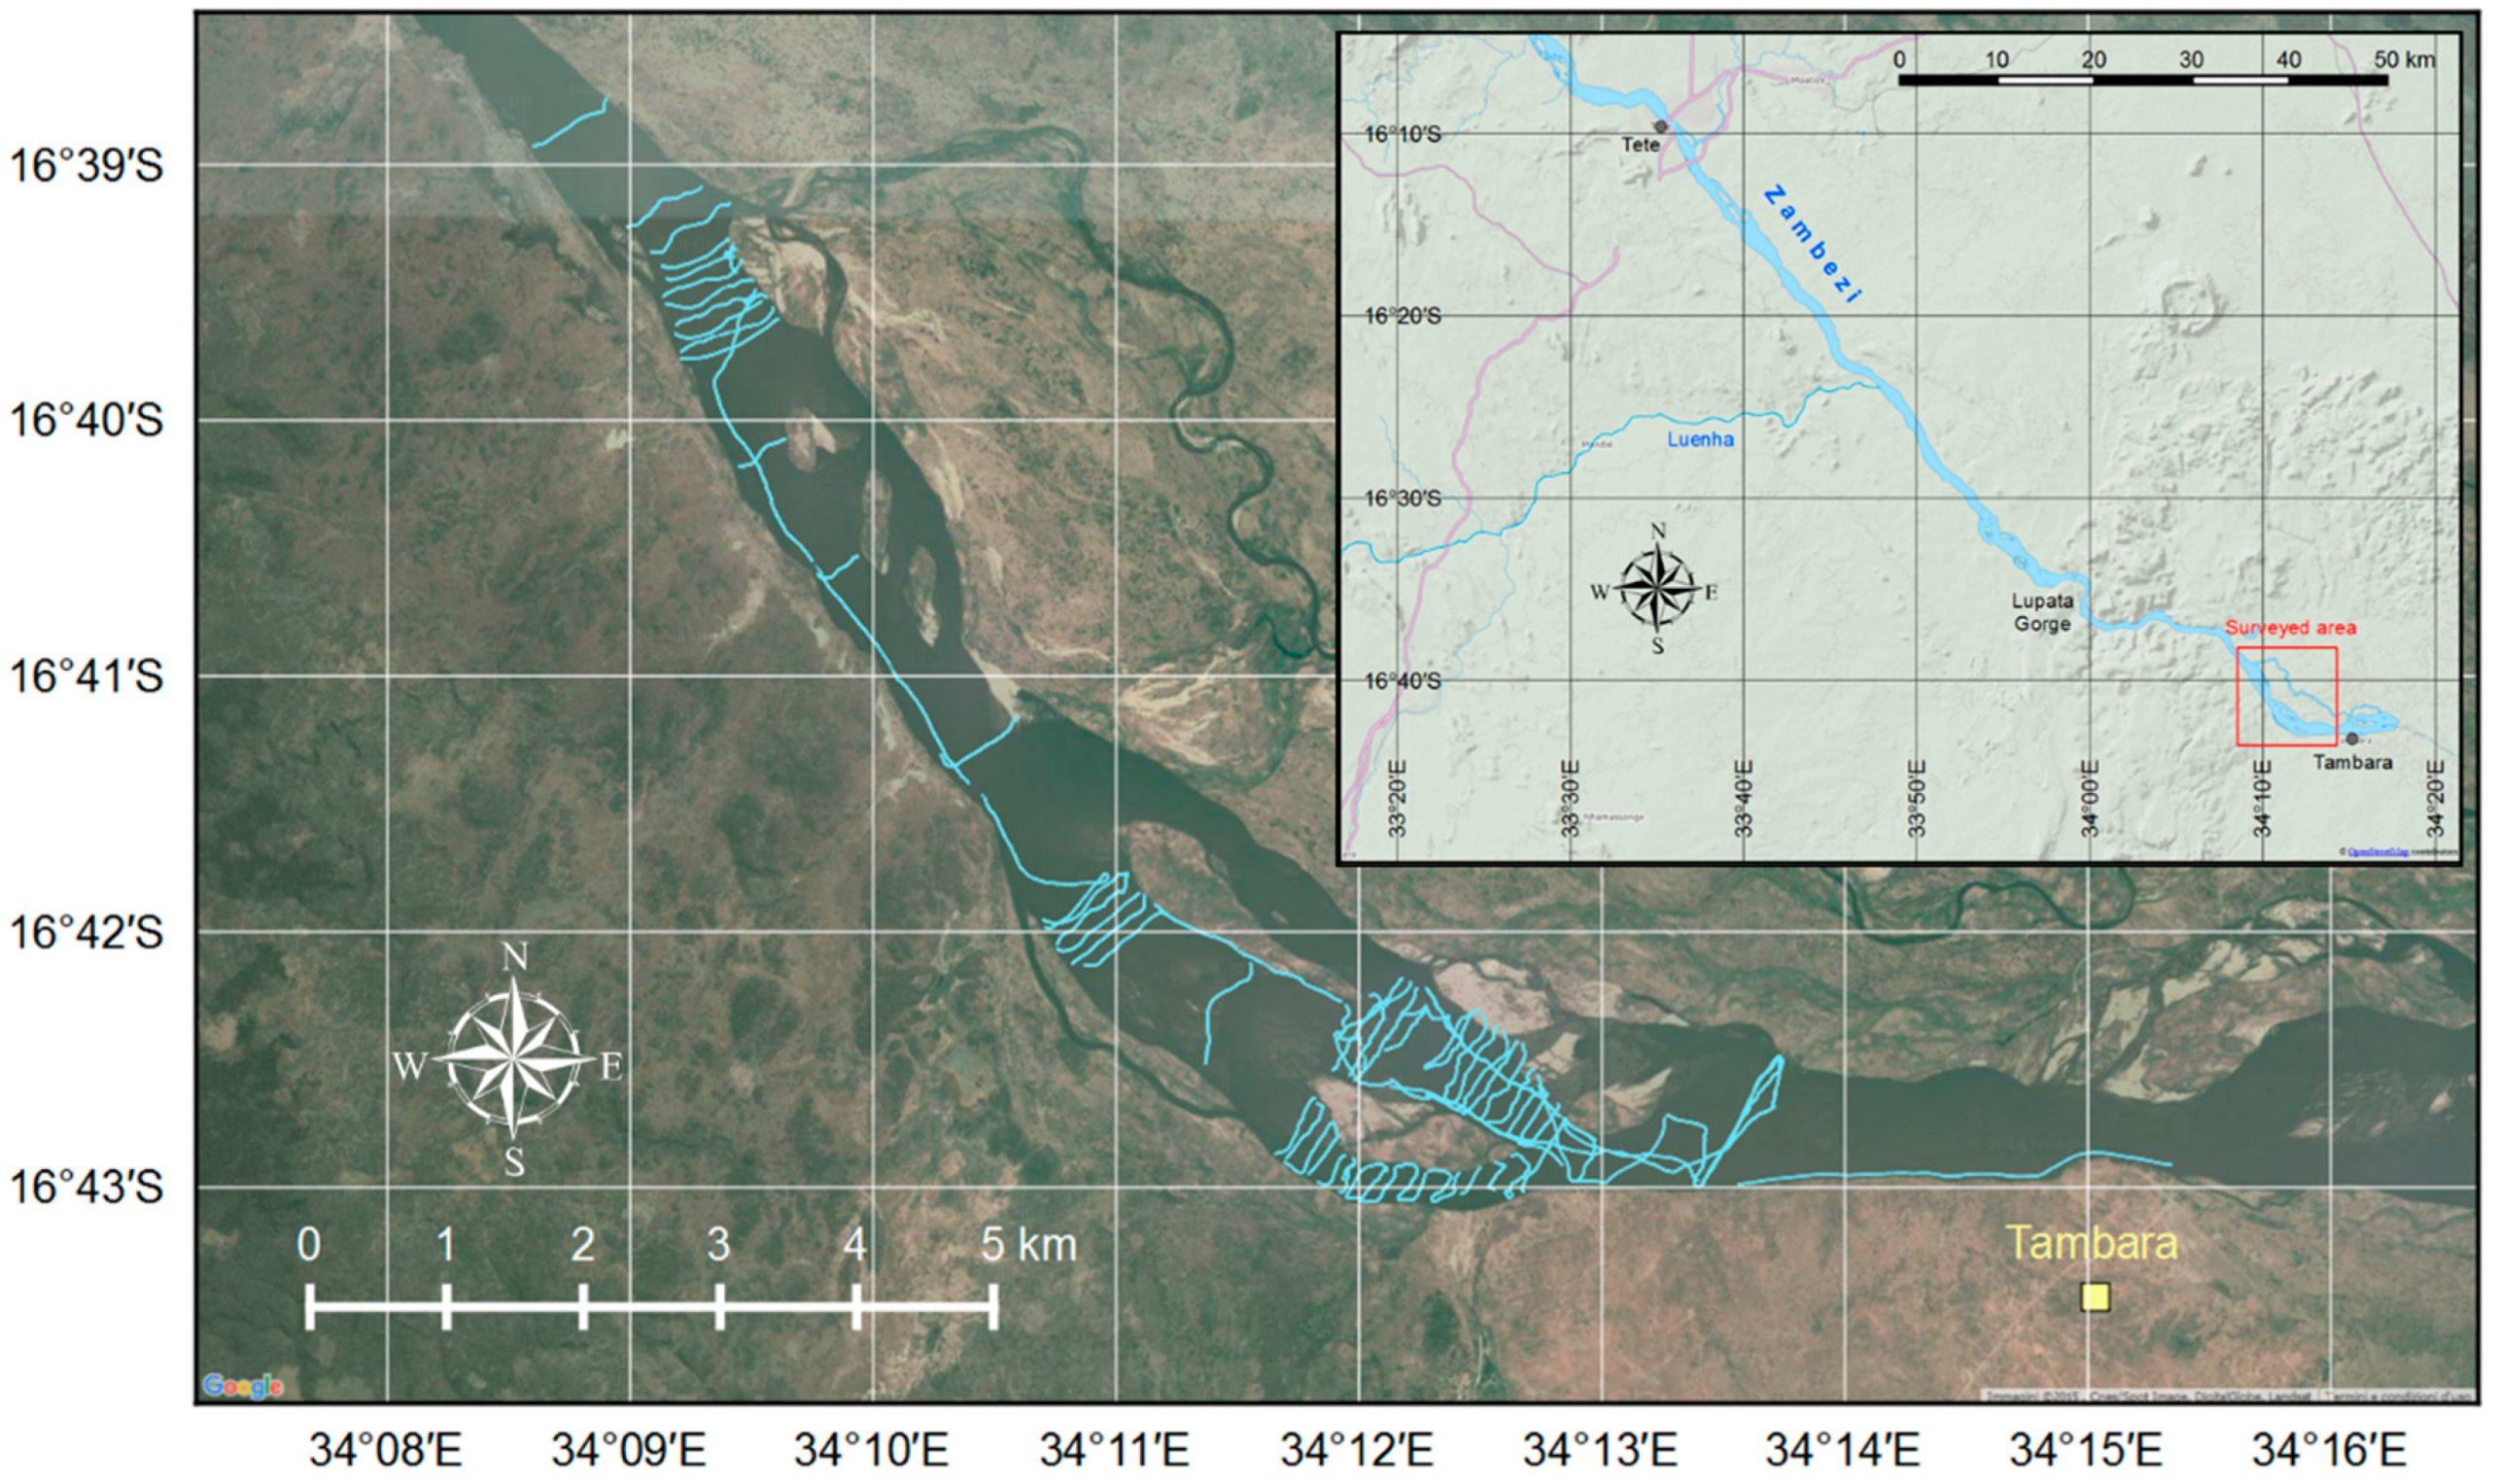
The surveyed area lies between latitudes 16°38′43″–16°43′03″ South and longitudes 34°08′35″–34°13′45″ East. Bathymetry was measured along river cross-sections with spacing in the range 800–1500 m; in the areas of major interest, the distance between survey lines was reduced to about 100 m. Additional position measures were also taken along the river banks and the island shores where the depth was compatible with the navigation and the operation of the echo sounder.
In
Figure 5, a geographical setting of the investigated area and a plan-view of the survey data are plotted; maps in
Figure 5 were created using QGIS software and OpenLayers plugin with Google Maps and OpenStreetMap data, respectively.
Submerged shoals and a general morphology of the river banks and islands, quite different from geographical information available at the planning stage, were noticed during the surveys. Environmental and operating conditions (in particular the presence of sparse crocodiles and bloats of hippopotamuses) also played a role during the survey operations, sometimes leading to changes in the execution of survey lines compared to the navigation project.
As regards data processing, raw survey data were first filtered to remove spikes and gross errors. Then, bathymetric grids were derived using the Surfer software. The Kriging algorithm, specifically suited for irregularly spaced data [
36], was chosen for interpolations. Contour maps and cross-sections were finally derived from the bathymetric grids. The UTM 36 South-WGS 84 coordinate system was adopted for cartographic projection.
4. Results and Discussion
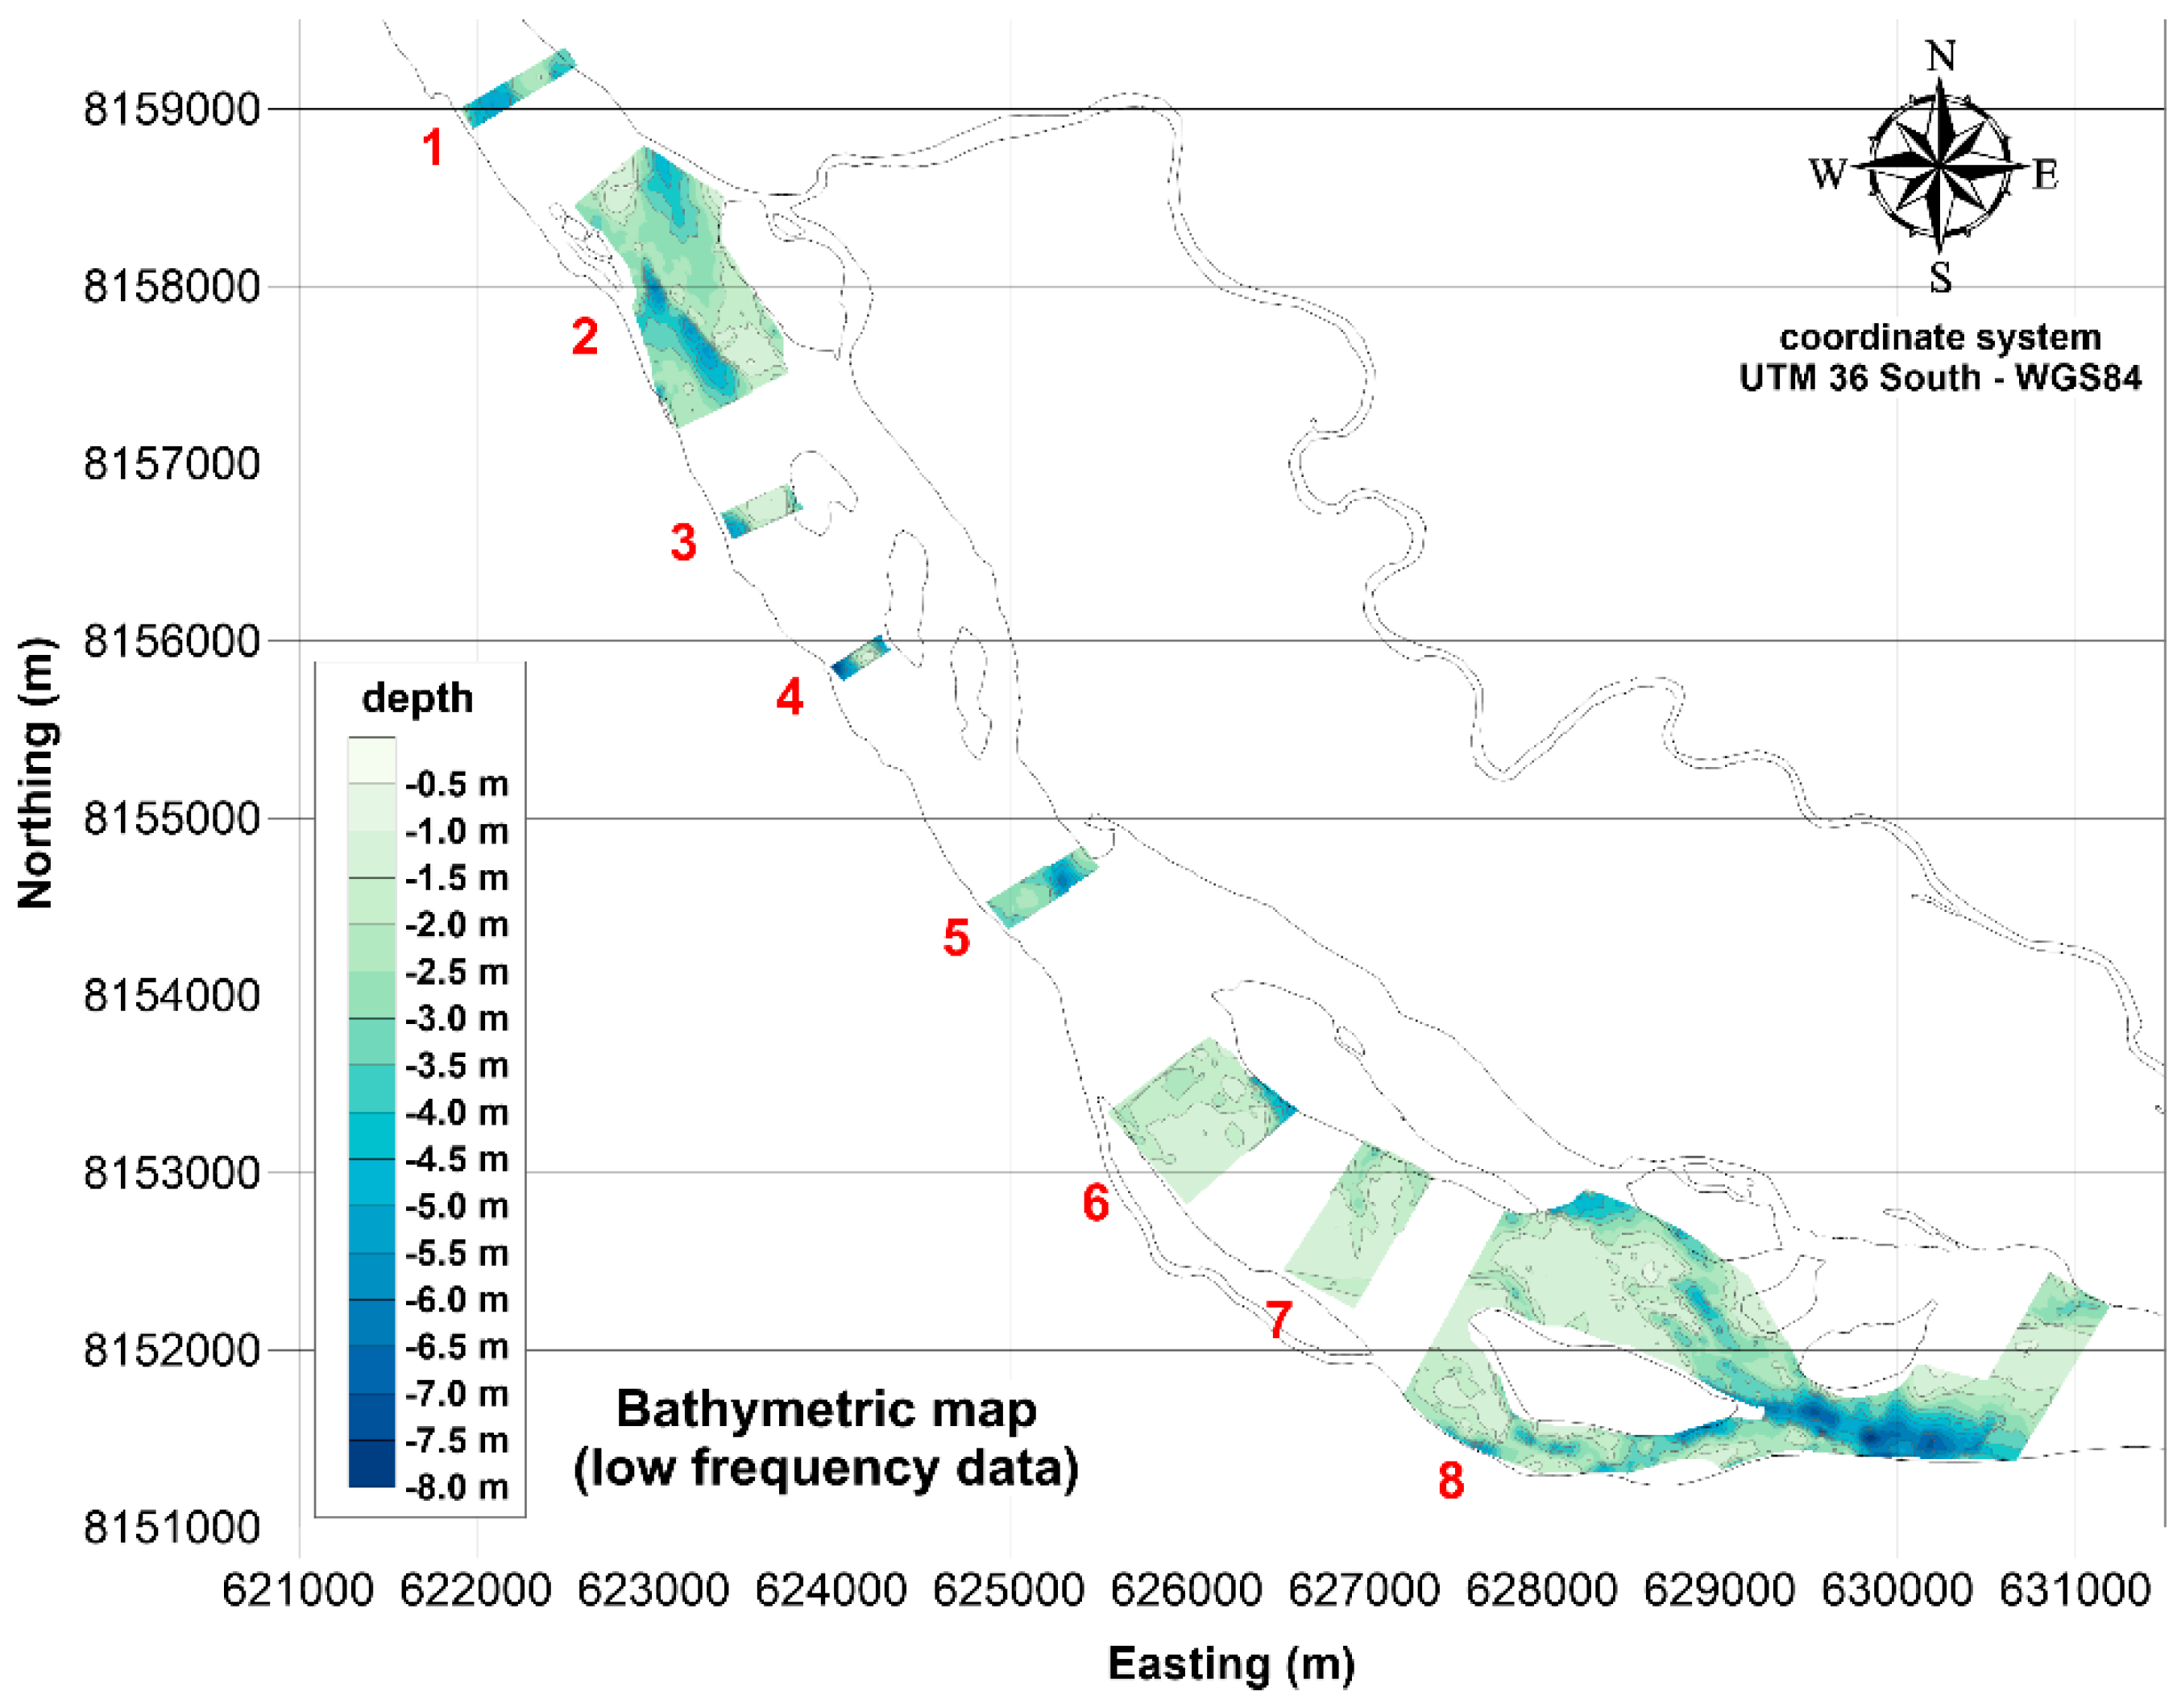
In
Figure 6 and
Figure 7, the contour maps of the surveyed area derived from both high and low frequency data are plotted. As shown in the Figures, based on spatial distribution of data, bathymetric grids were derived for eight different zones; among them, zones 1, 3, 4, 5, and 7 are comprised of a single cross-section, whereas zones 2, 6, and 8 also extend along the river flow direction.
The highest values of depth, say 8.0 m, were measured close to the eastern limit of the survey area, where the river flow is confined to a relatively narrow section delimited by an island (zone 8).
As shown in the graphs, it was not always possible to investigate the entire river cross-section, due to the presence of islands, shoals, and shallow water zones, where navigation and sounding were severely restricted.
A map of the bathymetric differences between high and low frequency data is plotted in
Figure 8. To a very large extent, a shift of tens of centimeters between the two signals can be observed, with low frequency depths generally greater than high frequency soundings.
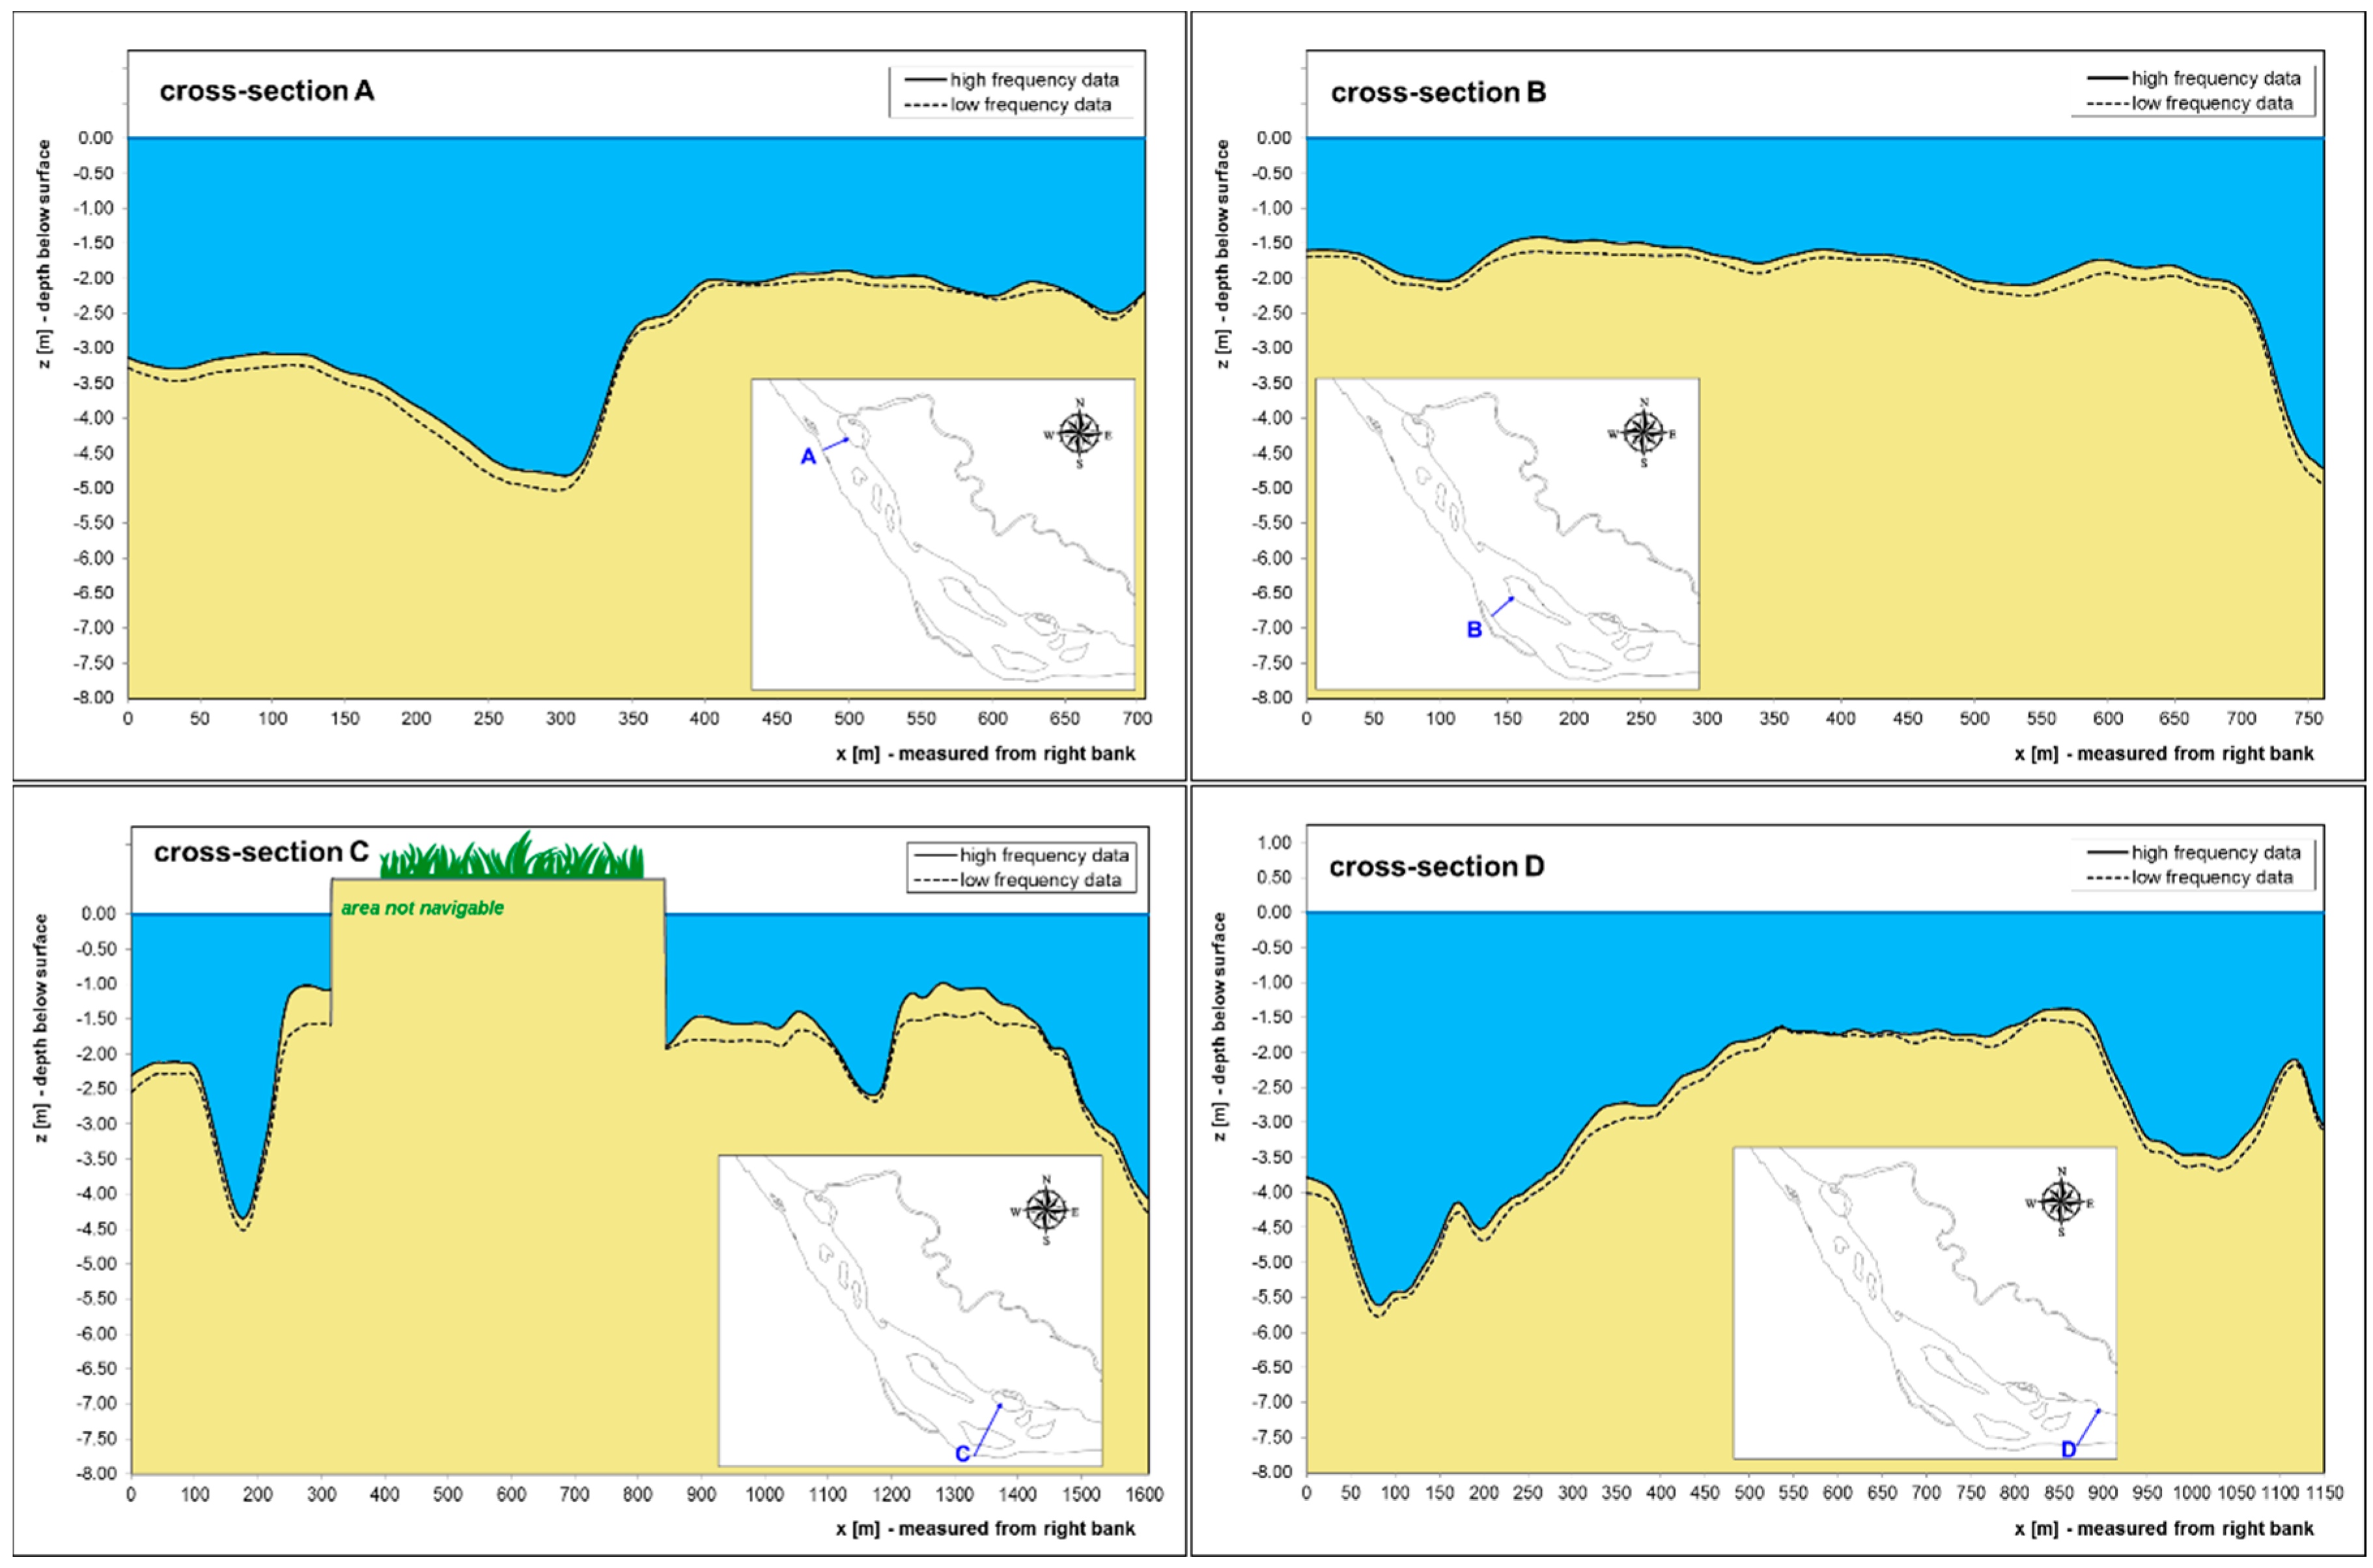
In
Figure 9, some transects derived from bathymetric grids are plotted, which, despite some differences, can be considered representative of the main morphological types of river cross-sections observed from the survey data. The plotted cross-sections show the presence of one or a few main channels, with higher depth located either in the middle or near the bank of islands. As expected, the highest values of depth in the main channel were measured in the narrowest cross-sections.
The instruments’ accuracy and resolution, and the main possible sources of measurement uncertainties [
35] are discussed below:
- ▪
Depth sounding. According to Odom Echotrac DF3200 MKII technical documentation [
37], the digitizer accuracy can be assumed as 0.0425% of the total measured depth, while resolution is 1 cm in the depth range 0–600 m. The transducer resolution can be assumed to be of the same order of magnitude of the acoustic wavelength and, basically, depends on operating frequency; for a reference sound speed of 1500 m/s, wavelengths can be estimated as 0.75 cm for 200 kHz frequency, and 6.25 cm for 24 kHz. The effect of acoustic beam angles was considered negligible due the relatively low values of depth and bottom slope.
- ▪
Sound speed. Uncertainties in the bar check procedure basically depend on environmental and operating conditions, and are difficult to quantify. Regarding water parameters, according to the probes’ technical specifications [
38], resolution and accuracy can be estimated as 0.01 µS/cm ± 1% full scale +1 LSD for the range of measured conductivity and 0.1 °C for temperature measures. Salinity and sound speed were computed using the formulation proposed by UNESCO [
39]. Overall, little variations in water parameters were observed during the survey, and calculated values of sound speed were substantially consistent with results of the bar check calibration. Observed differences of sound speed resulted in possible differences in depth estimation, in the range 1–4 cm.
- ▪
Horizontal Positioning. According to Trimble SPS461 technical documentation [
40], a sub-metric horizontal accuracy can be achieved when the GPS receiver operates with satellite differential correction. In cases where the receiver is operated in autonomous mode, the actual positioning accuracy is difficult to quantify, depending on a number of factors including the satellites’ number and position, meteorological conditions, and receiver features. Overall accuracy was also verified, comparing test positioning data and ground control points measurements. Plots of survey points on recent satellite images, as in
Figure 5, showed a sufficient agreement.
- ▪
Vessel heave, pitch and roll. Vessel heave, pitch, and roll were minimized during the survey, limiting the survey speed to a maximum of 3 kn. Overall, the effects on bathymetric measures were considered negligible compared to other possible error sources.
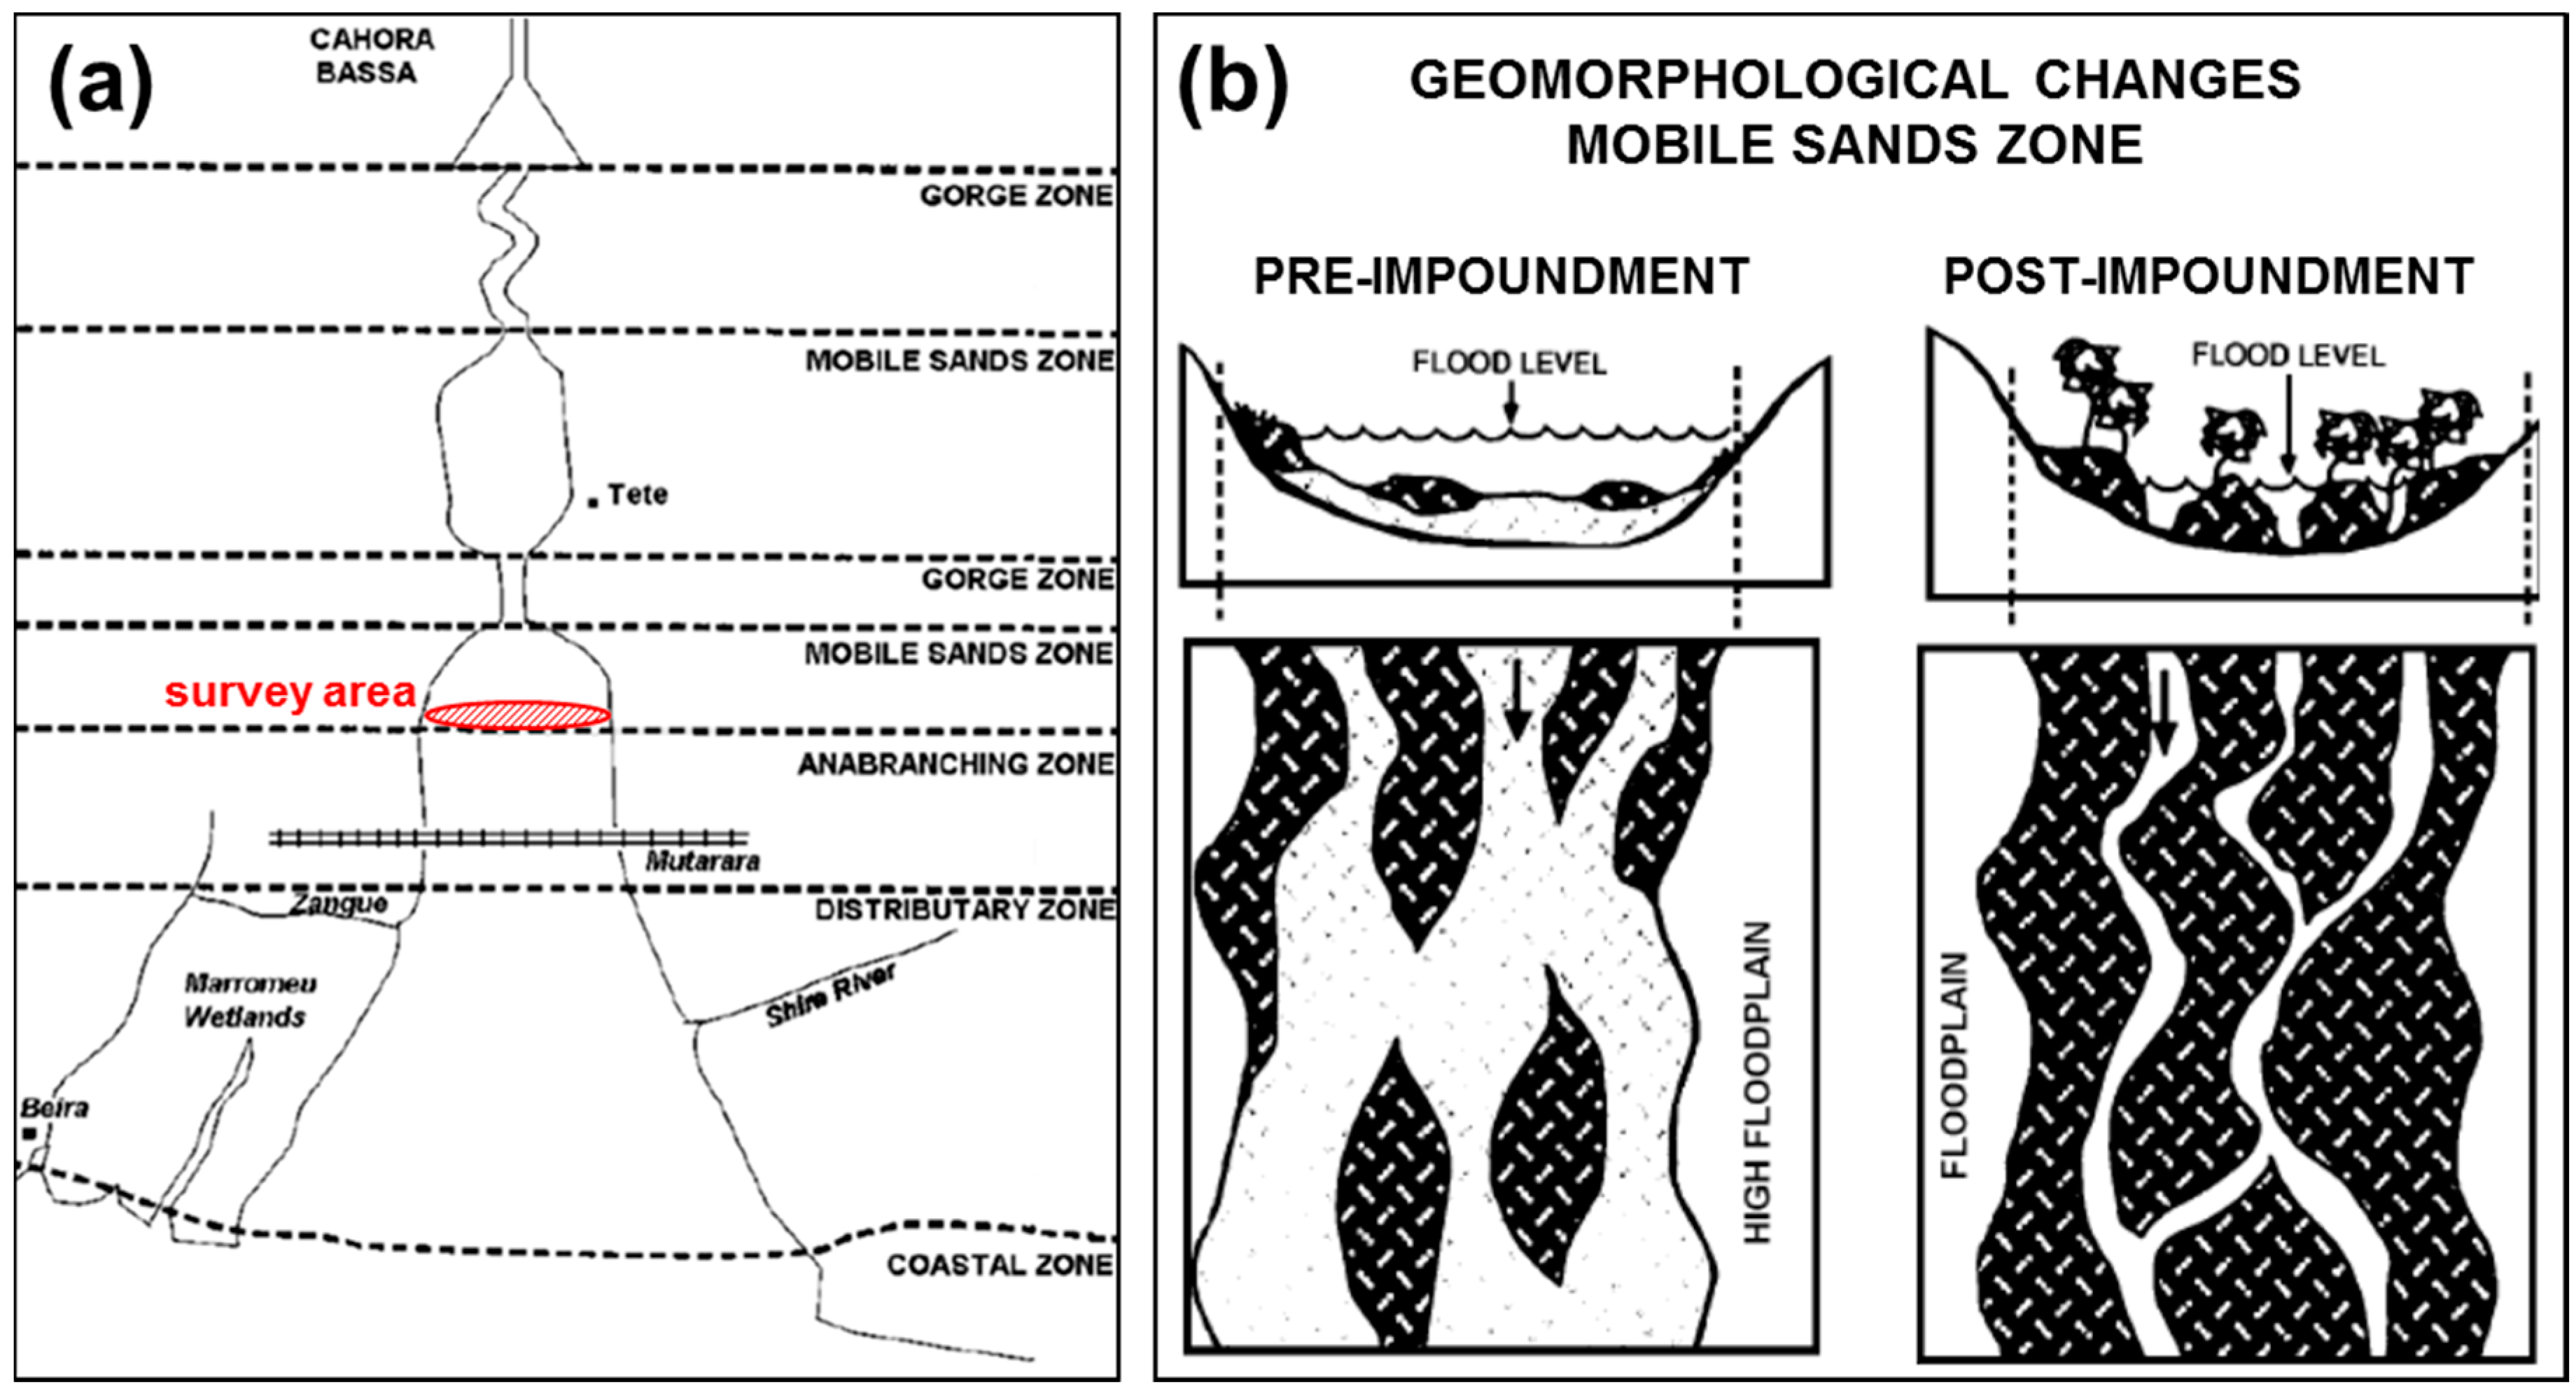
In the absence of data from previous
in situ measures, the results of the present survey were qualitatively compared with observations reported in literature on the river morphology after the construction of the Cahora Bassa dam (
Figure 10).
According to the morphological zonation proposed by Davies
et al. [
9], the present survey area lies in the “mobile sands zone”, close to the boundary with the “anabranching zone” (
Figure 10a). As already discussed, the mobile sands zones can be regarded as transitional zones between the narrow gorge zones (dominated by boulder and bedrock outcrops and high stream energies) and the large floodplains composed of a series of anabranch channels, characterized by low values of gradients and stream energy. In the mobile sands zones, the gradients and stream energy are lower than in the gorge zones, but still relatively high compared to the anabranching zone; the river is braided and the riverbed is mostly made of fine gravel and sand, with high sediment fluxes [
9].
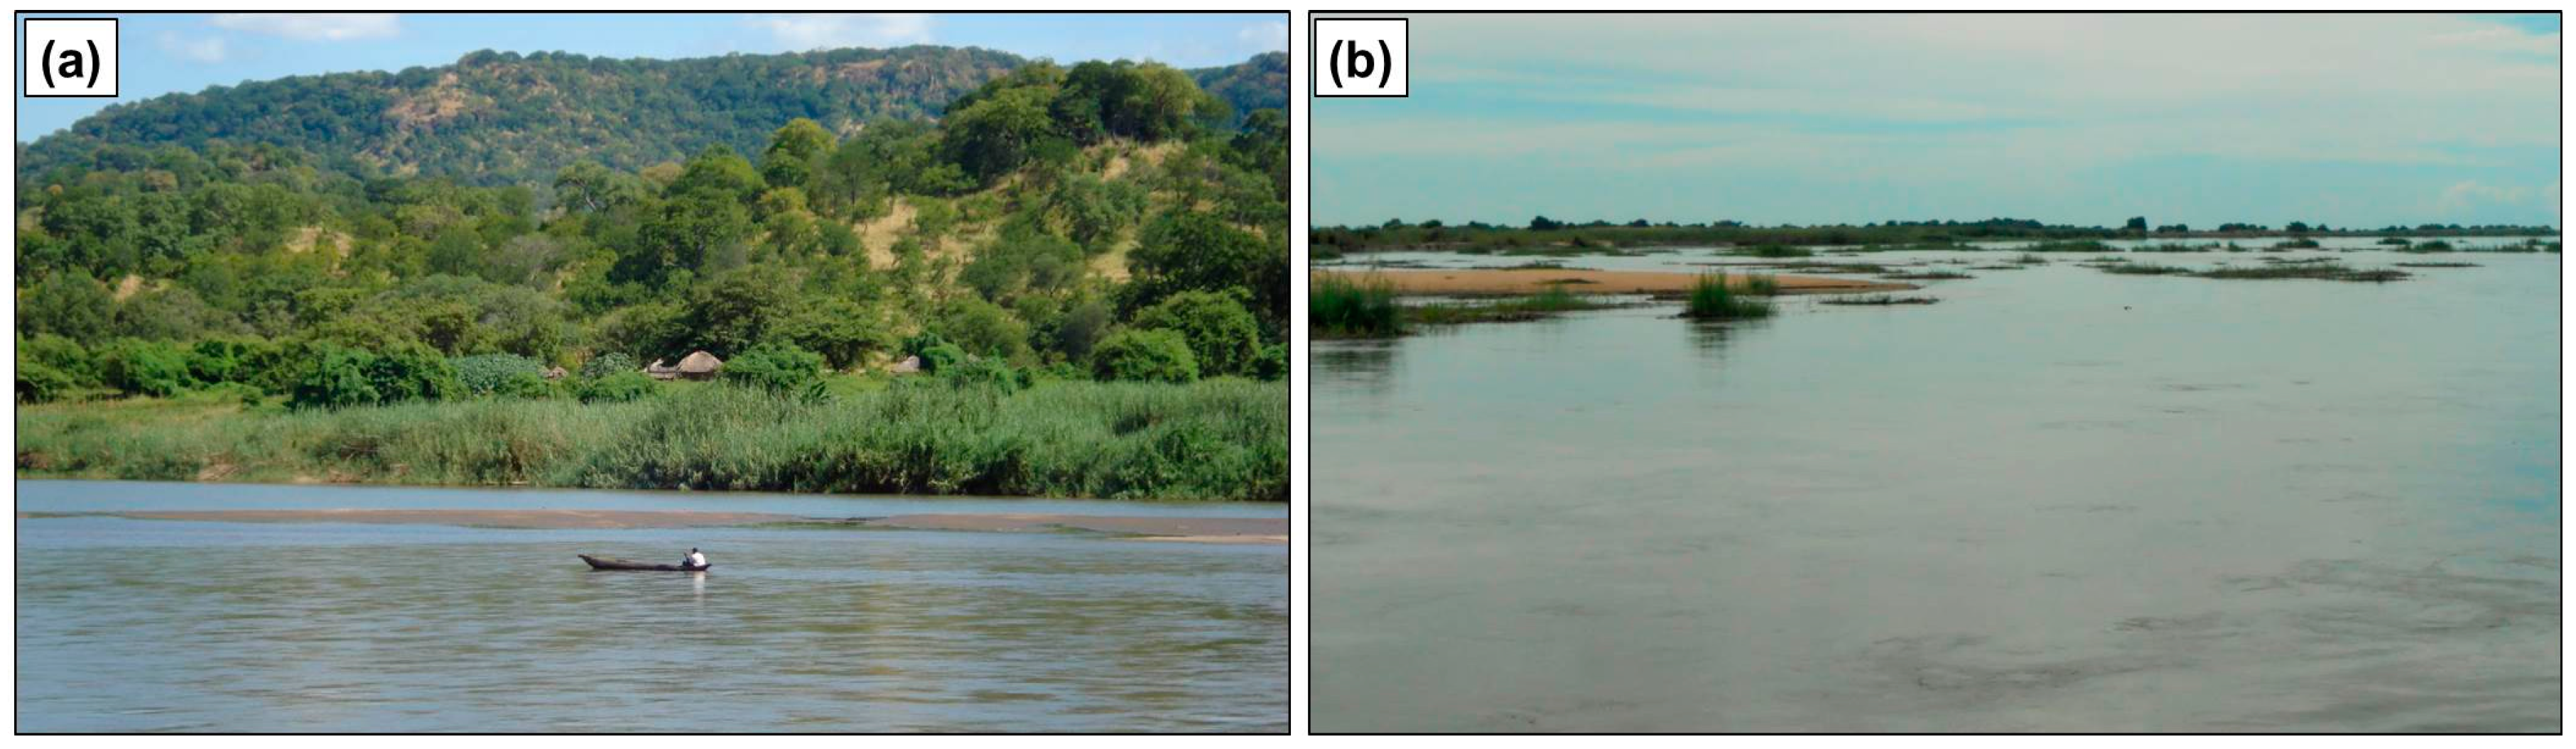
The
Figure 11 illustrates two pictures taken during the survey, showing evident analogies with schemes depicted in
Figure 10b. Pictures in
Figure 11a,b were taken, respectively, near the upstream and downstream boundary of the surveyed area.
Measured cross-sections’ shapes plotted in
Figure 9 qualitatively show a reasonable agreement with morphological macro-features of expected post-impoundment cross-sections depicted in
Figure 9b, with one or few main flow deeper channels incised in a relatively flat shallow water cross-section. In particular, cross-sections A and B have a single main channel, while sections C and D show a more complex bathymetry with multiple channels. In order to correctly compare the measured cross-sections with the Davies
et al. schemes [
9], it should be considered that the present survey was performed just at the end of the rainy season when the water level was near the highest annual values.
Finally, the difference between the high and the low frequency depths can be explained, because the high frequency signal, besides having a higher measurement resolution, is more sensitive to low density gradients than the low frequency one, and records as “bottom” the first interface at which a certain density value is exceeded. On the other hand, a lower frequency signal is less sensitive and is also able to penetrate for a limited depth into the first bottom layer when it is made of soft materials. A nearly uniform shift between the high and low frequency soundings would suggest the absence of macroscopic anomalies in the riverbed coverage materials, whereas zones with higher differences could be hypothesized as the result of a more recent lower density sediment deposit or a fluid mud [
42]. The above qualitative considerations, however, should be taken with caution, considering the different resolutions and accuracies of high and low frequency signals. Moreover, in the present work, it was not possible to adequately calibrate the instrument’s response on different riverbed materials and coverages.
5. Conclusions
The field investigation hereby reported provided quantitative information on a limited but significant reach of the lower Zambezi River. During the survey, it was also possible to recognize the main morphological features of the river downstream of Tete, described in early literature. The main limitations to the extension of the surveyed area were due to logistic and environmental conditions. In particular, it was not possible to extend the survey to the entire river cross-section in some areas, where navigation and sounding were restricted, due to obstacles or shallow water.
Despite the fact that it was not possible to find the results of previous bathymetric measures for comparison in the literature, a qualitative agreement was found between the present results and Davies
et al. [
9] considerations on river morphology after the Cahora Bassa dam construction. A quantitative analysis could be attempted, comparing the present survey data with the results of mathematical models reported in the literature [
14,
15,
22,
23].
The limited extension of the investigated area does not allow us to derive general information for navigation purposes. However, the survey data show an overall quite complex bathymetry, suggesting that it could be preferable to base potential studies for navigation assessment on extensive bathymetric investigations, rather than on isolated cross-section measures.
Results hereby reported can be used by researchers and practitioners as a knowledge base for further field surveys aimed at monitoring the morphological evolution of the lower Zambezi River, as well as for calibration and validation of mathematical models and remote sensing observations.


