1. Introduction
Throughout North America and Europe, extended producer responsibility (EPR) has become a widely used policy instrument designed to transfer the physical and financial responsibility for end of life products to producers, brand owners, and first importers. Funds for such programs are most commonly raised by environmental handling fees (either visible or hidden) remitted by retailers and packaging producers. However, as noted by Bury (2014) [
1] and Mayers (2007) [
2], EPR legislation generally fails to offer any prescriptive guidance regarding fee visibility. The appropriateness of whether to collect the environmental handling fee “at the cash register” or build it into the price of the good is a hotly contested topic among policy planners. The general argument in favor of visible eco fees is that it raises consumer awareness regarding EPR programs. However, the visibility of eco-fees has proved to be a source of confusion (and conflict) for consumers, who often question who is responsible for imposing the fees and whether the fee is a type of tax. Internalized fees can also encourage producers to engage in greater design for environment.
These issues came to the forefront in June of 2010, as newspaper headlines in Ontario, Canada were dominated by the “Eco Fee Fiasco”. The province had implemented visible eco-fees to a range of household hazardous waste products (classified as Phase 2 and Phase 3 hazardous waste materials, which included rechargeable batteries, light bulbs, reactive materials, aerosol containers,
etc.). This decision was met with an immediate backlash from both consumers and retailers—fees were being erroneously applied to non-hazardous items, and in some instances, the magnitude of the fee comprised a significant share of the product’s retail cost (Hastie, 2011) [
3]. The public outcry was so severe, the entire program was repealed within a month, with the government assuming financial responsibility for the end of life management of these materials. This ultimately begs the question, why did Ontario’s visible fee model fail? The province had already had a visible eco-fee program in place for waste electronics, tires, and other hazardous waste items. As such, Ontario’s previous experience with implementing producer responsibility programs should have minimized conflicts (Bury, 2012) [
1].
The failed launch of the program, and its subsequent cancellation raised numerous questions regarding what may have caused it: Was it a lack of consumer and retailer education surrounding the purpose of the fee? Were the fee rates considered too high? Or had consumers just reached a tipping point regarding what many perceived as an “environmental tax”. While no one answer exists to these questions, it does open the door to some very interesting scholarly investigation. Debates about the effectiveness of eco-fees (and how they are applied) span a diverse range of policy and consumer issues, including: (1) fiscal responsibility and tax policy; (2) producer responsibility; (3) consumer awareness and education; (4) supply chain competition and responses; and (5) the impact of eco-fees on consumer and producer behaviour. This study seeks to examine how consumer perception of environmental harm (attributable to a range of materials in which eco-fees are applied) affect attitudes towards and willingness to pay for environmental fees. Using survey and questionnaire data collected from 19 municipalities across Ontario, this study evaluates consumer awareness surrounding the purpose of the fee, and what relationship (if any) does perception of environmental harm affect willingness to pay fees and preference for fee visibility.
As noted by Bury [
1], there is an acute need for governments to look more closely at the EPR eco-fee pricing mechanism—including how fees are calculated, the issue of visible
vs. non visible fees, and educating the general public about what fees are used for. Ontario’s inability to effectively communicate the purpose of eco-fees highlights the risk for conflict among affected stakeholders, as well as the difficulty in designing effective and publicly palatable cost recovery models. The issue of financing Ontario’s residential diversion programs will only become more acute moving forward, as projected population increases in urban areas will place additional strain on the province’s waste management system.
2. Literature Review
There is a relative paucity of literature that specifically examines the issues associated with environmental handling fees (eco fees), particularly within a Canadian context. This, in part, is due to the relative infancy of EPR schemes and eco-fees fees in North America. Most of the research on eco-fees in Canada has generally been grey literature—work carried out by consulting firms or local governments. As an example, many retail groups have written reports advocating for environmental fee visibility—while this has generally been under the guise of increasing consumer awareness regarding EPR programs, critics have countered that retailers have a vested interest in visible fees (Hastie, 2011) [
3]. Non-visible fees would raise the sticker price of products, which may deter consumer purchases. Most of the information that is currently available has reflected either local circumstance that can differ substantially from one area to the next and/or has reflected a particular focus or interest of the author. It should be noted that there are numerous studies that examine optimal taxation in environmental contexts. The emphasis of this research has been on how to use various taxation instruments to achieve desirable environmental outcomes. However, as noted above, these studies do not specifically examine how perception of environmental harm affect willingness to incur an economic penalty (expressed in the form of taxation or environmental handling fees).
However, issues surrounding eco fee visibility draws close parallels to the debate surrounding tax inclusive/exclusive pricing (Bury, 2012) [
1]. As such, an examination of the literature discussing the merits (and criticisms) of inclusive/exclusive taxation serves as a useful proxy. The debate regarding whether the display price of services should be tax-inclusive or tax-exclusive has become a policy focal point in jurisdictions that have adopted a harmonized sales or value added tax (Krever and Westhuysen, 2010) [
4]. Proponents of tax inclusive pricing seek to provide transparency regarding the actual cost incurred by the consumer (including both the pre-tax and after tax total on the sticker price), while proponents of tax exclusive pricing seek transparency regarding the tax component of the final cost (explicitly listed as a line item on the receipt) (Krever and Westhuysen, 2010) [
4]. Of note, there is a significant body of literature that examines how tax salience (consumer awareness of visible vs non visible taxation) affects consumer purchasing decisions. As noted by Chetty
et al. [
5], commodity taxes that are included in the posted prices that consumers see when shopping have larger effects on demand. Similar conclusions were observed by Gabaix and Laibson [
6].
Under most value added tax schemes in North America, consumers only discover how tax affects their purchases once they are at the checkout. However, taxable totals are often listed on the aggregate value of the purchase, and as such, consumers are unable to determine which items were fully taxed, tax exempt, or concessionally taxed (Krever and Westhuysen, 2010) [
4]. Consumers are oblivious to the effect of taxes on their individual purchases, because a) taxed totals are applied only at the point of sale and b) taxes are applied to the total value of purchases made by the consumer. As noted by Sherman (2009) [
7] and Bird (2010) [
8], the issue with this is two-fold: (1) Consumers do not know for which products the tax rate applies, and as such, are unable to make comparative purchasing decisions; (2) the “intention” of the tax rate may be lost on the consumer—discretionary taxing rates are often used by governments to subsidize or penalize certain consumer purchases (
i.e., sin taxes on alcohol, tobacco,
etc.). Under tax explicit pricing, if the “basket of goods” purchased by a consumer contains products with different rates of taxation, they won’t know to which products that tax is applied (as it appears only as a summed total on the receipt). This has generally been used as the argument in favor of inclusive tax pricing (and by proxy, those who support visible fees). Increasing consumer awareness both with regards to which products fee/tax are applied and magnitude of the fee/tax, they can make informed purchasing decisions.
However, the Global Product Stewardship Council has stated that fee visibility on the sticker price is not a pre-requisite for increased consumer awareness (2014) [
9]. As noted by Bury [
1] environmental handling fees tells consumers very little in and of itself—“Awareness is a function of widely visible and available communications and program advertising why the fee exists and how it will be spent”. Lifset
et al. (2013) [
10] found that in the absence of context for why a fee is being applied, consumers will often erroneously interpret the fee as a tax being collected by the government. Experiences with environmental handling fees (and how they are implemented) vary depending on the material stream and jurisdiction. In Ontario, while fees are collected for a range of residential waste streams (packaging, waste electronics, hazardous waste and tires), a mix of both hidden and visible fees are used. In the European Union, member states have traditionally opted for visible fees for white goods (refrigerators, washing machines,
etc.), hazardous waste and some product packaging, but not for information and communication technology (ICT) products (Mayers and Butler, 2013) [
11]. Hastie and Harvey (2012) [
3] have postulated that a lack of consistency in how fee rates are presented to consumers may contribute to confusion surrounding the purpose and intent of the fee.
While this paper does not attempt to provide any guidance regarding the appropriateness of environmental handling fees or extended producer responsibility, it does examine the factors that influence consumer perception of fees. As far as can be ascertained, this is one of the few studies of its kind to examine how consumer’s perception of environmental harm affect their perception of and willingness to pay environmental handling fees.
3. Material and Methods
3.1. Description of Study Site
Ontario is Canada’s most populous province, situated between 41°85′ N and 51°28′ N and 95°48′ W and 74°74′ W, with a total land mass of 1,076,395 km
2 (Statistics Canada, 2005 [
12]; Statistics Canada, 2011 [
13]). Ontario remains at the forefront of recycling initiatives and legislation, recognized as one of only three provinces in Canada to implement an extended producer responsibility scheme (EPR) for household recyclables. Residential and commercial waste diversion programs exist for MHSW (Material Hazardous or Special Waste), WEEE (Waste Electrical and Electronics Equipment), automobile tires, and printed paper and packaging (Blue Box) materials. Each of these programs exist under the oversight of Waste Diversion Ontario (WDO), a non-crown corporation created under Ontario’s 2002 Waste Diversion Act (Waste Diversion Ontario, 2012) [
14]. The WDO was established to develop, implement and manage waste diversion programs for stakeholders from both private and public sectors (Waste Diversion Ontario, 2012) [
14]. Stewardship Ontario, Ontario Electronic Stewardship and Ontario Tired Stewardship are the industry funding organization designated to collect fees on behalf of producers to finance the operation of the residential diversion programs (Waste Diversion Ontario, 2012) [
14].
3.2. Ontario’s EPR Model
Ontario’s transition to extended producer responsibility in the early 2000’s marked a shift in the cost of managing end of life products from the local tax base to packaging producers (Deutz, 2009) [
15]. While its implementation was initially met with opposition from the packaging industry, the Ministry of the Environment remained steadfast in their desire to move towards a full “Polluter Pays” system (Crittenden, 2006) [
16]. To date, Ontario’s EPR scheme is the foundation for managing and financing provincial diversion programs.
Table 1 below summarizes the underpinning policy rational for implementing EPR in Ontario (Adapted from Deutz, 2009 [
15]).
In Ontario, environmental handling fees (often referred to as “eco fees”) are used to finance residential diversion programs, including depot operations, shipping and storage of collected electronics, and public education. Fees are remitted by retailers or packaging producers to an industry funded stewardship organization (that represent the collective interests of a particular material stream) (Mayers, 2007) [
2]. Organizations such as Stewardship Ontario and Ontario Electronic Stewardship are then responsible for reimbursing the party that is responsible for diversion activities,
i.e., the municipality, private waste collectors,
etc.
The underlying intuition of environmental handling fees is that it ensures consumers accept responsibility for the entire life-cycle of the product they are purchasing, including its final disposal. Retailer’s may choose to display environmental handling fees separately or as part of the total cost of the product.
Table 2 below summarizes the fee schedule and visibility for each of Ontario’s residential diversion programs.
3.3. Data Collection
All survey and interview data was collected over a 5-month period between January 2015 and May 2015. Surveys and interviews were later archived and transcribed electronically. Survey questions were organized into five areas: (1) Demographic information related to gender, ethnicity, education and income; (2) General knowledge about what eco fees were used for and where the money went; (3) Perception of environmental harm for a range of consumer products on which eco fees are applied; and (4) Willingness to pay eco fees and (5) Questions regarding stated preference for fee visibility. Enumerators were proficient in several languages (including Hindi, Punjabi, Farsi, Spanish and French), allowing the survey to be administered in the language respondents were most comfortable with (in most instances).
Questionnaires were pre-tested and refined prior to conducting the official survey. The pre-test allowed for wording refinements and changes to the ordering of the questions. The finalized survey was conducted across 19 provincial municipalities, selected on the basis that they represent the diverse geographic regions in the province. Teams of two enumerators and one site supervisor were sent to each municipality for a period of three days each, spending four to six hours at each survey site. Enumerators were required to successfully complete the Tri-Council ethics certification prior to their participation in the study.
Questionnaire “booths” were set up in spaces with high foot traffic (namely malls, arenas and public commons areas). Enumerators were asked to approach members of the public, explain who they were and the purpose of the study, and request approximately 10–15 min of the participant’s time to complete the survey. Upon completion of the written survey, respondents were asked an open ended question related to their attitudes towards the visibility of environmental handling fees.
The interview was recorded and later transcribed in full. Teams of two enumerators would administer the survey, one tasked with taking interview/field notes and the other working with respondents to complete the survey. Survey responses were recorded by hand and by tape recorder by the enumerator, and later electronically archived and analyzed using Provalis Word Stat, Microsoft Excel and Microsoft Word. Word Stat was used to code, summarize and categorize interview responses. Microsoft Excel and Microsoft Word were used to record Likert scale values and record frequency counts and percentage distribution of responses.
Respondents were asked to answer questions using a combination of Likert scales and open ended statements. A five point ordinal Likert scale was used to measure respondent’s answers ((1) Strongly Disagree, (2) Somewhat Disagree, (3) Neither Agree Nor Disagree, (4) Somewhat Agree, (5) Strongly Agree). The five response categories represent an interval level of measurement. This study also assumed that the strength/intensity of stated behavior is linear. All items are assumed to be replications of each other. Symmetric scaling and equidistant attributes are assumed to approximate for interval-level measurements. Respondents were read questions and asked to mark their responses on the survey with the assistance of the enumerator.
A total of 677 people were approached and asked to participate in completing the survey. Of those approached, enumerators managed to successfully complete 271 of the surveys, for a response rate of 40.02%.
Table 3 below provides the summary statistics of survey participants.
4. Results and Discussion
4.1. Analysis of Survey Responses
This section has been divided into four areas that examine each of the topics included in the survey: (1) perception of environmental handling fees; (2) willingness to pay fees; (3) perception of environmental harm; and (4) preference for fee visibility. An analysis of the interrelationship between perception of environmental harm, willingness to pay fees and preference for fee visibility is also included.
Of note, printed paper and packaging materials were not included in the survey (due to the number of materials included in the waste stream, lack of fee visibility, and low consumer awareness regarding some of the material categories, i.e., LDPE film, HDPE, etc.).
Table 4 presents the ordered Logit results for the two dependent variables taken from the survey data.
Age, income, gender and education had little bearing on how study participants responded to survey statements.
Of note, the findings with respect to socio-demographic characteristics and perception of environmental issues is not consistent with previous examinations (which have observed a relationship between gender/age/income/education and stated levels of environmental concern).
4.2. General Perception of Fees
As shown in
Table 5, there is significant confusion and uncertainty regarding the function of environmental handling fees, who is responsible for program administration and overall assessment of their effectiveness. More than half (53.9%) of respondents agreed (or strongly agreed) with the statement “Environmental handling fees are a form of tax”. Tangent to this finding, only 17.2% of respondents felt that the environmental handling fee is meant to make sure products are recycled or disposed of safely. Approximately 40% of respondents did not feel as though environmental handling fees helped keep harmful products out of the landfill. Of note, despite being perceived as a tax, survey respondents did not appear certain over who was the recipient of revenue collected from environmental handling fees. This suggests that the promotion and education initiatives undertaken by Stewardship Ontario and Ontario Electronic Stewardship have failed to effectively communicate the purpose of the fee.
4.3. Willingness to Pay for Fees and Perception of Environmental Harm
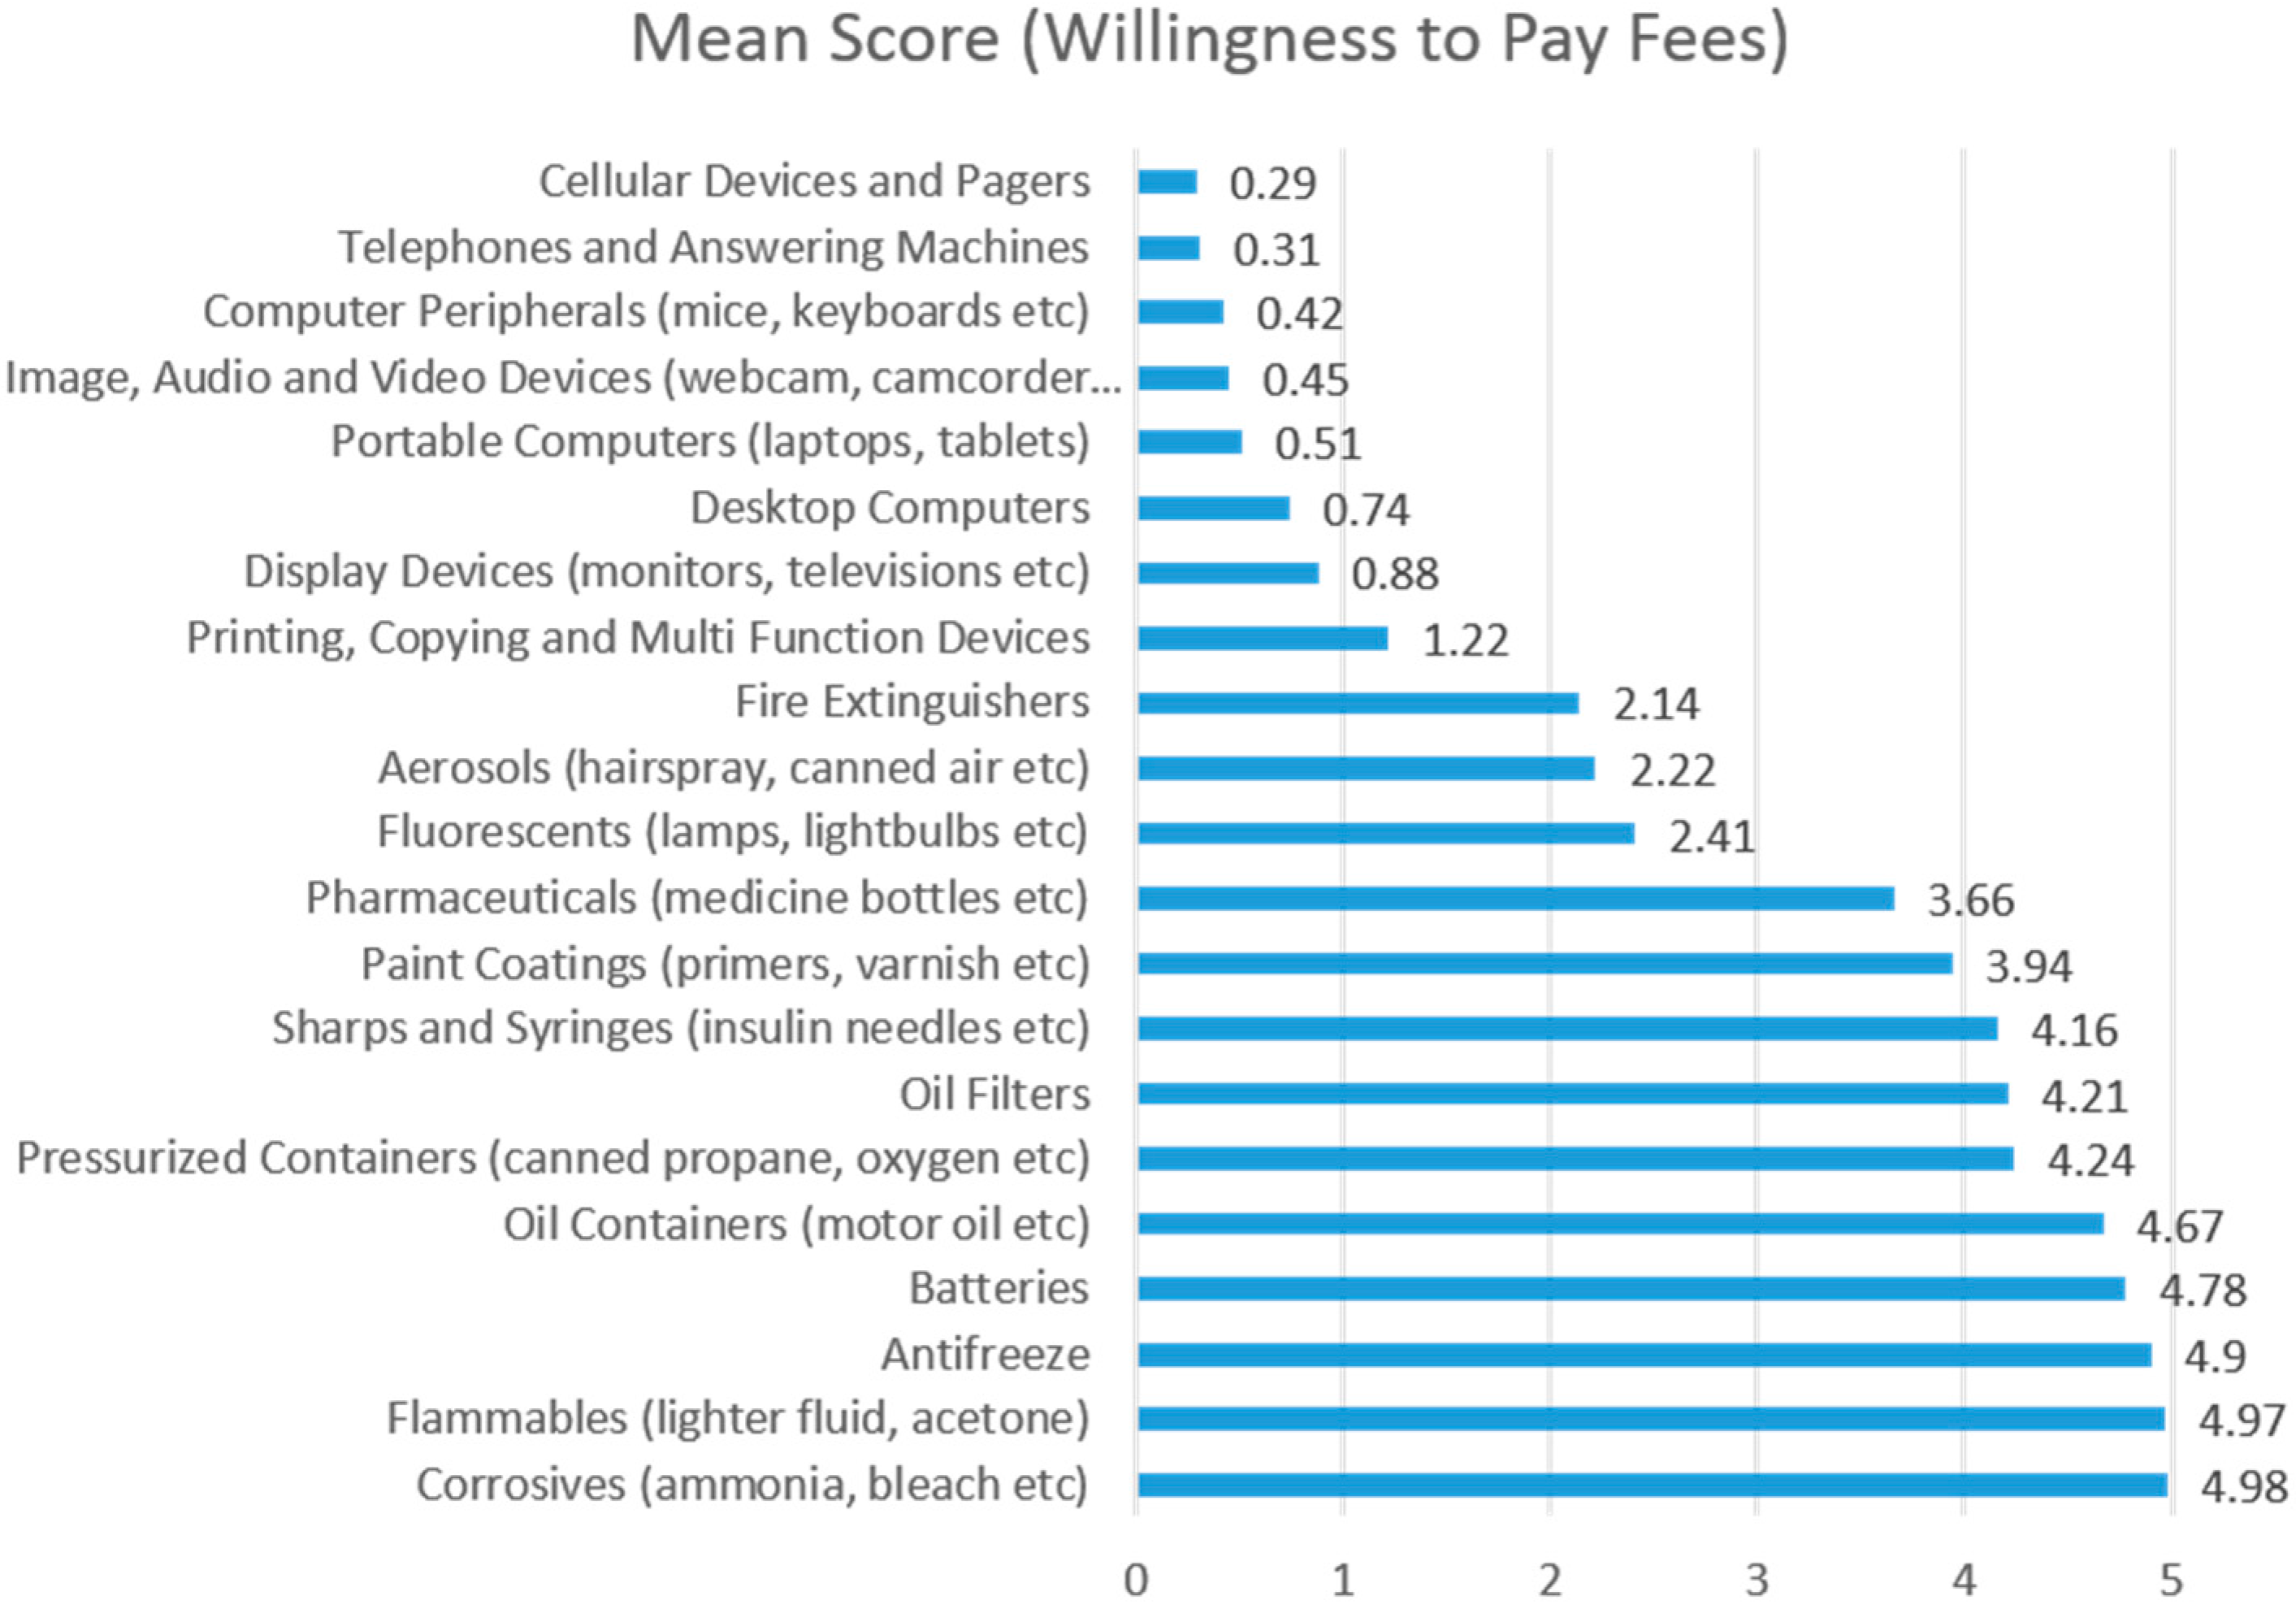
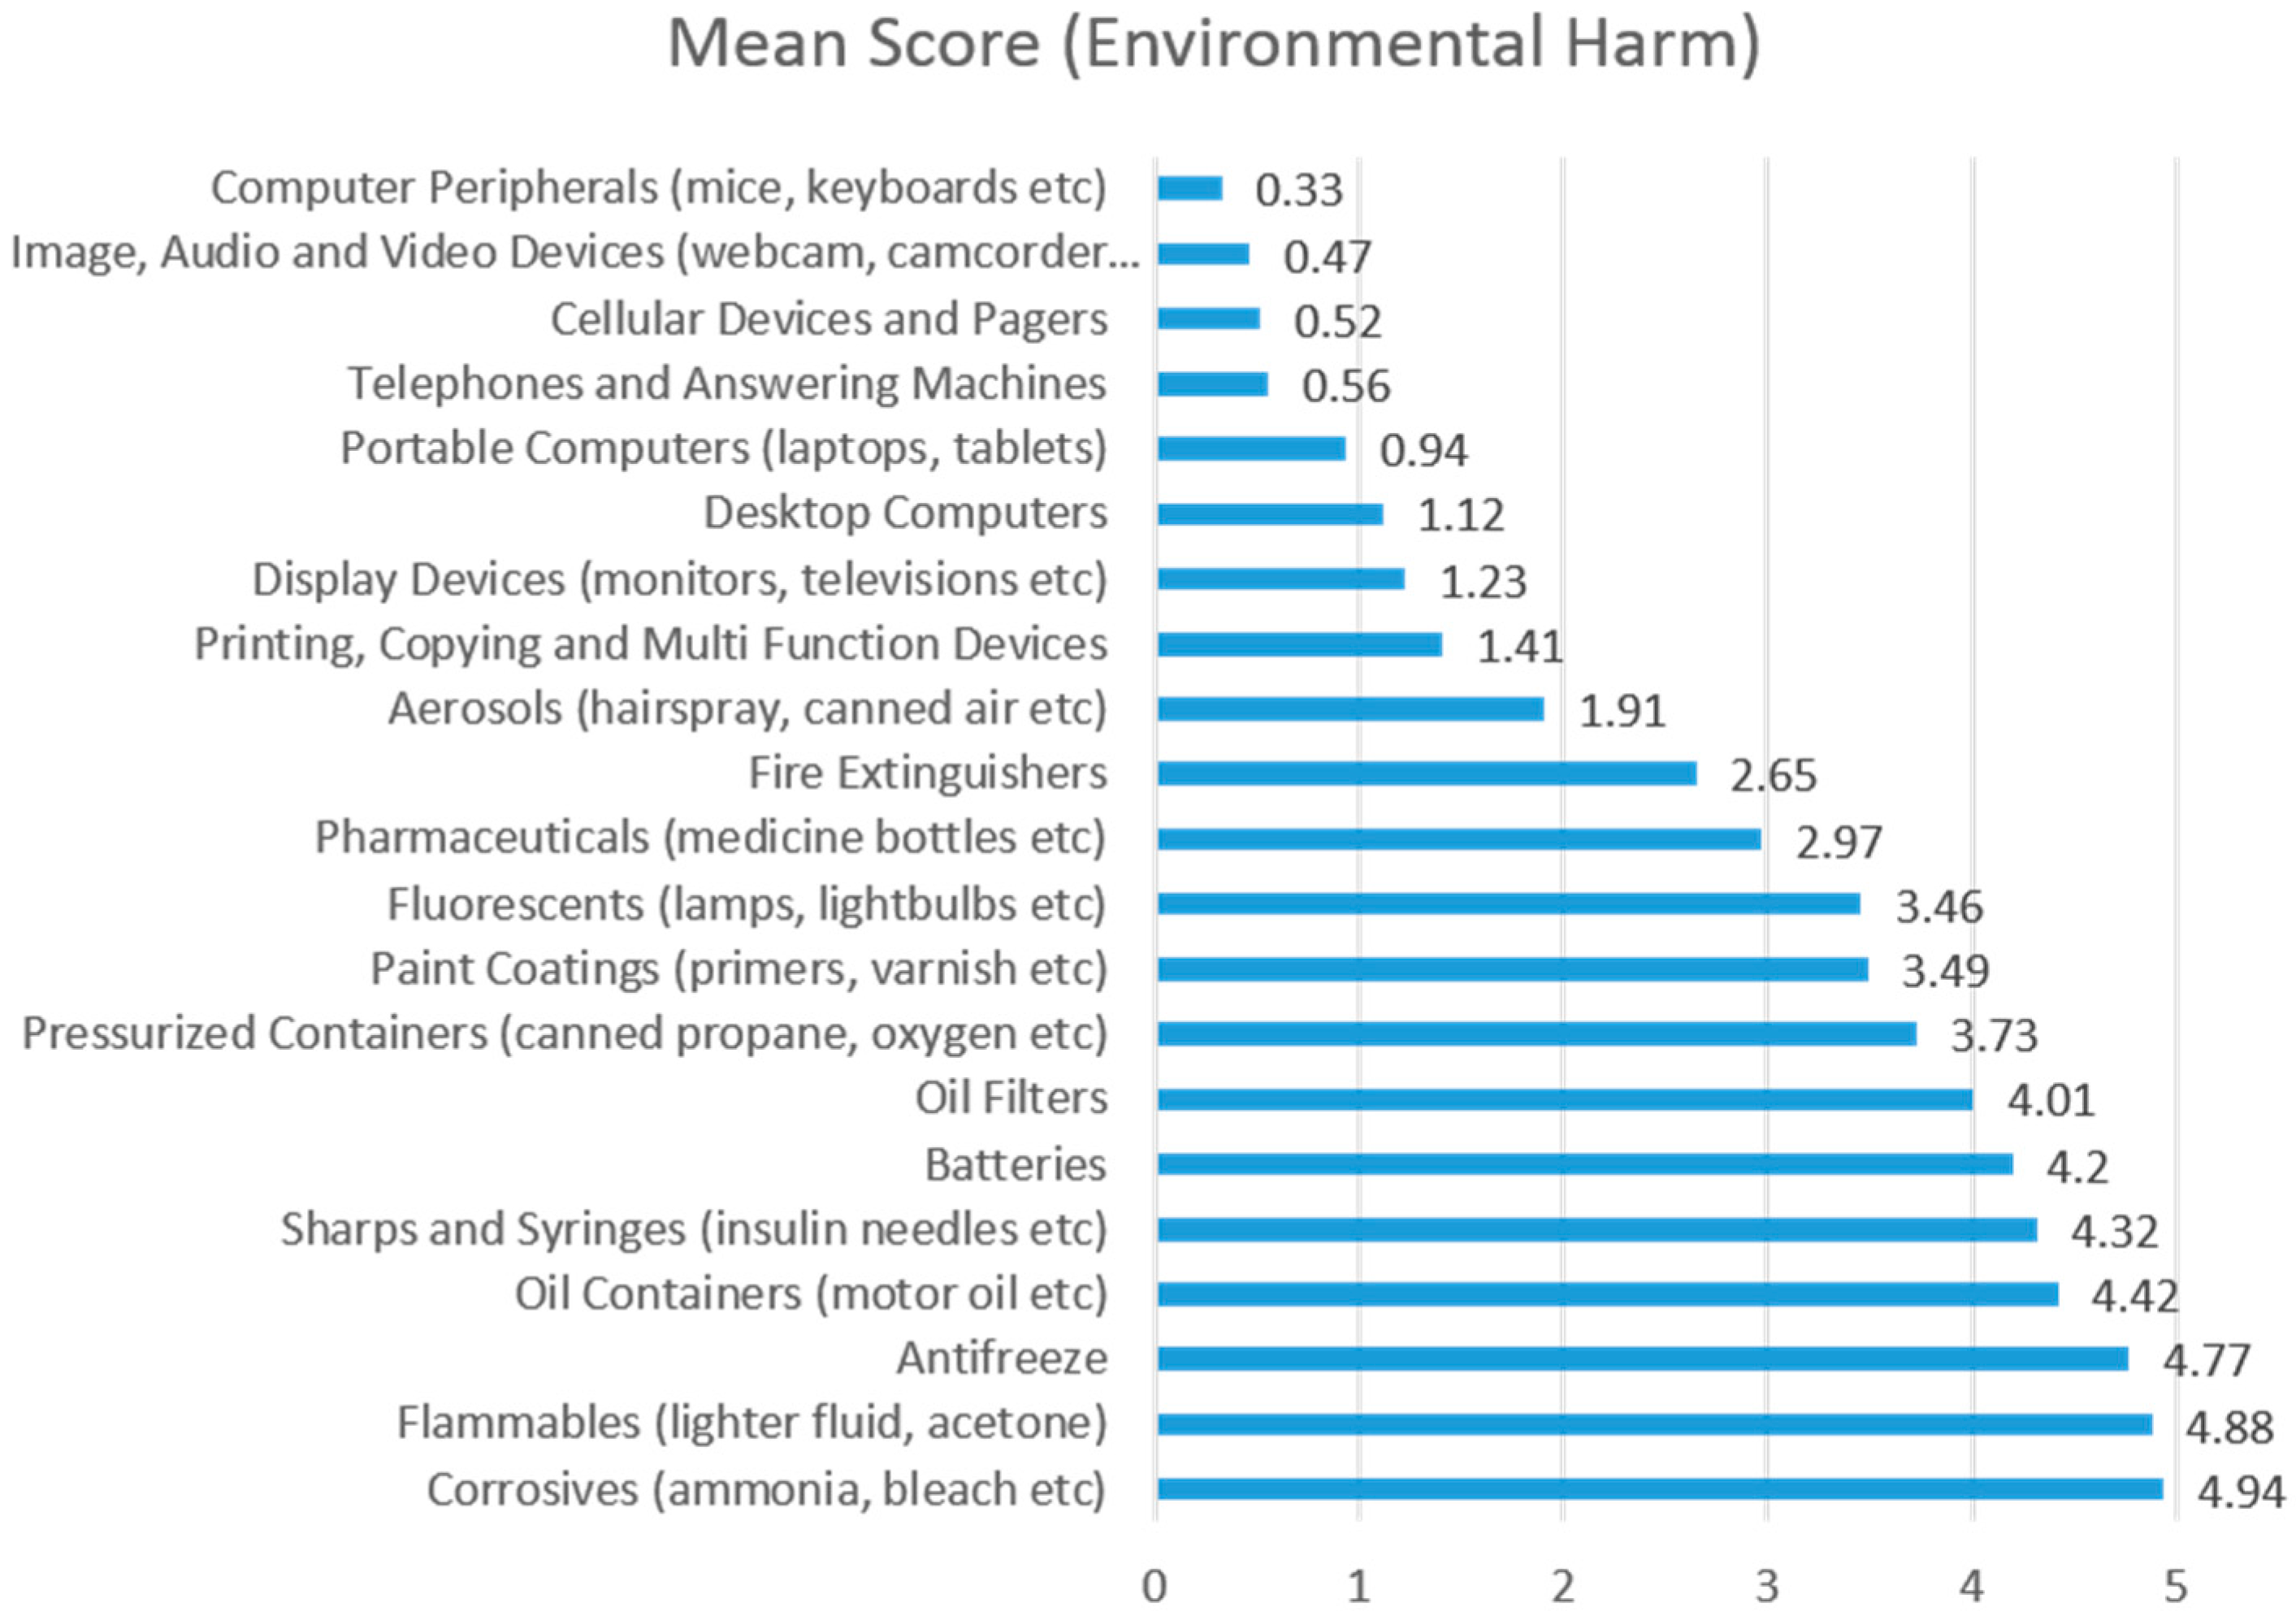
Figure 1 and
Figure 2 below summarize respondent answers with respect to willingness to pay environmental handling fees and perception of environmental harm. Respondents were asked to review a list of materials found in Ontario’s residential waste stream for which visible environmental fees are applied, and rank them on a scale from 0 to 5. Survey statements are described below:
- (1)
On a scale from 0 to 5, would you be willing to pay an eco-fee for this product (where 0 = never willing to pay an environmental handling fee, and 5 = willing to pay environmental handling fee every time).
- (2)
On a scale from 0 to 5, do you think this product is bad for the environment if disposed of improperly? (where 0 = no environmental harm, and 5 = severe environmental harm).
Both willingness to pay environmental handling fees and perception of environmental harm were highest for hazardous waste materials (namely corrosives, flammables, anti-freeze, batteries and pharmaceutical products). Conversely, respondents indicated that they were averse to paying environmental handling fees for electronic products, and did not view them as posing a credible environmental threat at their end of life.
Table 6 below summarizes the statistical relationship between perception of environmental harm and willingness to pay environmental handling fees.
As shown in
Table 5, there is a statistically significant correlation between consumer willingness to pay environmental handling fees and perceived levels of environmental harm. The Pearson product-moment correlation coefficient was 0.978, suggesting an almost perfect positive correlation between environmental harm and willingness to pay fees. While this result was expected to a degree, the magnitude of the relationship was surprising. There is no precedent in the available literature that examines how perceptions of environmental harm affect attitudes towards and willingness to pay environmental handling fees. While these findings necessitate further investigation, it suggests that promotion and education messaging regarding environmental fees should emphasize the consequences of improper disposal. Existing P&E materials has tended to focus on the purpose of the environmental handling fee (to finance end of life management of waste products), but not necessarily the environmental implications of failing to divert waste from landfills.
4.4. Preference for Fee Visibility
Table 7 below summarizes respondent preference for fee visibility for the full range of obligated materials in the hazardous and electronics
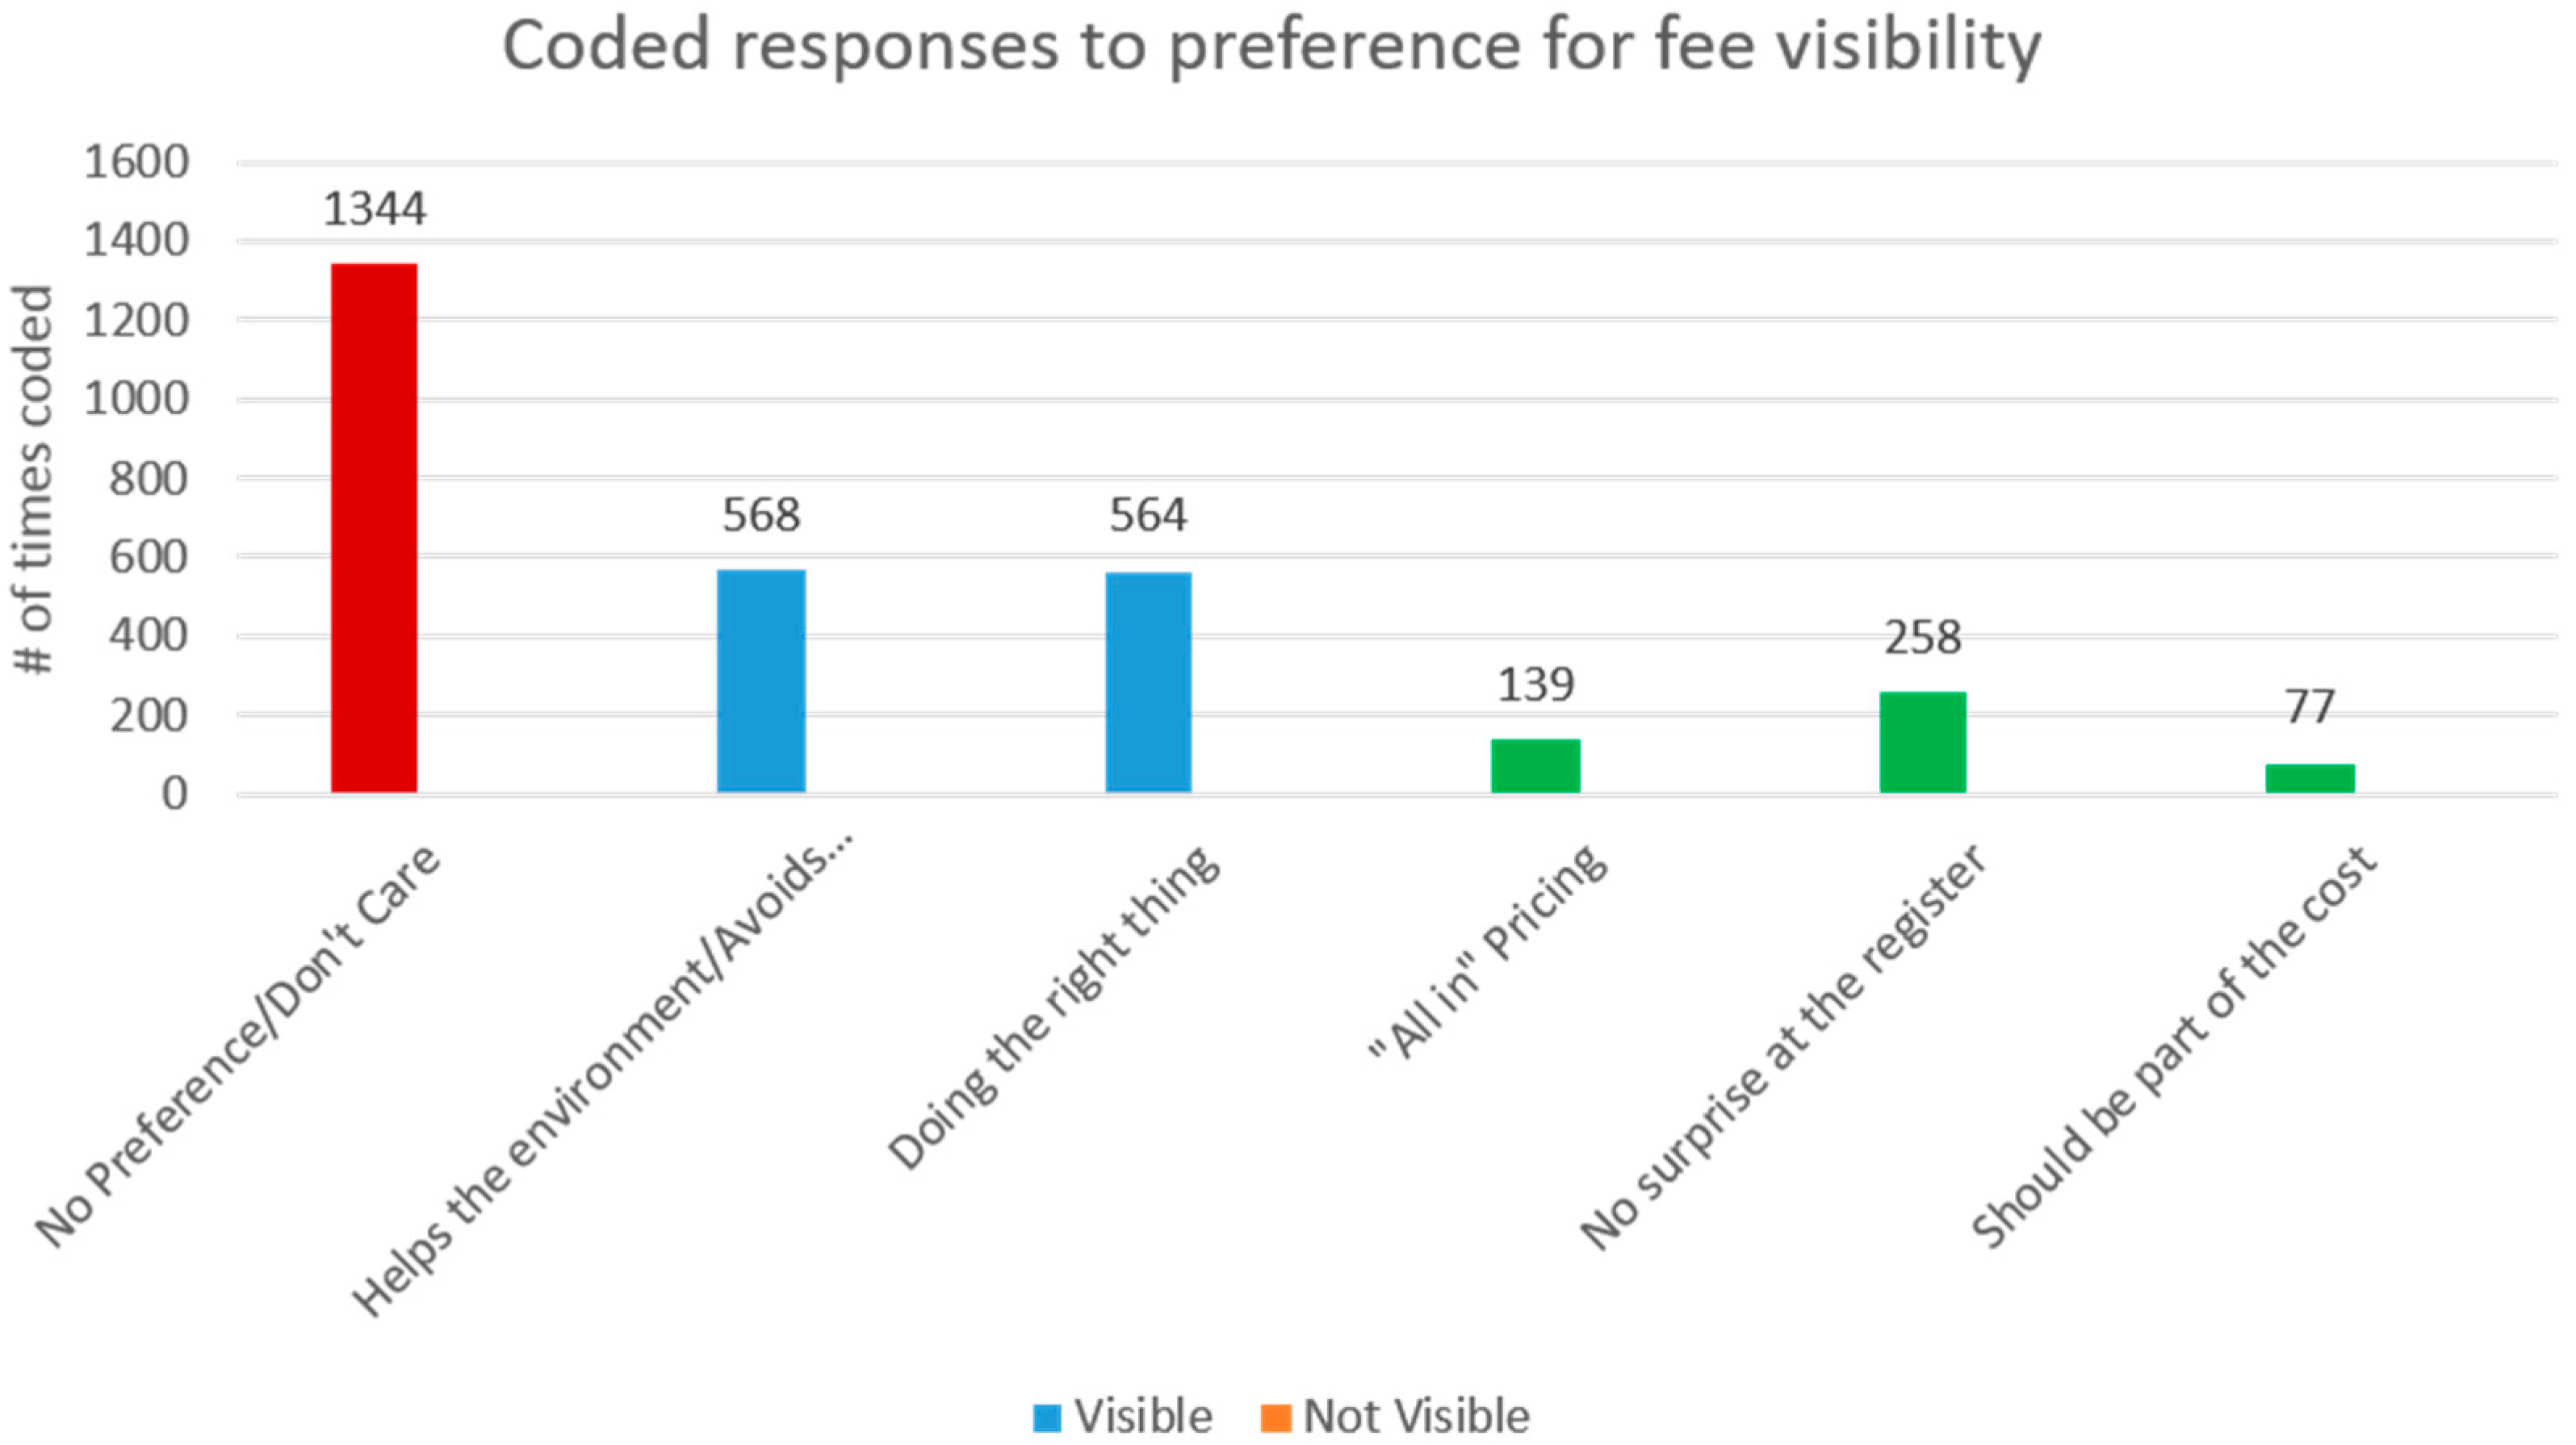
categories. Consumer preference for fee visibility closely followed perception of environmental harm (with preference for fee visibility and environmental harm being positively correlated). While the strength of this relationship was not as strong as willingness to pay fees and environmental harm, the Pearson Correlation Coefficient (PCC) was statistically significant at 0.904. It should be noted that low levels of environmental concern were not necessarily correlated with a preference for hidden fees. In majority of instances, respondents indicated that they did not care whether the fee was visible for materials with low levels of perceived environmental concern (a score of 2 or less on the Likert scale). To add additional context to these results, study participants were asked to indicate the primary reason for why they preferred to a fee to be visible/not visible for the full range of materials included in the study—the most frequently coded results provided by study participants are shown in
Figure 3.
Note: Respondents were asked to express their preference for fee visibility by individual materials. These responses have been organized into three broader “container categories”: (1) No preference; (2) Preference for visible fees; and (3) Preference for hidden fees.
The most frequently recorded response was “No Preference/Don’t Care” (coded 1344 times). For responses indicating a preference for fee visibility, self-reported measures of altruism and self-efficacy ranked highly. Variations of the phrase “I am helping the environment/avoids disposing of dangerous items” and “Feels good/doing the right thing” were coded 568 and 544 times respectively. Of note, positive statements surrounding fee visibility were associated almost exclusively with hazardous waste items. Respondents did not report a preference for fee visibility with respect to electronics items. The most frequently coded response in favor of hidden fees was a variation of the phrase “I want to know the all in/final price before I buy” (coded 139 times). Anecdotes provided during the semi structured surveys indicated that consumers did not like being surprised by an additional fee at the register/checkout when making purchases (coded 258 times). There was also evidence to suggest hidden fees supported the perception that these costs are being internalized by the producer (or at the very least, are part of the cost of production). The statement (in favor of hidden fees) “It should be part of the price/cost” was coded 77 times.
5. Conclusions
This study undertook a critical examination of the relationship between perception of environmental harm and consumer willingness to pay for environmental handling fees. This analysis was supplemented by asking study participants to indicate under what circumstances (and for what materials) they believe a visible fee is appropriate. This study found that there is a statistically significant correlation between willingness to pay environmental handling fees and the perceived environmental harm of the product on which the fee is applied. For items that respondents viewed as “innocuous to the environment” (i.e., “keyboards and mice”), they were relatively unwilling to pay an environmental handling fee. Conversely, for the full range of hazardous waste materials, consumers expressed a willingness to pay EHFs. With respect to fee visibility, a similar picture emerges—respondents indicated that they preferred visible fees (at the sticker) for products that they perceived to be dangerous. Once again, there is a strong correlation between perceived environmental harm and whether fees should be visible. Anecdotes gathered during semi structured interviews indicated that respondents “felt good” knowing that they were paying to keep dangerous items out of a landfill. However, this same “feel good” phenomenon is conspicuously absent for EHFs associated waste electronics. Despite repeated messaging and promotion and education efforts on behalf of Ontario Electronic Stewardship, respondents were not convinced that waste electronics pose a credible environmental threat. As a tangent to this point, many respondents expressed anger over being “double billed” for the purchase of waste electronics—once in the form of an environmental handling fee at the register, and again when disposing of these items at a recycling depot.
Anecdotes taken from the semi structured interviews indicated that there is a general uncertainty regarding what happens with waste electronics once it is collected. Respondents also recognize that much of these materials have value in scrap metal, and (erroneously) operate under the assumption that municipalities sell collected waste electronics as a source of revenue. With these results in mind, it seems prudent that municipalities, retailers and producers work collaboratively to educate consumers about the consequences attributed to the improper disposal of waste (particularly for waste electronics). The emphasis to date has been on communicating the purpose of the fee—particular attention has been paid to stressing that eco fees are not a tax, and instead, are used to finance the end of life management of waste. However, as evidenced by this study, this messaging lacks the “why?” of environmental handling fees. By educating consumers about the potential environmental and health hazards attributable to improper waste disposal, they are more amenable to paying environmental handling fees. Many of the issues surrounding the appropriateness of eco-fees and their visibility is one of perception. Consumers are not necessarily averse to paying a fee on products (be they hazardous waste, electronic waste, etc.), but their willingness to do so is almost entirely a function of whether they believe the product is environmentally burdensome. It is the recommendation of this study that promotion and education campaigns for environmental handling fees, particularly those surrounding waste electronics, place greater emphasis on environmental consequences of improper disposal. What is less clear at this juncture is whether eco-fees should be visible or hidden. This study did not find any evidence to support that eco-fees increases consumer awareness regarding what happens to waste materials at its end of life (or who is responsible for administering and collecting the fee). However, there appears to be a complementary effect between fee visibility, perception of environmental harm, and positive attitudes towards recycling/perceived self-efficacy. As such, visible fees may be most appropriate for products in which consumers readily recognize as posing the potential for environmental harm. In the absence of this recognition, environmental handling fees may actually be a source of confusion and frustration for consumers—a scenario the province desperately seeks to avoid after the “eco fee fiasco” of 2010.


