Effects of Physico-Chemical Post-Treatments on the Semi-Continuous Anaerobic Digestion of Sewage Sludge


1
Advanced Environmental Biotechnology Centre, Nanyang Environment and Water Research Institute, Nanyang Technological University, 1 Cleantech Loop, Singapore 637141, Singapore
2
Faculty of Health, Engineering and Sciences, School of Civil Engineering & Surveying, University of Southern Queensland, Toowoomba 4350, Australia
*
Author to whom correspondence should be addressed.
Environments 2017, 4(3), 49; https://0-doi-org.brum.beds.ac.uk/10.3390/environments4030049
Submission received: 20 June 2017
/
Revised: 4 July 2017
/
Accepted: 12 July 2017
/
Published: 13 July 2017
(This article belongs to the Special Issue Advances in Environmental Engineering)
Abstract
:Sludge production in wastewater treatment plants is increasing worldwide due to the increasing population. This work investigated the effects of ultrasonic (ULS), ultrasonic-ozone (ULS-Ozone) and ultrasonic + alkaline (ULS+ALK) post-treatments on the anaerobic digestion of sewage sludge in semi-continuous anaerobic reactors. Three conditions were tested with different hydraulic retention times (HRT, 10 or 20 days) and sludge recycle ratios (R = QR/Qin (%): 50 or 100%). Biogas yield increased by 17.8% when ULS+ALK post-treatment was applied to the effluent of a reactor operating at 20 days HRT and at a 100% recycle ratio. Operation at 10 days HRT also improved the biogas yield (277 mL CH4/g VSadded (VS: volatile solids) versus 249 mL CH4/g VSadded in the control). The tested post-treatment methods showed 4–7% decrease in effluent VS. The post-treatment resulted in a decrease in the cellular ATP (Adenosine tri-phosphate) concentration indicating stress imposed on microorganisms in the reactor. Nevertheless, this did not prevent higher biogas production. Based on the results, the post-treatment of digested sludge or treating the sludge between two digesters is an interesting alternative to pre-treatments.
1. Introduction
Hydrolysis of particulate organics is known to limit the rate of sludge anaerobic digestion [1,2]. Pre-treatment has been widely reported to solubilize the organic solids in sludge and make them more accessible for the subsequent anaerobic digestion [3,4,5]. Ultrasonication (ULS) (20 kHz) pre-treatment at 6250 and 9350 kJ/kg total solids (TS) resulted, respectively, in a 47% and 51% increase in methane production [6]. Anaerobic biodegradability of feed sludge after combined ultrasound (ULS) and ozone pre-treatment increased by 93% and 106% after 30 min and 45 min [7]. Combined ULS and alkaline (ALK) treatment of feed sludge enhanced the subsequent anaerobic digestion performance. Kim et al. [8] found that the methane production improved by around 55% along with 17% increase in volatile solids (VS) reduction after combined ULS and ALK pre-treatment (pH9 + 7000 kJ/kg TS). These studies were carried out in batch mode which often does not reflect the performance of full-scale continuous digesters.
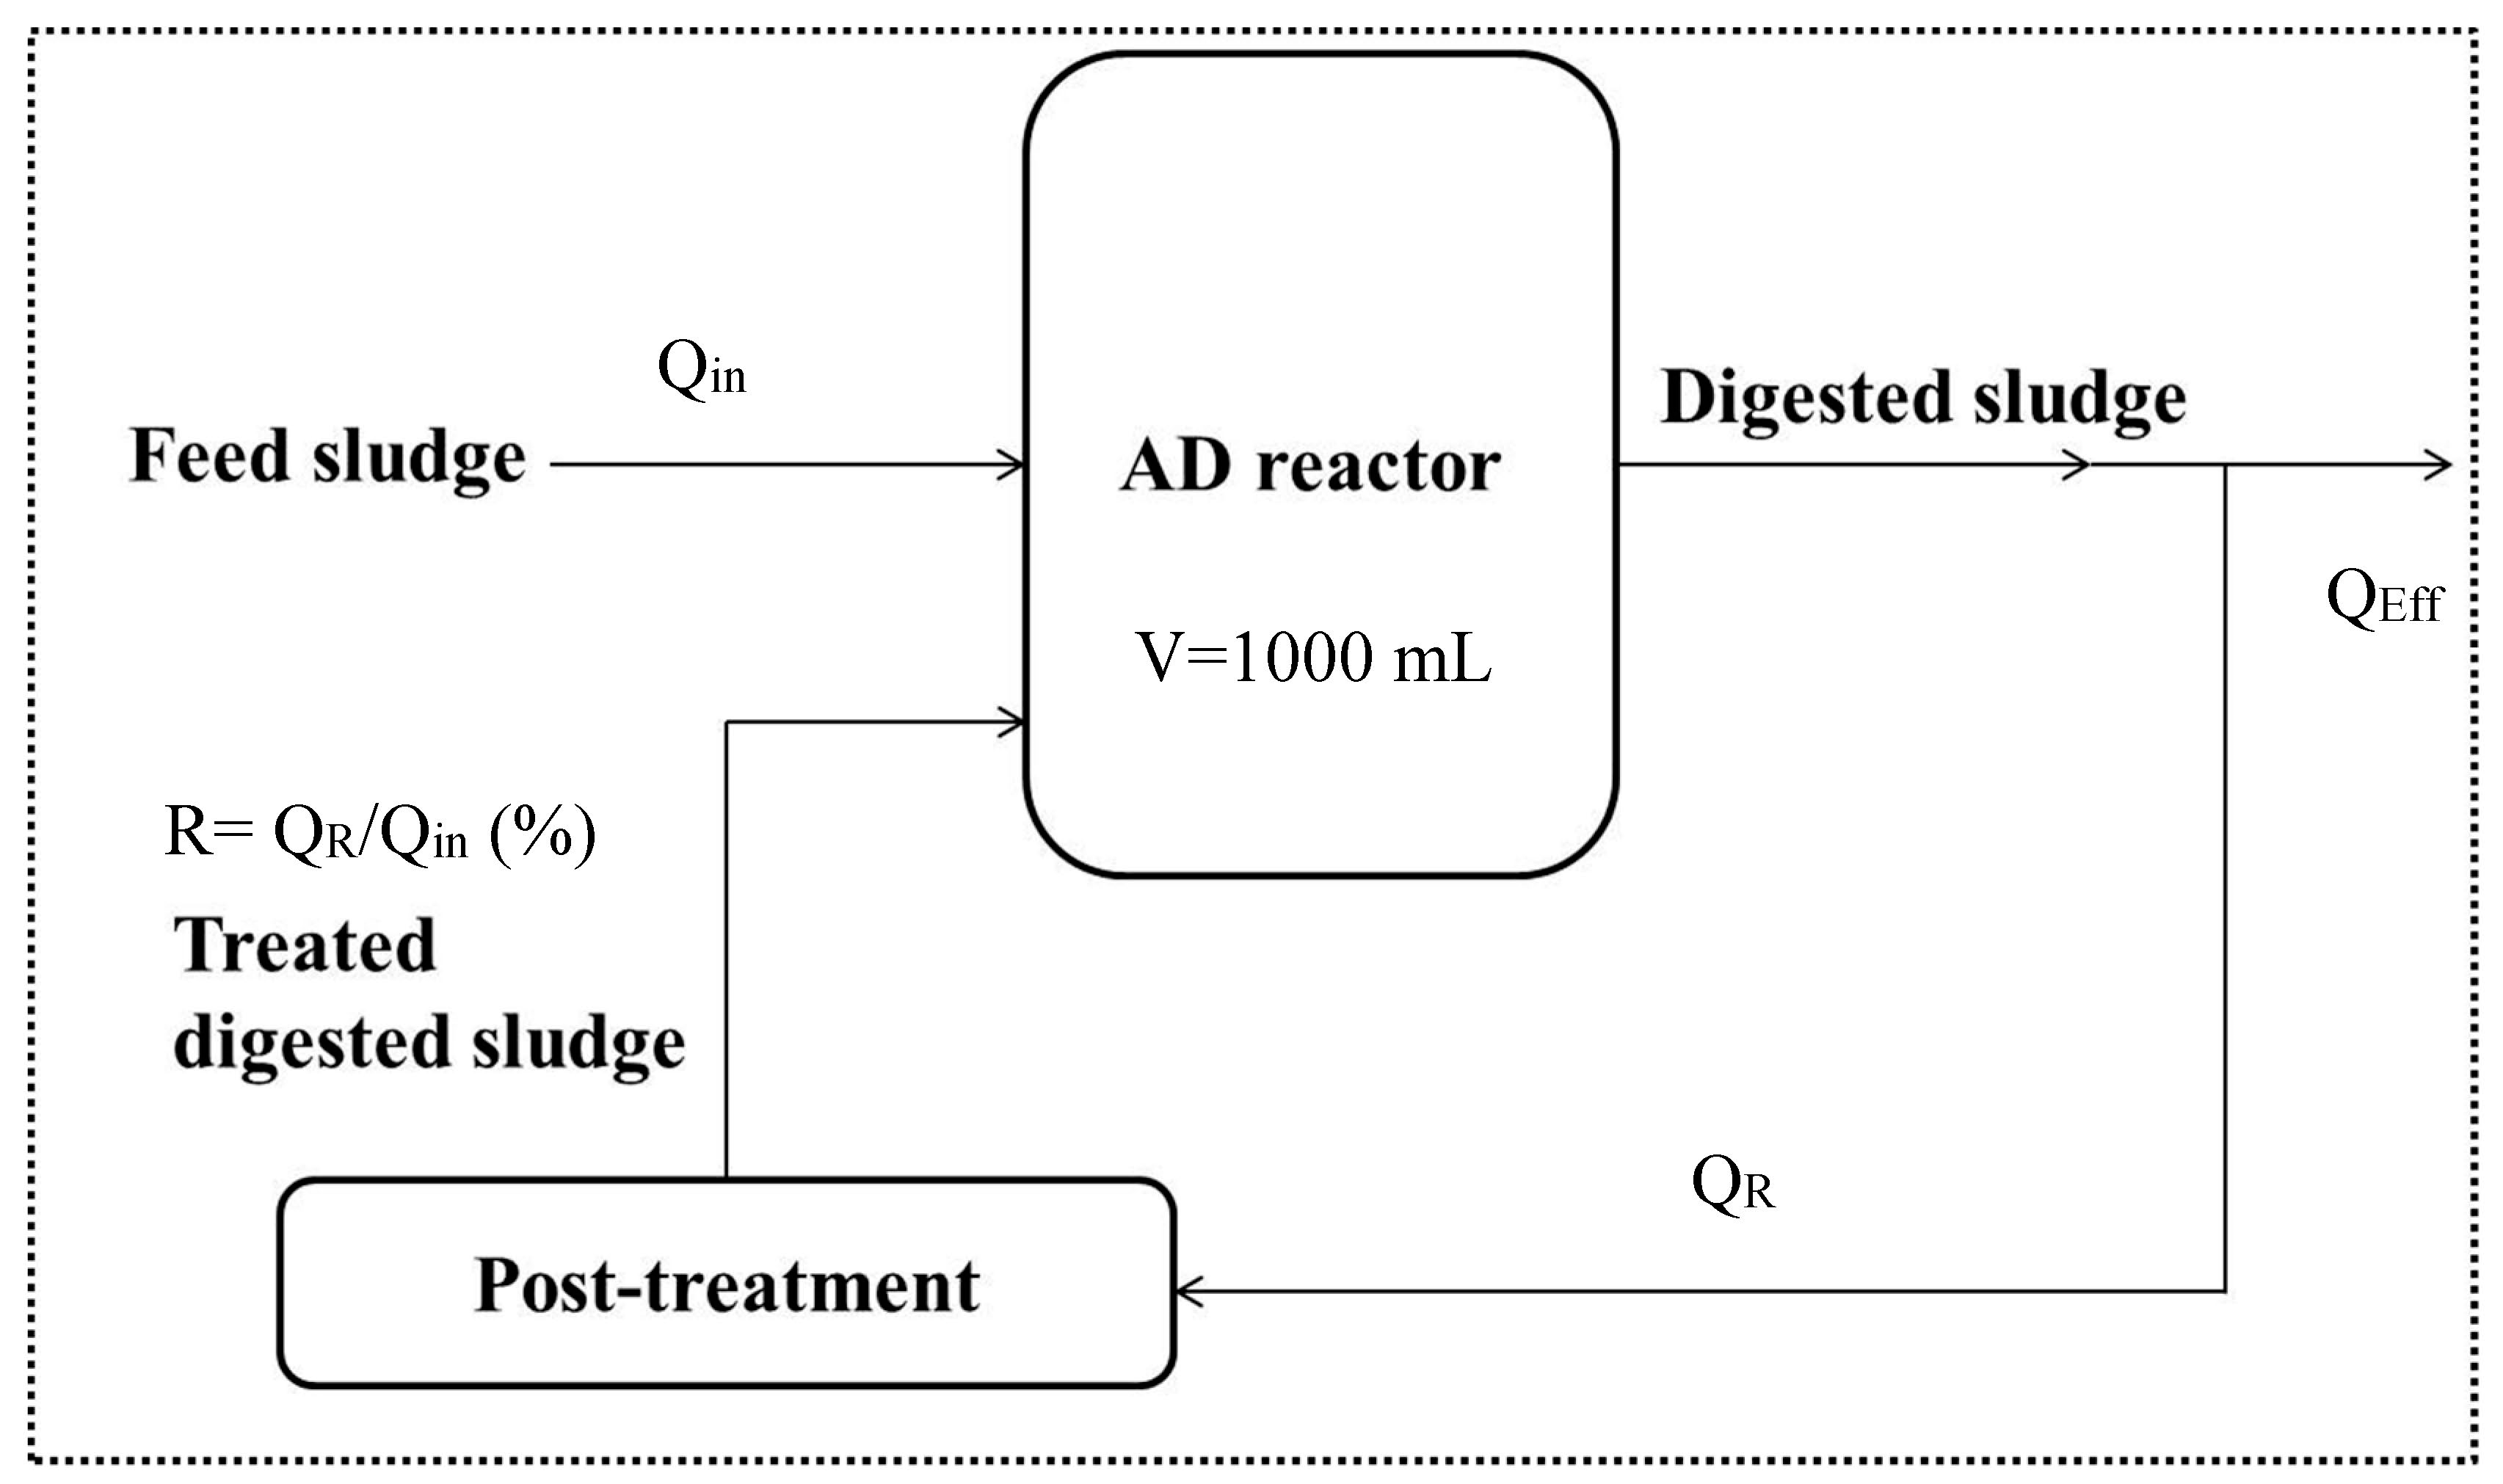
Post-treatment is realized by treating the digested sludge and recycling the treated digested sludge back to the original anaerobic reactor as shown in Figure 1. The concept was first proposed by Gossett et al. [9] who found the performance of thermal treatment was more efficient when the substrate (i.e., municipal refuse) was first biodegraded compared to the situation where the thermal treatment was directly applied to the substrate. Pre-treatment of sludge before AD is often applied to solubilize these solids to accelerate subsequent digestion. The rationale for post-treatment and pre-treatment is similar wherein both aim to rupture the microbial cells and release the extra- and intra-cellular substances. However, Takashima et al. [10] indicated pre-treatment not only targets the slowly biodegradable solids, but also the easily biodegradable solids in waste activated sludge (WAS). As a result, part of the energy and chemical input during pre-treatment would then be wasted on solubilizing the easily biodegradable organic particulates without increasing overall sludge biodegradability. Takashima et al. [10] suggested that the post-treatment of digested sludge and recycling the treated digested sludge back to the anaerobic reactor could be an alternative to pre-treatment.
As the digested sludge contains primarily slowly biodegradable and refractory solids, the energy of the post-treatment focuses on converting the non-biodegradable solids into biodegradable ones [10,11,12].
In some wastewater treatment plants, the highly-biodegradable primary sludge (PS) and more recalcitrant waste activated sludge (WAS) are combined. In this situation, the post-treatment could be more efficient than the pre-treatment, because the solids in PS contain a higher content of biodegradable solids [13]. Compared to pre-treatment, post-treatment would more specifically target the solids which are more difficult to be biodegraded in digested sludge.
However, the studies on post-treatment techniques are relatively scarce in comparison with the information on pre-treatment and most studies carried out batch anaerobic digestion tests. Ozone [14,15], alkaline [12], thermal [13,16], thermal/acid [17,18], and thermal/alkaline [11] was successfully applied for sludge post-treatment. There are also papers showing post-treatment were superior to pre-treatment in terms of improving the anaerobic digestion effectiveness [13,16]. Battimelli et al. [14] and Li et al. [12] indicated the recycle ratio of the post-treated sludge to be an important operation parameter. It has impacts on the actual solids retention times (SRT) of the anaerobic reactor, as well as the anaerobic digestion performance.
However, ultrasonic (ULS), combined ultrasonic-ozone (ULS-Ozone), and combined ultrasonic with alkaline (ULS+ALK) post-treatments have not yet been documented in continuous reactors. Accordingly, information about the anaerobic digestion performance and the stress on microbial communities with post-treatment at different hydraulic retention times (HRTs) is not available.
Therefore, this work aims to compare the influence of the ULS, ULS-Ozone and ULS+ALK post-treatments on the anaerobic digestion performance of sewage sludge in semi-continuous reactors, as well as comparing the performance of pre- and post-treatment under the same conditions. The change in daily biogas production and suspended solids concentration were used to evaluate the anaerobic digestion performance at different HRTs and recycle ratios.
2. Materials and Methods
2.1. Sludge Sample
Sludge consisting of a mixture of primary sludge and thickened waste activated sludge (ratio 1:1 based on dry solids, TS: 15.2 ± 0.4 g/L) were collected from a local municipal wastewater reclamation plant. Fresh sludge was collected on four occasions and the main parameters were measured in triplicate for each sludge batch. Due to this, the solids content varied slightly between batches and a range of values is provided in Table 1.
2.2. Pre and Post-Treatment Conditions
ULS treatment was performed with an ultrasonicator (Misonix, Q700, Qsonica, CT, USA) at 20 kHz. The power rating of the ultrasonicator is 700 W. During ultrasonication the temperature was monitored and maintained at about 30 °C with an ice-water bath. According to the results of previous studies [19], the specific energy input was selected at 9 kJ/g TS. ULS-Ozone treatment was conducted by applying ozonation after the ULS treatment. The ozonation was performed with an ozone generator (Wedeco, GSO 30, Xylem Water Solutions Herford GmBH, Herford, Germany). A stone diffuser was installed to produce fine ozone bubbles and to enhance ozone mass transfer. The applied ozone dosage of 0.012 g O3 g−1 TS was selected based on previous results [20,21]. ULS+ALK treatment was applied by ultrasonicating the sludge which was being mixed at 200 rpm at a NaOH (Sigma-Aldrich, St Louis, MO, USA) concentration of 0.02 M according to previous research [20,22]. The NaOH concentration was reached by adding a 3 M stock solution into the sludge. The ULS+ALK post-treated digested sludge was neutralized with 6 M HCl before being recycled back to the anaerobic digester.
2.3. Anaerobic Digestion Tests
Anaerobic digestion was conducted semi-continuously in 1.2 L continuously-stirred glass bottles (one control and three test reactors with different post-treatment) with 1 L working volume at 35 °C (Figure 1). Three test reactors included an ULS post-treatment (ULS reactor), ULS-Ozone post-treatment (ULS-Ozone reactor), and ULS+ALK post-treatment (ULS+ALK reactor). Each reactor was seeded with 1 L anaerobic inoculum which was taken from a continuous full-scale anaerobic digester operating at 28 days HRT. Each reactor was then fed with untreated sludge. Biogas produced from each reactor was measured daily with a gas meter (Ritter Apparatebau Gmbh, Bochum, Germany).
Before starting the post-treatment tests, all reactors were operated at 10 days HRT for 20 days to stabilize the reactor and obtain similar reactor performance. Afterwards, a specific amount of sludge was treated and the recycle ratio R was calculated as follows: R = QR/Qin (%). Three different conditions were tested in the reactors as shown in Table 2: Condition I: HRT = 10 days and R = 50%; Condition II: HRT = 10 days and R = 100%; and Condition III: HRT = 20 days and R = 100%. Feeding, withdrawal, and recycling of sludge was conducted manually once a day. The recycle ratio (R) was calculated as the ratio of recycled sludge (QR) to the influent flowrate (Qin). For a recycle ratio of 100%, the same volume of fresh sludge and post-treated sludge are added to the reactor, so the reactor receives half its feed as fresh sludge. The post-treatment factor (α) was calculated as the ratio of daily recycled sludge volume to the reactor working volume as defined by Li et al. [12].
2.4. Analytical Methods
COD and solids concentrations were measured in accordance with standard methods [23]. Soluble and total COD were measured based on the closed reflux colorimetric method. The soluble samples were obtained by first centrifuging the sludge at 10,000 rpm for 10 min. The supernatant was then filtrated through 0.45 μm syringe filters for soluble COD analysis. Sludge dewaterability was measured with capillary suction time (CST) as described in standard methods [23]. Sludge pH was measured with a pH meter (Agilent, model 3200P, Santa Clara, CA, USA). VFAs concentration was analyzed with an Agilent Gas chromatograph (Agilent Technologies 7890A GC system, Santa Clara, CA, USA) with a flame ionization detector. The composition of biogas was measured with gas chromatography (Agilent Technologies 7890A GC system, Santa Clara, CA, USA) with a thermal conductivity detector [19].
Adenosine tri-phosphate (ATP) concentration was measured immediately after sampling using QuenchGone21™ Wastewater Test Kit following the manufacturer’s instructions (LuminUltra, Fredericton, Canada). The assay is based on the conversion of chemical energy during luciferase reaction into light energy. The emitted light was quantified using a luminometer in relative light units (RLUs) which were converted to actual ATP concentrations (ng/mL) after calibration with 1 ng/mL standard. Cellular and dissolved ATP were measured or calculated according to a procedure explained elsewhere [24]. Additionally, the biomass stress index (BSI) was calculated as the ratio of dead-cell ATP to total ATP [24].
2.5. Statistical Analysis
The results are presented as mean ± standard deviation (SD) together with the number of data points. T-tests to determine statistical differences between treatments were carried out by comparing the critical value through ANOVA one-way analysis of variance (SPSS Statistics V17.0, IBM, New York, NY, USA). Comparisons were considered significantly different at p < 0.05.
3. Results
3.1. Biogas Production
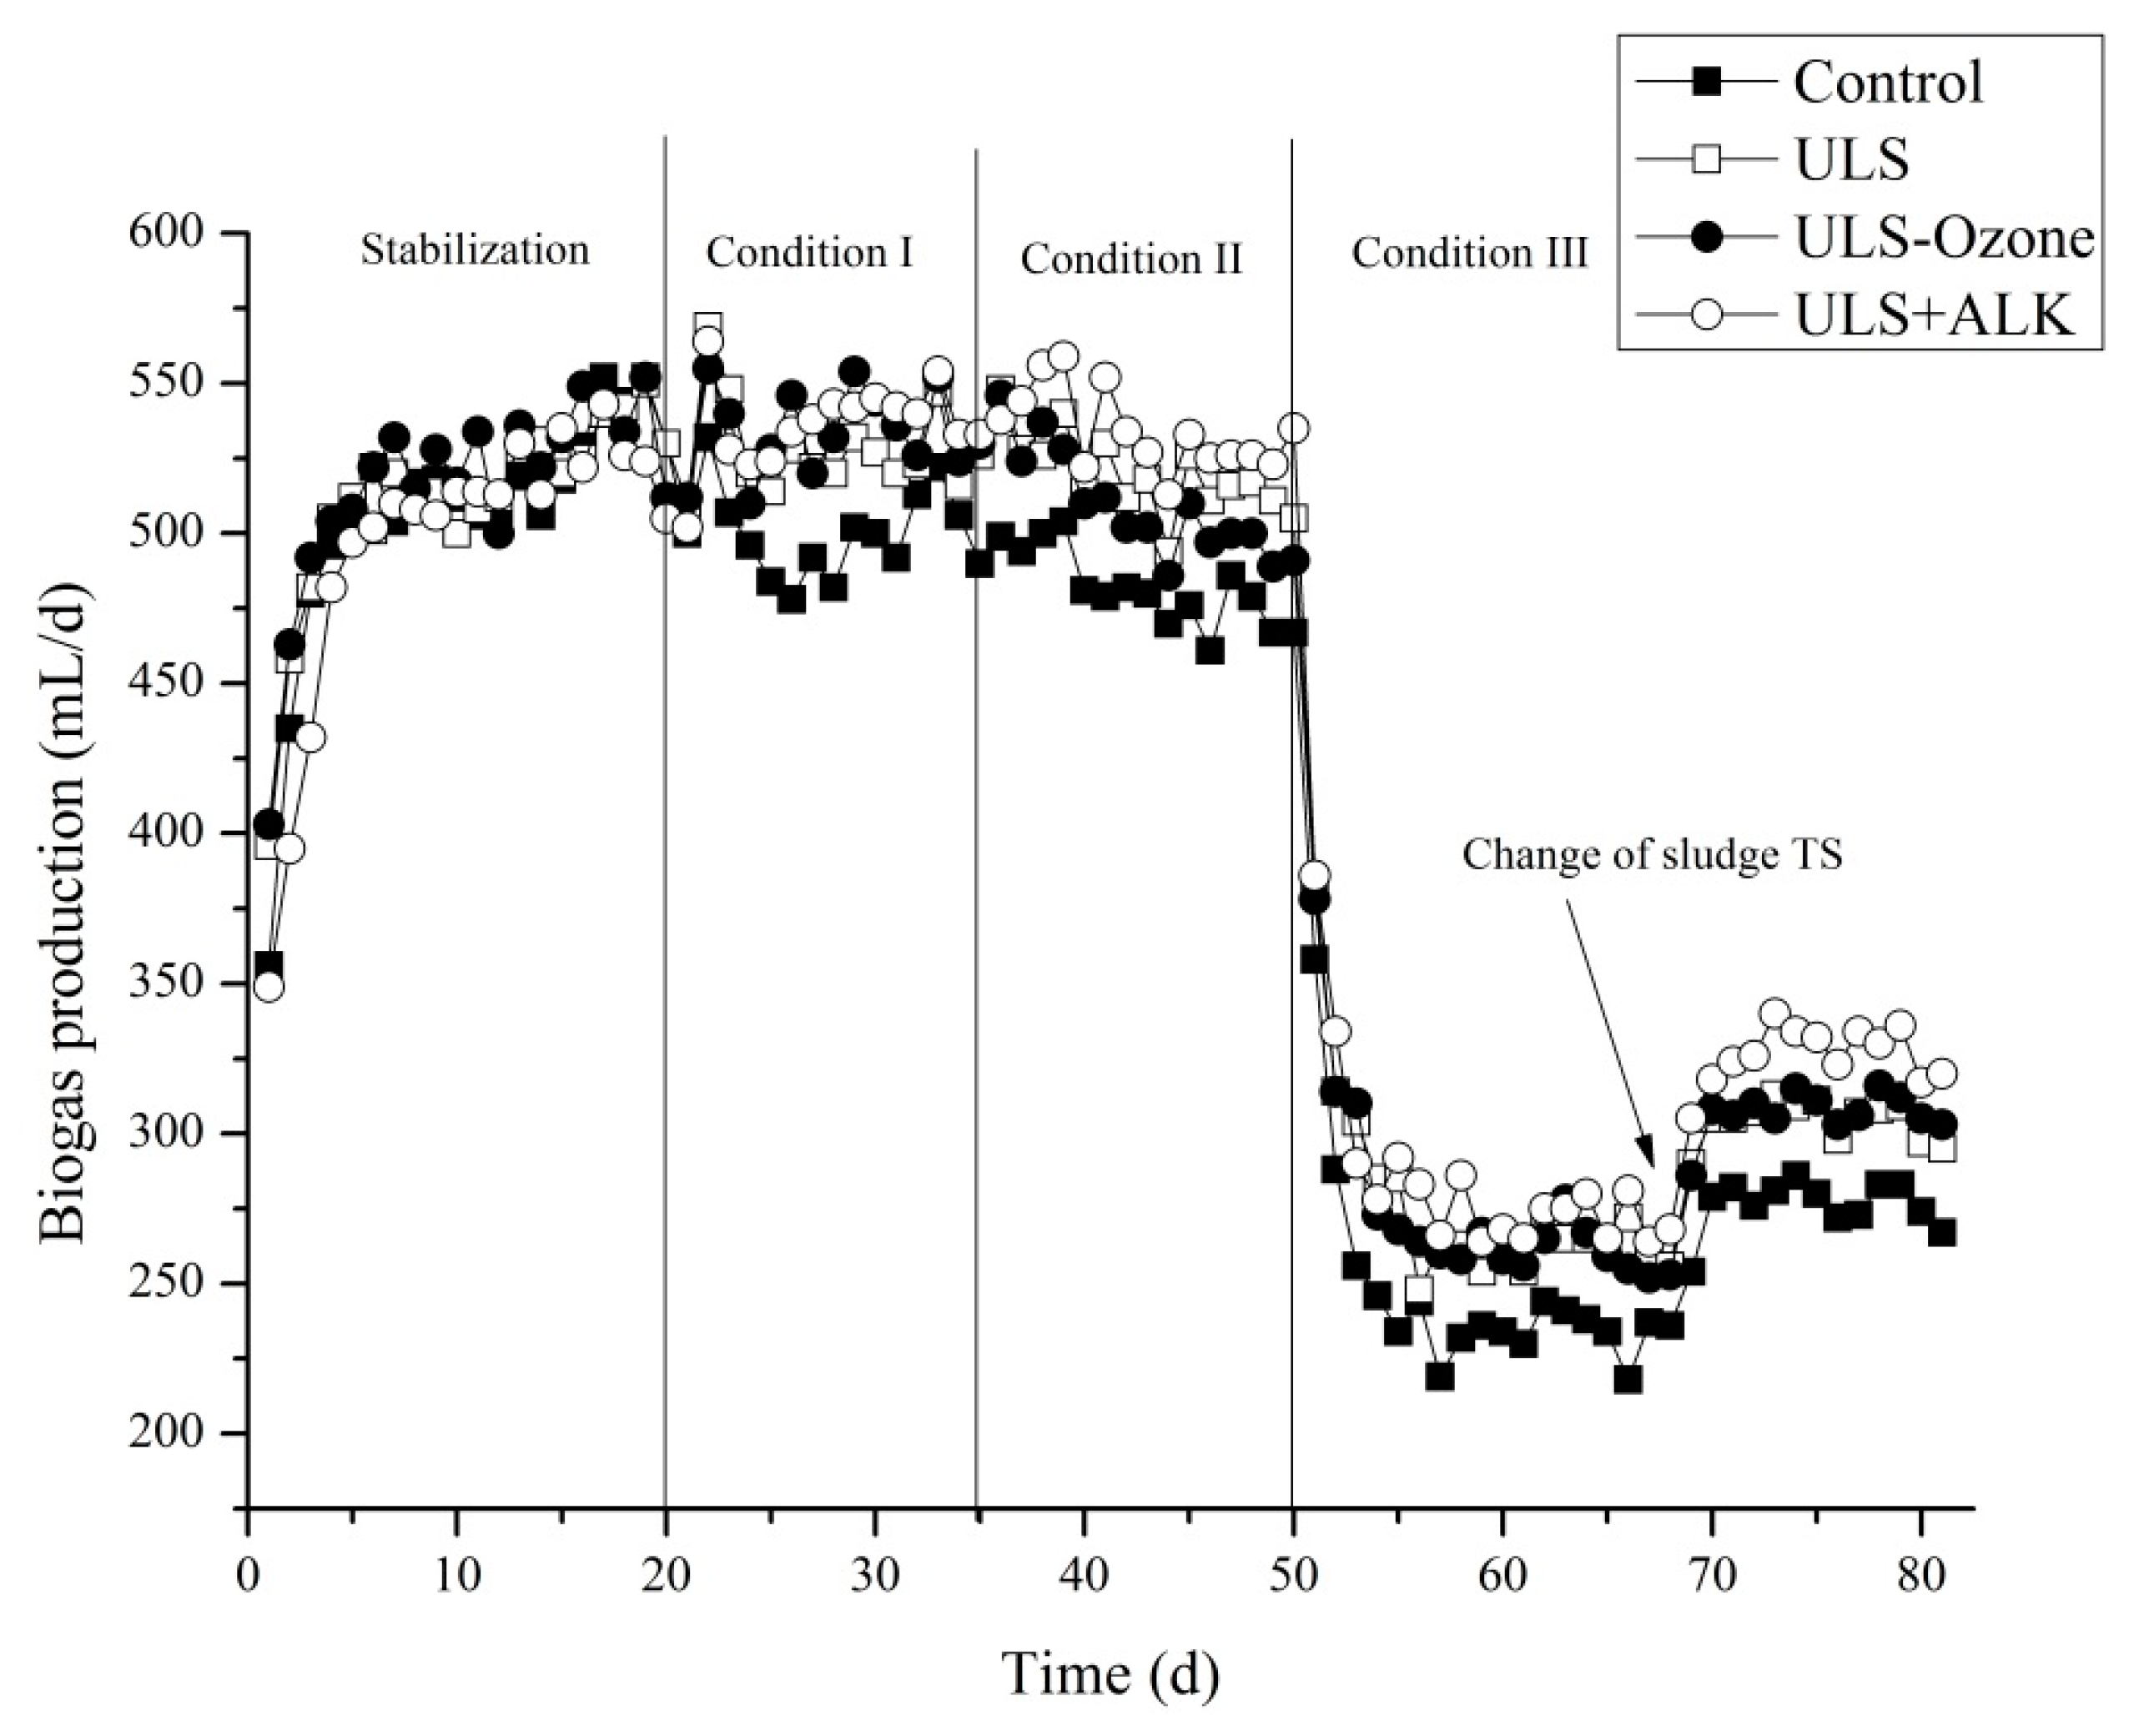
The daily biogas production from each reactor is shown in Figure 2. The daily gas production from the four reactors were similar in the first 20 days stabilization period, indicating the performance of each reactor was similar before the post-treatment was applied. Incorporation of the post-treatment improved the daily biogas production from 20 days onwards.
The methane composition in biogas was around 64% in all the tests, indicating post-treatments did not affect the methane composition. In Condition I, the biogas production due to the ULS, ULS-Ozone, and ULS+ALK post-treatment were, respectively, 5.2%, 7.1%, and 8.2% greater than in the control. This was achieved at R = 50% meaning that 50 mL/day of digested sludge going though post-treatment is mixed with 100 mL/day of raw feed. This post-treatment configuration would, therefore, consume half the energy required for the corresponding pre-treatment configuration (100 mL/day would have to be treated through any pre-treatment) while still achieving a significant biogas increase.
In Condition II, The ULS, ULS-Ozone, and ULS+ALK post-treatments increased the daily biogas production by 8%, 4.9%, and 11.1%, respectively. The biogas production due to the ULS (8%) and ULS+ALK (11.1%) post-treatments were higher than in condition I (5.2% and 8.2%, respectively). This is because more digested sludge was post-treated and recycled as substrate (higher R). However, the biogas production due to the ULS-Ozone post-treatment decreased when the volume of recycled sludge doubled. Furthermore, the T-test confirmed that the daily biogas production from the ULS-Ozone reactor was statistically lower than that produced from the ULS reactor. Li et al. [12] observed a decrease in biogas production when the recycled sludge (treated with 0.1M NaOH for 30 min) exceeded 5% of the total working volume of the anaerobic digester (α > 5%). According to Li et al. [12], the decrease in biogas production was related to the inactivation of anaerobic microorganisms at higher α values. However, in this study, increase of α from 5% to 10% only decreased the biogas production from the ULS-Ozone reactor, but increased the biogas production from the ULS and ULS+ALK reactors. Therefore, the influence of α on the biogas production was dependent on the selected treatment methods. In addition, no volatile fatty acids (VFAs) were detected in the effluent of all the reactors during conditions I and II, suggesting that the methanogenesis step was not inhibited even at 10 days HRT.
In Condition III, the biogas increases due to the ULS, ULS-Ozone and ULS+ALK post-treatments were 9.8%, 10.7%, and 17.8%. These increases were statistically greater than the corresponding increases observed in Conditions I and II. This is due to the higher HRT of 20 days applied during Condition III. On one hand, the higher HRT provided more time for the biodegradation of the feed and post-treated sludge. On the other hand, the digested sludge contained less biodegradable solids. The post-treatment energy could solubilize more slowly biodegradable solids, which also benefited the overall anaerobic digestion. Future studies should focus on two-stage anaerobic digestion with an inter-stage physico-chemical treatment.
Previous studies on batch anaerobic digestion assays showed that the ULS-Ozone post-treatment resulted in higher ultimate methane production than the ULS+ALK post-treatment [19,20,21,22]. However, this was not the case when the post-treatment was applied in semi-continuous reactors. This is because post-treated digested sludge acted as a substrate and was given sufficient time (30 days) for the degradation during batch assay. In contrast, the hydraulic residence time (HRT) was much shorter in semi-continuous reactors, as shown in Table 2. It is known that addition of ozone unavoidably increased the oxidation-reduction potential of the reactor and may have induced a lag phase. This shortened the degradation time under strict anaerobic conditions in one cycle and might have decreased the biogas recovery rate.
Effluent soluble chemical oxygen demand (SCOD) increased due to the incorporation of the post-treatment and this was accompanied by higher capillary suction times (CST). These recalcitrant organics were the result of the post-treatment that solubilized some non-biodegradable biopolymers when lyzing the anaerobic microorganisms in digested sludge. In addition, humic acid-like substances are also formed as by-products during the anaerobic digestion of the solubilized macromolecules which contributed to the effluent SCOD concentration [25]. Dewaterability of the digested sludge also deteriorated after post-treatment as shown in Table 3. This was related to the soluble residual biopolymers in the effluent that keeps the solids from being dewatered. The ULS post-treatment was mainly responsible for the increase in effluent SCOD and CST. The combination of alkaline and ULS treatment did not make the effluent SCOD and dewaterability worse. This was in accordance with a previous work by Li and co-workers [12] where individual alkaline post-treatment (0.1 mol/L NaOH) had negligible impacts on the SCOD and dewaterability in the digested sludge.
It should be noted that the digested sludge from the ULS-Ozone reactor had slightly higher SCOD and CST compared to the digested sludge from the ULS reactor. Application of ozonation subsequent to the ULS post-treatment increased the effluent SCOD concentration from 224 to 237 mg/L in condition I. However, such increase was statistically insignificant compared to the change caused by the ULS post-treatment (from 182 to 224 mg/L). The increases in biogas production were statistically significant as confirmed by the t-test provided in Table 4. In addition, the t-test results also showed that the biogas increase due to the ULS-Ozone and ULS+ALK post-treatments were statistically higher than ULS alone, showing the chemical methods were adding value to the ultrasound post-treatment.
3.2. Microbial Stresss during Semi-Continuous Anaerobic Digestion
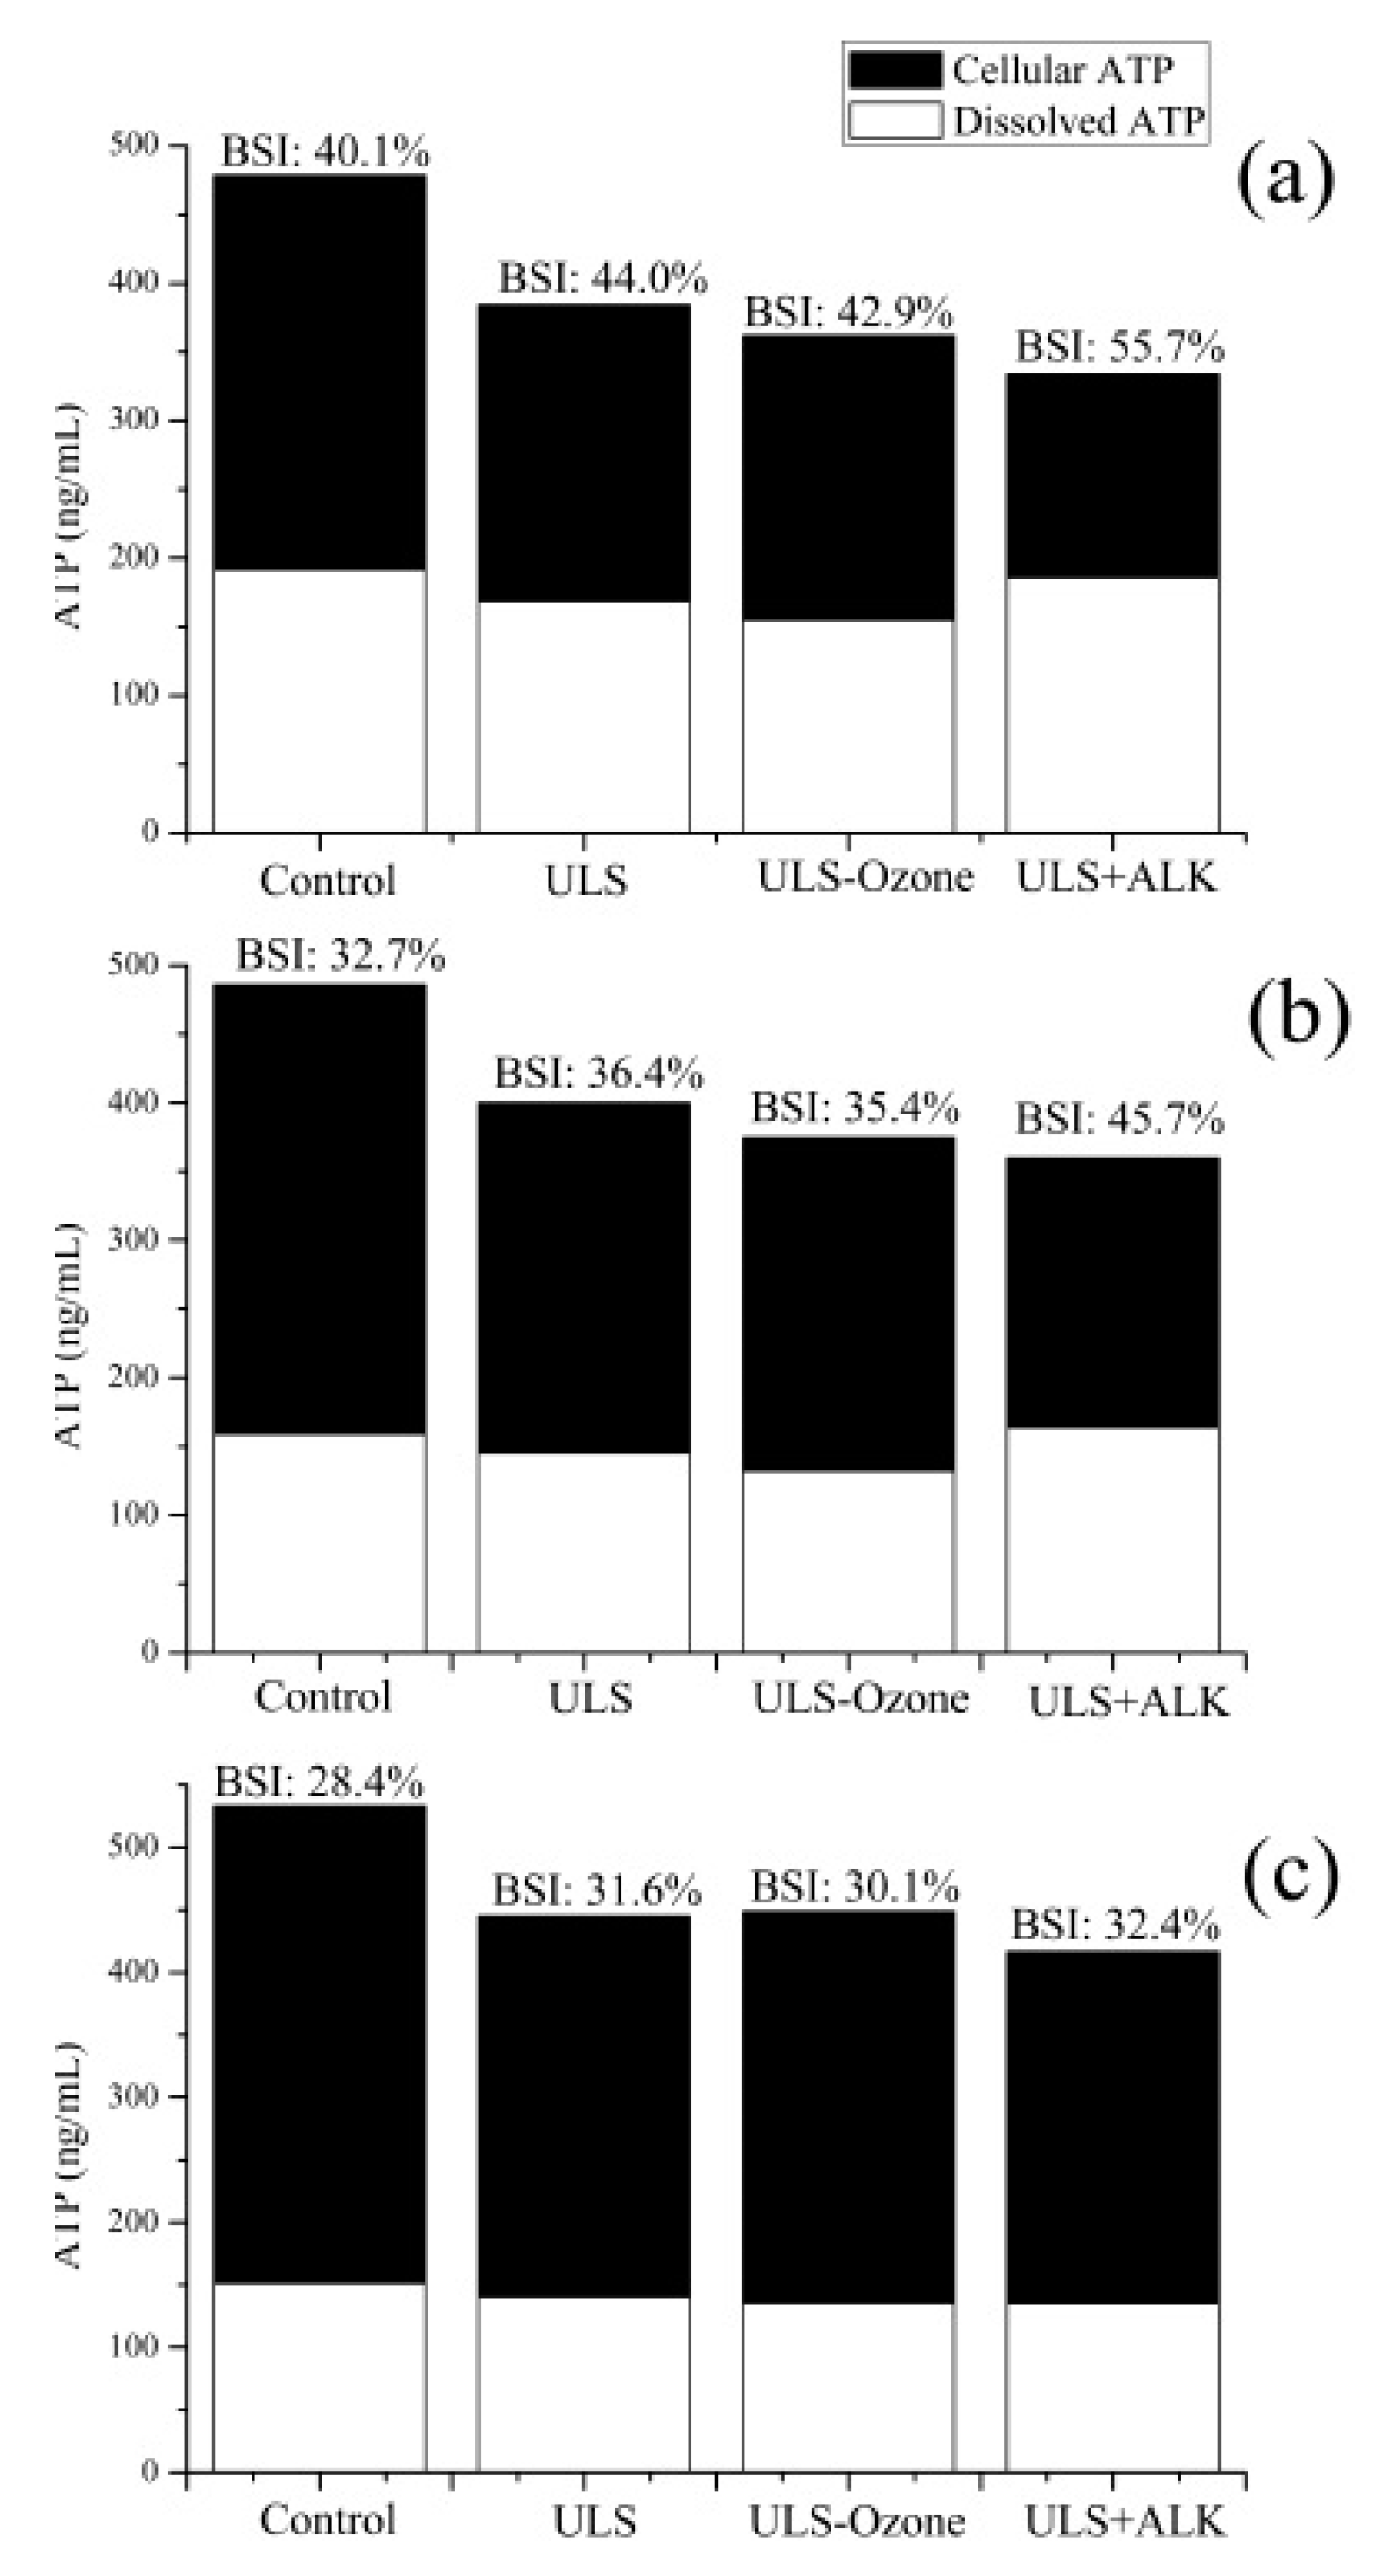
The ATP distribution in digested sludge is shown in Figure 3. All the post-treatments under all HRTs and the recycle ratio tested resulted in a lower cellular ATP compared to the control despite the small proportion of post-treated sludge compared to the total reactor volume (small α values). The effect on dissolved ATP was marginal. The decrease in the cellular ATP concentration indicated the decrease in microorganisms’ activity due to the post-treatment which was not shown in earlier studies. Interestingly, this lower cellular ATP did not prevent higher biogas production when a post-treatment was applied.
The BSI, the ratio between the dissolved and total ATP concentrations, was used to quantify the stress of microbial communities in the anaerobic reactor. Surprisingly, the BSI in the ULS-Ozone reactor was slightly lower than in the ULS reactor. This meant that the use of ozone in the post-treatment did not impose further stress on the anaerobic reactor compared to ULS alone.
However, the BSI in the ULS+ALK reactor was the highest under all conditions tested. This can be due to the accumulation of dissolved solids (i.e., sodium ions). In addition, the increase in BSI was more obvious in conditions I and II (10 days HRT). For example, the BSI increased from 40.1 to 55.7% in Condition I, but only increased from 28.4 to 32.4% in Condition III. This would suggest the ULS+ALK post-treatment imposed more stress to the anaerobic reactor when HRT was 10 days. Furthermore, when looking at all the BSI during the three consecutive test periods (I to III), it was found that the stress gradually decreased which could be due to an acclimatization and adaptation of microbial communities to the corresponding post-treatment over time. Future studies should, therefore, look at the long-term performance of such post-treatments.
4. Discussion
The post-treatment also had impacts on the characteristics of the digested sludge as shown in Table 3. The solids concentration (i.e., TS, TSS, VS, and VSS) in the digested sludge were determined by averaging the corresponding concentrations from five sampling days. A t-test was conducted to statistically compare the results, as shown in Table 4. In many cases, the average effluent VS concentrations from the ULS, ULS-Ozone, and ULS+ALK reactors were lower, but not statistically significant compared to the effluent VS concentration from the control reactor. The post-treatment could obviously improve the biogas recovery from sludge anaerobic digestion while its effects on VS destruction were relatively limited (in the range 4–7%). This was because the recycling of the post-treated sludge increased the biodegradable organic loadings of the reactor which benefited the biogas production.
The tested post-treatments showed the highest VS removals in Condition III. This was because longer residence time was given for the hydrolysis of feed and post-treated sludge. Battimelli et al. [14] showed that the COD and solids removal rates started to decrease when the recycle ratio (R) between recycled sludge (treated with 0.16 g O3/g TS) to feed sludge exceeded 25% due to the reduction of SRT. This reduction is caused by cell lysis in the recycle line due to the post-treatment. These results confirm the importance of an appropriate recycle ratio and sufficient residence time of the anaerobic reactor with the post-treatment incorporated.
The t-test results also indicated neither the ULS-Ozone nor ULS+ALK post-treatment showed obvious increases in VS removal compared to ULS post-treatment in the tested conditions, indicating the chemical methods did not significantly benefit the solids removal caused by the ULS treatment. Although effluent TS concentration decreased for ULS and ULS-Ozone reactors as a result of the VS destruction, the effluent TS was similar to the control reactor during Condition I. However, effluent TS was slightly higher for the ULS+ALK reactor (from 11.82 g/L in the control to 12.23 g/L in Condition III) due to NaOH addition which increased the dissolved solids concentration in the reactor over time. This increase is consistent with our NaOH dosage of 0.02 M or 800 mg/L. This is in contrast with the literature that reported a decrease in TS due to ULS+ALK pre-treatment in batch mode: in Seng et al. [26], the TS removal increased from 12.5% (control digester) to 17% with a chemical dose of 15 mg g−1 TS and then continued increasing to around 18% when the chemical dose increased to 25 mg g−1 TS. However, in continuous reactor with 10 mg NaOH/g TS, the TS removal was only 2% at 25 days HRT. The authors explained that the low TS removal for chemical–ultrasound pretreated WAS was due to the addition of NaOH, which contributed to the TS content. This work confirmed that low TS removals can be expected when ULS+ALK was used as post-treatment.
Li et al. [12] indicated the potential risk at α factor of 10% and 15% while the reactor was operated at 20 days HRT. This emphasized the importance of choosing an appropriate recycle ratio, especially when the alkaline treatment is applied. Although inhibition due to dissolved solids (e.g., sodium ions) was not observed in Li et al. [12] or this study, the risk of sodium inhibition is present over time. Moreover, the contamination of excess sludge with sodium may require special disposal considerations.
The biogas production increase in the semi-continuous anaerobic digestion reactors due to pre- and post-treatments are compared in Table 5. The ULS-Ozone pre-treatment resulted in higher biogas production increase than the ULS-Ozone post-treatment at 10 and 20 days HRT. This indicated the ULS-Ozone was more suitable for treatment of feed sewage sludge than for treatment of digested sludge in enhancing biogas production. This is related to the effects of the treated sludge on the anaerobic digestion process. The feed sludge acted as substrate for anaerobic digestion; whereas, the digested sludge not only acted as substrate for the anaerobic digestion, but also contained active anaerobic microorganisms which were essential for the anaerobic digestion [12,14]. Consequently, the post-treatment method can have negative effects such as the inactivation of anaerobic bacteria in digested sludge. Therefore, the lower biogas production increase observed in the ULS-Ozone post-treatment configuration was due to the inactivation or lysis of essential anaerobic microorganisms (e.g., hydrogenotrophic methanogens) in the digested sludge. This could have negated its positive effects on the biodegradability improvement.
Similarly, the pre-treatment configuration was more advantageous than the post-treatment configuration in terms of enhancing biogas production at HRT of 10 days for the ULS and ULS+ALK treatments. In contrast, the post-treatment configuration performed slightly better at HRT of 20 days for these treatments.
Full-scale application of ultrasound to pre-treat sludge was reported to result in 13–58% increase in biogas and up to 22% solids destruction at an energy input of 1.44 kWh/m3 of treated sludge [27]. A small laboratory scale probe was used in this study which required a significantly higher energy input of 9000 kJ/g TS (equivalent to 25 kWh/m3) to observe similar performance. Nevertheless, the combination of ozone or ALK with ultrasound are unlikely to justify the additional energy demand given the increment in biogas production compared to ULS alone. Based on the laboratory data, the application of ULS post-treatment seems justified and future studies could investigate the inclusion of a ULS step in-between two digesters.
In terms of solids removal, ULS-ozone and ULS-ALK achieved better results in pre-treatment configuration regardless of the HRT and recycle ratio. However, The ULS post-treatment at 10 days HRT and 50% recycle ratio achieved better removal than in pre-treatment (11.7% versus 7.6%). Moreover, this was achieved with only 50 mL of sludge being post-treated, whereas 100 mL was treated in the pre-treatment configuration. This indicated the potential of ULS to be used as post-treatment using half the amount of sludge, hence, half the energy input. At 20 days HRT, both pre- and post- ULS treatment achieved about 9.5% solids removal, which was consistent with the corresponding increase in biogas production. All configuration (pre and post) resulted in an increase in the final effluent SCOD, which translated to an increase in capillary suction times.
5. Conclusions
This work showed that the post-treatments were able to increase the biogas production and decrease the VS in the final effluent. The maximum daily biogas increase was 17.8% when the ULS+ALK post-treatment was applied to a reactor operating at 20 days HRT and 100% recycle ratio. At 50% recycle ratio (Condition I), biogas increase in the range 5–8% can be achieved at half the energy input required in a comparable pre-treatment configuration. Based on the results, the post-treatment of digested sludge or treating the sludge between two digesters is an interesting alternative to pre-treatments.
Acknowledgments
The authors would like to express sincere thanks to the Public Utilities Board (PUB), Singapore for sponsoring the project and providing the sludge and Xylem Water Solutions Herford GmBH for providing the ozone generator.
Author Contributions
Tian Xinbo conceived and designed the experiments; Tian Xinbo performed the experiments; and Tian Xinbo and Antoine Trzcinski analyzed the data and wrote the paper.
Conflicts of Interest
The founding sponsors had no role in the design of the study; in the collection, analyses, or interpretation of data; in the writing of the manuscript; and in the decision to publish the results.
References
- Eastman, J.A.; Ferguson, J.F. Solubilization of particulate organic carbon during the acid phase of anaerobic digestion. J. Water Pollu. Control Fed. 1981, 53, 352–366. [Google Scholar]
- Pavlostathis, S.G.; Giraldo-Gomez, E. Kinetics of Anaerobic Treatment. Water Sci. Technol. 1991, 25, 35–59. [Google Scholar]
- Stuckey, D.C.; McCarty, P.L. Thermochemical pretreatment of nitrogenous materials to increase methane yield. Biotechnol. Bioeng. Symp. 1978, 8, 219–233. [Google Scholar]
- Stuckey, D.C.; McCarty, P.L. The Effect of Thermal Pretreatment on the Anaerobic Biodegradability and Toxicity of Waste Activated Sludge. Water Res. 1984, 18, 1343–1353. [Google Scholar] [CrossRef]
- Tiehm, A.; Nickel, K.; Neis, U. The use of ultrasound to accelerate the anaerobic digestion of sewage sludge. Water Sci. Technol. 1997, 36, 121–128. [Google Scholar] [CrossRef]
- Bougrier, C.; Albasi, C.; Delgenes, J.; Carrere, H. Effect of ultrasonic, thermal and ozone pre-treatments on waste activated sludge solubilisation and anaerobic biodegradability. Chem. Eng. Process. 2006, 45, 711–718. [Google Scholar] [CrossRef]
- Xu, G.; Chen, S.; Shi, J.; Wang, S.; Zhu, G. Combination treatment of ultrasound and ozone for improving solubilization and anaerobic biodegradability of waste activated sludge. J. Hazard. Mater. 2010, 180, 340–346. [Google Scholar] [CrossRef] [PubMed]
- Kim, D.-H.; Jeong, E.; Oh, S.-E.; Shin, H.-S. Combined (alkaline+ultrasonic) pretreatment effect on sewage sludge disintegration. Water Res. 2010, 44, 3093–3100. [Google Scholar] [CrossRef] [PubMed]
- Gossett, J.M.; Stuckey, D.C.; Owen, W.F.; McCarty, P.L. Heat treatment and anaerobic digestion of refuse. J. Environ. Eng. Div. 1982, 108, 437–454. [Google Scholar]
- Takashima, M.; Kudoh, Y.; Tabata, N. Complete anaerobic digestion of activated sludge by combining membrane separation and alkaline heat post-treatment. Water Sci. Technol. 1996, 34, 477–481. [Google Scholar] [CrossRef]
- Nielsen, H.B.; Thygesen, A.; Thomsen, A.B.; Schmidt, J.E. Anaerobic digestion of waste activated sludge—Comparison of thermal pretreatments with thermal inter-stage treatments. J. Chem. Technol. Biotechnol. 2010, 86, 238–245. [Google Scholar] [CrossRef]
- Li, H.; Zou, S.; Li, C.; Jin, Y. Alkaline post-treatment for improved sludge anaerobic digestion. Bioresour. Technol. 2013, 140, 187–191. [Google Scholar] [CrossRef] [PubMed]
- Takashima, M. Examination on Process Configurations Incorporating Thermal Treatment for Anaerobic Digestion of Sewage Sludge. J. Environ. Eng. 2008, 134, 543–549. [Google Scholar] [CrossRef]
- Battimelli, A.; Millet, C.; Delgenesm, J.P.; Moletta, R. Anaerobic digestion of waste activated sludge combined with ozone post-treatment and recycling. Water Sci. Technol. 2003, 48, 61–68. [Google Scholar] [PubMed]
- Goel, R.; Yasui, H.; Shibayama, C. High-performance closed loop anaerobic digestion using pre/post sludge ozonation. Water Sci. Technol. 2003, 47, 261–267. [Google Scholar] [PubMed]
- Rivero, J.A.C.; Madhavan, N.; Suidan, M.T.; Ginestet, P.; Audic, J.-M. Enhancement of anaerobic digestion of excess municipal sludge with thermal and/or oxidative treatment. J. Environ. Eng. 2006, 132, 638–644. [Google Scholar] [CrossRef]
- Takashima, M.; Tanaka, Y. Application of acidic thermal treatment for one- and two-stage anaerobic digestion of sewage sludge. Water Sci. Technol. 2010, 62, 2647–2654. [Google Scholar] [CrossRef] [PubMed]
- Takashima, M.; Tanaka, Y. Acidic thermal post-treatment for enhancing anaerobic digestionof sewage sludge. J. Environ. Chem. Eng. 2014, 2, 773–779. [Google Scholar] [CrossRef]
- Tian, X.; Wang, C.; Trzcinski, A.P.; Lin, L.; Ng, W.J. Interpreting the synergistic effect in combined ultrasonication–ozonation sewage sludge pre-treatment. Chemosphere 2015, 140, 63–71. [Google Scholar] [CrossRef] [PubMed]
- Tian, X.; Trzcinski, A.P.; Lin, L.L.; Ng, W.J. Enhancing sewage sludge anaerobic “re-digestion” with combinations of ultrasonic, ozone and alkaline treatments. J. Environ. Chem. Eng. 2016, 4, 4801–4807. [Google Scholar] [CrossRef]
- Tian, X.; Trzcinski, A.P.; Lin, L.L.; Ng, W.J. Impact of ozone assisted ultrasonication pre-treatment on anaerobic digestibility of sewage sludge. J. Environ. Sci. 2015, 33, 29–38. [Google Scholar] [CrossRef] [PubMed]
- Tian, X.; Wang, C.; Trzcinski, A.P.; Lin, L.; Ng, W.J. Insights on the solubilization products after combined alkaline and ultrasonic pre-treatment of sewage sludge. J. Environ. Sci. 2015, 29, 97–105. [Google Scholar] [CrossRef] [PubMed]
- American Public Health Association (APHA). Standard Methods for the Examination of Water and Wastewater, 22th ed.; APHA: Washington, DC, USA, 2012. [Google Scholar]
- Trzcinski, A.P.; Ganda, L.; Kunacheva, C.; Zhang, D.Q.; Lin, L.L.; Tao, G.; Lee, Y.; Ng, W.J. Characterization and biodegradability of sludge from a high rate A-stage contact tank and B-stage membrane bioreactor of a pilot-scale AB system treating municipal wastewaters. Water Sci. Technol. 2016, 74, 1716–1725. [Google Scholar] [CrossRef] [PubMed]
- Luo, K.; Yang, Q.; Li, X.-M.; Chen, H.-B.; Liu, X.; Yang, G.-J.; Zeng, G.-M. Novel insights into enzymatic-enhanced anaerobic digestion of waste activated sludge by three-dimensional excitation and emission matrix fluorescence spectroscopy. Chemosphere 2013, 91, 579–585. [Google Scholar] [CrossRef] [PubMed]
- Seng, B.; Khanal, S.K.; Visvanathan, C. Anaerobic digestion of waste activated sludge pretreated by a combined ultrasound and chemical process. Environ. Technol. 2010, 31, 257–265. [Google Scholar] [CrossRef] [PubMed]
- Xie, R.; Xing, Y.; Abdul Ghani, Y.; Ooi, K.-E.; Ng, S.-W. Full-scale demonstration of an ultrasonic disintegration technology in enhancing anaerobic digestion of mixed primary and thickened secondary sewage sludge. J. Environ. Eng. Sci. 2007, 6, 533–541. [Google Scholar] [CrossRef]
Figure 1.
Schematic diagram of the anaerobic digestion process incorporating a post-treatment. Qin = influent flowrate (mL/day), Qeff = effluent flowrate (mL/day), QR = recycled flowrate (mL/day), and V = working volume (mL).
Figure 1.
Schematic diagram of the anaerobic digestion process incorporating a post-treatment. Qin = influent flowrate (mL/day), Qeff = effluent flowrate (mL/day), QR = recycled flowrate (mL/day), and V = working volume (mL).

Figure 2.
Daily biogas production from the control and test reactors. A fraction of the digested sludge was treated by ultrasound (ULS), ultrasound and ozone (ULS-Ozone) or ultrasound and alkali (ULS+ALK). Condition I: HRT = 10 days and R =50%; Condition II: HRT = 10 days and R = 100%; and Condition III: HRT = 20 days and R = 100%.

Figure 3.
ATP distribution of each reactor at Condition I (a); Condition II (b); and Condition III (c).
Figure 3.
ATP distribution of each reactor at Condition I (a); Condition II (b); and Condition III (c).


Table 1.
Characteristics of mixed sludge. The range of values in four consecutive batches of sludges for which each analyses was conducted in triplicate. COD: chemical oxygen demand.
Table 1.
Characteristics of mixed sludge. The range of values in four consecutive batches of sludges for which each analyses was conducted in triplicate. COD: chemical oxygen demand.
| Parameter | Value Range |
|---|---|
| Total Solids (g/L) | 14.8–15.6 |
| Volatile Solids (g/L) | 12.1–13.3 |
| Total Suspended Solids (g/L) | 13.1–13.9 |
| Volatile Suspended Solids (g/L) | 10.5–11.2 |
| Total COD (g/L) | 18.9–20.2 |
| Soluble COD (g/L) | 0.5–1.2 |
Table 2.
Operational conditions of each reactor.
| Operational Conditions | Condition I | Condition II | Condition III |
|---|---|---|---|
| Duration of the Experiment (days) | 15 | 15 | 31 |
| HRT = V/Qin (days) | 10 | 10 | 20 |
| Influent Flowrate, Qin (mL/d) | 100 | 100 | 50 |
| Recycle Ratio, R = QR/Qin (%) | 50 | 100 | 100 |
| Post-Treatment Factor, α = QR/V (%) | 5 | 10 | 5 |
Table 3.
Summary of anaerobic reactors performance when a post treatment was applied to digested sludge. ULS: ultrasound post-treatment; ULS-Ozone: ultrasound and ozone post-treatment; ULS+ALK: ultrasound and alkali post-treatment.
Table 3.
Summary of anaerobic reactors performance when a post treatment was applied to digested sludge. ULS: ultrasound post-treatment; ULS-Ozone: ultrasound and ozone post-treatment; ULS+ALK: ultrasound and alkali post-treatment.
| Performance Parameter | Control | ULS | ULS-Ozone | ULS+ALK |
|---|---|---|---|---|
| Condition I: 10 days HRT, RR = 50%, α = 5% | ||||
| Daily Biogas Production (mL/d) (n = 9) | 500 ± 12 | 526 ± 9 | 525 ± 12 | 541 ± 6 |
| Methane Yield (mL CH4/g VSadded) (n = 9) | 256 ± 5 | 269 ± 5 | 268 ± 6 | 277 ± 3 |
| Effluent TS (mg/L) (n = 5) | 11,460 ± 481 | 10,720 ± 309 | 10,830 ± 292 | 11,390 ± 392 |
| Effluent TSS (mg/L) (n = 5) | 9980 ± 220 | 9710 ± 606 | 9240 ± 487 | 9840 ± 198 |
| Effluent VS (mg/L) (n = 5) | 8470 ± 333 | 7940 ± 420 | 8160 ± 429 | 8140 ± 397 |
| Effluent VSS (mg/L) (n = 5) | 7840 ± 219 | 7530 ± 202 | 7280 ± 394 | 7630 ± 211 |
| SCOD (mg/L) (n = 5) | 182 ± 6 | 224 ± 7 | 237 ± 8 | 220 ± 7 |
| CST (s) (n = 3) | 64.7 ± 4.3 | 113.8 ± 8.3 | 148.7 ± 7.4 | 128.1 ± 6.8 |
| Condition II: 10 days HRT, RR = 100%, α = 10% | ||||
| Daily Biogas Production (mL/d) (n = 9) | 474 ± 8 | 512 ± 9 | 498 ± 8 | 526 ± 7 |
| Methane Yield (mL CH4/g VSadded) (n = 9) | 249 ± 4 | 269 ± 5 | 261 ± 4 | 276 ± 4 |
| Effluent TS (mg/L) (n = 5) | 10,960 ± 378 | 10,780 ± 275 | 10,500 ± 252 | 11,300 ± 362 |
| Effluent TSS (mg/L) (n = 5) | 9690 ± 368 | 9570 ± 529 | 9140 ± 608 | 9490 ± 595 |
| Effluent VS (mg/L) (n = 5) | 8150 ± 406 | 7920 ± 431 | 7710 ± 222 | 7760 ± 347 |
| Effluent VSS (mg/L) (n = 5) | 7740 ± 111 | 7700 ± 82 | 7310 ± 342 | 7390 ± 403 |
| SCOD (mg/L) (n = 5) | 184 ± 11 | 228 ± 3 | 242 ± 3 | 234 ± 4 |
| CST (s) (n = 3) | 63.1 ± 3.3 | 127.4 ± 5.4 | 143.9 ± 6.3 | 131.2 ± 5.1 |
| Condition III: : 20 days HRT, RR = 100%, α = 5% | ||||
| Daily Biogas Production (mL/d) (n = 11) | 279 ± 5 | 306 ± 5 | 309 ± 5 | 329 ± 7 |
| Methane Yield (mL CH4/g VSadded) (n = 9) | 275 ± 5 | 301 ± 5 | 304 ± 5 | 324 ± 7 |
| Effluent TS (mg/L) (n = 5) | 11,820 ± 480 | 11,320 ± 649 | 11,470 ± 160 | 12,230 ± 850 |
| Effluent TSS (mg/L) (n = 5) | 10,560 ± 227 | 9850 ± 173 | 9800 ± 509 | 9860 ± 403 |
| Effluent VS (mg/L) (n = 5) | 8710 ± 399 | 8160 ± 282 | 8080 ± 354 | 8210 ± 530 |
| Effluent VSS (mg/L) (n = 5) | 8460 ± 393 | 7750 ± 364 | 7540 ± 531 | 7700 ± 285 |
| SCOD (mg/L) (n = 5) | 225 ± 6 | 245 ± 4 | 270 ± 11 | 246 ± 4 |
| CST (s) (n = 3) | 74.6 ± 4.4 | 134.8 ± 5.7 | 156 ± 5 | 143.8 ± 5.4 |
TS: total solids; TSS: total suspended solids; VS: volatile solids; VSS: volatile suspended solids; SCOD: soluble chemical oxygen demand; CST: capillary suction time; n: number of days at the end of the experiment during which the data were averaged.
Table 4.
Statistical analysis of the biogas production increase and effluent VS decrease due to post-treatment at different conditions.
Table 4.
Statistical analysis of the biogas production increase and effluent VS decrease due to post-treatment at different conditions.
| Statistical Parameter | Control | ULS | ULS-Ozone | ULS+ALK |
|---|---|---|---|---|
| Condition I: 10 days HRT, RR = 50%, α = 5% | ||||
| Daily Biogas Production Increase (%) | - | 5.2 | 7.1 | 8.2 |
| T-Test Compared to Control | - | 7.83 a | 7.65 a | 11.06 a |
| T-Test Compared to ULS | - | - | 3.63 a | 7.67 a |
| Decrease in Effluent VS (%) | - | 6.3 | 3.7 | 3.9 |
| T-Test Compared to Control | - | −4.17 b | −2.48 c | −2.8 b |
| T-Test Compared to ULS | - | 1.09 c | 0.83 c | |
| Condition II: 10 days HRT, RR = 100%, α = 10% | ||||
| Daily Biogas Production Increase (%) | - | 8 | 4.9 | 11.1 |
| T-Test Compared to Control | - | 12.67 a | 9.44 a | 16.75 a |
| T-Test Compared to ULS | - | - | −10.93 b | 5.8 a |
| Decrease in Effluent VS (%) | - | 2.8 | 5.4 | 4.8 |
| T-Test Compared to Control | - | −1.76 c | −3.96 b | −1.77 c |
| T-Test Compared to ULS | - | - | −2.09 c | −0.61 c |
| Condition III: 20 days HRT, RR = 100%, α = 5% | ||||
| Daily Biogas Production Increase (%) | - | 9.8 | 10.7 | 17.8 |
| T-Test Compared to Control | - | 22.6 a | 29.6 a | 24.21 a |
| T-Test Compared to ULS | - | - | 1.84 c | 16.68 a |
| Decrease in Effluent VS (%) | - | 6.3 | 7.2 | 5.7 |
| T-Test Compared to Control | - | −5.5 b | −6.68 b | −1.96 c |
| T-Test Compared to ULS | - | - | −1.21 c | 0.21 c |
a Significant higher (p-value larger than 2.306); b Significant lower (p-value smaller than −2.306); c Not significant higher (p-value between −2.306 and 2.306). VS: volatile solids.
Table 5.
Comparison of performance of pre-treatment and post-treatment using ULS, ULS-Ozone, and ULS+ALK treatments at 10 and 20 days HRT.
Table 5.
Comparison of performance of pre-treatment and post-treatment using ULS, ULS-Ozone, and ULS+ALK treatments at 10 and 20 days HRT.
| Performance Parameter | Treatment (HRT, R) | ULS | ULS-Ozone | ULS+ALK |
|---|---|---|---|---|
| Biogas Increase (%) | Pre-treatment (10) | 20.7 | 35.9 | 24.6 |
| Pre-treatment (20) | 7.7 | 25.5 | 16.6 | |
| Post-treatment (10, 50%) | 5.2 | 7.1 | 8.2 | |
| Post-treatment (10, 100%) | 8 | 4.9 | 11.1 | |
| Post-treatment (20, 100%) | 9.8 | 10.7 | 17.8 | |
| Solids Removal (%) | Pre-treatment (10) | 7.6 | 18.3 | 15.7 |
| Pre-treatment (20) | 9.7 | 21.4 | 18.2 | |
| Post-treatment (10, 50%) | 11.7 | 6.8 | 7.3 | |
| Post-treatment (10, 100%) | 4.7 | 9.1 | 8 | |
| Post-treatment (20, 100%) | 9.5 | 10.9 | 8.6 | |
| Post-Digestion SCOD Concentration (mg/L) | Pre-treatment (10) | 194 to 257 | 194 to 589 | 194 to 296 |
| Pre-treatment (20) | 182 to 227 | 182 to 440 | 182 to 246 | |
| Post-treatment (10, 50%) | 182 to 224 | 182 to 236 | 182 to 220 | |
| Post-treatment (10, 100%) | 184 to 228 | 184 to 242 | 184 to 234 | |
| Post-treatment (20, 100%) | 225 to 245 | 225 to 270 | 225 to 246 |
HRT: hydraulic retention time (days); R: recycle ratio in post-treatment (%).
© 2017 by the authors. Licensee MDPI, Basel, Switzerland. This article is an open access article distributed under the terms and conditions of the Creative Commons Attribution (CC BY) license (http://creativecommons.org/licenses/by/4.0/).
Share and Cite
MDPI and ACS Style
Tian, X.; Trzcinski, A. Effects of Physico-Chemical Post-Treatments on the Semi-Continuous Anaerobic Digestion of Sewage Sludge. Environments 2017, 4, 49. https://0-doi-org.brum.beds.ac.uk/10.3390/environments4030049
AMA Style
Tian X, Trzcinski A. Effects of Physico-Chemical Post-Treatments on the Semi-Continuous Anaerobic Digestion of Sewage Sludge. Environments. 2017; 4(3):49. https://0-doi-org.brum.beds.ac.uk/10.3390/environments4030049
Chicago/Turabian StyleTian, Xinbo, and Antoine Trzcinski. 2017. "Effects of Physico-Chemical Post-Treatments on the Semi-Continuous Anaerobic Digestion of Sewage Sludge" Environments 4, no. 3: 49. https://0-doi-org.brum.beds.ac.uk/10.3390/environments4030049
Note that from the first issue of 2016, this journal uses article numbers instead of page numbers. See further details here.