Potential of Urban Densification to Mitigate the Effects of Heat Island in Vienna, Austria


AIT Austrian Institute of Technology GmbH, Giefinggasse 4, 1210 Vienna, Austria
*
Author to whom correspondence should be addressed.
Environments 2019, 6(7), 82; https://0-doi-org.brum.beds.ac.uk/10.3390/environments6070082
Submission received: 31 May 2019
/
Revised: 29 June 2019
/
Accepted: 9 July 2019
/
Published: 10 July 2019
(This article belongs to the Special Issue Adaptation Measures for Urban Heat Island)
Abstract
:Global increase of urban population has brought about a growing demand for more dwelling space, resulting in various negative impacts, such as accelerated urbanization, urban sprawl and higher carbon footprints. To cope with these growth dynamics, city authorities are urged to consider alternative planning strategies aiming at mitigating the negative implications of urbanization. In this context, the present contribution investigates the potential of urban densification to mitigate the heat island effects and to improve outdoor thermal conditions. Focusing on a quite densely urbanized district in Vienna, Austria, we carried out a set of simulations of urban microclimate for pre- and post-densification scenarios using the parametric modelling environment Rhinoceros 3D and a set of built-in algorithms in the Rhino’s plug-in Grasshopper. The study was conducted for a hot summer period. The results revealed a notable solar shielding effect of newly introduced vertical extensions of existing buildings, promoting temperature decrease and improved thermal conditions within more shaded urban canyons and courtyards. However, a slight warming effect was noted during the night-time due to the higher thermal storage and lower sky view factor.
1. Introduction
Global increase of urban population has brought about a growing demand for more dwelling space, resulting in a number of negative impacts such as accelerated urbanization, urban sprawl and higher carbon footprints [1,2]. Elevated levels of CO2 emissions, along with a massive loss of vegetative cover, are found to affect the atmospheric composition, local air quality, and near-surface urban air temperatures, having immediate consequences for human health and comfort [3,4,5]. Ryu et al. (2013) analyzed the effects of anthropogenic emissions on air quality in the urban boundary layer and noted that anthropogenic heat causes a larger rural-urban temperature gradient, which induces a stronger inward flow of urban-breeze circulation. In turn, this promotes the advection of ozone from the surroundings into the urban area, whereby it is known that ozone-rich air may induce a range of adverse health effects [6]. Additionally, Rinner and Hussain (2011), among others, investigated the relationship between land use and surface temperature and concluded that average surface temperatures are significantly higher for urban land uses, characterized by high ratios of sealed surface covers with high heat capacity, and lower ones for vegetated areas. However, due to the rapid growth of cities, local governments are forced to respond to these challenges. In the case of there being a lack of financial resources, this would result in inefficient, inadequate or insufficient infrastructures requiring maintenance and extension (housing, transportation, water and waste water supply and energy supply) and unsustainable production/consumption patterns, which lead to even more waste heat in the built environment [7]. The implications of these developments may be even more severe when urbanization takes place in a non-strategic manner. With unplanned transformation of existing urban areas, cities are becoming increasingly inhomogeneous, having more impermeable (sealed) than permeable (vegetative) cover. This is not only problematic from climatic and thermal point of view, but the overall perception of cities as favorable living environments is becoming challenged [8].
This calls for more informed planning strategies to properly address the above-mentioned issues. For these reasons, city authorities are currently being urged to consider alternative environmentally friendly urban development approaches aimed at mitigating the negative phenomena associated with global urbanization [9,10]. One of the promising emerging strategies relates to urban densification. However, the potential of urban densification to remedy these negative implications and improve the quality of urban life may be great, but still needs to be scientifically investigated and documented. Smart urban densification may be understood as an idea of a compact city, a more sustainable urban development model aimed at reducing energy and carbon emissions by optimizing the use of space, public services and infrastructure [11,12]. However, the inherent challenges of these kinds of interventions, such as substantial financial investments, private property issues and a building’s structural limitations, may impede their implementation in an urban space, even if their integration into current urban planning policies is already being carried out. It is thus of great importance to contribute to the understanding of the environmental benefits from physical interventions, giving more weight to the gains over the costs. This may help bridge the gap between research, planning and implementation activities and aid readiness to invest in these kinds of interventions.
In an effort to advance current scientific knowledge regarding the potentials of urban densification to mitigate the effects of urban heat island (UHI) and improve outdoor thermal conditions, a comprehensive analysis of implications of pre- and post-densification scenarios is being carried out as the main focus of the ongoing CLUDEX project (Climate Change and urban densification impact exploration), funded within the framework of the Austrian Climate Research Program (ACRP) [13]. The focus of the study is set on an urban location in the 12th district (Meidling) in the city of Vienna, Austria. The following aspects were investigated using the parametric modelling environment Rhinoceros 3D and a number of built-in algorithms in Rhino’s plug-in Grasshopper [14]:
First, we explored the respective changes of the physical environment once the densification scenario was introduced. For this purpose, we carried out a location-specific analysis of the following features: sky view factor changes, shadow range analysis, solar access in urban canyons and net radiation gain. Subsequently, a set of urban microclimate simulations for pre- and post-densification scenarios were carried out. The study was conducted for a hot summer period. The respective results were analyzed within the context of mean radiant temperature (MRT) averaged over a 24-h cycle and distinguished into day- and night-time shares.
It should be noted, however, that the present study is limited in scope. We only investigated the differences in radiative heat budget and heat exchange within the study area between base case and densification scenario. As the reference period for which the simulations were run represent a unique combination of weather conditions for a continuous hot summer period (high daily temperature, cloud-free and low wind conditions), incoming shortwave, reflected shortwave/longwave and emitted longwave radiation would be, in this case, the most affected factors.
2. Materials and Methods
2.1. Case Study Domain
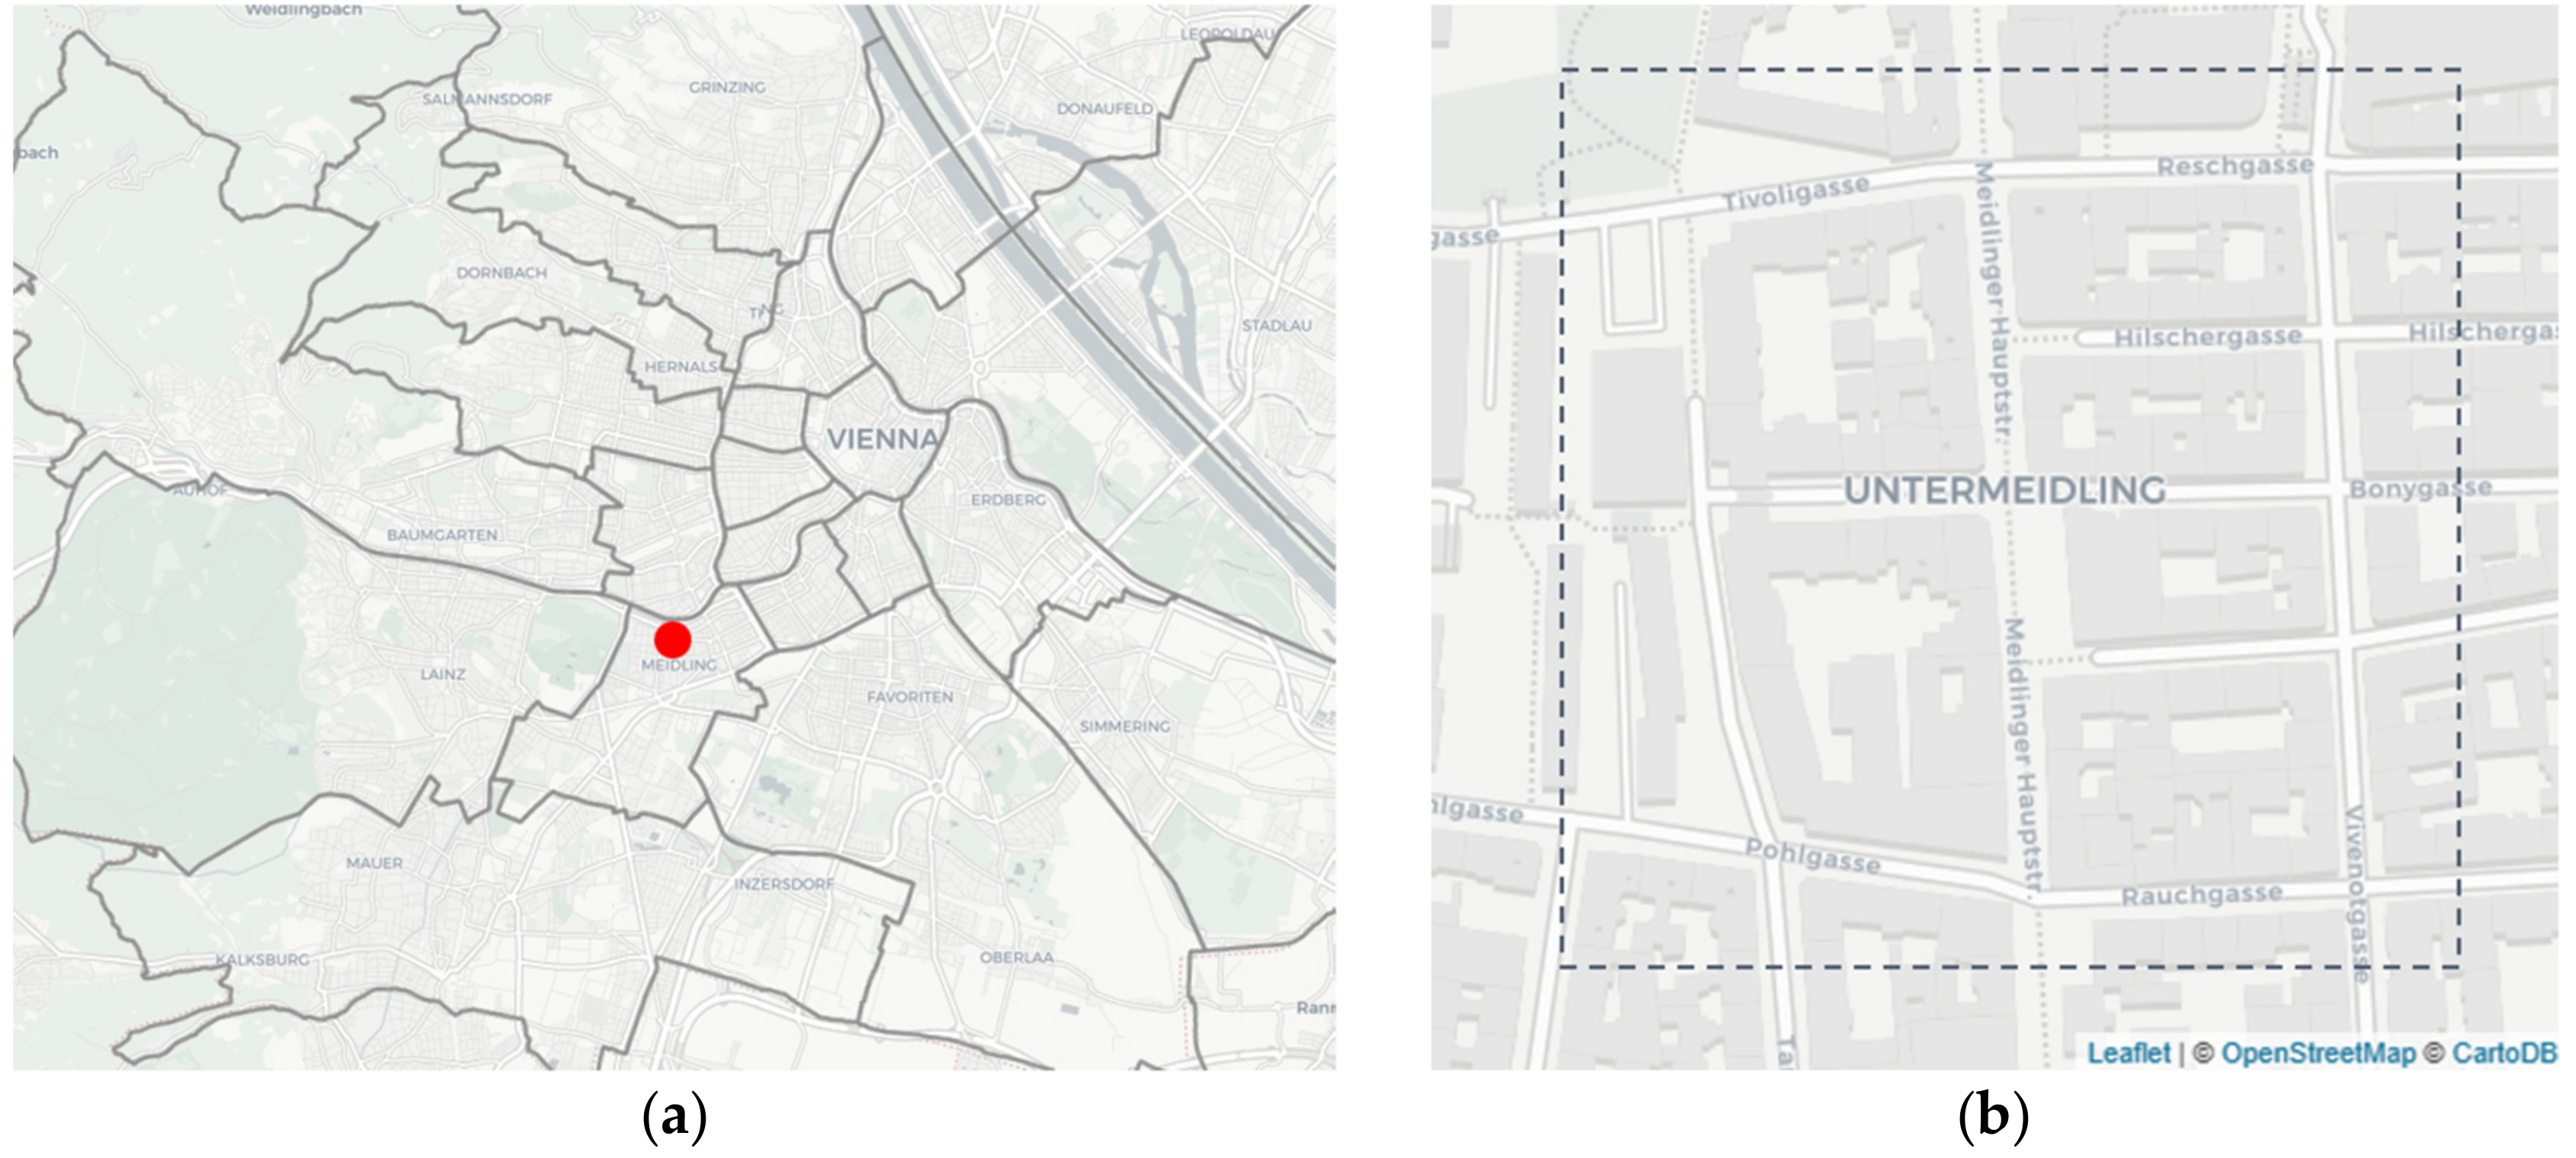
A specific urban area in the 12th district (Meidling) in the city of Vienna, Austria, has been selected as a case study. The extent of the domain is depicted in Figure 1 (longitude 16.3160° E, latitude 48.1674° N). Spatial dimension of the considered area is 350 × 350 meters. The area falls under the Local Climate Zone 2 (LCZ 2) category (compact mid-rise), as defined by Stewart and Oke [15]. The area is mostly residential, with business premises occupying the ground floors, such as grocery shops, restaurants, street level workshop- and office space. The buildings are mainly from three construction periods: about 30% are constructed in the period from 1848 to 1918, 5% are built between 1919 and 1945, while the remaining 65% were built after the year 1945. The average height of the buildings is around 15 meters, whereby the height ranges from 4 meters to 22 meters. Buildings are mainly of two to five stories high (average floor height is around 4 meters), with flat or slabbed roofs.
According to the height zoning regulations for the city of Vienna [16], the predominant height classes of the buildings in the area are of class III and IV. Class III denotes a maximum building height threshold of 16 meters, whereby the class IV denotes the maximum building height threshold of 21 meters. This is in accordance with the structural properties of the buildings depending on their construction age. Thus, all the instances where the height limit is not met are further recognized as densification potential for the buildings in question.
Due to the importance of social and economic impacts of urban densification, detailed assessments of these impacts are envisioned. First calculations, which were conducted for the whole area of Meidling district, show the increase in floorspace of around 15% (without attic conversion) to 25% (with attic conversion) when additional stories are added to existing buildings. Considering the average household size of two persons per household, the resulting capacity of newly generated floorspace can be derived by multiplying the apartment units by two. More details may be found in Loibl et al. [17].
2.2. 3D Modelling Efforts
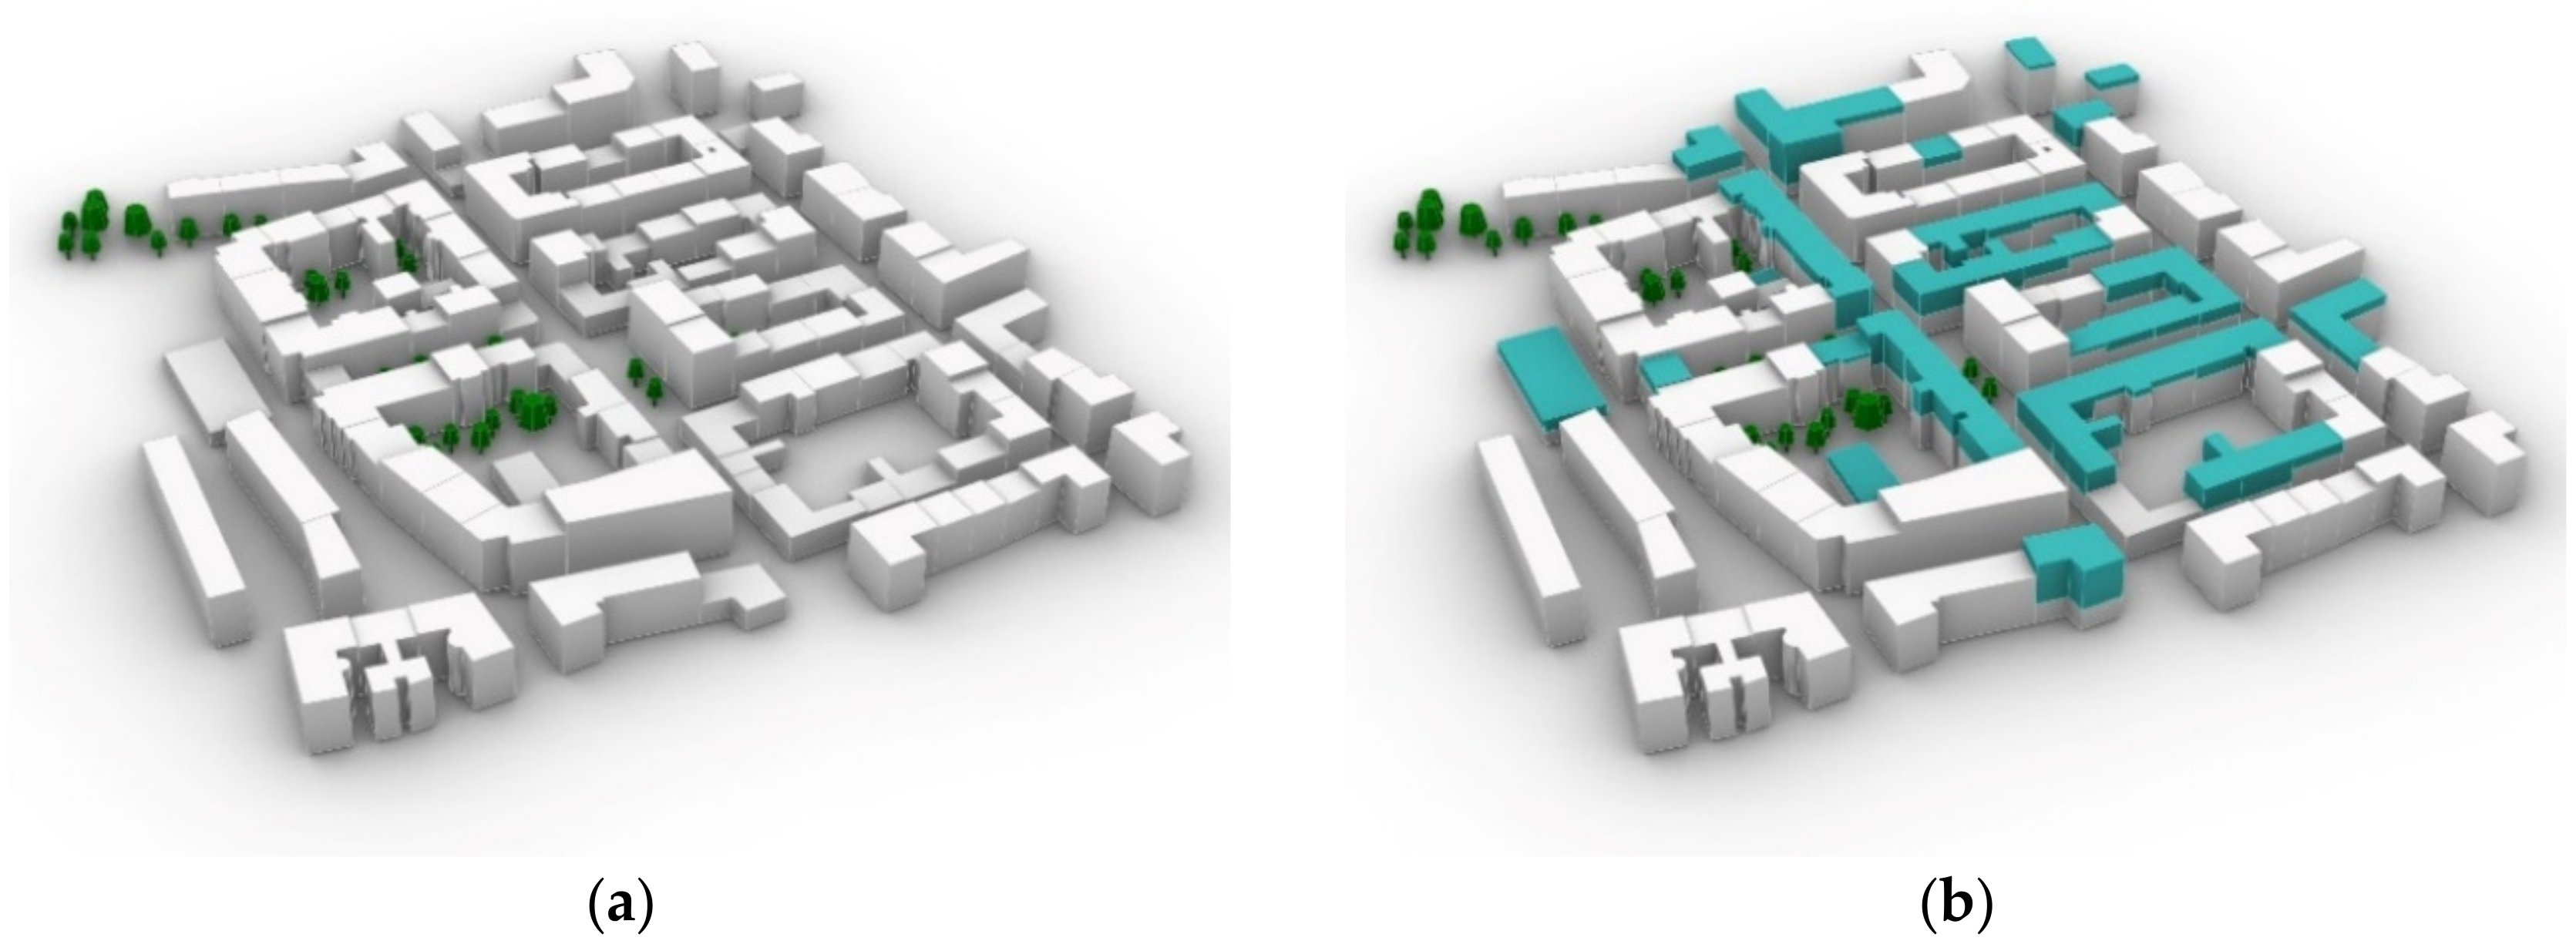
The initial 3D city model is generated using the built-in generative algorithms within the Rhinoceros 3D plug-in environment Grasshopper (GH). For this purpose, we used open-source digital geodata provided by the city of Vienna [18] as shapefiles consisting of the building footprints with building height information, measured from the ground surface to the building eaves. The information regarding the maximum allowed building height, as defined in the height zoning regulations for the city of Vienna [16], is integrated into the base geodata through a spatial relation of the height class annotation to the building footprints using ArcGIS software [19]. Further land use properties, like paved and vegetated areas, are introduced as separate layers within the GIS environment. Once all the initial geometric input is prepared, 3D geometry representing both base case and densification scenario (considering the extension to the maximum allowed height) was generated using the GH component, which allows for the import and additional manipulation of shapefiles into the Rhino’s 3D environment. The process provides the automated upward extrusion of building footprints transferring the buildings’ height information into 3D volumes. The height extension volumes are further filtered to consider only those extensions higher than 1.5 meters to allow for the creation of an additional floor area in the particular buildings. This would in principle allow either the construction of attic apartments with partly inclined walls under sloping roofs (in line with the Austrian building regulations) or (smaller) apartments with rearward offset walls.
Trees are modelled directly within the Rhinoceros 3D environment as 3D polygon solids, consisting of tree crown and tree trunk. The position of the trees within the urban canyons is inherited from the tree cadaster database of the city of Vienna [20]. The respective 3D models are depicted in Figure 2.
2.3. Potential Changes of the Physical Environment
To carry out comprehensive solar radiation studies, sky view analyses and building volume changes resulting from height extensions, we used Rhinoceros 3D and the set of plug-ins from the family of Ladybug tools [21]. More specifically, we deployed from the Ladybug toolset (i.e., Ladybug, Honeybee, Dragonfly, Butterfly), individual components of the Ladybug plug-in to conduct an advanced assessment of alternative urban design options.
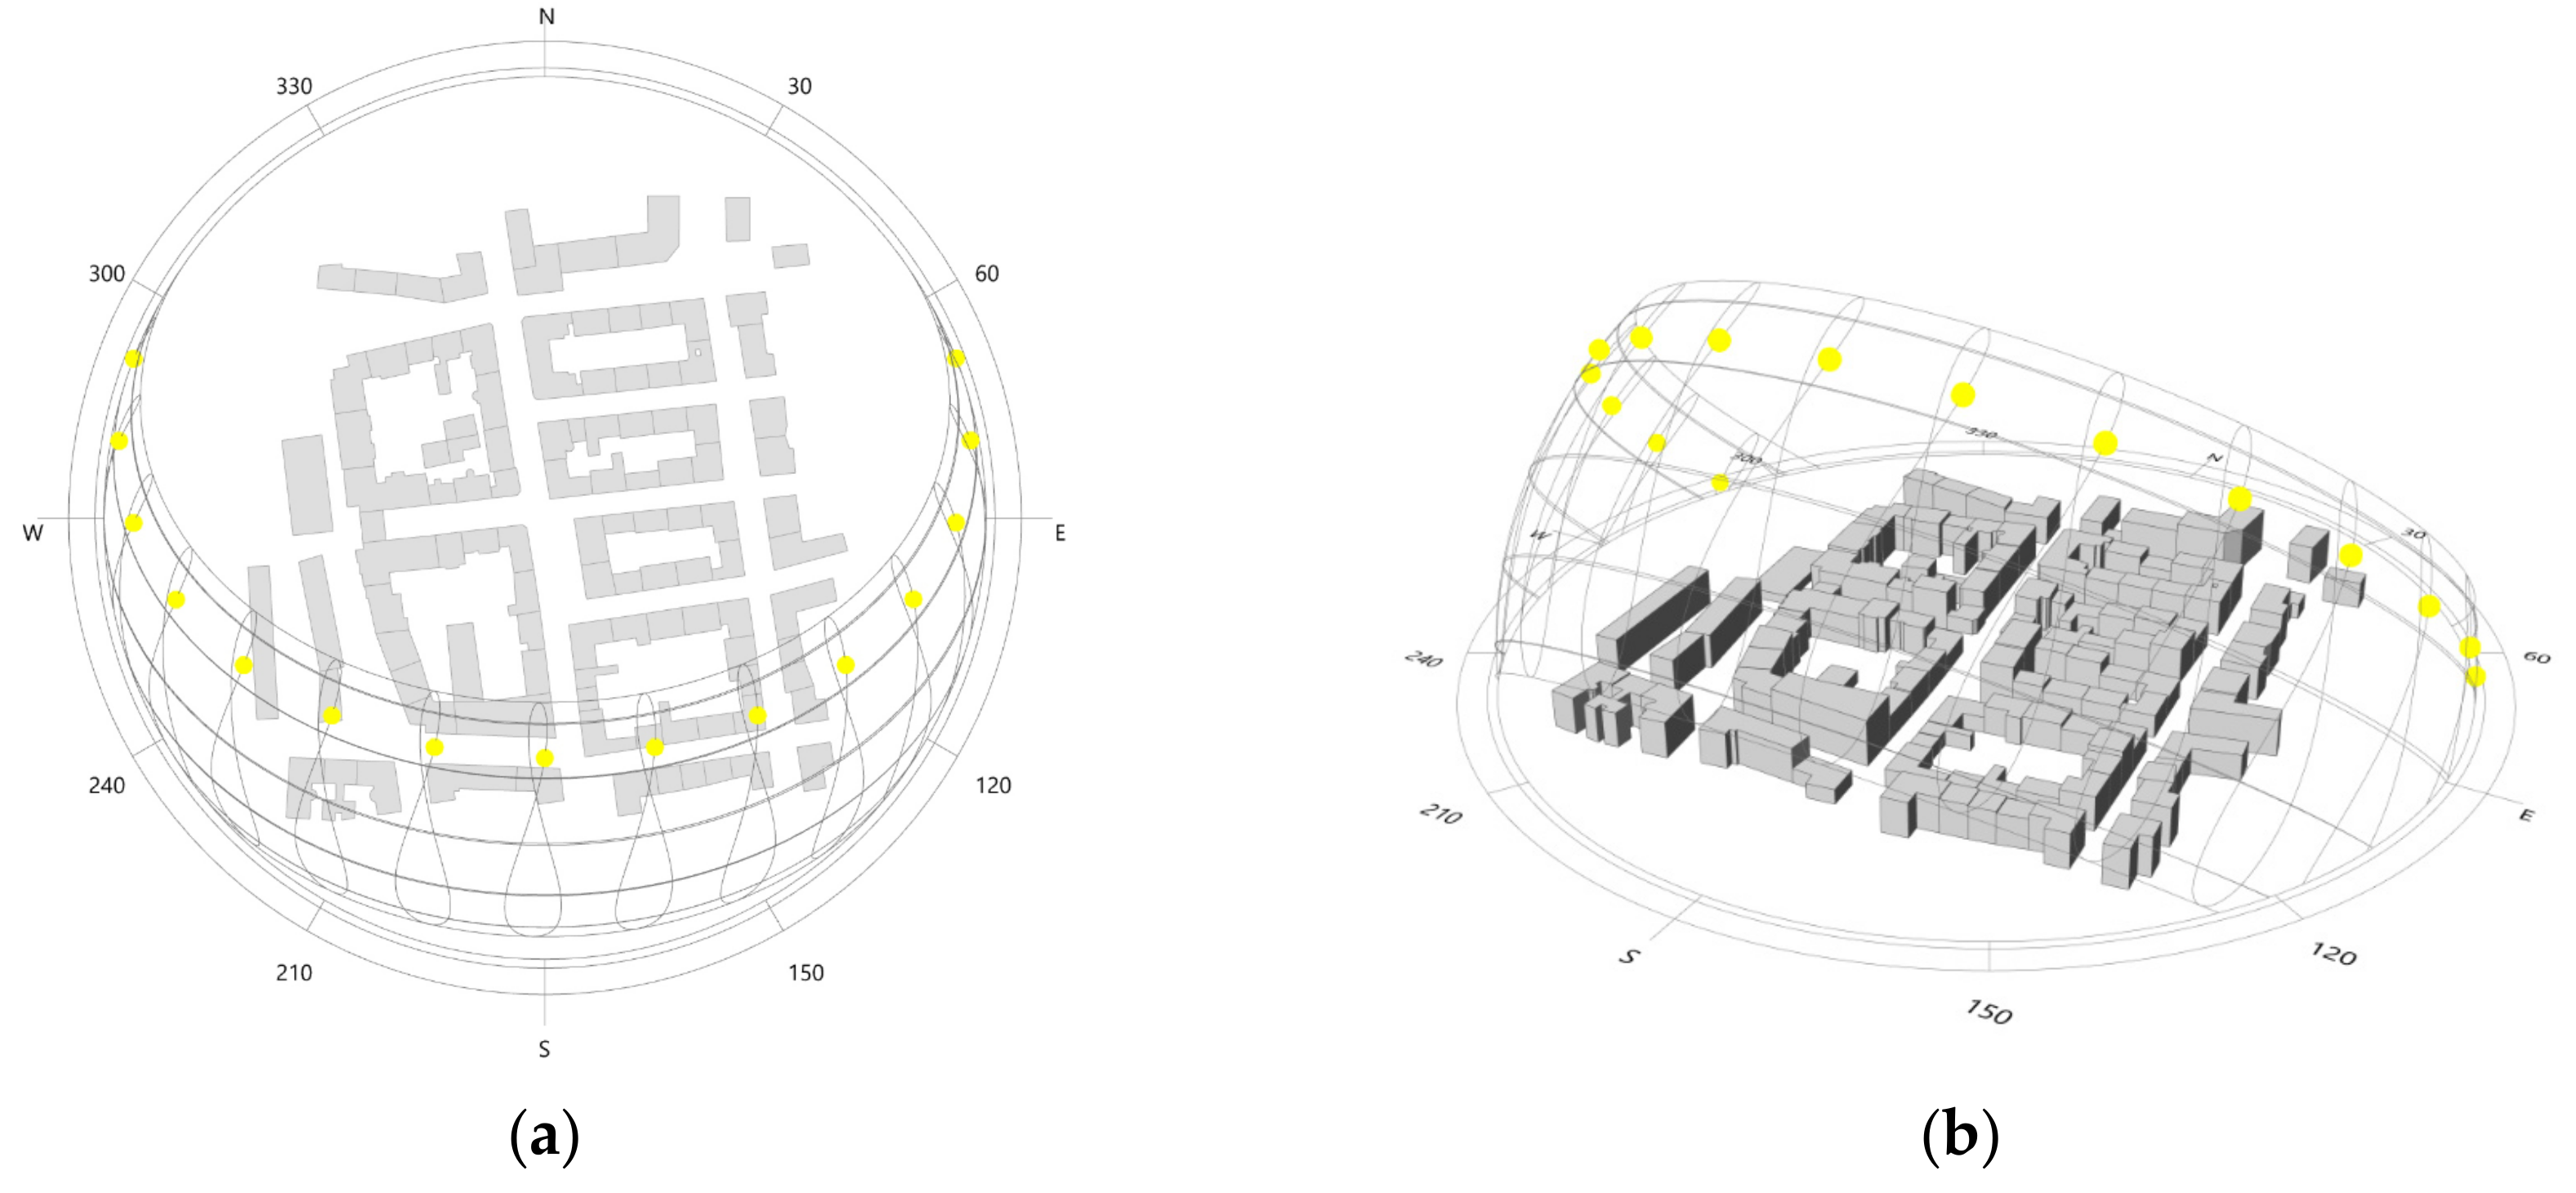
The Ladybug components allow the computation of complex interactions of the built environment and local climate by considering a unique position of the study domain within the planetary environment and accordingly generating the sun path diagram over the location. Based on this, the sun vectors are projected from each respective sun position towards the surface plane and the corresponding interactions with the built volume are recognized as physical obstructions to solar access (Figure 3). The result is an interactive and instantaneous radiation analysis which can be further customized by defining the analysis period within a year. In this regard, we conducted the analysis for a hot summer day (11 August, 2018). The weather file deployed for the purpose represents a typical reference year composed for the city of Vienna, provided in the EnergyPlus weather format obtained from the official EnergyPlus tool website handled by the U.S. Department of Energy’s (DOE) Building Technologies Office (BTO) [22]. To compute the total built volume of pre- and post-densification scenarios, a GH volume component readily available within the Grasshopper environment was used to solve volume properties for generated 3D geometries.
2.4. Microclimatic Simulations
To systematically assess the role of increased building height on microclimatic development, a set of dynamic microclimatic simulations for pre- and post-densification scenarios are carried out. For this purpose, we used the Honeybee feature collection from the Ladybug Tools. Honeybee connects the GH with validated simulation engines, such as EnergyPlus, Radiance [23], THERM - Two-Dimensional Building Heat-Transfer Modeling [24], in order to perform advanced energy and daylight simulations, including the envelope heat flow.
Starting from the initial 3D model of the study domain, a specific set of components available in Honeybee (HB) are used to convert the geometry into the Honeybee zones (HB zones) with all the properties needed to initiate an energy performance simulation. An HB zone represents a thermal zone volume that is defined by a specific heating/cooling system. In general, HB zones are defined by the construction materials, surface boundary conditions (e.g., exterior and interior surfaces, ground surfaces), occupancy and loads schedules. Due to the complexity and size of the domain under study, we assumed a simplified energy model, whereby each building is understood as a single thermal zone. The occupancy schedule was set on mid-rise residential apartment setting, following the ASHRAE standards (American Society of Heating, Refrigerating and Air-Conditioning Engineers) [25], while all zones are conditioned with an ideal air loads system setting [26], that provides a model for an ideal HVAC system (Heating, ventilation, and air conditioning). Concrete construction was set as the main construction material for all the buildings in the area for both roof (lightweight concrete) and wall (heavyweight concrete) assemblies. Detailed overview is provided in Table 1. Table 1 also provides the information regarding the U- and R-values of the used constructions. U-value measures the rate of heat transfer through the construction, while R-value relates to the resistance to heat flow of a given material. The lower the U-value, the more energy-efficient the system is. The higher the R-value, the better insulation properties of a material are.
Once the building geometry is prepared, the same conversion was done for the ground surfaces. In this case, the following conditions should be met: the ground zone should not consider any heating and cooling loads nor occupancy schedules, the boundary conditions should be set on ‘ground’ conditions, and the specific soil type should be defined. In general, two soil types were considered for the study area: asphalt for the paved surfaces and vegetative cover for the grass surfaces. The corresponding thermal properties, such as soil conductivity, density and heat capacity, were based on the type of the material. Table 2 provides an overview of thermal properties of considered ground layers and soil materials.
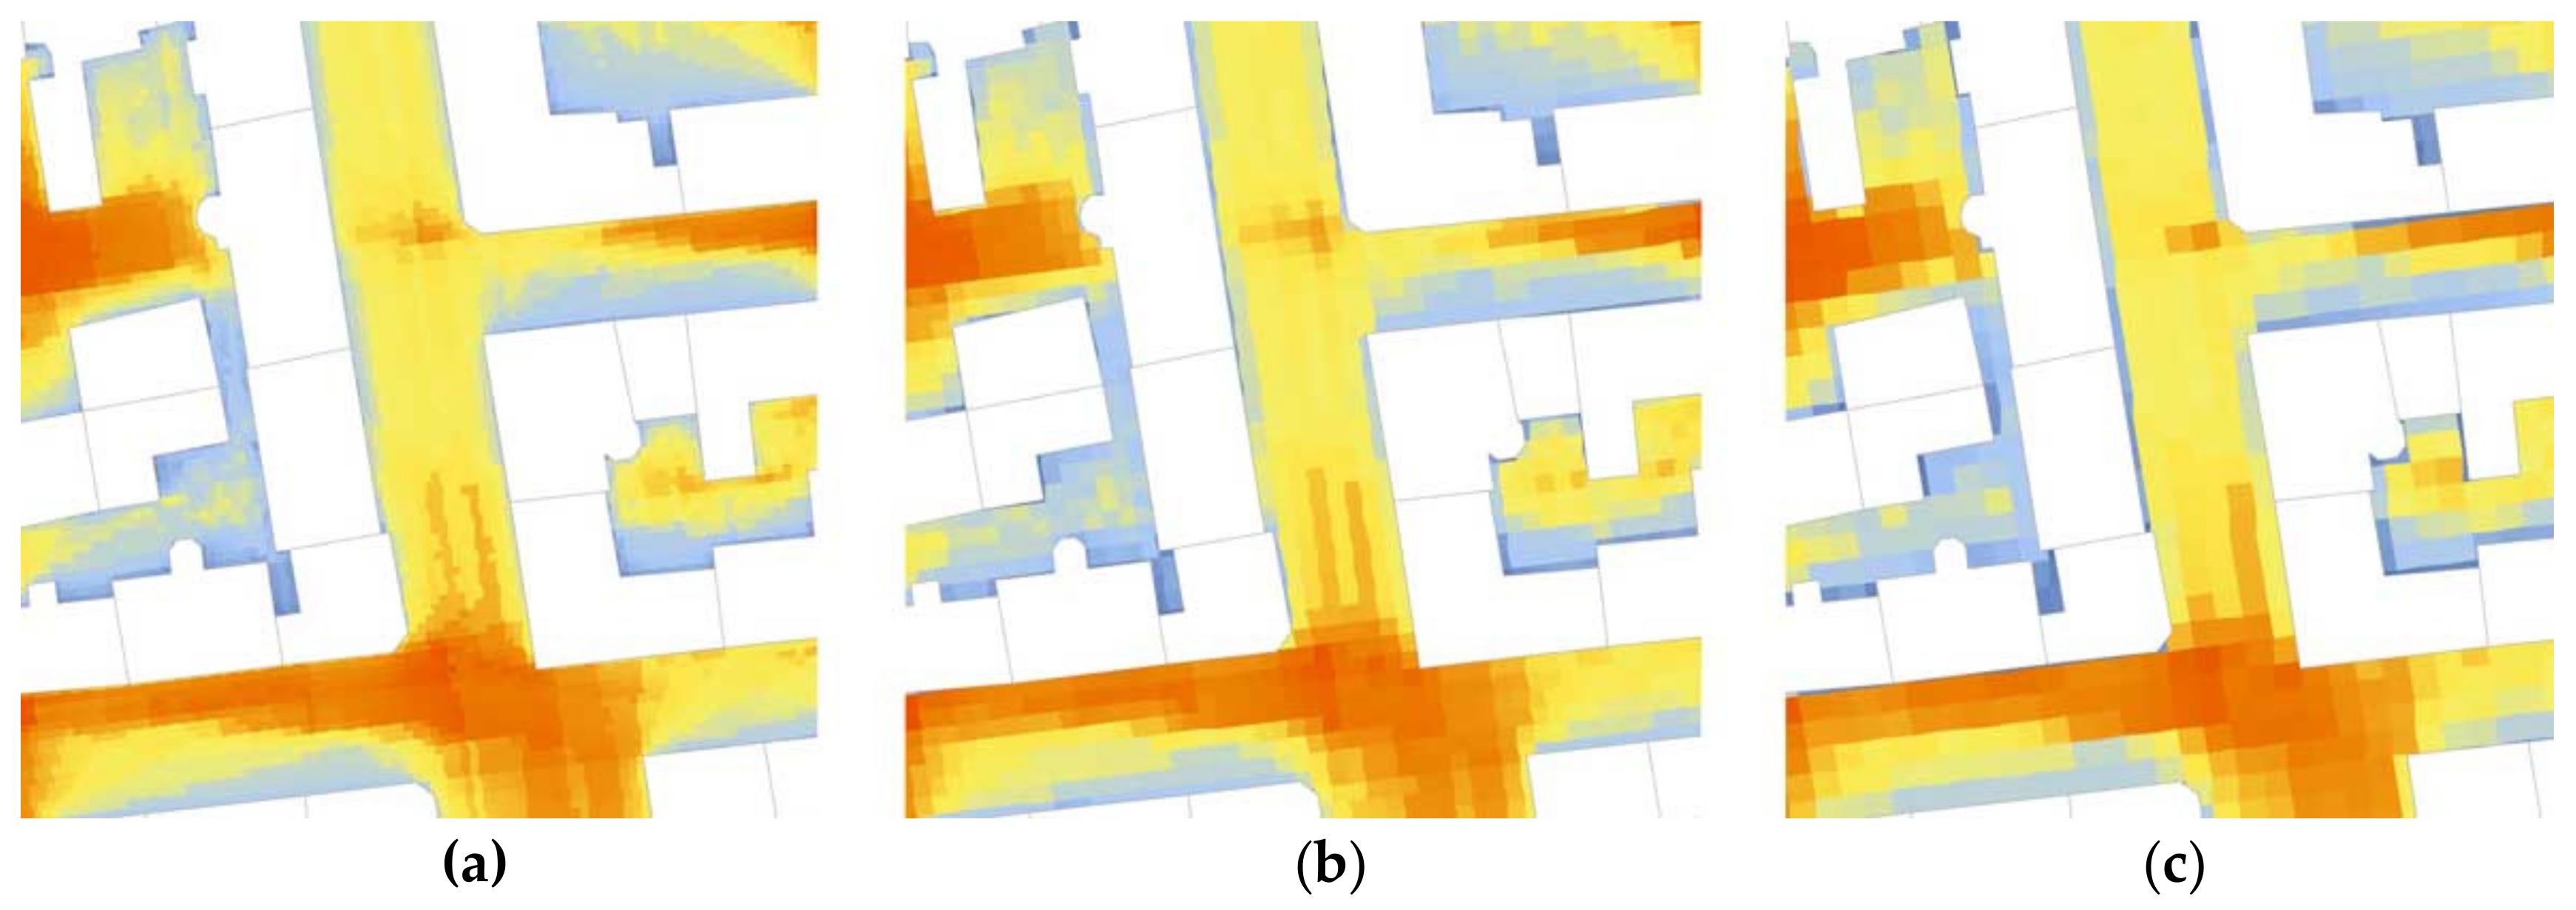
With all the HB zones in place, we proceeded with the sky view factor analysis. This step considers the generation of a ground surface mesh with 3-meter grid spacing and center points, for which the thermal map would be later computed. A sensitivity analysis of the grid size was also conducted to find the most optimal mashing option. In this regard, three different grid sizes; 1 × 1, 2 × 2 and 3 × 3 meters were generated and tested (see Figure 4). The results suggested little difference between the outputs (see Table 3). Due to the higher computation time of the high-resolution mashing option, 3-meter grid size was selected for the further analyses.
Subsequently, sky view factors from each point are estimated as ratio of visible sky compared to open landscape with 100% sky view from each mesh point due to the obstructions by the surrounding context (buildings and trees), which allows for the estimation of the amount of direct solar radiation reaching the ground. This is, likewise, the most computationally intensive step of the microclimatic simulation. Trees are converted into context shading geometries. They are assigned a transpiration schedule and a transparency value of 20% to emulate the foliage structure of a medium density tree canopy, which allows the sunlight to partially pass through the tree crown to the ground.
In order to carry out the energy simulation, HB zones are first converted into an IDF file format (Intermediate Data Format), so as to be compatible with and further facilitate the run through the HB component connecting to the EnergyPlus software. The energy simulation was conducted using the same weather file representing a typical reference year for Vienna, as used for the radiation analysis. The reference period envisioned for the simulation run was from 10th to 12th of August, 2018, in order to portray representative boundary conditions of a heat wave in Vienna (see Figure 7). The output of the EnergyPlus component is further fed into a comfort assessment HB component (adaptive comfort analysis recipe), which allows for the calculation of the thermal map using the Microclimate Map Analysis HB component. The result is a matrix containing the values of the desired thermal comfort indices (e.g., MRT, UTCI, PET) allowing to map the comfort values onto each grid point of the ground surface mesh generated in the previous step. In this study, the respective results from both pre- and post-densification scenario were analyzed by computing the MRT averaged over a 24-hour cycle and differentiated into day- and night-time shares.
3. Results and Discussion
3.1. Implications of Urban Densification for Morphology and Solar Access at Ground Surface Level
Numeric indicators describing changes in physical environment, specifically the urban morphology changes through densification, are presented in Table 4. It can be observed that the increase of the average building height by 2.7 meters resulted in increased building volume and a lower sky view factor (SVF). The maximum considered extension is 17 meters. Below we discuss how these issues affect solar radiation, energy balance and cooling regime during a summer heat wave in the investigated urban domain.
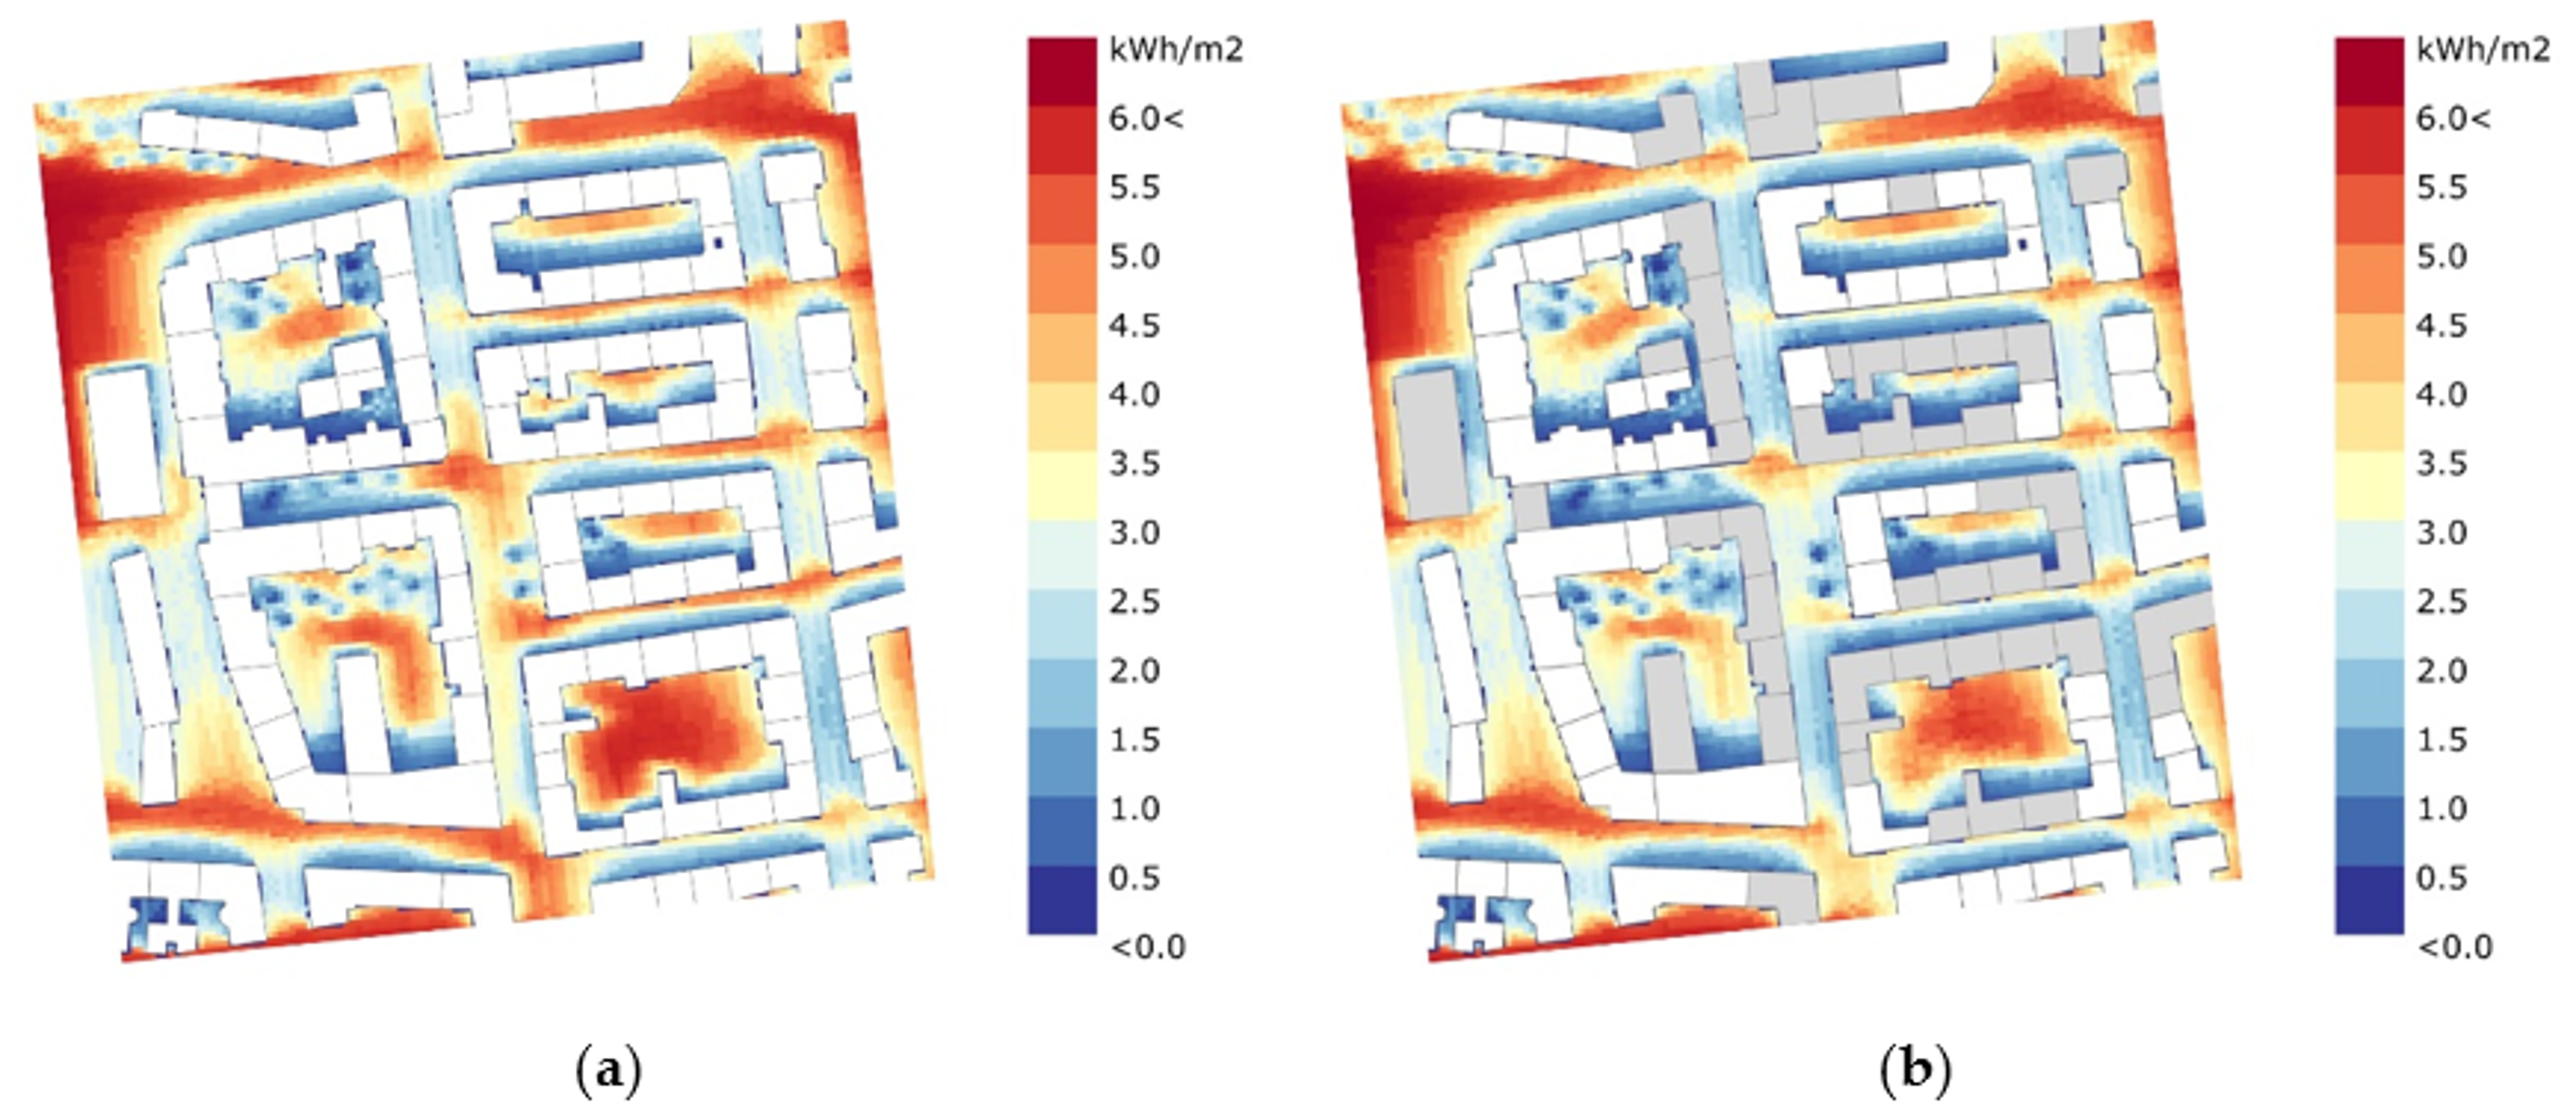
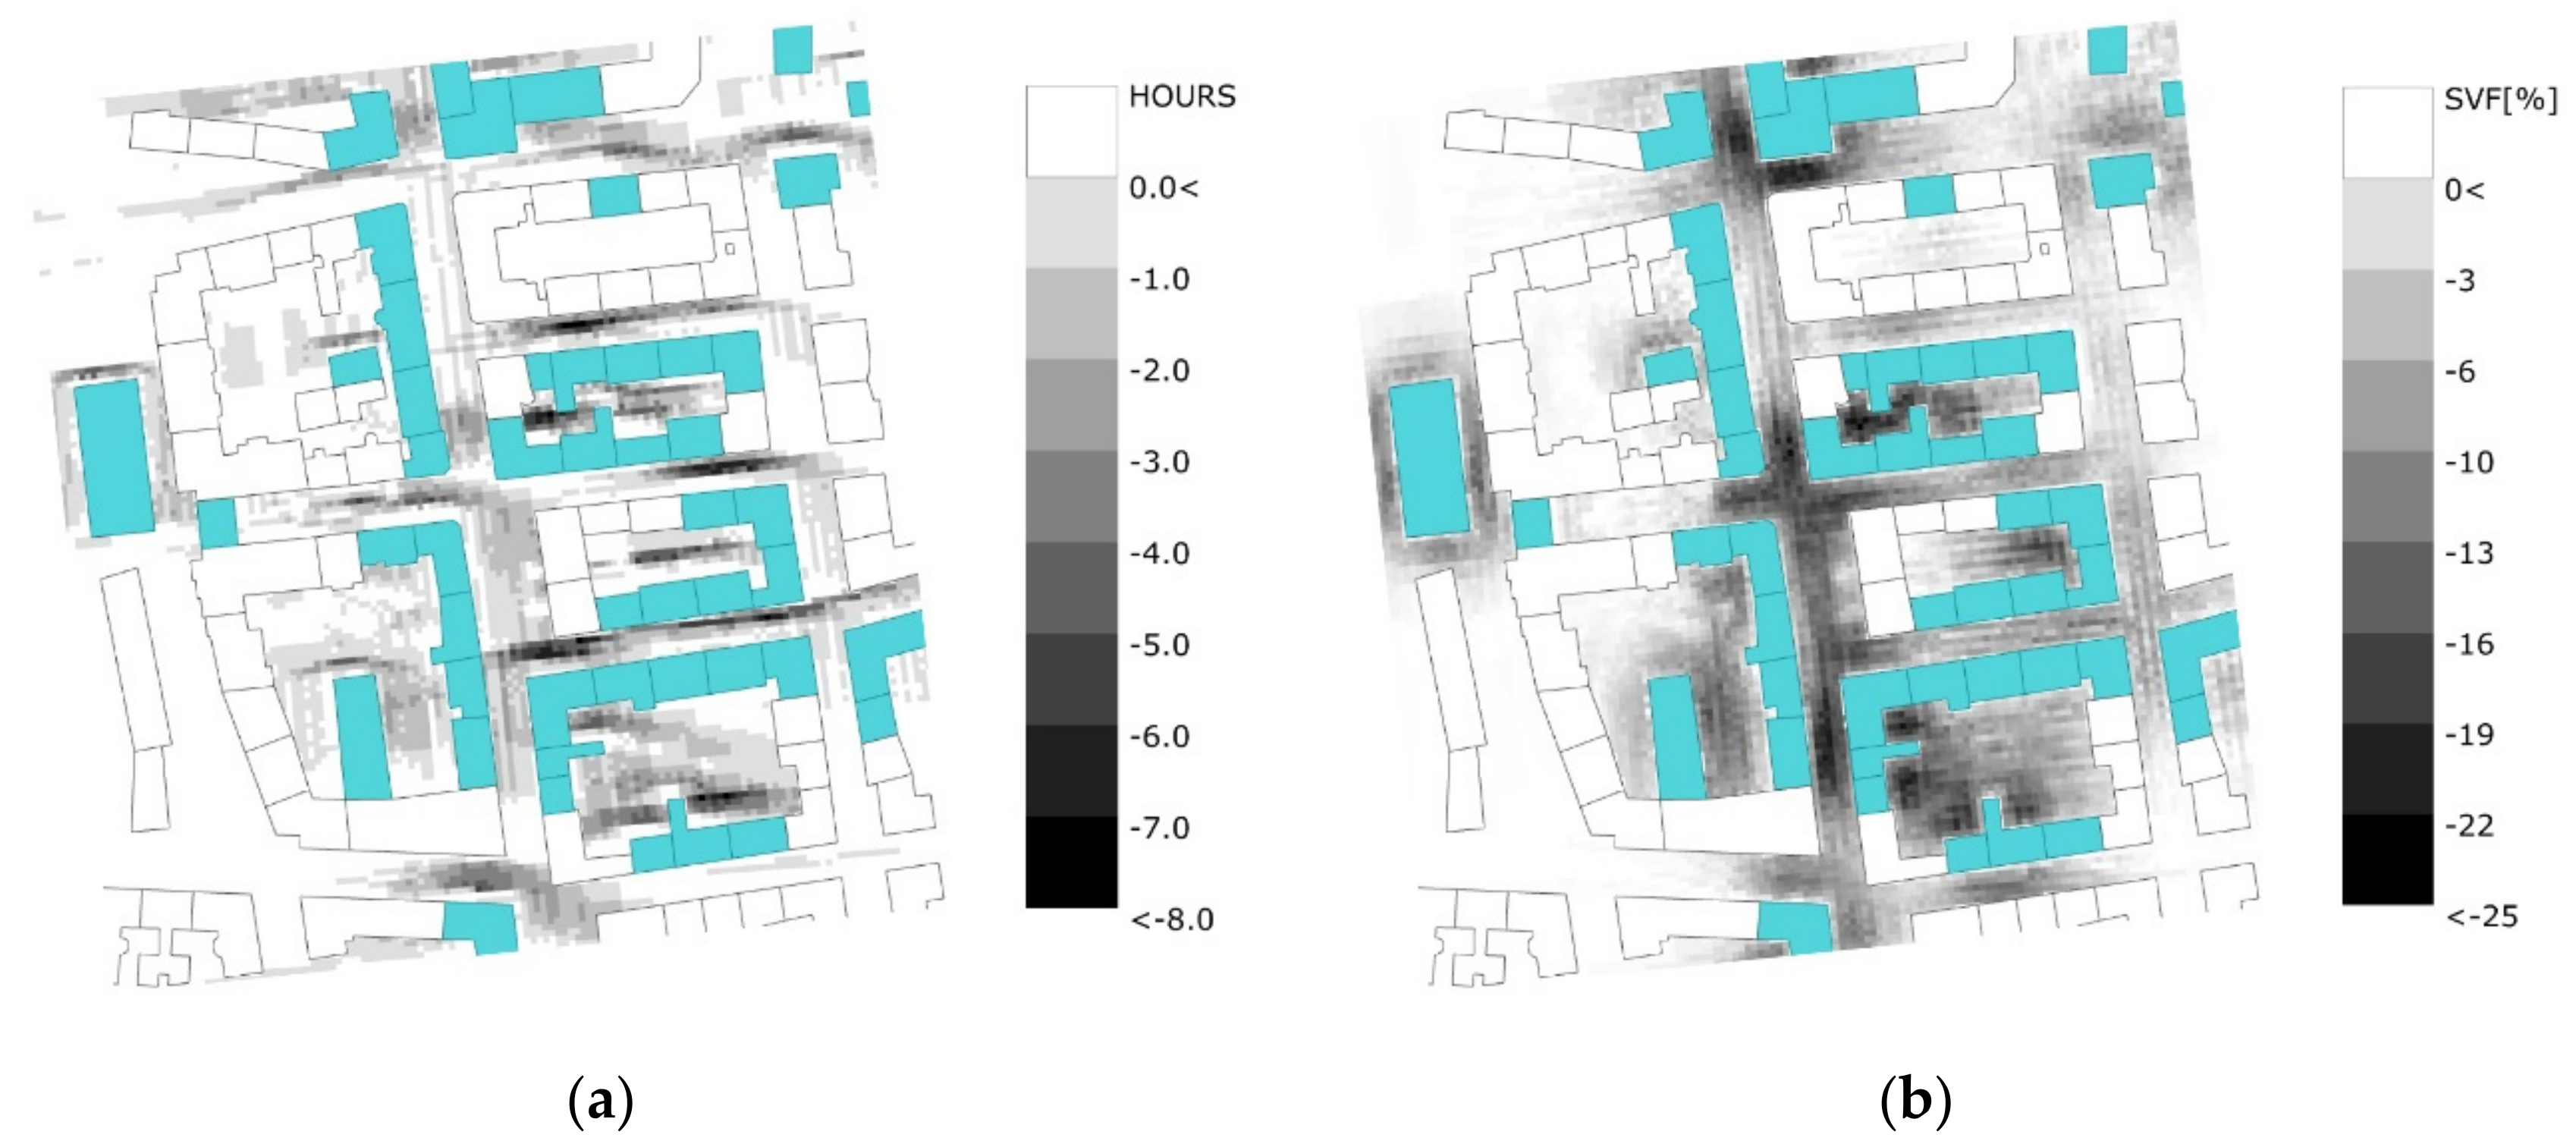
Figure 5 illustrates, for a hot summer reference day, the total radiation reaching the ground surface, expressed in kWh/m2, for both pre- (Figure 5a) and post-densification (Figure 5b) scenarios. The results demonstrate notable potential for obstruction to solar access introduced by higher buildings, resulting from vertical densification (Figure 5b). This is consequently expected to lower the amount of energy absorbed by the ground surface, resulting in less heat for re-emission back into the atmosphere from the ground. In turn, this may lower the summertime ambient air temperature and lessen the thermal discomfort in outdoor environments. The results further suggest that the energy differences between the scenarios may reach 6 kWh/m2. This is representative of the total incoming solar energy averaged over a single hour. This is especially evident in narrow urban street canyons in the middle of the study area, which also suggests a reduced amount of sunlight hours within the street canyons throughout the day. This can be further supported by Figure 6a, depicting the number of hours of direct sunlight reaching the ground plane. To make the analysis more comprehensive, we computed a difference map, subtracting the base case from the densification scenario. Corresponding to the outputs from the radiation study, the urban canyons have of up to 8 hours less of direct sunlight, resulting in cooler local surroundings throughout the day.
However, the increased density of urban fabric may affect the night-time cooling potential of the area due to the lower SVF (see Table 4), as shown in the SVF difference map, comparing the base case and densification scenario (Figure 6b). As expected, the SVF is indeed affected by the taller buildings, whereby the obstruction ratio may increase up to 25%. This may result in prolonged warmer nights, due to the longer period needed for the absorbed heat to dissipate into the atmosphere, due to the more complex and longer pathways to the open sky, leading to less efficient heat loss by radiative cooling.
3.2. Implications of Urban Densification for Microclimate at Ground Surface Level
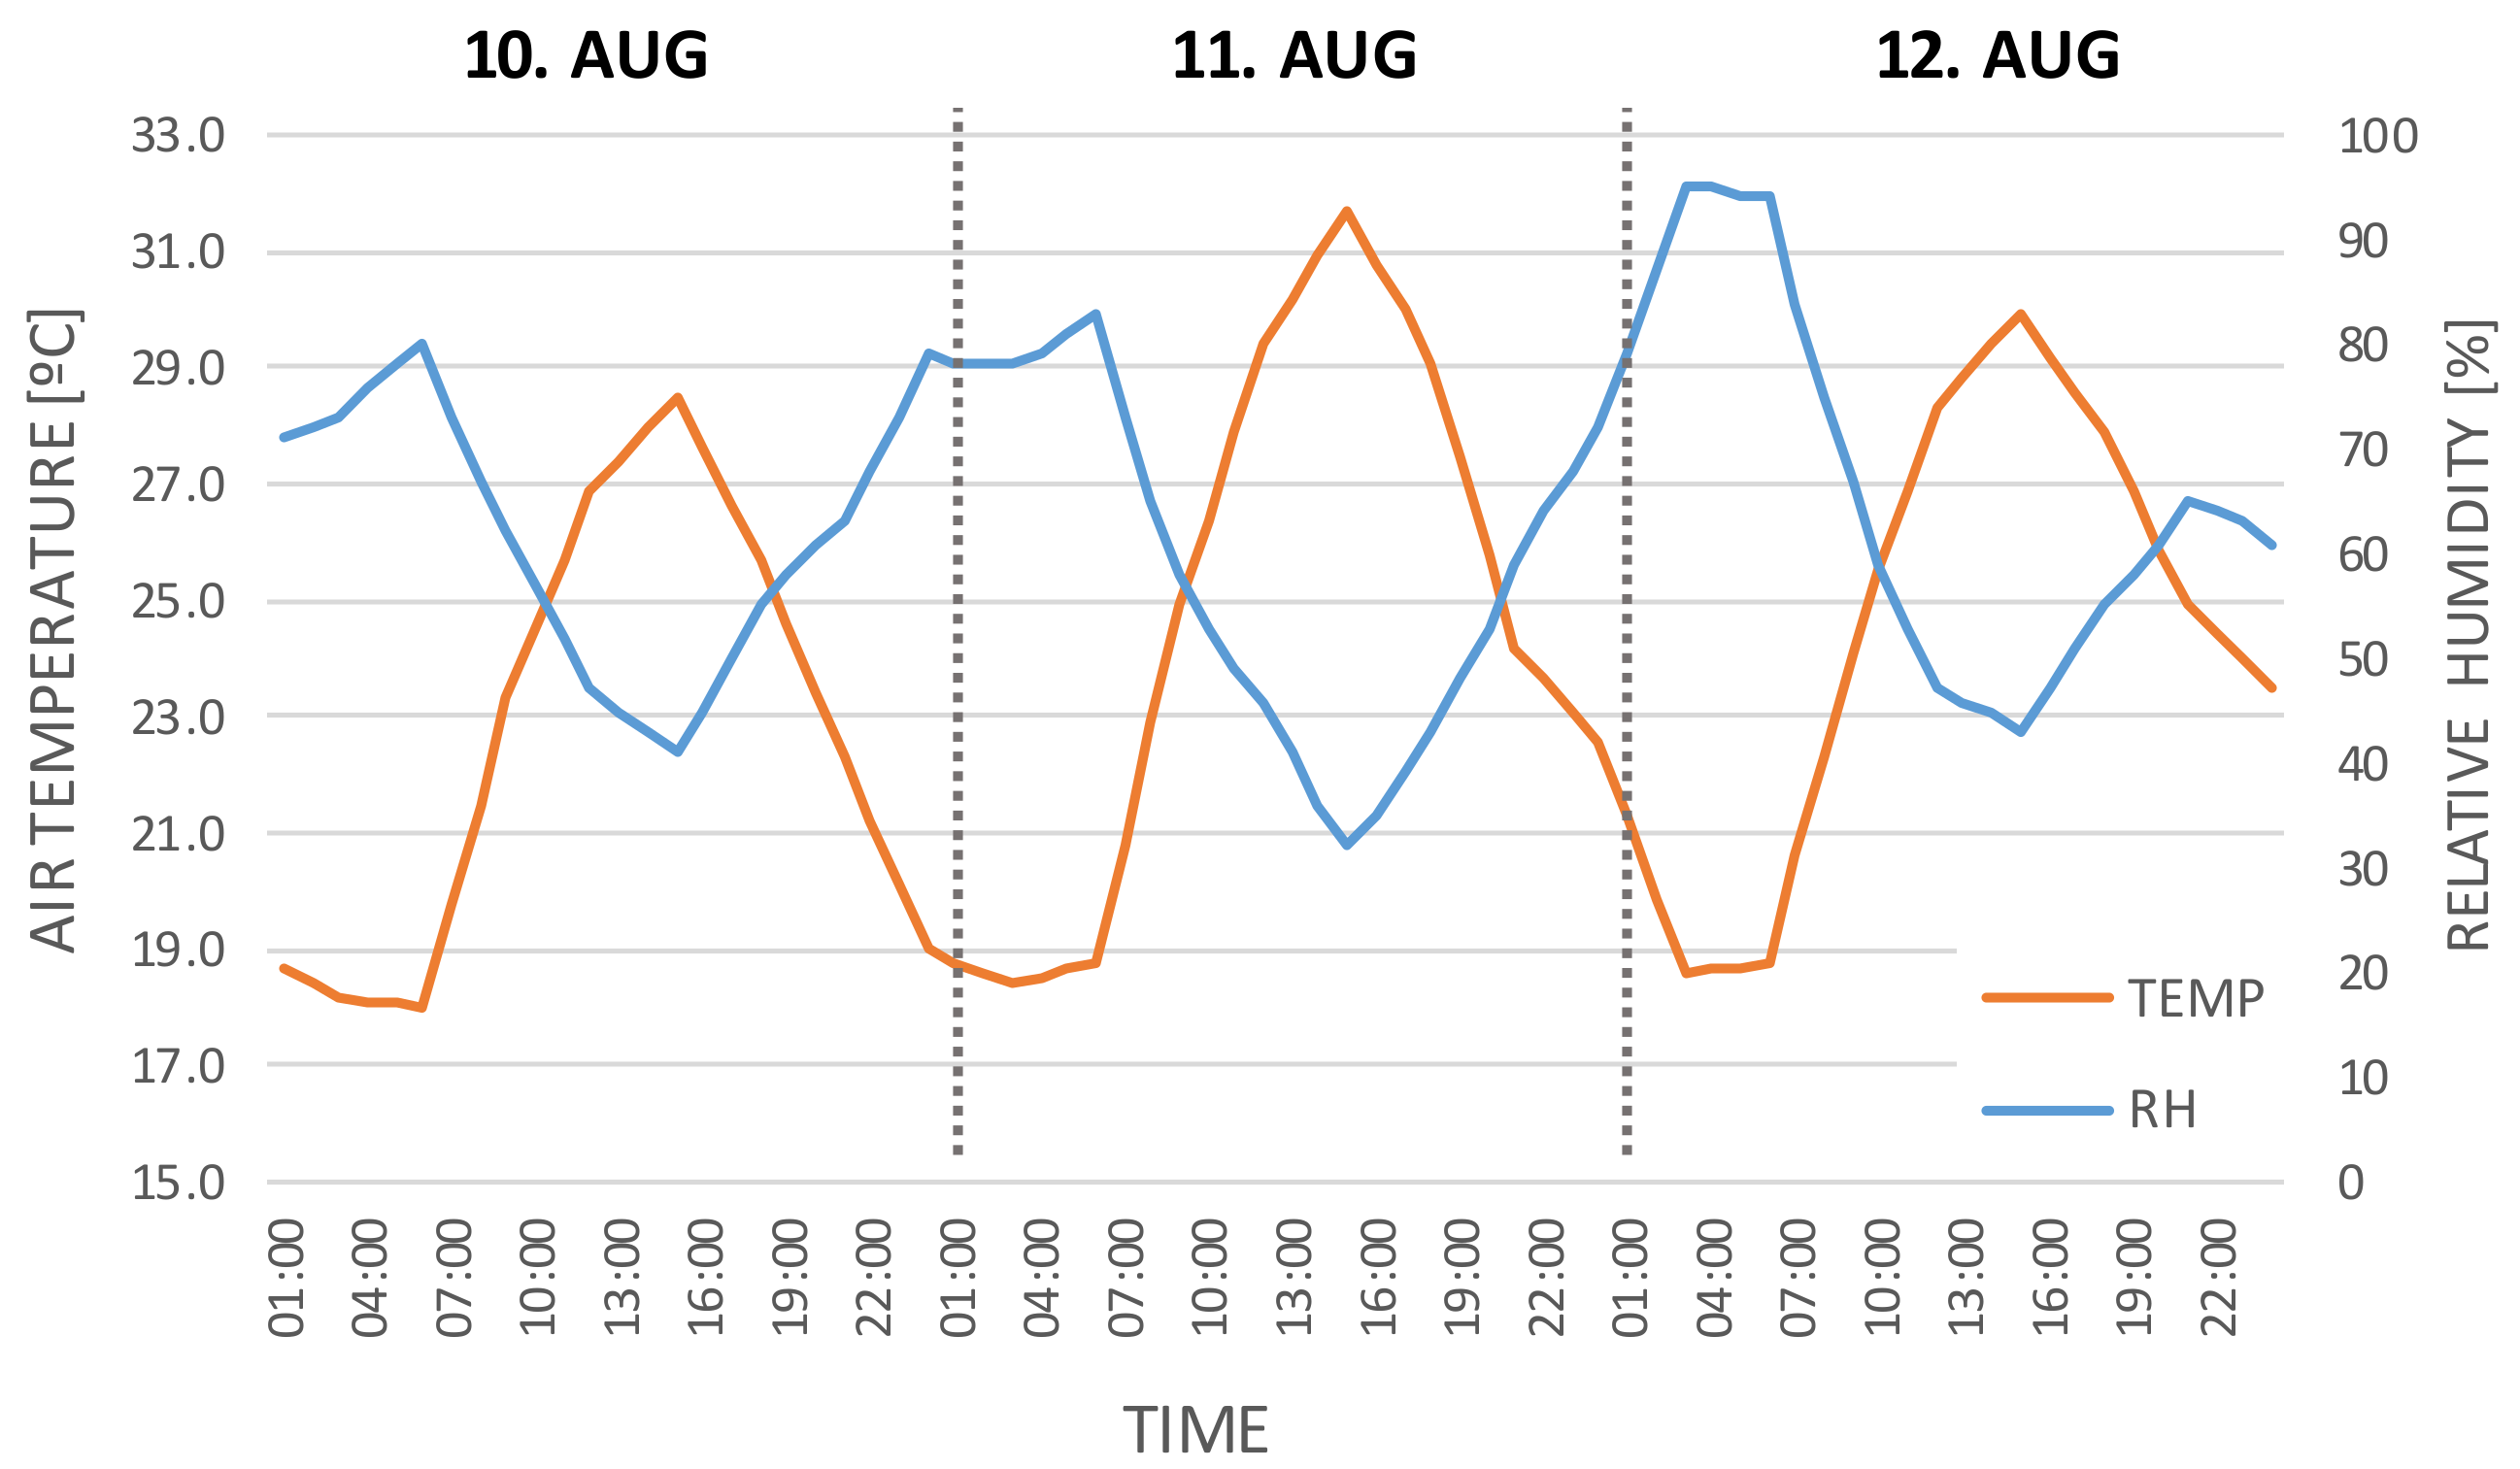
Figure 7 shows the diurnal variation of air temperature and relative humidity for the reference summer period (10th to 12th of August, 2018). Table 5 outlines the general weather statistics for the same period. As mentioned before, the selected period represents a unique combination of weather conditions for a continuous hot summer period (high daily temperature, cloud-free and low wind conditions). Accordingly, we investigated the resulting MRT values for different shares (average, daytime, night-time) of this interval.
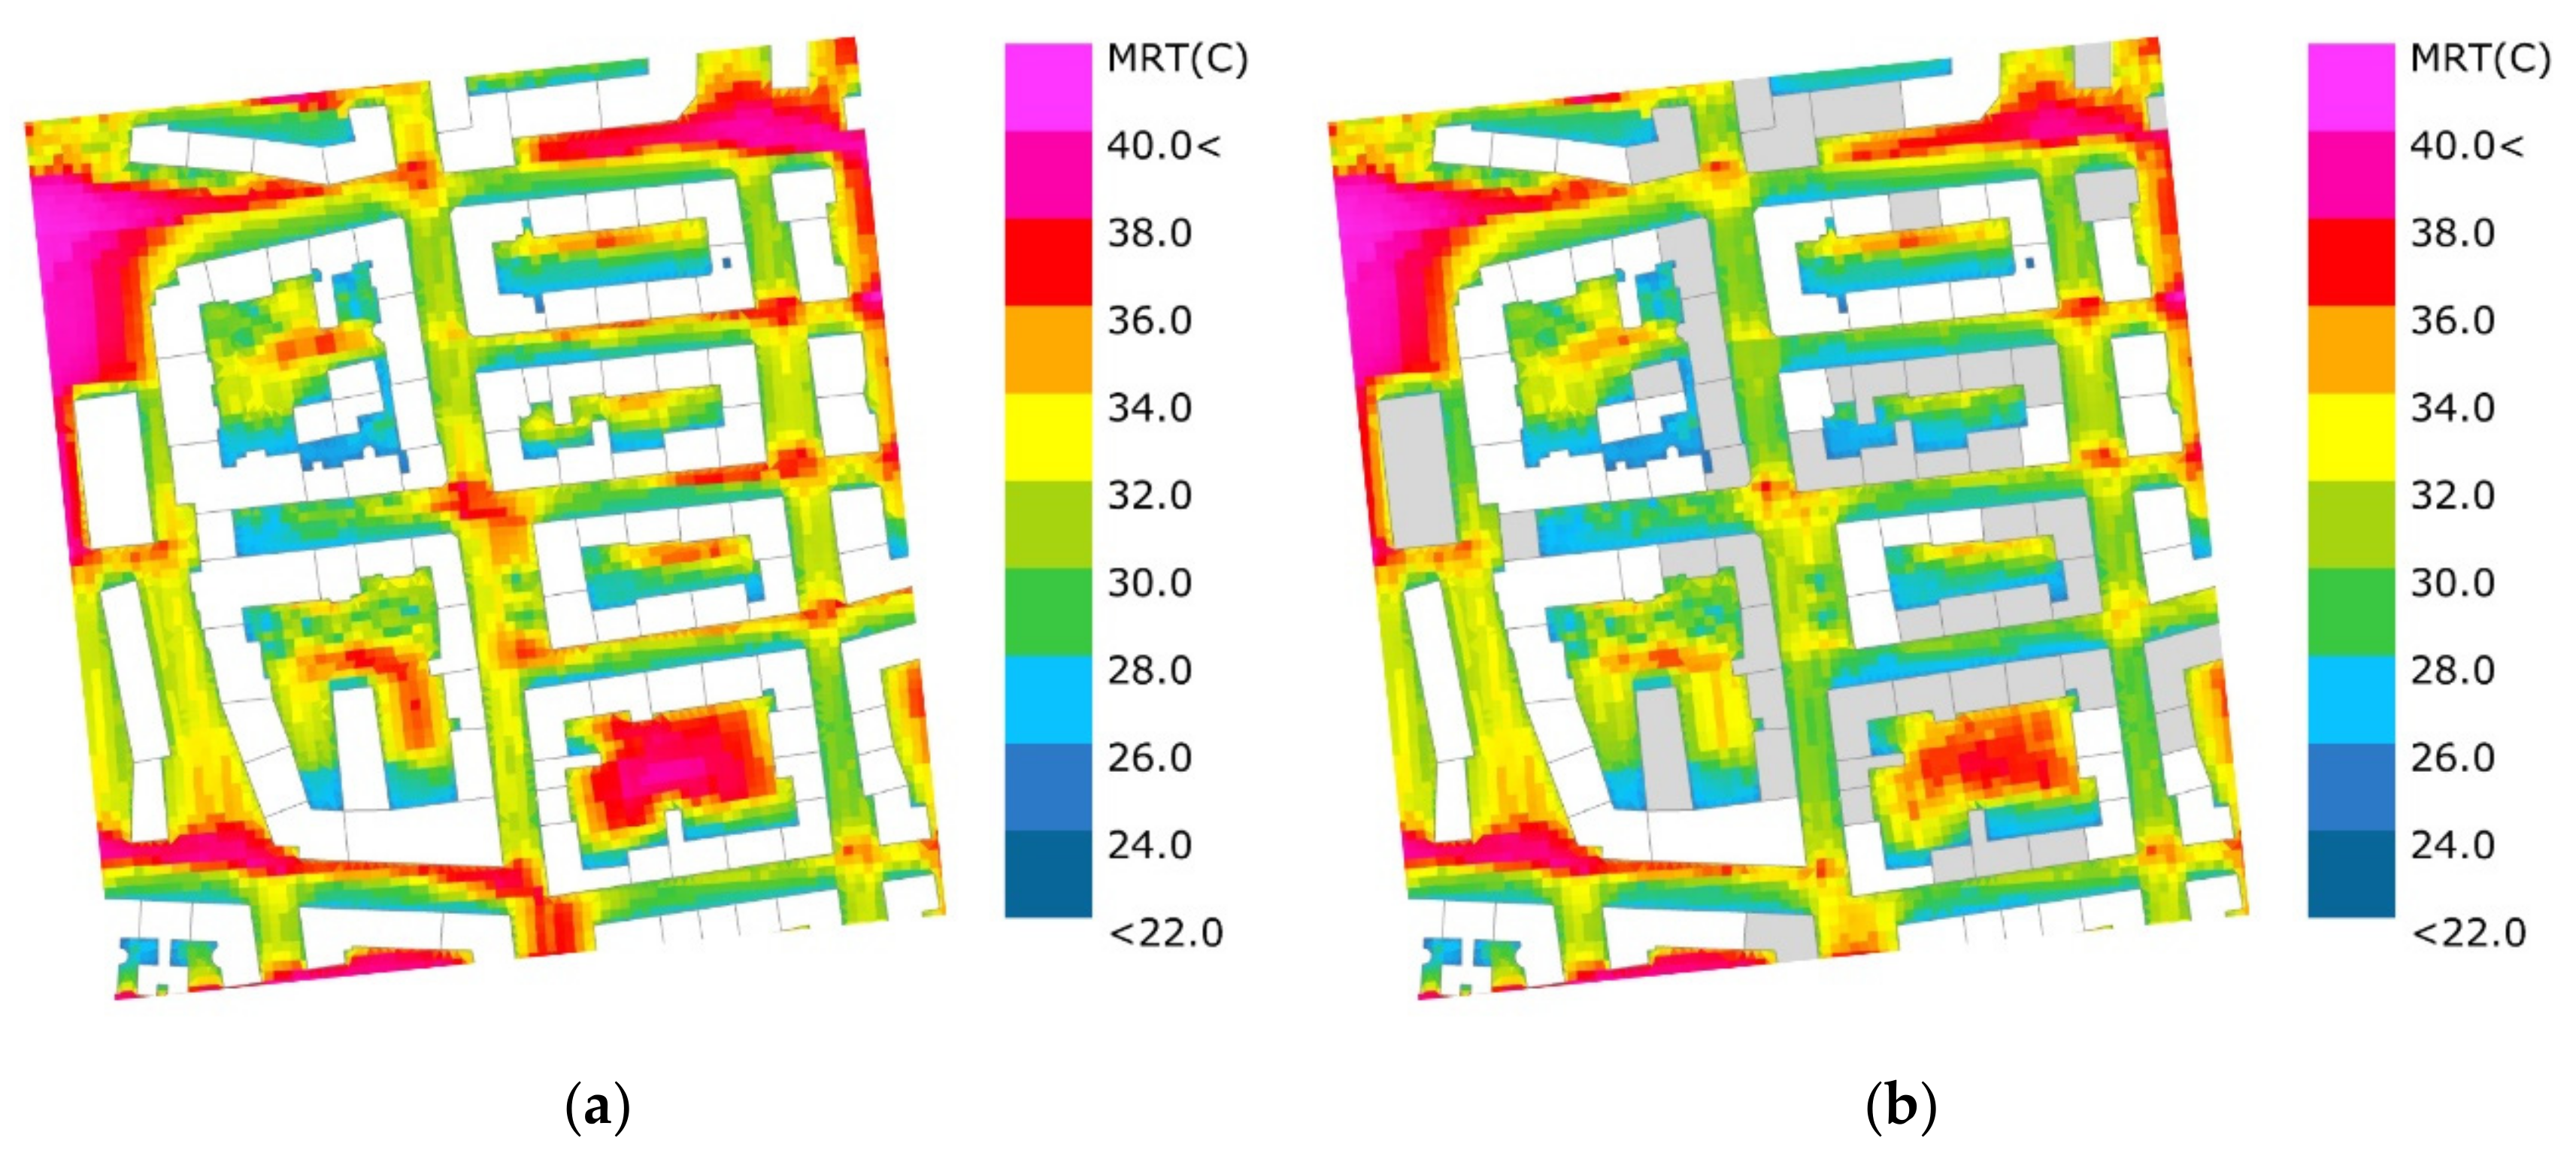
Figure 7 illustrates the spatial distribution of hourly MRT values at the ground surface, for both scenarios, averaged over a 24 hour-period, starting from 7 o’clock in the morning on 11th of August, 2018. It can be observed that, due to the previously mentioned shadowing effect of taller buildings, the average exchange of radiative energy is relatively reduced as the incoming radiative flux is now impeded by “deeper” urban street canyons. However, the extent of this effect may be driven by the orientation of the urban canyons relative to the sun path. In general, these circumstances may lead to a formation of a daytime cooling effect in lower levels of the street canyons, especially if the building height is increased on both sides of urban canyons (see Figure 8b). It should be noted that, in cases when the building is extended on both sides of the urban canyon, the shadow of the opposite building may reach only the part of the façade surfaces of the lower floors facing the streets. The upper floors are still exposed to incoming short-wave radiation; thus, the same amount of energy is stored in the upper levels of the building mass.
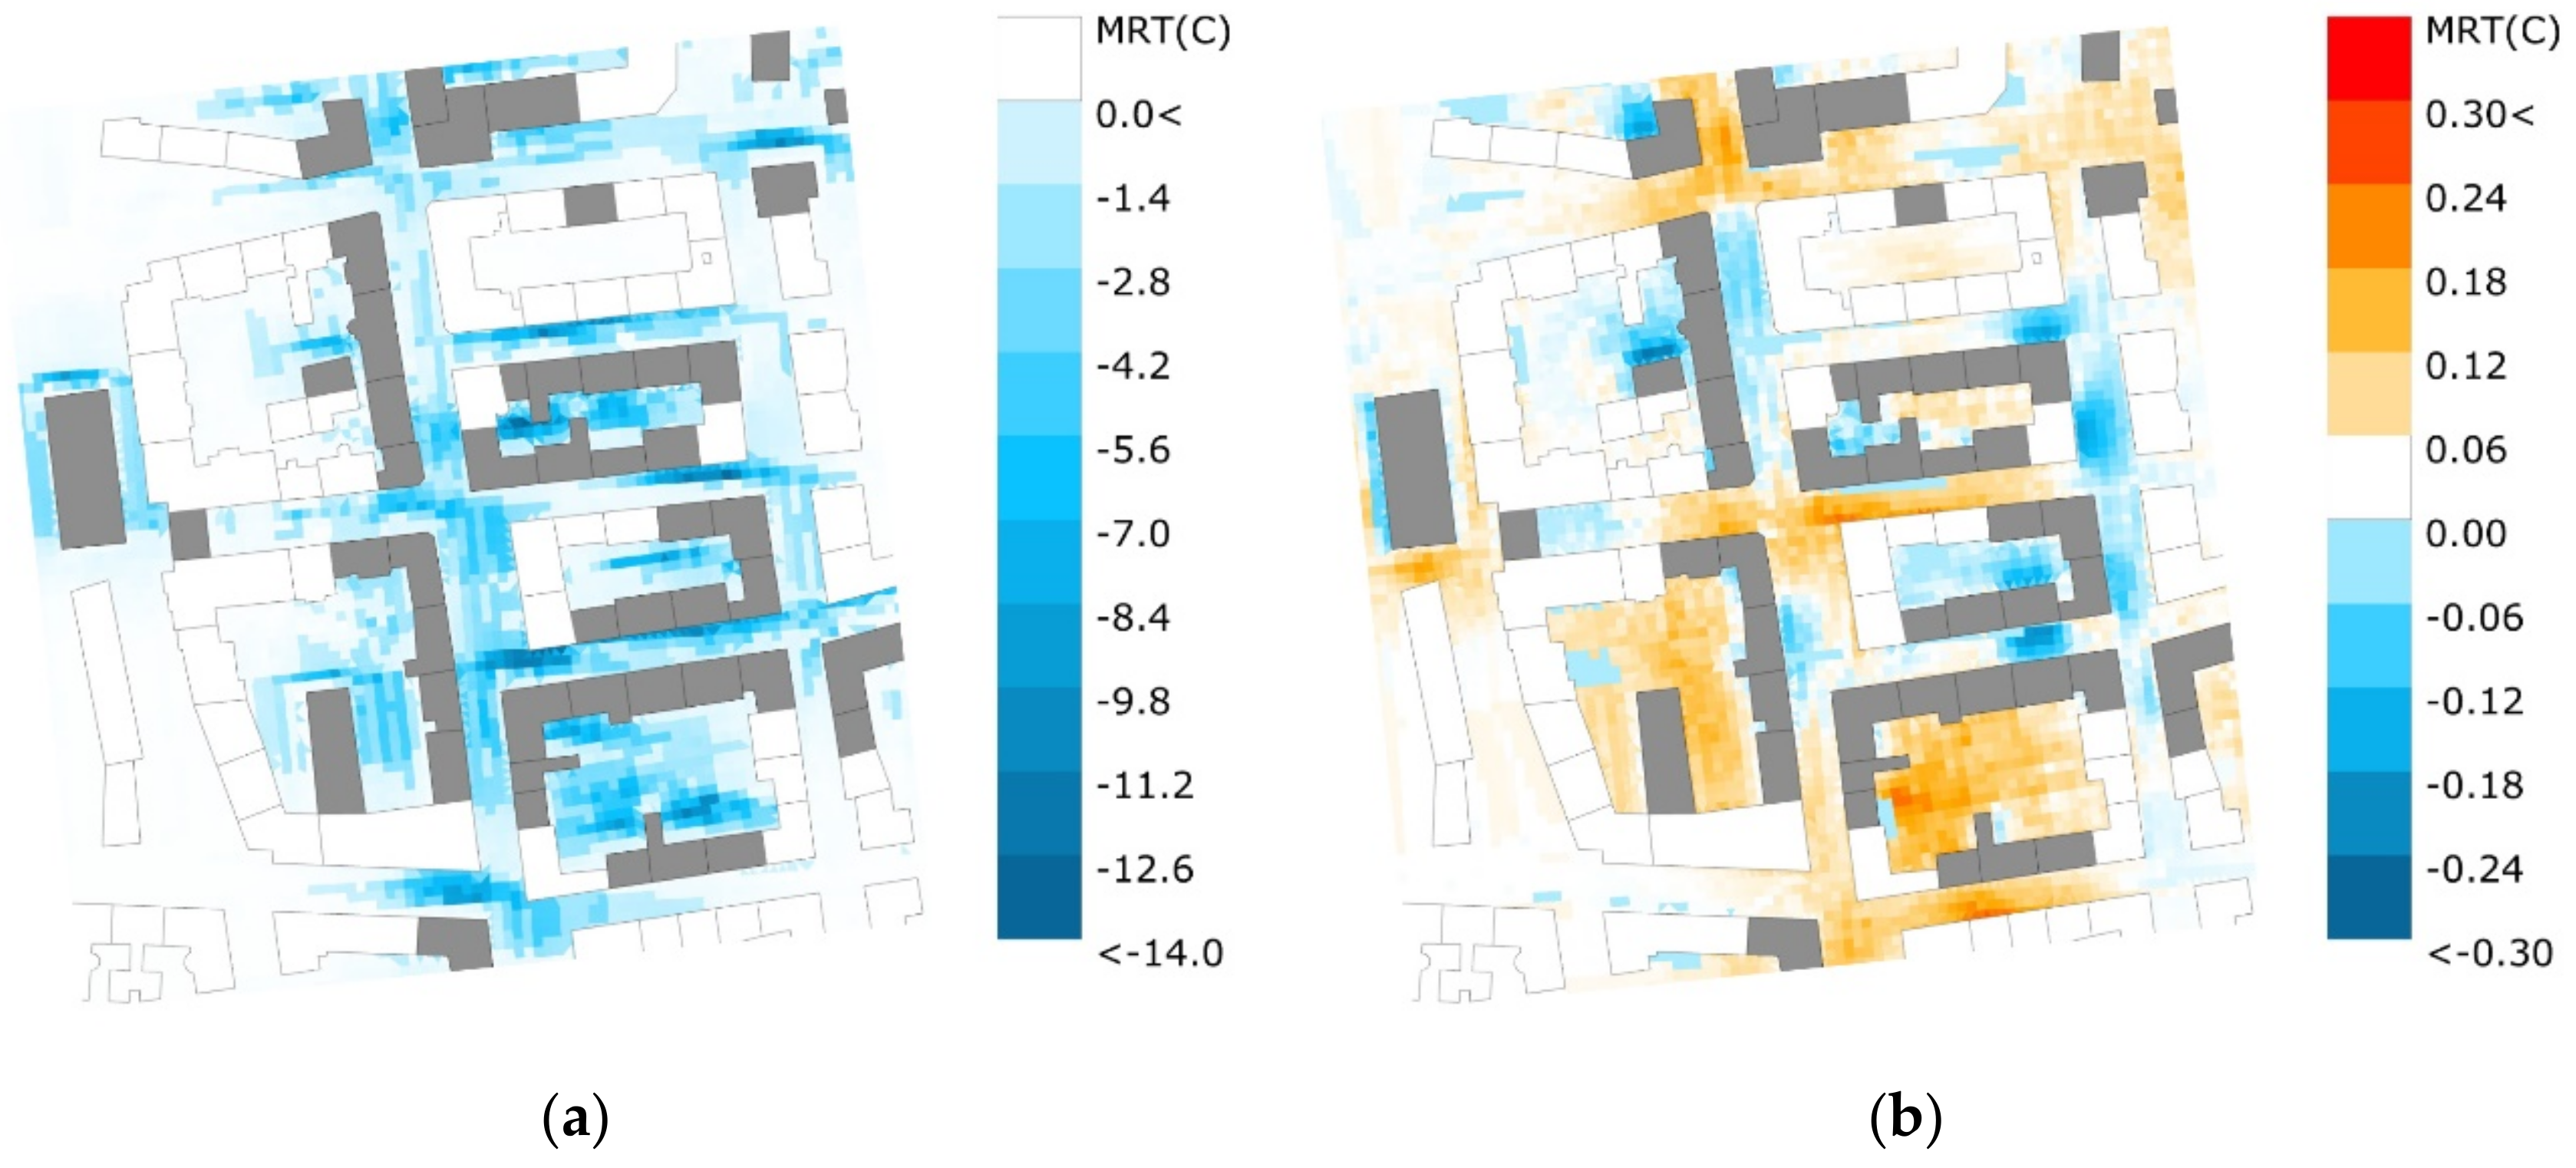
To investigate the different daytime and night-time thermal performance, MRT difference maps were generated for day and night periods. Night-time effects were examined individually, because nocturnal cooling is an important issue supporting human wellbeing. For a 12-h day period starting from 07:00 AM on the 11th of August, 2018 (Figure 9a), a significant cooling effect was noted, reaching up to 14.5 °C at the ground surface level once densification is introduced. Consistent with previous observations, the effect seems to be more pronounced in those areas where the densification of the existing building volumes is considered for both urban canyon walls. The noted cooling effect seems also to be spatially clustered around the buildings that are planned to be extended.
The night-time MRT difference map, illustrated in Figure 9b, shows both cooling and heating effects at the ground surface area, ranging from −0.3°C to +0.3 °C. The data was generated for a 12-hour period starting from 07:00 PM on the 11th of August, 2018. The night-time ambient heating effect modelled for the ground surface level may be attributed to the dissipated heat from the building envelopes, which grew in extent due to the densification. This effect usually starts several hours after sunset. Additionally, the reduced SVF, caused by the higher buildings, hinders the cooling regime of the domain. Looking at the magnitude of ∆MRT, it can be observed that the night-time effect (both heating and cooling) is of a lesser intensity than the daytime MRT differences, stressing the important and overall beneficial role of solar shading by urban geometry, which generally results in cooler environments, at least at the surface level.
However, for the elevated rooftop areas, the densification may have the opposite effect: more rooftops of originally lower buildings are exposed to sunlight instead of being shaded from neighboring higher buildings.
4. Conclusions
We presented the results of a project that investigates the impact of urban densification with respect to heat island effects and outdoor thermal conditions during a hot summer period. The study was conducted for an urban sample area in the city of Vienna, Austria. The resulting implications of assumed densifications were investigated within the context of MRT.
The main conclusions concerning the ground level area may be summarized as follows:
In general, the results suggest a notable potential for obstruction to solar access introduced by taller buildings, resulting from vertical densification. Consequently, the overall amount of incoming radiation reaching the urban street canyon surface is reduced, leading to an hourly reduction of up to 6 kWh energy absorbed per m2 ground surface area. Likewise, the number of sunlight hours available in urban street canyons decreased for up to 4 hours on average within newly formed deep urban street canyons, leading to thermally comfortable urban environments during hot summer days. The simulated cooling effect (at the surface level) seems to be more pronounced in those instances where the building height is increased on both sides of the urban street canyon.
The deviations in mean daytime MRT supports the findings discussed above, as an overall reduction of 14.5 °C in daytime MRT at ground level between the scenarios was observed. This is mainly driven by the fact that a large amount of radiation is blocked by taller urban structures, resulting in reduced net exchange of radiant energy. In a comparable study done by Williamson et al. [28], the role of deep urban canyons in the development of daytime cool islands was further highlighted, due to mutual shadowing by neighboring buildings and overall less radiant exposure of ground surface. However, they also raised the concern regarding the possible stronger heat islands during the night-time due to lower SVF.
The deviation in pre- and post-densification night-time MRT revealed both cooling and heating tendencies within the study area at ground levels after densification is applied. Heating tendencies may be explained by more building mass and an overall higher energy uptake. However, as the total energy gain from solar radiation is reduced due to shading, the energy available for absorption by building surfaces is equally affected. This may result in less heat being stored in the opaque building surface materials closer to the ground during the day and equally less net energy being transferred to other systems during the night-time.
5. Ongoing Work
The presented study is limited in scope. The objective was namely to explore the differences in radiative heat budget and heat exchange within an urban area without and with densification. Therefore, we investigated the morphological and microclimatic changes by the means of SVF, solar irradiance and MRT. However, as newly generated tall buildings are also expected to affect wind patterns in the area, our current ongoing activity involves the investigation of this effect. First explorations have already shown a reduction of wind speed due to higher surface roughness, which is currently not reflected by the typical weather files.
It should also be noted that, due to inherit limitations of the toolset used, the evaporative cooling of vegetation is considered to a lesser extent, which is an issue that should be improved. Currently, only the transpiration schedule is assigned, as defined by EnergyPlus schedules, which considers a simplified estimate of tree canopy transpiration rate based on atmospheric factors. This schedule considers around 20% water content return from the tree, which was modelled as a solid structure able to take in the moisture, into the surrounding air.
Furthermore, as the outcome of presented study aims to support decision making and inform urban planning practices toward climate-sensitive approach to urban transformation of existing urban areas (with focus on urban densification), workshops with stakeholders and policy makers are currently being held. The needs, potentials and challenges of such an approach to urban development are discussed and will serve as a starting point in developing guidelines and regulations for future applications.
Author Contributions
Writing—original draft preparation, M.V.; writing—review and editing, W.L., T.T. and R.S.; visualization, M.V.
Funding
This research was funded within the framework of the Austrian Climate Research Program (ACRP), which provides grant fnds for climate impact research.
Conflicts of Interest
The authors declare no conflict of interest.
References
- United Nations, Department of Economic and Social Affairs, Population Division. World Population Prospects: The 2015 Revision, Key Findings and Advance Tables; Working Paper No. ESA/P/WP.241; United Nations: New York, NY, USA, 2015. [Google Scholar]
- Wilson, B.; Chakraborty, A. The Environmental Impacts of Sprawl. Sustainability 2013, 5, 3302–3327. [Google Scholar] [CrossRef]
- Ryu, Y.H.; Baik, J.J.; Lee, S.H. Effects of anthropogenic heat on ozone air quality in a megacity. Atmos. Environ. 2013, 80, 20–30. [Google Scholar] [CrossRef]
- Krpo, A.; Salamanca, F.; Martilli, A.; Clappier, A. On the Impact of Anthropogenic Heat Fluxes on the Urban Boundary Layer: A Two-Dimensional Numerical Study. Bound. Layer Meteorol. 2010, 136, 105–127. [Google Scholar] [CrossRef]
- Rinner, C.; Hussain, M. Toronto’s Urban Heat Island—Exploring the Relationship between Land Use and Surface Temperature. Remote Sens. 2011, 3, 1251–1265. [Google Scholar] [CrossRef]
- Holm, S.M.; Balmes, J.R.; Roy, A. Human Health Effects of Ozone: The State of Evidence Since EPA’s Last Integrated Science Assessment; Environmental Defense Fund: New York, NY, USA, 2018. [Google Scholar]
- Icaza, L.E.; van der Hoeven, F. Regionalist Principles to Reduce the Urban Heat Island Effect. Sustainability 2017, 9, 677. [Google Scholar] [CrossRef]
- Hanák, T.; Marović, I.; Aigel, P. Perception of Residential Environment in Cities: A Comparative Study. Procedia Eng. 2015, 117, 495–501. [Google Scholar] [CrossRef] [Green Version]
- Mahmuda, S.; Webb, R. Climate adaptation and urban planning for heat islands: A case study of the Australian Capital Territory. Aust. Plan. 2016, 53, 127–142. [Google Scholar] [CrossRef]
- Rosenzweig, C.; Solecki, W.; Hammer, S.A.; Mehrotra, S. Cities lead the way in climate-change action. Nature 2010, 467, 909–911. [Google Scholar] [CrossRef] [PubMed]
- Fatone, S.; Conticelli, E.; Tondelli, S. Environmental sustainability and urban densification. WIT Trans. Ecol. Environ. 2012, 155, 217–228. [Google Scholar] [CrossRef]
- Jenks, M.; Burgess, R. Compact Cities: Sustainable Urban Forms for Developing Countries; Spon Press: London, UK; New York, NY, USA, 2000. [Google Scholar]
- CLUDEX. Available online: www.ait.ac.at/en/research-fields/smart-and-resilient-cities/projects/cludex/ (accessed on 2 May 2019).
- Rhino 3D. Available online: www.rhino3d.com/ (accessed on 2 May 2019).
- Stewart, I.D.; Oke, T.R. Local Climate Zones for Urban Temperature Studies. Bull. Am. Meteorol. Soc. 2012, 93, 1879–1900. [Google Scholar] [CrossRef]
- Landesgesetzblatt für Wien. Available online: www.wien.gv.at/recht/landesrecht-wien/landesgesetzblatt/jahrgang/2013/pdf/lg2013046.pdf (accessed on 7 October 2019).
- Loibl, W.; Etminan, G.; Österreicher, D.; Ratheiser, M.; Stollnberger, R.; Tschannett, S.; Tötzer, T.; Vuckovic, M.; Walal, K. Urban Densification and Urban Climate Change–Assessing Interaction through Densification Scenarios and Climate Simulations. In Proceedings of the REAL CORP 2019, Karlsruhe, Germany, 4 April 2019. [Google Scholar]
- Open Data Austria. Available online: www.data.gv.at (accessed on 7 October 2019).
- ArcGIS. Available online: www.arcgis.com/ (accessed on 7 October 2019).
- Tree Cadastre Vienna. Available online: www.data.gv.at/katalog/dataset/c91a4635-8b7d-43fe-9b27-d95dec8392a7 (accessed on 7 October 2019).
- Ladybug Tools. Available online: www.ladybug.tools (accessed on 7 October 2019).
- EnergyPlus. Available online: https://energyplus.net/ (accessed on 7 October 2019).
- Radiance. Available online: www.radiance-online.org (accessed on 7 October 2019).
- THERM. Available online: Windows.lbl.gov/software/therm (accessed on 7 October 2019).
- ASHRAE Standards. Available online: www.ashrae.org/technical-resources/standards-and-guidelines (accessed on 7 October 2019).
- Ideal Air Loads System. Available online: Bigladdersoftware.com/epx/docs/8-0/engineering-reference/page-092.html (accessed on 7 October 2019).
- EnergyPlus Weather. Available online: https://energyplus.net/weather-location/europe_wmo_region_6/AUT//AUT_Vienna.Schwechat.110360_IWEC (accessed on 7 October 2019).
- Williamson, T.J.; Erell, E.; Soebarto, V. Assessing the Error from Failure to Account for Urban Microclimate in Computer Simulation of Building Energy Performance. In Building Simulation 2009, Proceedings of the 11th International IBPSA Conference, Glasgow, Scotland, 27–30 July 2009; pp. 497–504.
Figure 1.
Case study domain in the city of Vienna: (a) position within Vienna’s 12th district Meidling; (b) detail map of the study area (Source: open street map, adapted).
Figure 1.
Case study domain in the city of Vienna: (a) position within Vienna’s 12th district Meidling; (b) detail map of the study area (Source: open street map, adapted).

Figure 2.
3D model of the study domain: (a) base case; (b) densification scenario (depicted in cyan color).
Figure 2.
3D model of the study domain: (a) base case; (b) densification scenario (depicted in cyan color).

Figure 3.
Sun path diagram generated over the study area: (a) top view; (b) perspective.

Figure 4.
Comparison of three different grid sizes: (a) 1 × 1 meters; (b) 2 × 2 meters; (c) 3 × 3 meters.
Figure 4.
Comparison of three different grid sizes: (a) 1 × 1 meters; (b) 2 × 2 meters; (c) 3 × 3 meters.

Figure 5.
Total radiation reaching the ground surface: (a) base case; (b) densification (marked by grey rooftops).
Figure 5.
Total radiation reaching the ground surface: (a) base case; (b) densification (marked by grey rooftops).

Figure 6.
Difference maps: (a) sunlight hours; (b) sky view factor at ground level (densification marked by cyan rooftops).
Figure 6.
Difference maps: (a) sunlight hours; (b) sky view factor at ground level (densification marked by cyan rooftops).

Figure 7.
Hourly distribution of air temperature and relative humidity for the reference summer period (retrieved from the weather file portraying the typical reference year (TRY) representing the year 2018 (source: [27]).
Figure 7.
Hourly distribution of air temperature and relative humidity for the reference summer period (retrieved from the weather file portraying the typical reference year (TRY) representing the year 2018 (source: [27]).

Figure 8.
Spatial distribution of mean hourly MRT at ground level: (a) base case; (b) densification (marked by grey rooftops).
Figure 8.
Spatial distribution of mean hourly MRT at ground level: (a) base case; (b) densification (marked by grey rooftops).

Figure 9.
MRT difference maps generated for a 12-hour period at ground level: (a) day-time; (b) night-time.
Figure 9.
MRT difference maps generated for a 12-hour period at ground level: (a) day-time; (b) night-time.


Table 1.
Overview of considered building construction materials (source: [22]).
Table 1.
Overview of considered building construction materials (source: [22]).
| Construction | Layers with Thickness (from outside layer) | EnergyPlus Material ID | U-Value of Construction [W/m²K] | R-Value of Construction [m²K/W] |
|---|---|---|---|---|
| Wall | 100 mm brick 200 mm heavyweight concrete 50 mm insulation board Wall air space resistance 19 mm gypsum board | M01 M15 I02 F04 G01a | 0.46 | 2.18 |
| Ground Floor | 50 mm insulation board 200 mm heavyweight concrete | I02 M15 | 0.55 | 1.79 |
| Roof | 100 mm lightweight concrete Ceiling air space resistance Acoustic tile | M11 F05 F16 | 1.45 | 0.69 |
Table 2.
Overview of considered ground layers and soil materials (source: [22]).
Table 2.
Overview of considered ground layers and soil materials (source: [22]).
| Construction | Type of Soil | Thermal Conductivity [W/mK] | Density [kg/m3] | Specific Heat Capacity [J/kgK] |
|---|---|---|---|---|
| Impervious Ground Layer | Asphalt | 0.75 | 2110 | 920 |
| Pervious Ground Layer | 0.15 m Grass 0.5 m Dry Soil Layer | - 0.35 | - 500 | - 3000 |
Table 3.
Comparison of computed MRT values for three different grid sizes.
| Grid size [m] | Average MRT [°C] | Maximum MRT [°C] | Minimum MRT [°C] |
|---|---|---|---|
| 1x1 | 29.01 | 39.73 | 21.52 |
| 2x2 | 29.00 | 39.74 | 21.55 |
| 3x3 | 28.99 | 39.69 | 21.62 |
Table 4.
Overview of the location-specific features of the base case and the densification scenario.
Table 4.
Overview of the location-specific features of the base case and the densification scenario.
| Scenario | Average Building Height [m] | Net Building Volume [m3] | SVF 1 [%] |
|---|---|---|---|
| Base case | 14.4 | 480 797.4 | 30 |
| Densification | 17.1 | 559 698.1 | 27 |
1 Sky view factor.
Table 5.
Overview of the weather statistics for the study period in August, 2018. (derived from the same TRY file).
Table 5.
Overview of the weather statistics for the study period in August, 2018. (derived from the same TRY file).
| Day | Maximum Temperature [°C] | Average Temperature [°C] | Average Wind Speed [m/s] | Average Relative Humidity [%] |
|---|---|---|---|---|
| 10th August | 28.5 | 22.7 | 2.1 | 62 |
| 11th August | 31.7 | 24.6 | 2.8 | 60 |
| 12th August | 29.9 | 24.4 | 3.4 | 67 |
© 2019 by the authors. Licensee MDPI, Basel, Switzerland. This article is an open access article distributed under the terms and conditions of the Creative Commons Attribution (CC BY) license (http://creativecommons.org/licenses/by/4.0/).
Share and Cite
MDPI and ACS Style
Vuckovic, M.; Loibl, W.; Tötzer, T.; Stollnberger, R. Potential of Urban Densification to Mitigate the Effects of Heat Island in Vienna, Austria. Environments 2019, 6, 82. https://0-doi-org.brum.beds.ac.uk/10.3390/environments6070082
AMA Style
Vuckovic M, Loibl W, Tötzer T, Stollnberger R. Potential of Urban Densification to Mitigate the Effects of Heat Island in Vienna, Austria. Environments. 2019; 6(7):82. https://0-doi-org.brum.beds.ac.uk/10.3390/environments6070082
Chicago/Turabian StyleVuckovic, Milena, Wolfgang Loibl, Tanja Tötzer, and Romana Stollnberger. 2019. "Potential of Urban Densification to Mitigate the Effects of Heat Island in Vienna, Austria" Environments 6, no. 7: 82. https://0-doi-org.brum.beds.ac.uk/10.3390/environments6070082
Note that from the first issue of 2016, this journal uses article numbers instead of page numbers. See further details here.