Biogas Production from Food Residues—The Role of Trace Metals and Co-Digestion with Primary Sludge


1
Vatten & Miljö i Väst AB, P.O. Box 110, SE-311 22 Falkenberg, Sweden
2
Water Resources Engineering, Lund University, Box 118, 221 00 Lund, Sweden
3
Swedish Centre for Resource Recovery, University of Borås, 501 90 Borås, Sweden
*
Author to whom correspondence should be addressed.
Environments 2020, 7(6), 42; https://0-doi-org.brum.beds.ac.uk/10.3390/environments7060042
Submission received: 8 May 2020
/
Revised: 25 May 2020
/
Accepted: 26 May 2020
/
Published: 29 May 2020
(This article belongs to the Special Issue Wastewater and Solid Waste Treatment)
Abstract
:The majority of municipal Wastewater Treatment Plants (WWTPs) in Sweden produce biogas from sewage sludge. In order to increase the methane production, co-digestion of internal sludge with Organic Fraction of Municipal Solid Waste (OFMSW) might be feasible in the future. The objective of this study was therefore to find a beneficial solution for the utilization of OFMSW at the WWTP in Varberg, Sweden. The effects of co-digesting primary sludge (PS) and OFMSW collected in the municipality, in different mixing ratios, were investigated by semi-continuous anaerobic digestion assays. Furthermore, the effects of the addition of a commercial trace elements mixture solution (CTES), available on the market in Sweden, were also examined. Co-digestion of OFMSW and PS resulted in specific methane yields of 404, 392, and 375 NmL CH4/g volatile solids (VS), obtained during semi-continuous operations of 301, 357 and 385 days, for the reactors fed with OMFSW:PS ratio of 4:1, 3:1, and 1:1, and at maximum organic loading rates (OLRs) achieved of 4.0, 4.0 and 5.0 gVS/L/d, respectively. Furthermore, mono-digestion of OFMSW failed already at OLR of 1.0 gVS/L/d, however, an OLR of 4.0 gVS/L/d could be achieved with addition of 14 µL/g VS Commercial Trace Element Solutions (CTES) leading to 363 mL CH4/g VS methane production. These experiments were running during 411 days. Hence, higher process efficiency was obtained when using co-digestion of OFMSW and PS compared to that of OFMSW in mono-digestion. Co-digestion is a more feasible option where a balanced Carbon/Nitrogen (C/N) ratio and nutrient supply can be maintained.
1. Introduction
Bio-methanation is a complex microbiological process operating in the absence of oxygen, stabilizing organic matter, while producing biogas which is primarily comprised of methane and carbon dioxide [1]. This process, called Anaerobic Digestion (AD), consists of four together-linked degradation steps; hydrolysis, acidogenesis, acetogenesis, and methanogenesis [2], resulting in biogas and decomposed digestate residue as the main products [3]. Several groups of facultative anaerobes and strict anaerobes are taking part in the degradation process of complex organic compounds, and the abundance of macronutrients as well as micronutrients, such as Trace Elements (TEs), are essential for the growth to ensure a stable process with enhanced biogas production [4,5,6]. Investigating the effects of the addition of different TEs and different TE mixtures on the performance of anaerobic digesters has been an important field of studies during the recent years [7]. Many of the TEs are important micronutrients, acting as microbial agents and are crucial co-factors involved in enzymatic activities of acidogenesis and methanogenesis [4,8,9,10]. However, these previous investigations were focusing on the addition of specific TEs, and only a few studies were dealing with the evaluation of Commercial Trace Element Solutions (CTES) [4,8,10,11].
The amount of the Organic Fraction of Municipal Solid Waste (OFMSW), i.e., Food Waste, is increasing globally over the years, making up one of the largest components of waste [12,13,14]. The environmental impact of OFMSW is substantially dependent on the end life treatment of the waste and hence needs to be managed in an environmentally friendly manner. Several end-life treatments have been studied over the years, where from an environmental point of view, the degradation process using AD resulting in biogas production has an advantage over other management strategies, such as landfilling and waste to energy incineration. Keeping organic materials out of the landfills will result in a decrease of overall methane and carbon dioxide emissions otherwise occurring during the decay of organic matter at landfill areas. Moreover, AD is a well-established technology, offering an effective approach for renewable energy production and its by-product, the nutrient rich digestate residue, can be utilized as liquid or fibrous fertilizer [13,15]. Nevertheless, AD treatment of OFMSW in mono-digestion is a challenging task. Several studies have shown that OFMSW is lacking essential TEs, which in turn will limit process performance [16,17] and therefore the addition of TEs has been suggested. Furthermore, OFMSW has a low Carbon/Nitrogen (C/N)-ratio which may lead to nitrogen and ammonia toxicity [18].
In contrast to OFMSW, sewage sludge contains all the essential TEs required for the microorganisms working in the AD process and has a higher C/N-ratio than OFMSW [19,20]. Sewage sludge is already utilized for biogas production at the majority of municipal wastewater treatment plants (WWTPs) in Sweden. Since these anaerobic digesters were built during the 1960s and 1970s, they are usually oversized due to the design for very low organic loading rates (OLRs) and long hydraulic retention time (HRTs) [21]. Due to recent environmental protection and climate change issues, and since OFMSW has a great energy potential, the use of Anaerobic co-Digestion (AcoD) of internal sludge and OFMSW would be a beneficial solution, both environmentally and economically, for the WWTPs [12,14,22]. The municipalities of Varberg and Falkenberg located on the Swedish west coast are collecting OFMSW for biogas production in order to increase their green energy production. In this context the challenge remains in identifying the optimal conditions for the co-digestion of these waste streams.
The aim of this work was therefore to explore different scenarios for redirecting OFMSW into the usual biogas production lines at the WWTP (Getteröverket) in Varberg, Sweden, by performing semi-continues anaerobic digestion experiments. Firstly, the mesophilic AcoD of OFMSW and sewage sludge with different mixing ratios (based on the volatile solids (VS) content) was studied; and secondly the digestion of OFMSW as single substrate was investigated also during semi-continuous operation and with the addition of a CTES, available on the market and already used by several biogas plants in Sweden.
2. Materials and Methods
2.1. Substrate Charactarisation
The two substrates investigated were obtained in Varberg, Sweden: primary sludge (PS) was obtained from the pre-thickener at the WWTP, Getteröverket, and the OFMSW was source-sorted and collected in paper bags by the households in the municipality and then it was transported from the trash cans in every second week. At the WWTP site, samples taken from the OFMSW was manually sorted and weighted in order to determine different fractions in its composition, as animal products, vegetables, fruits as well as dough and carbohydrate-based products. The OFMSW was then blended, aiming to achieve a particle size not larger than one millimeter. This pretreatment made it possible to achieve a fraction easy to handle during the following lab-scale investigations. Moreover, in Sweden the collected OFMSW fractions are usually processed into a slurry, with similar particle size, prior to feeding the full-scale AD reactors. Finally, each substrate fraction was properly mixed before freezing and then stored at minus 20 °C until use.
2.2. Semi-Continuous Trials
The semi-continuous trials were performed to simulate continuous operation of full-scale biogas reactors by using six CSTRs with an active volume of 2-L each and furthermore two CSTRs with an active volume of 5-L each, all obtained from Bioprocess control AB, Sweden. These reactors are highly flexible for both feeding, process monitoring, and control. Moreover, they are made of high-quality glass to allow for visual inspection of foam formation [23].
The pH in the digestate residue obtained from the reactors was recorded daily [24], while the digestate, collected from each semi-continuous trial, was analyzed weekly, regarding volatile solids (VS), total solids (TS), bicarbonate alkalinity (BA), total alkalinity (TA), and volatile fatty acids (VFAs) to follow up process stability. The analyses were conducted on digested sludge samples, which were taken out in line with the feeding procedure.
The methane production from each reactor was monitored continuously with µ-flow on-line instrument (Bioprocess control AB, Sweden). The generated biogas was forced to pass through a separate bottle filled with a solution of 3 M NaOH in order to trap CO2 and H2S before the gas reached the flow-detecting unit. The µ-flow has a linear measurement range between 20 and 4000 NmL/h and works by liquid displacement and buoyancy principle enabling to monitor ultra-low gas flows. It includes real-time temperature and pressure compensation for the normalization of gas flow rate and volume to normal conditions (0 °C and 1 atm) [25]. In some experiments performed later during the study, the produced gas was directly led to the flow detection unit of the µ-flow on-line instrument, and then collected daily in balloons. Finally, the composition of these collected gas samples was measured using a pre-calibrated instrument, Biogas Check (Geotechnical Instrument Ltd., Coventry, UK). The instrument was calibrated using certified methane mixtures [26].
2.2.1. Co-Digestion Trials
Three pairs of 2 L reactors were used digesting OFMSW and PS in different mixing ratios of 1:1, 3:1, and 4:1 (VS basis). Each reactor was operated in mesophilic conditions and had a hydraulic retention time (HRT) of 22 days. When necessary, the reactor feed was diluted in order to maintain the same HRT throughout the investigations. The reactors were started up by filling them with 2 L inoculum obtained from a full-scale digester treating the WWTP’s sludge on site. The initial organic loading rate (OLR) was 1.0 g/L/d, and the reactors were operating at these conditions under a period of one HRT (adaptation phase). The OLR was then increased to 2.0, 3.0, 4.0, and 5.0 g/L/d. The reactors were operated at each of these OLRs for a period of 3 HRT´s in order to obtain steady state conditions. Furthermore, to ensure a careful adaptation for the microorganisms when increasing the OLR´s, the OLR was gradually increased, i.e., using a load of 2.5, 3.5, and 4.5 g/L/d in between for a period of one HRT.
Moreover, the trials, performed with OFMSW to PS ratios of 3:1 and 4:1 were repeated. During the first trials only the methane production was monitored one-line using µ-flow, while during the repeated trials, both the production of biogas and its composition were monitored, when reaching higher OLRs (i.e., 3.0 gVS/L/d and above), using Biogas Check also.
2.2.2. Mono-Digestion Trials
Two 5-L CSTRs were operated parallel at mesophilic conditions with an HRT of 22 days. Similar to the experiments described above, these reactors were also started up by filling them with the inoculum obtained on site from the full-scale digesters. The reactors were fed once a day applying an initial OLR of 1.0 g/L/d for a period of one HRT. The OLR was then gradually increased up to OLR of 4.0 g/L/d, either with or without the addition of different amounts of CTES (Kemira, Helsingborg, Sweden). This CTES is a pre-mixed commercial solution of TEs, normally available on the market and generally used by several biogas plants in Sweden.
During the first experiment the digestion of OFMSW, as single substrate, was investigated and this was then repeated. During these two experimental setups, only the methane production was monitored using µ-flow, while during the third trial (i.e., with additon of CTES), the composition of the produced biogas was also determined by using Biogas Check.
2.3. Analytical Methods
The following physico-chemical analyses were performed: TS (Swedish standard (SS)-EN 12880:2000), chemical oxygen demand (CODCr) (ISO 15705:2002(E)), COD filtered (LCK 114), VS (SS-EN 12879:2000), Kjeldahl nitrogen (SS-EN 13342), total nitrogen (TN) (LCK 338), fats (NMKL 131), ammonium (NH4-N, LCK 302), pH: (SS-EN ISO 10523), bicarbonate alkalinity (BA) and total alkalinity (TA) (Svenska medicinal styrelse nr 122), VFA (HACH-LCK cuvette tests, LCK 365, as acetic acid equivalence using spectrophotometer DR3900), proteins (NMKL 6:2003 by ©Eurofins Scientific, Luxembourg, Luxembourg) iron (SS 028150-2/ICP-AES), nickel (SS 028150-2/ICP-MS), molybdenum (SS 028150-2/ICP-MS), selenium (SS 028150-2/ICP-MS), tungsten (SS 028150-2/ICP-MS), cobalt (SS 028150-2/ICP-MS) and boron (SS 028150-2/ICP-MS).
3. Results and Discussions
3.1. Substrate Characterization
The characterization results for the two different substrates used are presented in Table 1. Furthermore, the composition of OFMSW was also determined as: animal products 14.8%, vegetables 23.6%, fruits 27.8%, and dough and carbohydrate-based products 33.9%.
In line with previous results reported in the literature [8], the concentrations of some of the trace elements were much higher in PS than those in OFMSW (Table 1). The highest difference observed was for iron, with at least 25 times higher concentrations in the sludge compared to that in OFMSW. This high Fe concentration of PS can be explained by the use of iron salt as coagulant at the WWTP. Substantial differences were obtained for nickel and molybdenum as well, counting up to at least 1.5- and 2.5-times higher amounts, respectively, in PS. The concentrations of cobalt, selenium and boron were below detection levels in both substrates. On the other hand, the total nitrogen, ammonium and COD concentrations were much higher in OFMSW than those in PS. The C/N-ratio in OFMSW was below the levels of 15–30, which are considered as optimal ratios for AD processes [27]. The C/N-ratio in the sludge was within an adequate range for AD processes [27]. Total-COD values were used in order to calculate the C/N-ratio.
3.2. Semi-Continuous Co-Digestion Trials Fed with Different Mixing Ratios of Organic Fraction of Municipal Solid Waste (OFMSW) and Primary Sludge (PS)
3.2.1. Trace Metal Analyses
The results of the analyses of the digestate residue obtained at steady state conditions after reaching the maximum OLRs are summarized in Table 2. A considerable decrease in the concentrations of the TEs was observed (except for boron) compared to the initial values obtained for the inoculum due to co-digestion with OFMSW (Table 2), since this fraction contains lower TE concentrations (Table 1).
Furthermore, there was an increase of boron concentrations observed in the reactors (Table 2). Boron is defined as a micro-nutrient and its recommended concentrations was earlier reported at a wide range of between 0.001 mg/L and 11 mg/L [4]. However, according to data published by Gerardi [3], boron was found to be toxic at concentration levels above 2 mg/L. In our study the highest level of boron, i.e., 38 mg/kgTS, corresponds to a concentration of 1.5 mg/L hence still under the toxic levels reported [3].
3.2.2. Process Stability and Biogas Production, Anaerobic Co-Digestion (AcoD) Trials
The process stability was controlled by determining the VFA/TA ratio and the data are shown on Figure 1a–c. There is a direct relationship between alkalinity variations and VFA accumulation in anaerobic digestion. Keeping a VFA/TA ratio of around 0.08 is recommended in order to ensure stable process [3] and an increase to a ratio above 0.35 indicates process failure [28].
Analysis of weekly samples obtained at OFMSW to PS ratio of 1:1 showed stable process conditions during the first 50 weeks, i.e., with VFA to TA ratios between 0.012 and 0.068 (Figure 1a). During this period, the OLR was increased gradually, and the highest OLR where steady state conditions could be still achieved was 5.0 g/L/d. Further increase of the OLR to 5.5 g/L/d resulted in an increase in the VFA/TA ratio from 0.047 to 0.136 within the first week and later on a sharp increase to above 0.35 (up to 0.96) was observed, indicating process failure (Figure 1a).
At OFMSW to PS ratio of 3:1 the VFA/TA ratios indicated a stable process during the first 43 weeks achieving a highest OLR of 4.0 g/L/d (Figure 1b). Again, further increase of the OLR to 5.0 g/L/d resulted in a gradual increase in the VFA/TA ratio from 0.032 to 1.17 within four weeks, reaching a maximum VFA concentration of 4870 mg/L.
When co-digestion with the highest portion of OFMSW (OFMSW to PS ratio of 4:1) was running, stable process conditions could only be achieved during the first 29 weeks (Figure 1c). Here, the first indication for less robustness and instable process conditions was observed when the OLR was changed from 3.0 to 3.5 g/L/d. In this case, the VFA to TA ratio also increased to 0.126 due to an increase of VFAs from 212 mg/L to 636 mg/L. However, lowering the load to 3.0 g/L/d again over one-week before increasing the OLR back to 3.5 stabilized the process and later on a careful increase of the load to 4.0 g/L/d made it possible to reach steady state conditions (Figure 1c). Nevertheless, an additional increase to 4.5 g/L/d resulted in an increase in VFA concentration to 2530 mg/L, resulting in a VFA/TA ratio of 0.349 (Figure 1c).
Consequently, the highest OLRs were determined to 5.0 g/L/d for OFMSW:PS of 1:1, and 4.0 g/L/d, for both OFMSW:PS ratios of 3:1 and 4:1. Even though PS theoretically contains the necessary micronutrients required for the anaerobic process [17], co-digesting the sludge with higher loads of OFMSW may lead to lack of nutrients, in particularly a lack of trace elements (Table 2), since limited concentrations of those were found in the OFMSW (Table 1).
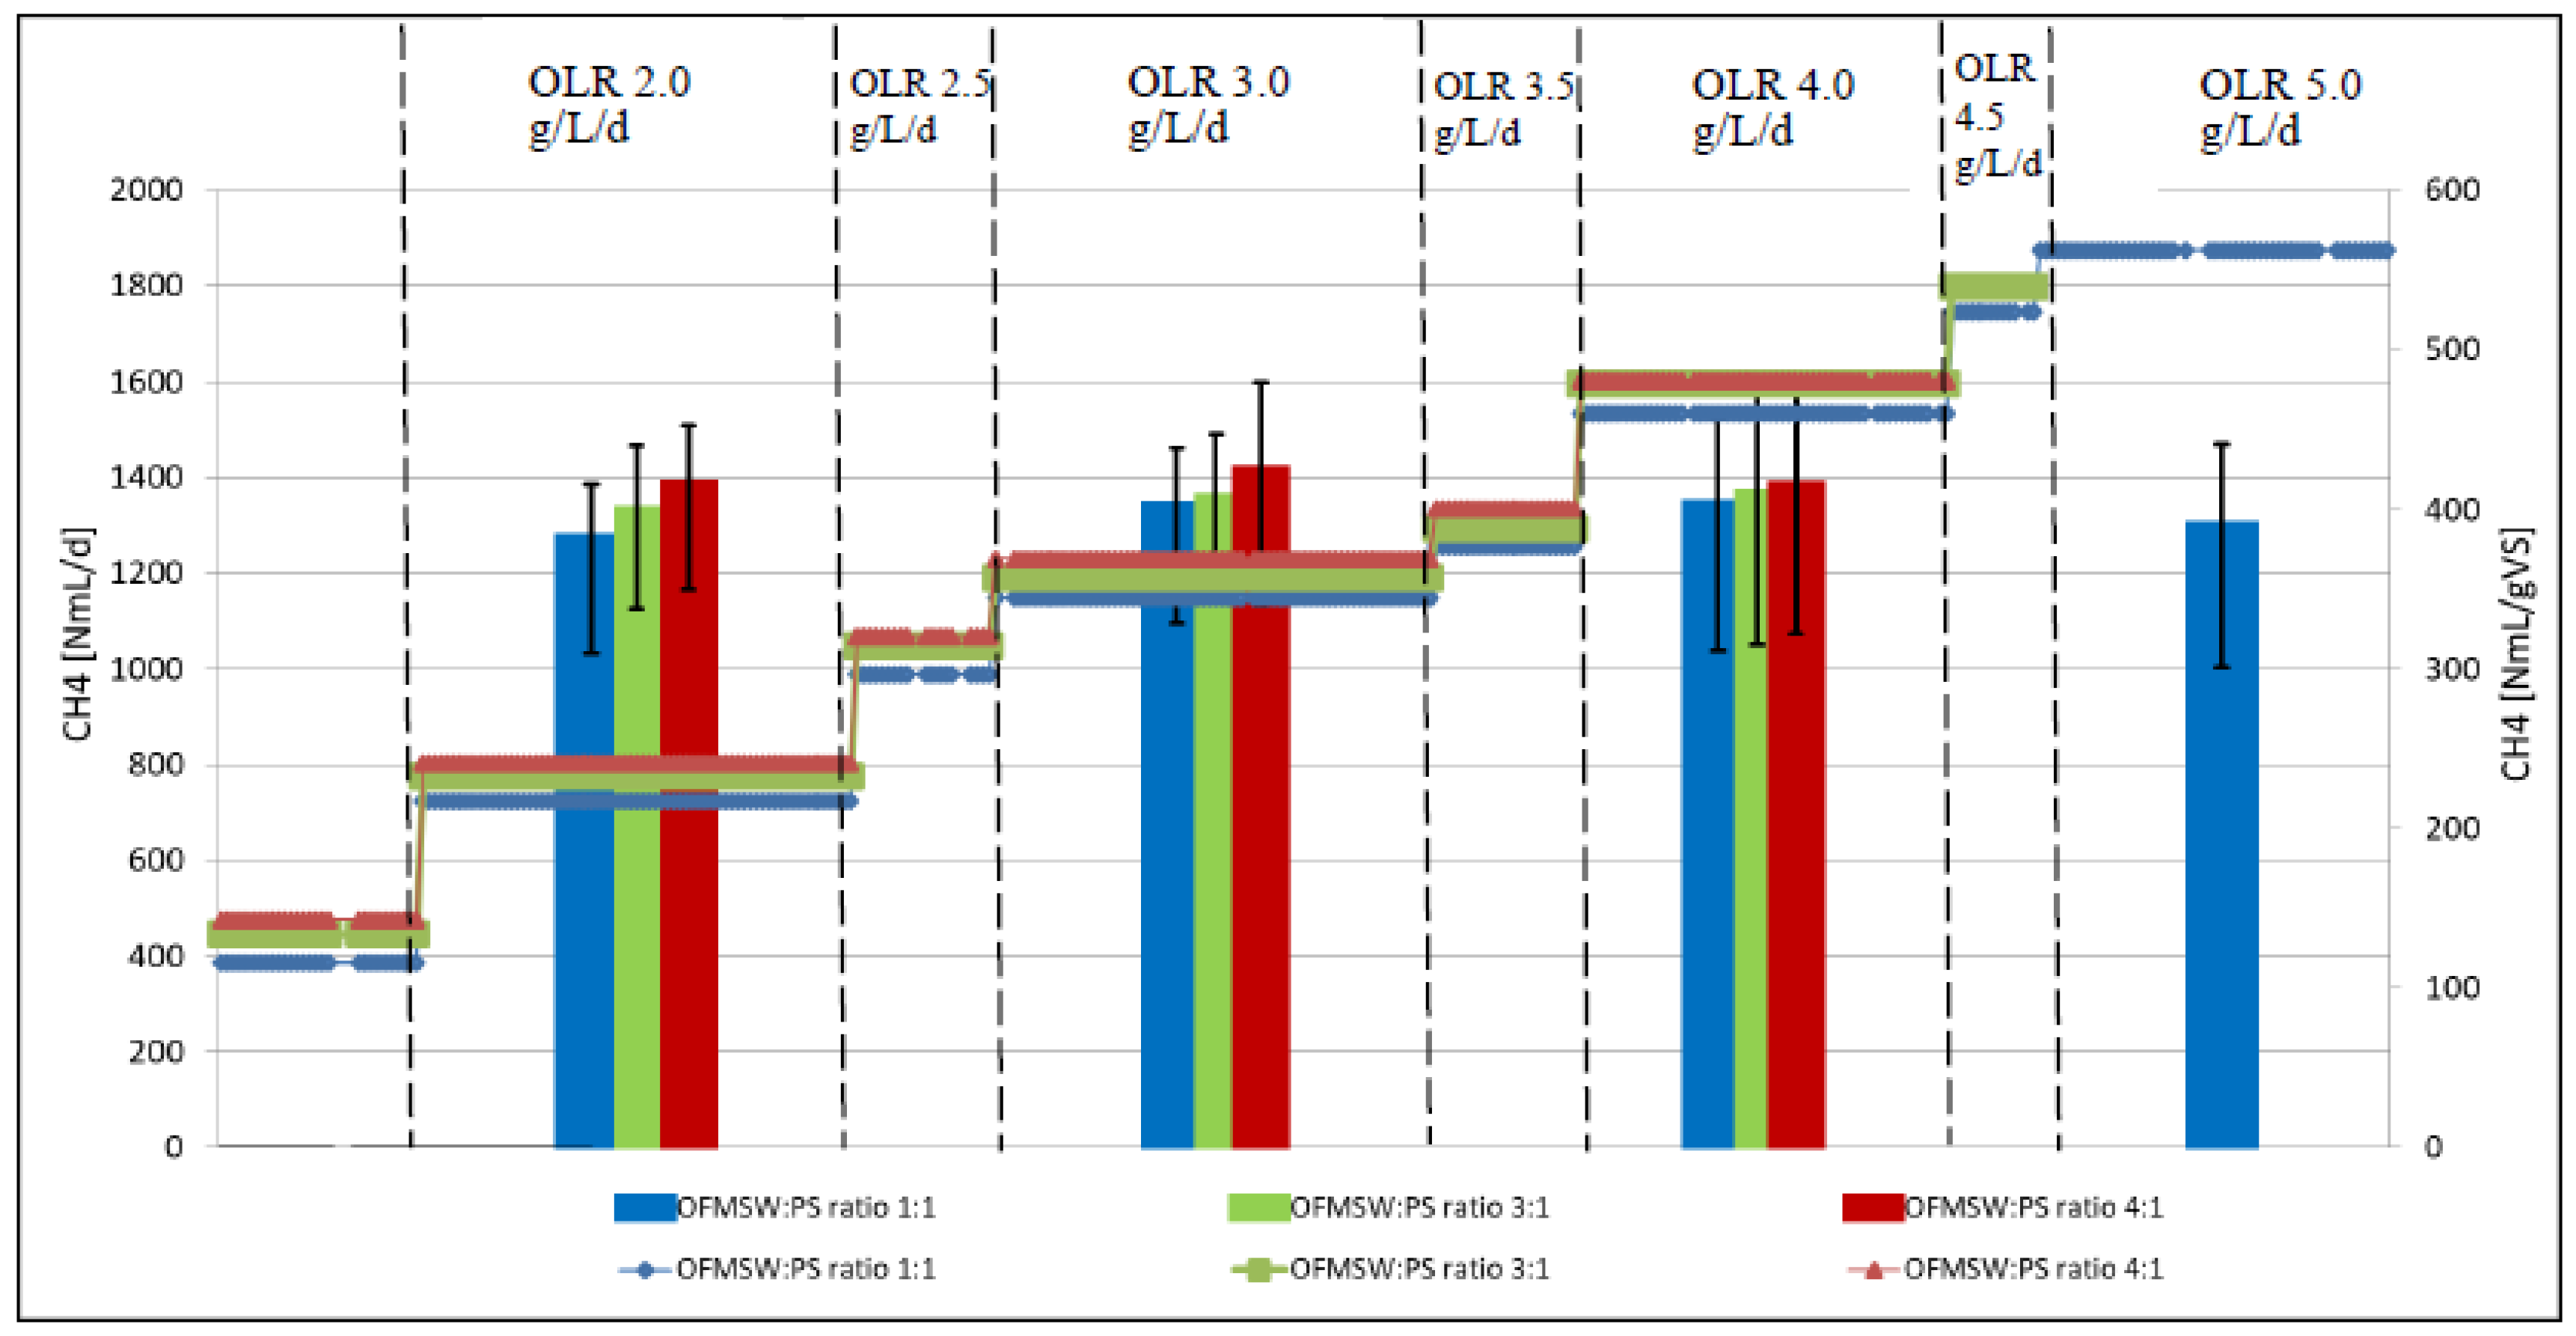
As expected, the daily average methane production increased in line with increasing OLRs in all reactors (Figure 2). The reactors with OFMSW:PS ratio of 4:1 showed the highest, while the digesters fed with a ratio of 1:1 showed the lowest productivity obtained at similar process conditions. This is due to the higher methane potential of OFMSW, in comparison to that of PS [12]. That was also confirmed through bio-methane potential (BMP) measurements previously carried out in our laboratory as well as by BMP results found in the literature for similar substrates [12,13,27].
Moreover, the reactors with higher OFMSW to PS ratio showed higher specific methane yields (expressed as NmL CH4/gVS/d). The specific methane yields obtained were: 375, 392, and 404 NmL CH4/gVS/d for ratio of 1:1, 3:1, and 4:1, respectively (Figure 2).
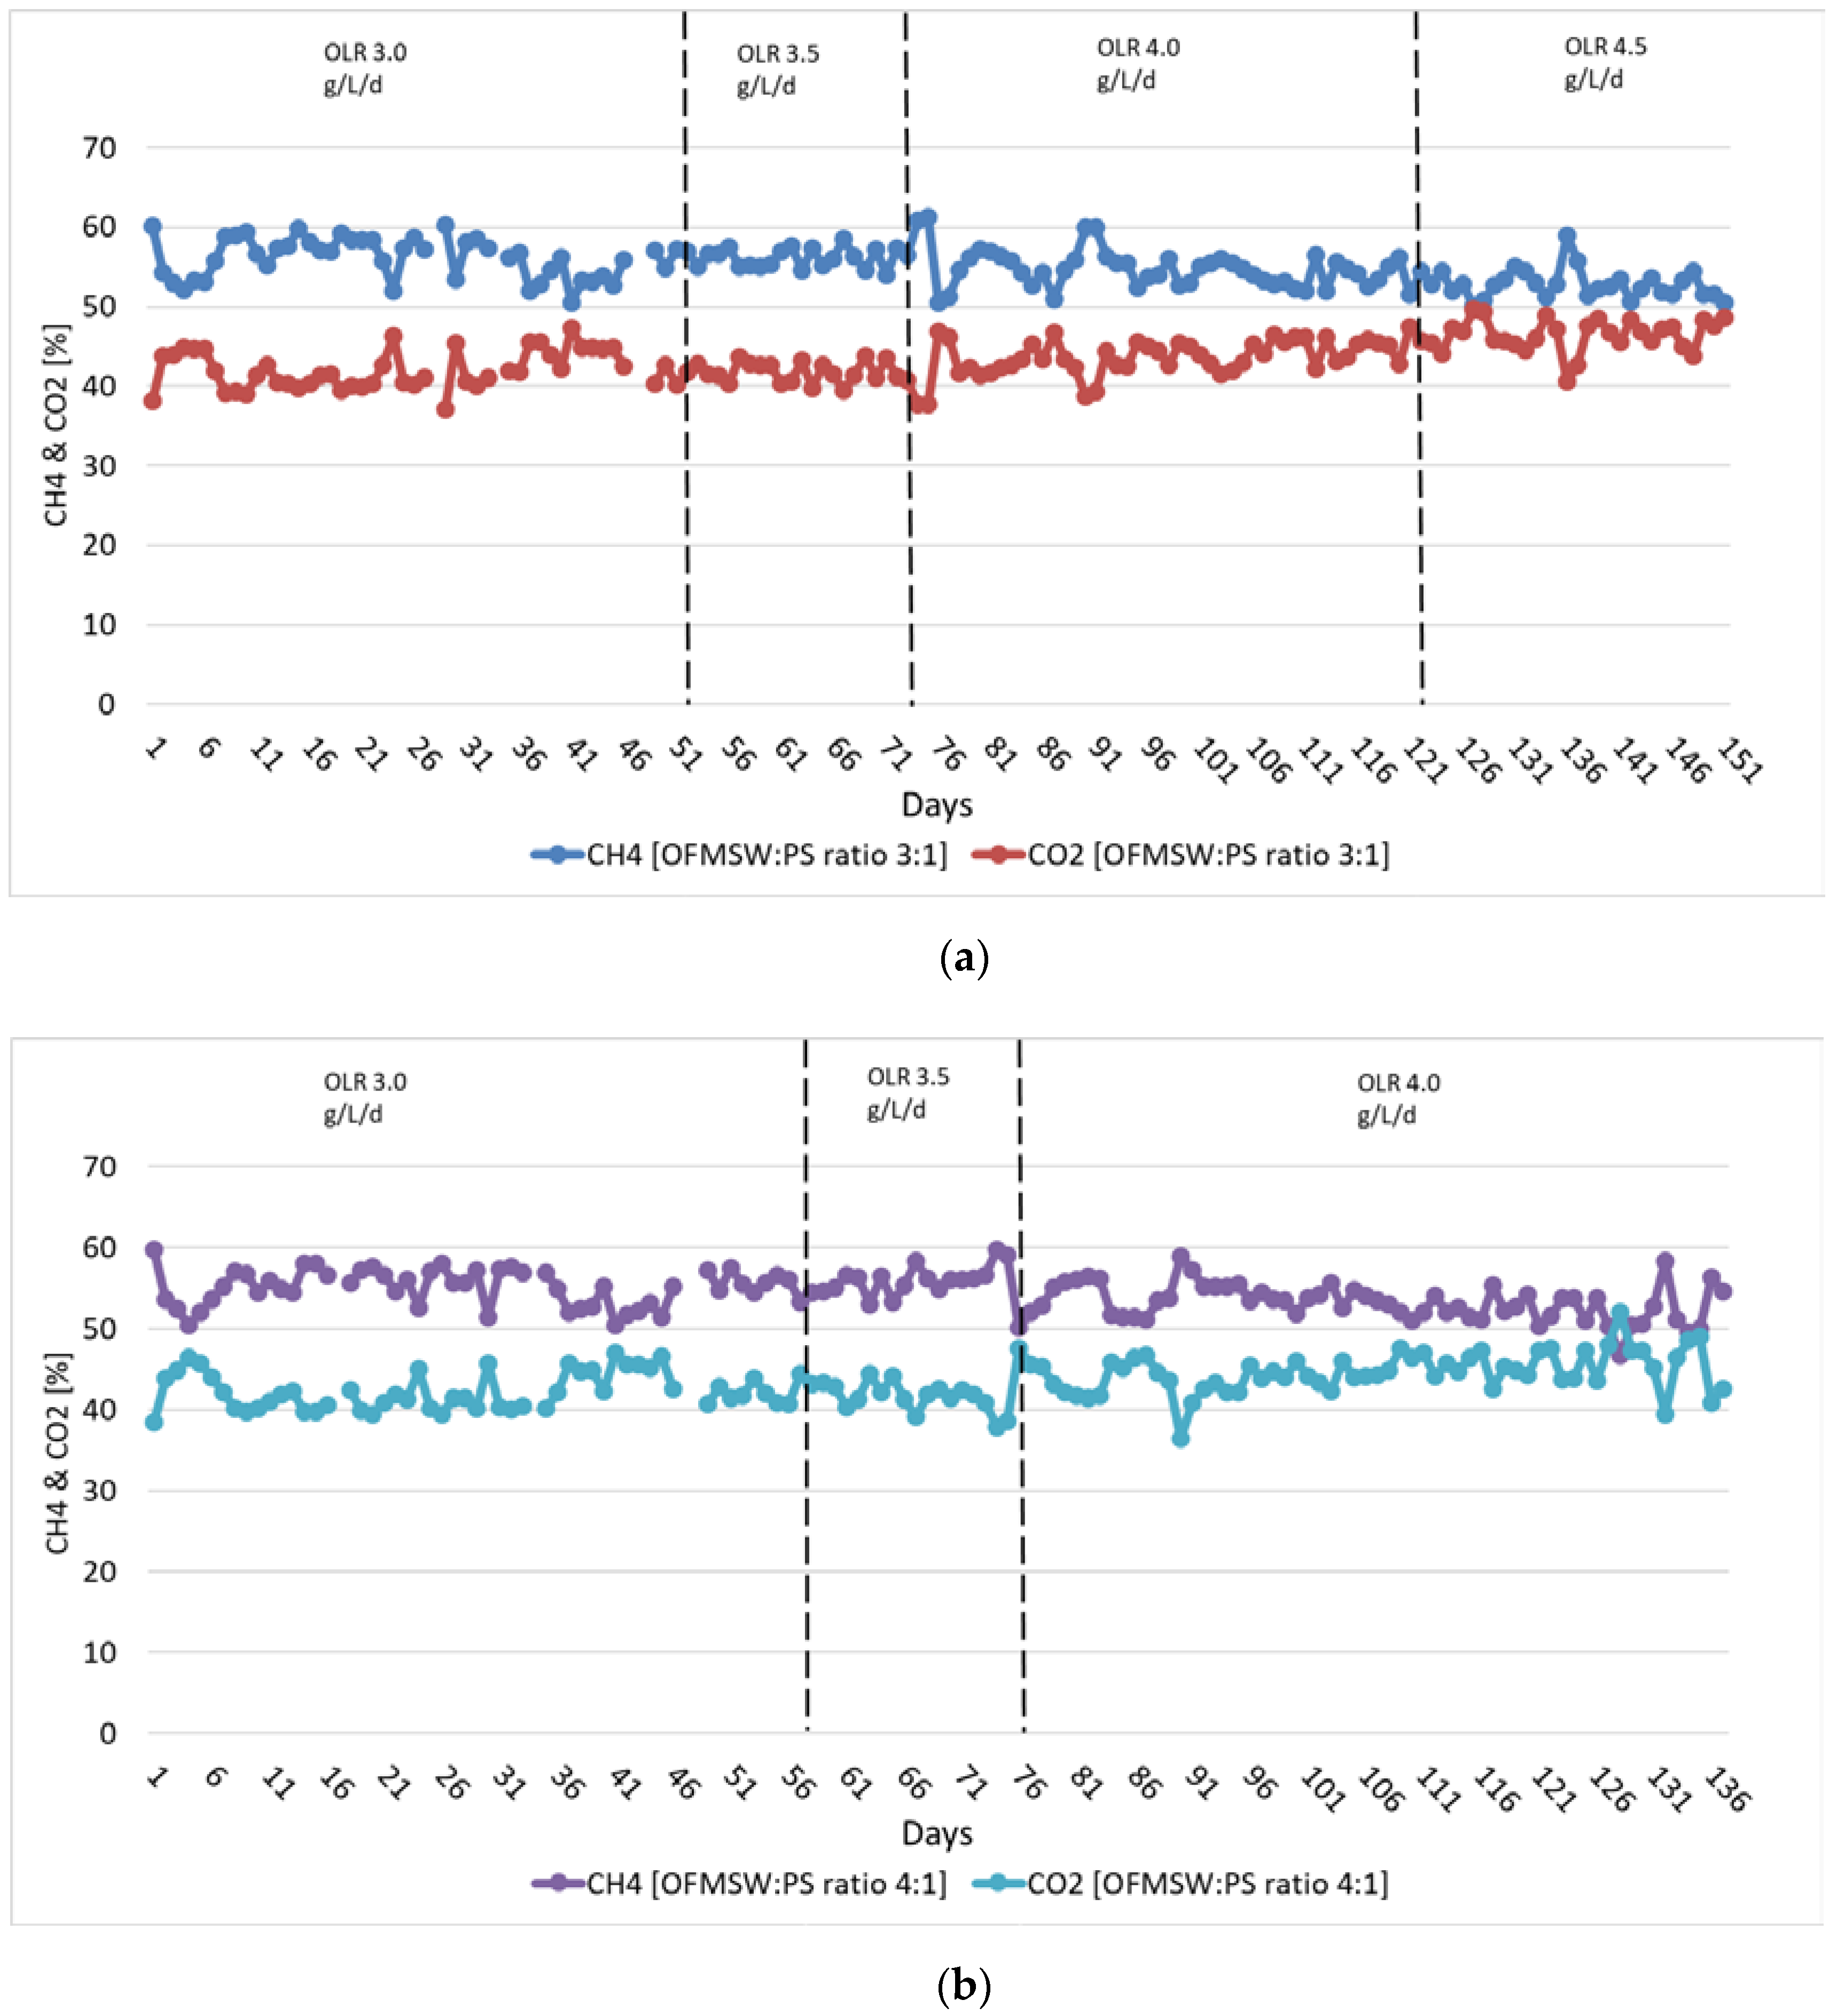
Measurements of the biogas composition started when reaching an OLR of 3.0 gVS/L/d and continued during the whole experimental period for the reactors fed with mixing ratios of 3:1 and with 4:1 (Figure 3). The measurements of the gas composition indicate higher methane concentrations and lower carbon dioxide concentrations during lower OLRs, continuing with a downward trend of methane concentrations and an upload trend of carbon dioxide concentrations in line with increasing OLRs. During OLR of 3.0 gVS/L/d an average CH4 of 56% was achieved in the produced biogas, while the methane content at the highest OLR of 4.5 gVS/L/d slightly decreased to 53% in case of investigating the mixture ratio of 3:1. Similarly, the measurements of the gas composition indicate a higher methane contents, i.e., 55%, at OLRs of 3.0 when the substrate mixture ratio of 4:1 was applied, compared to that of 54%, when the load was increased to 4.0 gVS/L/d. These observed methane concentrations are still in an adequate range according to the literature [29].
3.3. Semi-Continuous Mono-Digestion Trials with OFMSW as the Only Feedstock
3.3.1. Anaerobic Digestion (AD) trials of OFMSW Digestion Prior to the Addition of Commercial Trace Element Solutions (CTES)
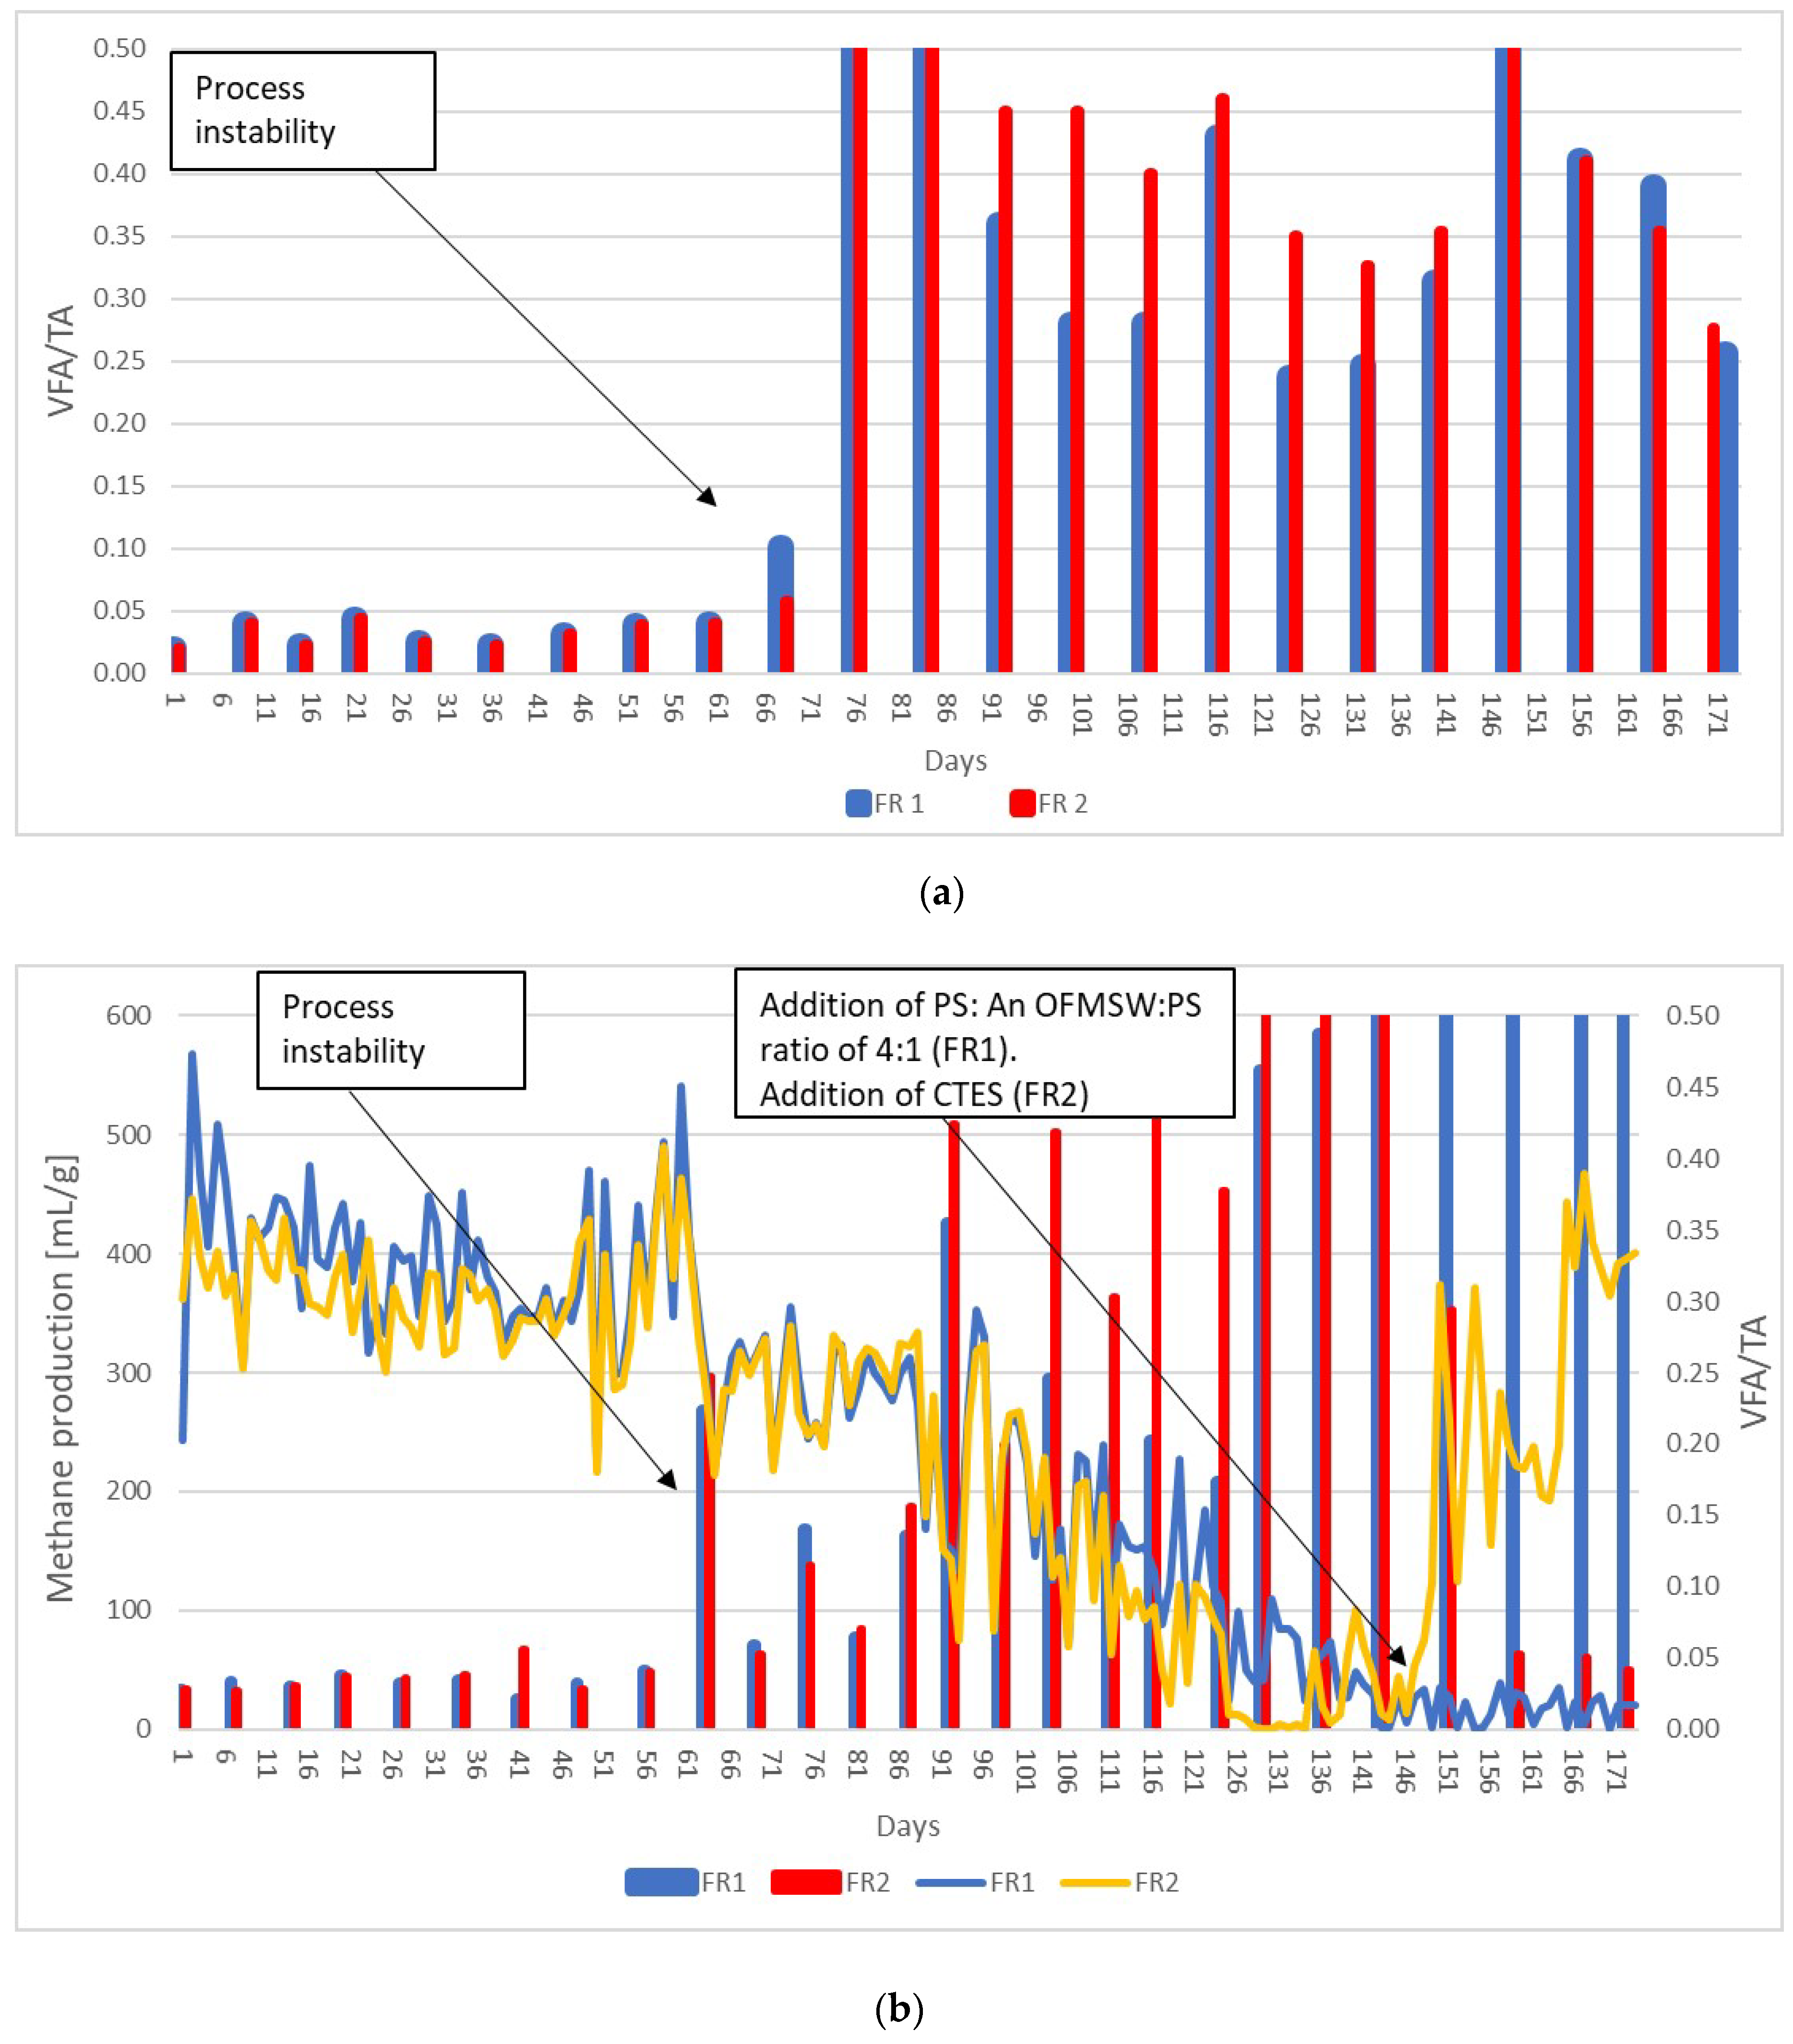
Figure 4a,b shows the results of specific methane production as well as VFA/TA ratios obtained during two repeated setups of digestion processes running in duplicates, both performed at similar conditions.
During the first run (Figure 4a), process instability occurred in both CSTR reactors (FR1 and FR2) fed with OFMSW only, after 3 HRTs (66 days) when an increase in the OLR from 1.0 to 2.0 gVS/L/d was performed. A significant increase in VFA concentration together with a decrease of TA resulted in a VFA/TA ratio higher than 0.35, and similar results with increasing VFA/TA values were observed even when the experiment was repeated.
Therefore, the feedstock was replaced to a mixture of OFMSW and PS at a ratio of 4:1 in one of the reactors (FR1), meanwhile CTES was added to the second reactor (FR2) from day 144 and then these conditions were continued for a period of four weeks in order to examine their effects on process performance. Both VFA levels and the VFA/TA ratio decreased significantly within less than a week as a result of CTES addition at a level of 14 µL/L/d. The level of VFAs decreased from 3745 to 1815 mg/L during the first week, and it was then gradually decreased further to 234 mg/L within the following weeks indicating a stabilized process. During these four weeks the VFA/TA ratio also decreased from a high level of 0.543 to a stable level of 0.050 (Figure 4b). Simultaneously, reactor FR1 was fed with a mixture of OFMSW:PS at a ratio of 4:1. However, no improvement in process performance could be observed here (Figure 4b). Although PS consist of different bacteria cultures, which may play an important role in the degradation processes [3], these results indicate that addition of PS could not replace CTES addition in order to stabilize a failed process, probably due to a higher availability of the TEs in the CTES than that in the PS.
3.3.2. Trace Metal Analyses
The results obtained from the TEs, nitrogen, and ammonium analyses during the AD trials are summarized in Table 3. In order to allow comparison with concentrations found in the literature the levels of TEs are presented in mg/L. Similarly, as for the AcoD reactors, the initial values are related to the analyses of the inoculum, obtained from the full-scale digester at the WWTP site in Varberg, Sweden. During the first and the second trial, sampling was carried out at steady state conditions (i.e., after 3 HRTs) at OLR of 1.0 g/L/d. During the third trial TE analyses were performed in two different occasions: (1) at OLR of 1.0 g/L/d and before the addition of CTES, and (2) at OLR of 4.0 g/L/d.
As was discussed earlier, the TE content in OFMSW is low (Table 1), and a significant decrease of all the TEs, except for boron, was therefore observed in the CSTR reactors fed with only OFMSW (Table 3). Furthermore, the concentrations decreased to lower levels then those obtained at the AcoD reactors (Table 2). Hence, significantly higher OLRs could be reached in the co-digestion reactors compared to that in the reactors fed with only OFMSW, where without the addition of TEs only a maximum OLR of 1.0 g/L/d could be reached. Moreover, process instability and poor methane production were observed during the experiments as a consequence of VFA/TA ratios above a critical level of 0.35 shown on Figure 4. Several previous studies point out, the lack of trace metals in biogas digesters as a possible reason for poor process efficiency [17]. Additionally, due to unbalanced C/N ratios, increase in the concentrations of both ammonium and total nitrogen can also cause problems during mono-digestion of OFMSW, which also affect the stability of the process negatively, causing nitrogen toxicity [27] and ammonia inhibition on the methanogens [30]. However, the NH4–N concentrations determined in the mono digestion reactors in this study were under a level 3000 mg/L, which has been previously reported frequently causing inhibitions in biogas plants independently of pH [29].
Although, Fe, Co, Ni, and Mo concentrations were found to be within the recommended concentration ranges [4] for all the reactors fed with OFMSW, the concentrations of these metals increased, as expected, after the addition of CTES (Table 3).
After CTES addition, cobalt concentrations were increased by 10-fold. This increase of Co concentrations is probably one of the key factors for achieving the showed stable process conditions (Figure 4), since Co is used by the enzyme of Carbon Monoxide Dehydrogenase (CODH), which plays an essential role in acetogenic activity and stimulates the activities of acetogens and methylotrophic methanogens [31]. The concentrations of Mo and Ni were doubled and tripled, respectively, after the addition of CTES. Nickel is taken up in the cells by co-factor F430, which is found in all methanogenic organisms. It increases the ability of methanogens to degrade organic acids, in particular acetic and propionic acid [32], their accumulation will otherwise cause process inhibition.
In contrary, the concentrations of Se were below the recommended concentrations (Table 3) for all the reactors due to the low concentration of this metal in the substrate (Table 1). Selenium is reported as an essential component for a variety of enzymes and is important for the growth of several methanogens [31,33]. Therefore, higher Se concentrations were expected to be found after the addition of CTES. However, from these results it seems that the commercial mixture of CTES does not contain or does not contain enough Se. Consequently, according to these results, CTES might need to be improved in the future by optimizing its Se content.
The concentration of tungsten was detected below the recommended level when the reactors were fed with only OFMSW, however, its concentration increased to the level of the recommended ones after CTES addition, with a 10-fold increase after the dosage. The lack of tungsten can be an important factor causing instability (Figure 4), since both tungsten and molybdenum are essential for the enzyme, formate dehydrogenase, and consequently play a significant role in formate degradation. Sufficient concentrations of these metals will prevent the accumulation of formate, which otherwise may result in feedback inhibition in propionic acid oxidation and therefore an increase in VFA concentrations [8].
3.3.3. AD Trials of OFMSW Digestion along with CTES Addition
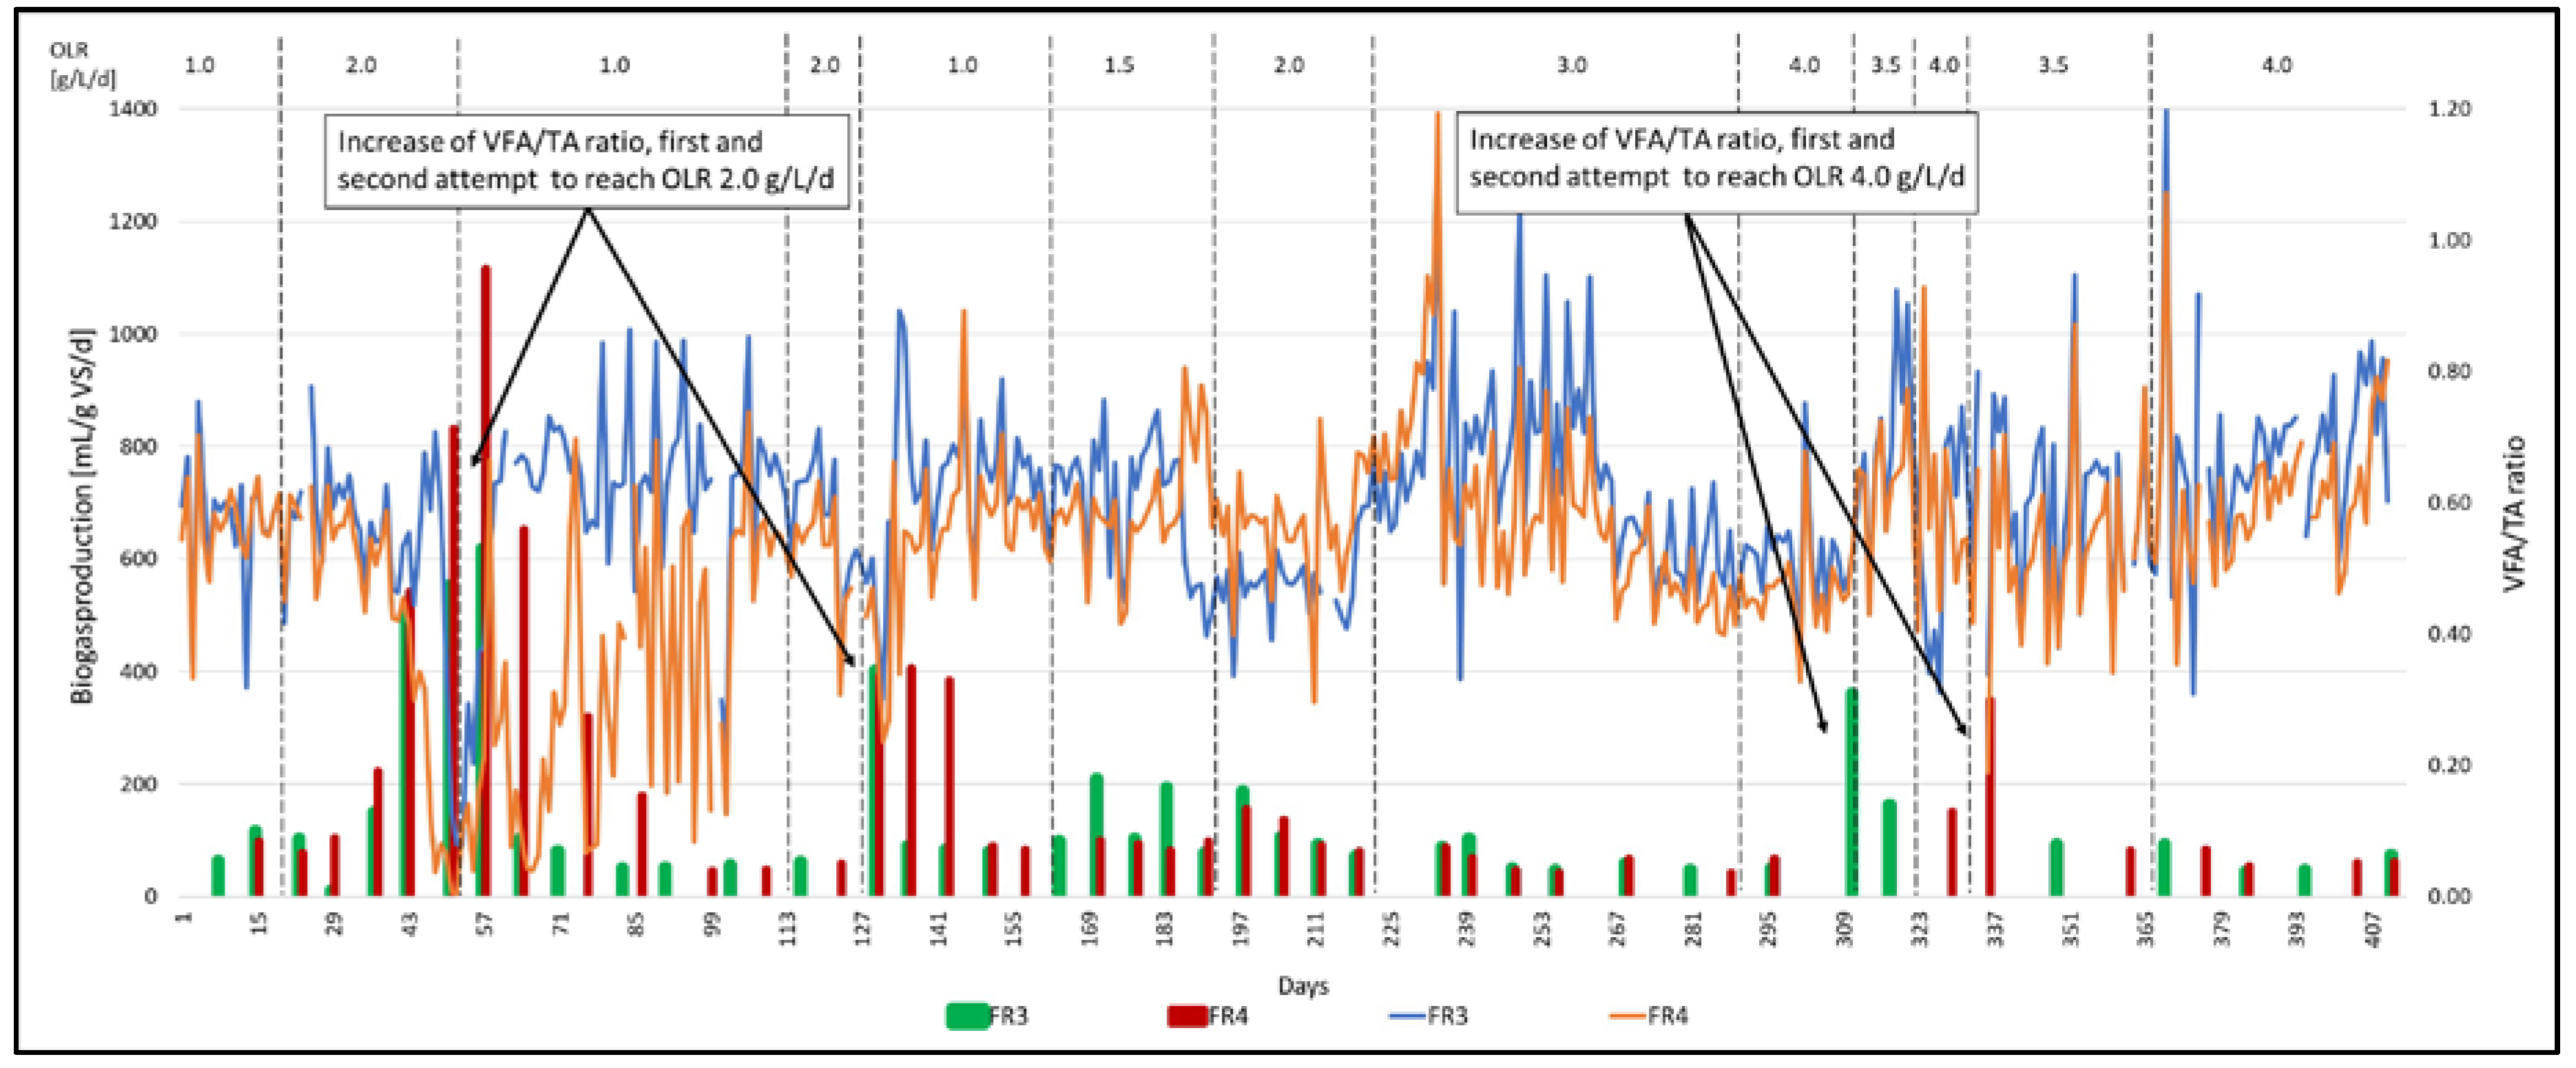
Figure 5 displays the biogas production and the VFA/TA ratios throughout the experiment running with the addition of CTES. The objective was to determine the required dosage of CTES aiming to achieve a stable process at as high OLR as 4.0 gVS/L/d. The process parameters for the experiment are summarized in detail in the Supplementary Table S1.
The addition of CTES started at OLR of 1.0 gVS/L/d at a level of 7 µL/L/d corresponding to 7 µL/gVS/d during the first 31 days. Then, the OLR was increased to 2.0 gVS/L/d and the level of the CTES addition was also elevated proportionally from 7 µL/L/d to 14 µL/L/d.
After this first attempt to increase the OLR, an increase in the VFA/TA ratio, from 0.09 to a maximum of 0.96 (corresponding to VFA increase from 186 mg/L to a maximum of 4521 mg/L), was observed, already within 15 days, resulting in a large decrease in the biogas production (Figure 5). Therefore, the OLR was reduced back to 1.0 gVS/L/d for a period of 3 HRTs again, in order to ensure stable steady state conditions before proceeding a new attempt to increase the load. However, even this second attempt to increase the OLR to 2 gVS/L/d resulted in a similar outcome, i.e., an increase in the VFA/TA ratio within 13 days. However, the VFA/TA ratio (a maximum of 0.35, with a concentration of 1167 mg/L VFAs) did not increase here to a similarly high level as previously, due to an ongoing dosage of CTES over a longer period of time. Nevertheless, the OLR was decreased back to 1.0 gVS/L/d, however, without reducing the level of CTES addition. Finally, a third attempt to increase the OLR was performed with a stepwise increase, i.e., first an increase to 1.5 gVS/L/d was performed together with an increase of CTES dosage to 21 µL/L/d keeping the specific level of CTES addition at 14 µL/g VS/d, and this specific level of CTES addition was then held throughout the rest of the experiment.
Since the VFA/TA could be maintained low, the OLR was further increased to 2.0 gVS/L/d after 1.5 HRTs, and then, after an additional 1.5 HRTs, to 3.0 gVS/L/d. The digestion process was then running at OLR of 3.0 gVS/L/d for a period of 3 HRTs to ensure steady state conditions (Figure 5). It is worth mentioning that the increase in the OLR from 1.5 to 2.0 gVS/L/d and then from 2.0 to 3.0 gVS/L/d in the following did not result in a rapid increase in the levels of VFA/TA ratios (Figure 5).
The following two attempts to reach an OLR of 4.0 gVS/L/d have failed and again accumulation of VFAs, hence an increase in the VFA/TA ratio, were observed. The first attempt has failed after 20 days and the OLR had to be decreased slightly back to 3.5 gVS/L/d for a short period of time until the VFA/TA ratio decreased to a sufficient level. The second attempt to increase the OLR to 4 gVS/L/d has also failed, and the OLR had to be reduced back to 3.5 gVS/L/d and it was kept there for a period of 1.5 HRTs. Finally, the third attempt to reach OLR of 4.0 gVS/L/d was successful most probably due to the fact that the microorganisms had a longer time to adapt the conditions, beside sufficient levels of TEs could be accumulated by that time in the reactors. The process was then stable for a period of additional 48 days (i.e., more than 2 HRTs), while the VFA/TA ratios remained low with no indication of changes (Figure 5).
The specific biogas yield based on the production of biogas during stable process conditions was calculated to 652.35 NmL biogas/gVS (Figure 5), corresponding to 362.56 NmL methane/g VS taking into account an average methane content of 54%.
4. Conclusions
The effects of co-digesting PS and OFMSW collected in the municipality, in different mixing ratios, were investigated using semi-continuous anaerobic reactors. Furthermore, the effects of the addition of a commercial trace elements mixture solution (CTES) to mono-digestion of OFMSW were also examined with respect to process stability and efficiency.
The study shows that it is more beneficial for WWTPs to co-digest OFMSW with PS, due to synergetic effects, resulting in higher methane yields. Mixing OFMSW with a high protein content and PS which, on the other hand, has higher TE content results in an improved C/N-ratio and nutrient supply compared to those obtained in mono-digestion of OFMSW.
Supplementary Materials
The following is available online at https://0-www-mdpi-com.brum.beds.ac.uk/2076-3298/7/6/42/s1, Table S1: CTES Dosing in reactors fed only with OFMSW.
Author Contributions
Conceptualization, M.H., A.K., and I.S.H.; methodology, M.H., A.K. and I.S.H.; investigation, M.H.; data collection and analysis, M.H. and I.S.H.; writing—original draft preparation, M.H., A.K., and I.S.H.; writing—review and editing, M.H., A.K., and I.S.H.; visualization, M.H. and I.S.H.; supervision, I.S.H. and A.K.; project administration, A.K.; funding acquisition, A.K. All authors have read and agreed to the published version of the manuscript.
Funding
This research received no external funding, only internal funding by the R&D department of Vatten and Miljö I Väst AB.
Acknowledgments
The authors acknowledge the financial support from Vatten and Miljö I Väst AB, which funded this long-term study, including monitoring program and analyses. The authors would also like to specially thank Christina Johansson, Diane Persson and Caroline Schleich for their patience, support and for fruitful cooperation regarding laboratory analyses.
Conflicts of Interest
The authors declare no conflict of interest.
References
- Mata-Alvarez, J.; Dosta, J.; Romero-Güiza, M.S.; Fonoll, X.; Peces, M.; Astals, S. A critical review on anaerobic co-digestion achievements between 2010 and 2013. Renew. Sustain. Energy Rev. 2014, 36, 412–427. [Google Scholar] [CrossRef]
- Deublein, D.; Steinhauser, A. Bioreactions. In Biogas from Waste and Renewable Resources: An Introduction, 2nd ed.; Wiley-VCH Verlag GmbH & Co. KGaA: Weinheim, Germany, 2010; pp. 101–108. [Google Scholar]
- Gerardi, M. Substrates, Products, and Biogas. Anaerobic digestion stages. In The Microbiology of Anaerobic Digesters; WILEY-INTERSCIENCE; A John Wiley & Sons, Inc.: Hoboken, NJ, USA, 2003; pp. 51–117. [Google Scholar]
- Schattauer, A.; Abdoun, E.; Weiland, P.; Plöchl, M.; Heiermann, M. Abundance of trace elements in demonstration biogas plants. Biosyst. Eng. 2011, 108, 57–65. [Google Scholar] [CrossRef]
- Ren, Y.; Yu, M.; Wu, C.; Wang, Q.; Gao, M.; Huang, Q. A comprehensive review on food waste anaerobic digestion: Research updates and tendencies. Bioresour. Technol. 2018, 247, 1069–1076. [Google Scholar] [CrossRef] [PubMed]
- Zhang, Q.; Chen, J.; Wang, T. Effects of Nitrilotriacetic Acid on Anaerobic Co-Digestion of Food Waste and Sludge. Waste Biomass Valorization 2018, 9, 1731–1734. [Google Scholar] [CrossRef]
- Fermoso, F.G.; Bartacek, J.; Jansen, S.; Lens, P.N.L. Metal supplementation to UASB bioreactors: From cell-metal interactions to full-scale application. Sci. Total Environ. 2009, 407, 3652–3667. [Google Scholar] [CrossRef] [PubMed]
- Banks, C.J.; Zhang, Y.; Jiang, Y.; Heaven, S. Trace element requirements for stable food waste digestion at elevated ammonia concentrations. Bioresour. Technol. 2012, 104, 127–135. [Google Scholar] [CrossRef] [PubMed] [Green Version]
- Osuna, M.B.; Iza, J.M.; Zandvoort, M.H.; Lens, P.N.L. Essential metal depletion in an anaerobic reactor. Water Sci. Technol. 2003, 48, 1–8. [Google Scholar] [CrossRef] [PubMed]
- Romero-Güiza, M.S.; Vila, J.; Mata-Alvarez, J.; Chimenos, J.M.; Astals, S. The role of additives on anaerobic digestion: A review. Renew. Sustain. Energy Rev. 2016, 58, 1486–1499. [Google Scholar] [CrossRef]
- Feng, X.M.; Karlsson, A.; Svensson, B.H.; Bertilsson, S. Impact of trace element addition on biogas production from food industrial waste—Linking process to microbial communities. FEMS Microbiol. Ecol. 2010, 74, 226–240. [Google Scholar] [CrossRef] [PubMed] [Green Version]
- Li, L.; Peng, X.; Wang, X.; Wu, D. Anaerobic digestion of food waste: A review focusing on process stability. Bioresour. Technol. 2018, 248, 20–28. [Google Scholar] [CrossRef] [PubMed]
- Girotto, F.; Alibardi, L.; Cossu, R. Food waste generation and industrial uses: A review. Waste Manag. 2015, 45, 32–41. [Google Scholar] [CrossRef] [PubMed]
- Zhang, L.; Jahng, D. Long-term anaerobic digestion of food waste stabilized by trace elements. Waste Manag. 2012, 32, 1509–1515. [Google Scholar] [CrossRef] [PubMed]
- Thyberg, K.L.; Tonjes, D.J. Drivers of food waste and their implications for sustainable policy development. Resour. Conserv. Recycl. 2016, 106, 110–123. [Google Scholar] [CrossRef]
- Zhang, W.; Zhang, L.; Li, A. Enhanced anaerobic digestion of food waste by trace metal elements supplementation and reduced metals dosage by green chelating agent [S, S]-EDDS via improving metals bioavailability. Water Res. 2015, 84, 266–277. [Google Scholar] [CrossRef] [PubMed]
- Demirel, B.; Scherer, P. Trace element requirements of agricultural biogas digesters during biological conversion of renewable biomass to methane. Biomass Bioenergy 2011, 35, 992–998. [Google Scholar] [CrossRef]
- Abdelsalam, E.; Samer, M.; Attia, Y.A.; Abdel-Hadi, M.A.; Hassan, H.E.; Badr, Y. Effects of Co and Ni nanoparticles on biogas and methane production from anaerobic digestion of slurry. Energy Convers. Manag. 2017, 141, 108–119. [Google Scholar] [CrossRef]
- Capson-Tojo, G.; Rouez, M.; Crest, M.; Steyer, J.P.; Delgenès, J.P.; Escudié, R. Food waste valorization via anaerobic processes: A review. Rev. Environ. Sci. Bio/Technol. 2016, 15, 499–547. [Google Scholar] [CrossRef]
- Wang, P.; Wang, H.; Qiu, Y.; Ren, L.; Jiang, B. Microbial characteristics in anaerobic digestion process of food waste for methane production—A review. Bioresour. Technol. 2018, 248, 29–36. [Google Scholar] [CrossRef] [PubMed]
- Keucken, A.; Habagil, M.; Batstone, D.; Jeppsson, U.; Arnell, M. Anaerobic co-digestion of sludge and organic food waste-performance, inhibition, and impact on the microbial community. Energies 2018, 11, 2325. [Google Scholar] [CrossRef] [Green Version]
- Pongthornpruek, S.; Watmuang, S. Biogas Production from Anaerobic Co-Digestion of Food Waste Mixed with Domestic Wastewater. Appl. Mech. Mater. 2016, 855, 103–107. [Google Scholar] [CrossRef] [Green Version]
- Bioprocess Control. BIOREACTOR SIMULATOR—Continuous Fermentation Made Easy. Available online: https://www.bioprocesscontrol.com/products/bioreactor-simulator (accessed on 30 April 2020).
- Forgács, G.; Pourbafrani, M.; Niklasson, C.; Taherzadeh, M.J.; Hováth, I.S. Methane production from citrus wastes: Process development and cost estimation. J. Chem. Technol. Biotechnol. 2012, 87, 250–255. [Google Scholar] [CrossRef]
- Bioprocess Control. Microfow Gasflow Meter, Operation & Maintainance Manual. Available online: https://www.bioprocesscontrol.com/media/1376/bioprocess-control-uflow.pdf (accessed on 30 April 2020).
- Geotech. Biogas Check Operating Manual 2010, Geotechnical Instruments England. Available online: http://www.keison.co.uk/products/geotechnical/BiogasCheckManual.pdf (accessed on 30 April 2020).
- Carlsson, M.; Uldal, M. Substrathandbok för Biogasproduktion. Rapport SGC 200 •1102-7371 • ISRN SGC-R-200-SE. vol. nr 200. Available online: https://www.osti.gov/etdeweb/servlets/purl/948934 (accessed on 30 April 2020).
- Switzenbaum, M.S.; Giraldo-Gomez, M.; Eugenio Hickey, F.R. Monitoring of the anaerobic methane fermentation process. Enzym. Microb. Technol. 1990, 12, 722–730. [Google Scholar] [CrossRef]
- Jarvis, Å.; Schnurer, A. Mikrobiologisk Handbook för Biogasanläggningar Sc Rapport SGC 207•1102-7371 • ISRN SGC 207. Available online: http://www.sgc.se/ckfinder/userfiles/files/SGC207.pdf (accessed on 30 April 2020).
- Andersson, A. Effekten av Kemiras Processhjälpmedel BDP866 i Hulesjöns Avloppsreningsverks Rötgaskammare för Matavfall. Master’s Thesis, Chalmers Tkniska Högskola, Gothenburg, Sweden, June 2014. [Google Scholar]
- Kayhanian, M.; Rich, D. Pilot-scale high solids thermophilic anaerobic digestion of municipal solid waste with an emphasis on nutrient requirements. Biomass Bioenergy 1995, 8, 433–444. [Google Scholar] [CrossRef]
- Hornung, A. Anaerobic Digestion. In Transformation of Biomass Theory to Practice, 1st ed.; Hornung, A., Ed.; John Wiley & Sons Ltd.: Birmingham, UK, 2014; pp. 31–55. [Google Scholar] [CrossRef]
- Chellapandi, P. In silico description of cobalt and nickel assimilation systems in the genomes of methanogens. Syst. Synth. Biol. 2011, 5, 105–114. [Google Scholar] [CrossRef] [PubMed] [Green Version]
Figure 1.
The ratio between volatile fatty acids (VFA) and total alkalinity (TA) in the co-digestion reactors treating Organic Fraction of Municipal Solid Waste (OFMSW) and primary sludge (PS) at different ratios: (a) OMSW:PS of 1:1; (b) OMSW:PS of 3:1; (c) OMSW:PS of 4:1. The OLR:s applied are presented at the top of each figure and the regions were process failure occurred are pointed out in each figure with an arrow.

Figure 2.
Daily average volumetric methane production and specific methane production during the co-digested trials, performed with different OFMSW to PS ratios. The volumetric methane production (left y-axis) during each OLR is shown as horizontal lines, and the specific methane production (right-axis) obtained at different OLRs reaching steady state conditions (i.e., OLR 2.0, 3.0, 4.0, and 5.0 g/L/d) are presented as columns.

Figure 3.
Biogas composition (CO2 and CH4 content) obtained at higher OLR:s and with OFMSW:PS ratio of 3:1 (a) and 4:1 (b). The OLR:s are presented at the top of each figure.
Figure 3.
Biogas composition (CO2 and CH4 content) obtained at higher OLR:s and with OFMSW:PS ratio of 3:1 (a) and 4:1 (b). The OLR:s are presented at the top of each figure.

Figure 4.
The ratio between VFA and TA in digesters fed with OFMSW as mono-substrate in two similar trials performed at OLR of 1.0 g/L/d (a) the first experimental trial; (b) repeated experimental trial where the specific methane production is also presented, and the starting point for the addition of PS to an OFMSW:PS ratio of 4:1 (FR1) or addition of Commercial Trace Element Solutions (CTES) (FR2) is shown. The staples represent the obtained VFA/TA ratios (right y-axis), while the blue (FR1) and yellow (FR2) lines show the methane production (left y-axis).

Figure 5.
Biogas and VFA production, two identical reactors fed with only OFMSW during CTES-dosing. The different OLR:s are shown in the upper part of the figure. The blue and orange lines represent the biogas production (left y-axis) while the red and green staples represent the VFA/TA ratio (right y-axis). The periods where the VFA/TA ratios increased to high levels are pointed out with arrows.


Table 1.
Substrate characterization. Trace element and nutrients composition in the substrates.
| Trace Elements | |||
|---|---|---|---|
| OFMSW | Primary Sludge | ||
| Average | Average | ||
| Total solids (TS) | % | 24.7 ± 4.6 | 5.55 ± 0.65 |
| Volatile Solids | % VS | 94.9 ± 0.9 | 84.05 ± 0.45 |
| Iron-Fe | mg/kg TS | 160 ± 14.1 | 4750 ± 350 |
| Cobalt-Co | mg/kg TS | <2.5 | <2.5 |
| Nickel-Ni | mg/kg TS | <4.8 | 6.8 ± 0.3 |
| Molybdenum-Mo | mg/kg TS | <0.95 | 2.4 ± 0.1 |
| Selenium-Se | mg/kg TS | <0.95 | <0.99 |
| Tungsten-W | mg/kg TS | <1.1 | 1.15 ± 0.1 |
| Boron-B | mg/kg TS | <24 | <25 |
| Nitrogen-(Kjeldahl) | mg/kg | 34,713 ± 6665 | 2200 ± 100 |
| Ammonium-(NH4–N) | mg/kg | 1045 ± 77.8 | 385 ± 25 |
| Total COD | mg/kg | 182,025 ± 2652 | 48,390 ± 810 |
| CODSol | mg/kg | 57,850 ± 1131 | 11,985 ± 495 |
| Fats | % of TS | 14.6 ± 2.8 | 16.7 ± 2.5 |
| Proteins | g/100 g | 3.6 ± 0.1 | 2.8 ± 0.4 |
Table 2.
The level of nutrients, i.e., nitrogen and trace elements, in the reactors during co-digestion. The analyses were conducted on digested residue samples taken from the reactors at steady state conditions, i.e., at the end of the operation time corresponding to 3 hydraulic retention time (HRTs) when reaching maximum organic loading rates (OLRs). Initial values are showing the analyses data for the inoculum before the feeding started.
| Uncertainty (%) | Initial Values | OFMSW:PS Ratio 1:1 (OLR 5.0 gVS/L/d) | OFMSW:PS Ratio 3:1 (OLR 4.0 gVS/L/d) | OFMSW:PS Ratio 4:1 (OLR 4.0 gVS/L/d) | ||||
|---|---|---|---|---|---|---|---|---|
| Inoculum * | First Trial | Repeated Trial | First Trial | Repeated Trial | ||||
| Total solids-(TS) | % | +/− 10 | 3.1 | 4.7 | 4.0 | 4.0 | 4.0 | 4.3 |
| Volatile Solids | % of TS | +/− 10 | 69.1 | 71.4 | 76.7 | 73.7 | 67.3 | 71.8 |
| Nitrogen-(Kjeldhal) | mg/kg ** | +/− 10 | 2900 | 3900 | 3600 | 2400 | 2700 | 3900 |
| Nitrogen-(Kjeldhal) | % of TS | +/− 10 | 9.3 | 6.9 | 9.0 | 9.2 | 6.7 | 9.1 |
| Ammonium-Nitrogen | mg/kg ** | +/− 10 | 1300 | 1900 | 1500 | 920 | 1300 | 1500 |
| Ammonium-Nitrogen | % of TS | +/− 10 | 4.2 | 3.4 | 3.8 | 4.2 | 3.2 | 3.5 |
| Iron-Fe | mg/kg TS | +/− 15 | 11,000 | 5900 | 4400 | 6500 | 7500 | 3300 |
| Cobalt-Co | mg/kg TS | +/− 20 | 2.6 | 2.1 | 1.2 | 1.6 | 6.4 | 1.0 |
| Nickel-Ni | mg/kg TS | +/− 15 | 15 | 10 | 7.9 | 9.4 | 11 | 6.7 |
| Molybdenum-Mo | mg/kg TS | +/− 20 | 5.4 | 3.4 | 2.8 | 3.9 | 3.2 | 2.0 |
| Selenium-Se | mg/kg TS | +/− 20 | 1.8 | <0.97 | <0.97 | 1.5 | 1.4 | <0.97 |
| Tungsten-W | mg/kg TS | +/− 25 | 2.0 | 4 | <1.1 | 2.0 | 1.5 | <1.1 |
| Boron-B | mg/kg TS | +/− 15 | <25 | 20 | 38 | 26 | 28 | 27 |
* obtained from the full-scale reactor, used for all the reactors; ** Fresh matter basis.
Table 3.
Nutrients and trace elements in the reactors fed with OFMSW. A comparison between recommended Trace Elements (TE) concentration in the literature and the TE concentrations in the Anaerobic Digestion (AD) trials.
Table 3.
Nutrients and trace elements in the reactors fed with OFMSW. A comparison between recommended Trace Elements (TE) concentration in the literature and the TE concentrations in the Anaerobic Digestion (AD) trials.
| AD Reactors | Literature | |||||
|---|---|---|---|---|---|---|
| Uncertainty (%) | Initial Values | OFMSW without CTES Addition (OLR 1.0 g/L/d) | OFMSW with CTES Addition (OLR 4.0 g/L/d) | Recommended Concentrations of TEs [4] | ||
| Parameter | Unit | 1 Inoculum | Average values (from three trial repetitions) | |||
| Total solids | % | +/− 10 | 3.1 | 1.25 ± 0.18 | 2 | |
| Volatile Solids | % of TS | +/− 10 | 69.1 | 80.9 ± 4.18 | 75.7 | |
| Nitrogen-(Kjeldhal) | mg/L | +/− 10 | 2900 | 1717 ± 202 | 2800 | |
| Ammonium-Nitrogen | mg/L | +/− 10 | 1300 | 881.7 ± 34.47 | 1300 | |
| Iron, Fe | mg/L | +/− 15 | 341 | 24.17 ± 3.25 | 32 | >0.28–200 |
| Cobalt-Co | mg/L | +/− 20 | 0.08 | 0.003 ± 0.00 | 0.03 | >0.00059–20 |
| Nickel-Ni | mg/L | +/− 15 | 0.47 | 0.04 ± 0.04 | 0.07 | 0.005–30 |
| Molybdenum-Mo | mg/L | +/− 20 | 0.17 | 0.02 ± 0.00 | 0.04 | >0.00096–50 |
| Selenium-Se | mg/L | +/− 20 | 0.06 | 0.01 ± 0.00 | <0.02 | 0.079–0.79 |
| Tungsten-W | mg/L | +/− 25 | 0.06 | 0.005 ± 0.00 | n.d. | 0.018–18.3 |
| Boron-B | mg/L | +/− 15 | <0.78 | 0.25 ± 0.02 | n.d. | 0.001–11 |
1 Inoculum obtained from the full-scale digester.
© 2020 by the authors. Licensee MDPI, Basel, Switzerland. This article is an open access article distributed under the terms and conditions of the Creative Commons Attribution (CC BY) license (http://creativecommons.org/licenses/by/4.0/).
Share and Cite
MDPI and ACS Style
Habagil, M.; Keucken, A.; Sárvári Horváth, I. Biogas Production from Food Residues—The Role of Trace Metals and Co-Digestion with Primary Sludge. Environments 2020, 7, 42. https://0-doi-org.brum.beds.ac.uk/10.3390/environments7060042
AMA Style
Habagil M, Keucken A, Sárvári Horváth I. Biogas Production from Food Residues—The Role of Trace Metals and Co-Digestion with Primary Sludge. Environments. 2020; 7(6):42. https://0-doi-org.brum.beds.ac.uk/10.3390/environments7060042
Chicago/Turabian StyleHabagil, Moshe, Alexander Keucken, and Ilona Sárvári Horváth. 2020. "Biogas Production from Food Residues—The Role of Trace Metals and Co-Digestion with Primary Sludge" Environments 7, no. 6: 42. https://0-doi-org.brum.beds.ac.uk/10.3390/environments7060042
Note that from the first issue of 2016, this journal uses article numbers instead of page numbers. See further details here.