Article

Techno-Economic Assessment of CHP Systems in Wastewater Treatment Plants

1
School for Engineering of Matter, Transport and Energy, Arizona State University, Tempe, AZ 85287-6106, USA
2
School of Computing, Informatics, and Decision Systems Engineering, Arizona State University, Tempe, AZ 85287-8809, USA
*
Author to whom correspondence should be addressed.
Submission received: 3 September 2020 / Revised: 23 September 2020 / Accepted: 24 September 2020 / Published: 26 September 2020
(This article belongs to the Special Issue Pollution Prevention/Environmental Sustainability for Industry)

Abstract

:
Wastewater treatment plant (WWTP) utilization of combined heat and power (CHP) systems allows for the efficient use of on-site biogas production, as well as increased annual savings in utility costs. In this paper, a review of biogas energy recovery options, CHP prime mover technologies, and the costs associated with biogas cleaning give a broad summary of the current state of CHP technology in WWTPs. Even though there are six different prime mover technologies, the main ones currently being implemented in WWTPs are micro turbines, fuel cells and reciprocating engines. Different prime movers offer varying efficiencies, installation costs, and biogas impurity (H2S, siloxanes, HCl) tolerances. To evaluate the long-term savings capabilities, a techno-economic assessment of a CHP installation at a case study WWTP shows the payback, annual savings, and initial costs associated with the installation of a CHP system. In this case, a study a payback of 5.7 years and a net present value of USD 709,000 can be achieved when the WWTP generates over 2,000,000 m3 of biogas per year and utilizes over 36,000 GJ of natural gas per year.

1. Introduction

Water and energy are inseparably connected and vital resources, as electricity generation requires large quantities of water while a significant amount of energy is required for both drinking water and wastewater services. This has been termed the water–energy nexus [1]. Water operations typically consume a disproportionately large amount of energy in a community, which means significant environmental, economic and social benefits can result from more efficient operations in water treatment plants (WTPs) and wastewater treatment plants (WWTPs) [2].
In the United States, municipal WTP and WWTPs collectively demand around 2–4% of the U.S. energy consumption, which represents around USD 4.7 billion annually [3,4]. Electricity consumption in WWTPs is approximately 30 billion kWh and that is expected to increase up to 20% in the coming decades [2]. Of the total energy needed for WWTPs utilizing conventional activated sludge process, about half is electrical energy for the aeration basins [5]. Despite the significant energy use, theoretically municipal wastewater contains between five and 10 times more chemical and thermal energy than needed for treatment that meets discharge standards [6]. While only a portion of that energy can be recovered, it is possible and feasible for WWTPs to be net energy producers [7,8]. The re-conceptualization of WWTPs as resource recovery entities is occurring through efforts at individual plants [9] and federal legislation [10].
The U.S. Environmental Protection Agency has identified seven methods for improving the efficiency of WTPs and WWTPs [11]. Among those methods, fixing water leaks, using efficient pumping systems, Variable Frequency Drives (VFDs), lighting improvements and heating, ventilation, and air conditioning (HVAC) improvements are common energy saving measures. Two of the Environmental Protection Agency’s (EPA) recommended energy saving measures include improving the efficiency of anaerobic digestion and onsite cogeneration, which can be more difficult to assess and implement. Anaerobic digestion is a biological process during which microorganisms breakdown and stabilize sewage sludge in the absence of oxygen, prior to final treatment processes and disposal [12]. During anaerobic digestion, biogas is generated, which primarily consists of methane (CH4), carbon dioxide (CO2), and nitrogen (N2). The CH4 in biogas can be utilized in energy recovery from WWTPs via combustion in a boiler to generate heat. Alternatively, the CH4 can be utilized in cogeneration which is the combined generation of electricity and heat, also known as Combined heat and power (CHP). Despite the fact that 43% of U.S. WWTPs generate biogas with anaerobic digesters, as of 2011, only 3.3% utilize the biogas for electricity production via cogeneration [13]. Most of the biogas generated in WWTPs is flared to reduce CH4 emissions as CH4 is a more potent greenhouse gas than CO2. Major challenges in implementation of cogeneration in WWTPs include project development and operation/maintenance challenges [13]. Apart from the use of biogas for on-site heating or cogeneration, there are other potential uses as a transportation fuel or exporting as renewable natural gas or electricity [10].
While the direct use of biogas is promising from an energy recovery perspective, challenges remain, largely due to the presence of impurities in biogas. Aside from the major constituents of biogas (CH4, CO2 and N2), the impurities and other trace species include water (H2O), hydrogen sulfide (H2S), carbon monoxide (CO), ammonia (NH3), oxygen (O2), and siloxanes. Challenges occur due to daily and seasonal variations in impurity concentrations and downstream effects on the technology, the environment and human health. For example, H2S concentrations in biogas, which can vary by three orders of magnitude (from 0.005–2% [14]), can cause corrosion in engines and compressors, is toxic and can lead to other byproducts like sulfuric acid. In some of the early biogas recovery projects, boilers and turbines were operated without cleaning the biogas to remove siloxane and other impurities. That began to change in the early 2000s due to maintenance challenges, but the removal of some impurities like siloxane had the potential of making many projects uneconomical [15].
This paper aims to assess the current state of the art in biogas-fueled cogeneration energy recovery to enhance understanding and uncover opportunities for implementing projects. To enhance the project development of biogas-fueled cogeneration in WWTPs, a deeper analysis of the biogas impurities, biogas cleaning costs, cogeneration capital costs, and prime mover maintenance costs is needed. A techno-economic assessment of CHP in WWTP is provided to overcome one of the main challenges with implementation—project development—by providing a thorough assessment methodology for biogas-fueled CHP in WWTPs.

2. Materials and Methods

The general method applied for this study was to (1) identify a set questions that the review and assessment would seek to answer, (2) identify relevant studies to be included, and (3) analyze the references within the framework of the guiding questions. The following discussion provides a brief background to the guiding questions of this work. Biogas-fueled cogeneration or CHP systems are already available commercially. Among the many options, internal combustion engines, micro-gas turbines and fuel cells are the leading options being researched and installed [13]. To better understand the factors affecting the installation of CHP projects in WWTPs, a review of cogeneration technologies is undertaken. An essential aspect of this review is information regarding each system’s tolerance to various levels of contaminants in the biogas, capital costs, expected maintenance costs, emissions, and expected operating hours. The content of the biogas can vary significantly depending on a range of factors including the type of organic feedstock, operating conditions and any pre-treatment [14,16]. Sulfur (e.g., H2S) and silicon (e.g., siloxanes)-based impurities are particularly prone to causing corrosion and solid particle deposits in heat exchangers and prime movers. Assessing current technologies for their tolerance and lifetime expectations with these impurities is critical for the development of biogas energy recovery projects. Finally, this work develops a techno-economic assessment method for CHP systems in WWTP including the consideration of biogas composition, site-specific details regarding thermal or electricity demand, capital costs, maintenance costs and other site-specific information.
The questions that this study sought to answer are listed below:
  • What are the typical prime movers utilized for CHP in WWTPs?
  • What are the performance characteristics of current prime mover technologies including electrical efficiency, thermal efficiency, combined efficiency, power-to-heat ratio, part load efficiency and emissions at different power outputs?
  • What are the capital costs, expected maintenance costs and other economic considerations for CHP in WWTPs?
  • What is the tolerance of each prime mover technology to impurities in biogas?
  • What are the methods and characteristics of biogas cleaning technologies?
  • What techno-economic assessment methods should be utilized to assess CHP projects in WWTPs?
Relevant literature was identified using Scopus, Google Scholar and ScienceDirect databases. Keywords used in the search included “Combined heat and power”, “Cogeneration”, “Tolerance to biogas impurities”, “Wastewater”, and “Biogas composition”. The list of studies was checked manually by reading the abstract, methods and results sections to identify answers to the guiding questions. Studies that did not include related information were not considered. Studies that were identified while reviewing the initial papers were included in the list of literature. The selected literature was limited to peer-reviewed articles, book chapters and reports written in the English language. Only literature from 1998–2020 was included, with a focus on the more recent literature.

3. Results

3.1. Energy Recovery with Biogas

Wastewater treatment is an increasingly complex process as many technologies exist and are emerging in areas like particle aggregation, oxidation, disinfection, surface fouling mitigation, adsorption and biological transformation [17]. The overall process, which typically comprises preliminary treatment, primary treatment, and secondary treatment, aims to purify wastewater and convert it into a liquid effluent, which, most of the time, find its way to a receiving water body. A higher degree of treatment, called “advanced” or “tertiary” treatment, may sometimes be required to protect public health or environmental quality [18].
Preliminary treatment normally includes screening and grit removal for removing coarse, heavy, and inorganic solids. Primary treatment involves gravity sedimentation where slightly more than half of the suspended solids are removed [18]. The concentrated suspension of solids resulting from primary treatment is called primary sludge. Secondary treatment is usually accomplished biologically. Microorganisms in suspension, as in the “activated sludge” process, attach to media as a “trickling filter” or one of its variations, or are used in ponds or other processes to remove biodegradable organic material [19]. During the process, the microorganisms oxidize a part of the organic material to produce CO2 and other end products while the remainder works as food and energy support for the microorganism community. The microorganisms biologically flocculate to form settleable particles and this excess biomass is separated in secondary sedimentation tanks, right after the biological treatment, as a concentrated suspension called “secondary sludge” [19]. The final effluent can either be discharged to a receiving water body or further treated for reuse (i.e., tertiary treatment). Tertiary treatment may also be necessary if receiving water conditions obligate higher quality effluent than that produced by secondary wastewater treatment [18]. Disinfection for the control of pathogenic microorganisms and viruses, and nitrogen and phosphorus removal for the minimization of nutrient enrichment of surface waters, are examples of tertiary treatment operations [18].
Sludge resulting from wastewater treatment processes needs to be treated as well to reduce its volume, pathogen, bacterial and organic content. For this purpose, a wide variety of sludge treatment processes are used prior to disposal or use of the treated product, called biosolids. Details of those can be found in different resources [19,20,21]. In the context of this study, we focus on anaerobic digestion.
Anaerobic digestion (AD) is a process in which microorganisms break down biodegradable material (wastewater sludge in this case) in the absence of O2 to form CH4-containing biogas. The residual stabilized sludge leaving this process can be used as fertilizer or soil conditioner after a subsequent drying [22]. There are two types of conventional anaerobic digestion processes named after the temperature range they operate in: mesophilic and thermophilic [19]. Mesophilic digestion occurs in the range of 30–38 °C and is the most common type. Thermophilic digester operates in the rage of 50–60 °C. For efficient operation, it is important to maintain digester temperatures within a narrow range, which is typically from 35 °C to 37 °C for mesophilic digesters [23]. Therefore, digester heating is a critical (and energy consuming) component of the whole process.
Biogas contains 55–65% CH4, 35–45% CO2 and other trace gases such as H2O, H2S, NH3, siloxanes, N2 and O2 with a calorific value in the range of 19.7–23.3 MJ/m3 [24]. Biogas composition is highly dependent on the composition of the feedstock and type of digestion. Organically bound sulfur present in the proteins in the sludge results in H2S generation by sulphate-reducing bacteria [25]. Siloxane is preferentially absorbed in the sludge flocs during wastewater treatment. A large portion of the siloxane volatilizes from the sludge after reaching a temperature of 60 °C and ends up as biogas in the digester [26]. Some of the siloxane compounds are more soluble in water and have a higher vapor pressure (e.g., L2 and D3 siloxane). As a result, they are less likely to appear in biogas than other siloxanes (e.g., D4 and D5 siloxane) [26,27]. Siloxane can also end up in the biogas from silicones, which are added to the digester as anti-foaming agents. Siloxane concentration can reach up to 41 ppm in biogas obtained from WWTP, but the maximum in most cases is expected to be closer to 2–3 ppm [25]. Many other trace compounds exist in WWTP biogas, including halocarbons (1.9 ppm), aromatics like benzene (0.85 ppm) and toluene (2.3 ppm), alcohols and hydrocarbons [25].
With an efficient use, CH4 present in the biogas can help to significantly offset the energy consumption of WWTPs. Despite the fact that 43% of U.S. municipal WWTPs generate biogas with anaerobic digesters, as of 2011, only 3.3% utilize the biogas for electricity production [13]. Much of the biogas generated is flared into the atmosphere, losing the chemical energy that had potential use in the facility while contributing to global warming. Burton states that about 350 kWh of electricity can be produced from biogas for each million gallons of wastewater treated at a WWTP [28].
The challenges behind electricity generation from biogas include both project development and operation/maintenance [13]. The direct use of biogas in boilers for heating or for cogeneration is particularly challenging as the major constituents of biogas (CH4, CO2 and N2) and other trace species/impurities (H2O, H2S, CO, NH3, O2, siloxanes) can vary widely and the impurities have varying effects on the technology, the environment and human health. For example, H2S concentrations in biogas can vary by three orders of magnitude (from 0.005–2% [14]) and can cause corrosion in engines and compressors, are toxic and can lead to other byproducts like sulfuric acid. Therefore, impurities must be removed before the biogas is used as a fuel for electricity generation to prevent damage to the generation equipment [29].

3.2. Combined Heat and Power Technologies

Conversion of the original biodegradable wastewater organics into useful forms of energy remains a challenge, even after AD. Combustion of the CH4 can result in thermal energy for various processes including maintaining the digester temperature and heating buildings, but the actual need for that heat depends on the specific WWTP. The combustion of the CH4 followed by electricity generation in CHP can be beneficial as WWTPs require significant electricity for their operations [5]. CHP can result in ~28–40% of the original energy potential of biodegradable wastewater organics being converted to electricity, while another ~50–65% is available as heat [8]. Not all WWTPs have sufficient influent flow rate to be considered as feasible locations for CHP. However, in 2007, the U.S. EPA found that of the sites deemed appropriate for CHP, about half of the WWTPs utilized anaerobic digestion and only about 11% utilized biogas to generate either electricity or thermal energy [30]. Several other biogas-generating processes are available, and have been modeled and analyzed for use in fuel cells [31,32], but not for CHP systems in WWTPs.
Biogas-fueled CHP systems are available commercially for installation in WWTPs. Among the many options, internal combustion engines, micro-gas turbines, combustion turbines and fuel cells are the leading options being researched and installed in the U.S. [13]. A review of the current CHP technology for WWTPs is described in this section. An essential aspect of this review is information regarding each system’s tolerance to various levels of contaminants in the biogas, capital costs, expected maintenance costs, and emissions. The content of the biogas can vary significantly depending on a range of factors, including the type of organic feedstock, operating conditions and any pre-treatment [14,16]. Sulfur (e.g., H2S) and silicon (e.g., siloxanes)-based impurities are particularly prone to causing corrosion and solid particle deposits in heat exchangers and prime movers. Table 1 provides a general overview of current CHP prime mover technologies including typical size, common fuel preparation requirements, efficiency, installation costs and operation and maintenance (O&M) costs. The term ‘size’ denotes the electrical power generated by the prime mover at the specified ‘electrical efficiency’. The term ‘overall CHP efficiency’ denotes the efficiency of electricity generation plus the efficiency of heat recovery if the thermal energy generated in the prime mover can be recovered for use in the WWTP. The efficiency is calculated based on the higher heating value (HHV) of the fuel. The ‘turn-down ratio’ represents the ability of the prime mover to operate at partial capacity. In other words, if a gas turbine CHP system is rated for 500 kWe, but the plant only requires 300 kWe at some moment of operation, the turn-down ratio represents the gas turbine’s ability to generate only 300 kWe (partial capacity). Many CHP systems can operate down to 50% of their rated capacity with a limited reduction in efficiency.
In Figure 1, the number of installations of CHP systems in U.S. WWTPs between 1980 and 2018 is shown. The data were obtained from [35]. As shown, a significant increase in the number of installations occurred between 2000 and 2015. As WWTPs utilize biogas in CHP systems, reliance on utility-supplied natural gas and electricity decrease. One of the key economic considerations when installing a CHP system in a WWTP is the cost of natural gas. By plotting the U.S. industrial natural gas cost in Figure 1 (the data of which are available after 1998 [36]) a relationship between the gas cost and installations is shown. As the natural gas costs rise, utilization of on-site produced biogas becomes more financially viable, leading to CHP installations, albeit a few years later.

3.2.1. Prime Movers

Many CHP systems exist with different prime movers for electricity generation from biogas. The choice depends mostly on the system size required, biogas composition, and heating value. Figure 2 shows the breakdown of prime movers installed in current WWTPs in the U.S. It does not show the WWTPs that currently do not utilize CHP systems. Reciprocating engines are the primary prime mover used in WWTP CHP, which could be attributed both to the widespread commercial availability of these systems, their low cost, as well as the high electrical efficiency. Microturbines, while not the majority share of CHP systems in WWTP, also are widespread. In the following section, a detailed description of each prime mover is given along with a discussion of case studies for CHP systems installed in WWTPs.

3.2.2. Reciprocating Engine/Internal Combustion Engine

A four-stroke engine is one common type of internal combustion engine. The power cycle is completed with four strokes of a linear-moving piston inside a cylindrical combustion chamber. The following processes occur: (1) a working gas (air or air–fuel depending on the specific type of engine) enters the combustion chamber. (2) The gas is compressed by the linear motion of the piston. (3) A small explosion forces the piston across the chamber, expanding the gas once again. (4) The combustion products and gas are expelled from the system. The piston is connected to a rotating shaft which converts the linear mechanical energy of the piston to rotating mechanical energy of a shaft, which is then utilized in electricity generation via a generator [37].
Several key challenges exist for the direct use of biogas in each prime mover. For internal combustion engines, the removal of water, particulates, sulfur-containing compounds, gas pressure control and the removal of NH3 are all considerations. The condensation of acid gas and subsequent corrosion are concerns during startup and shutdown [38]. As a result, the gas and metal between the digester and engine should be maintained at a temperature above the dew point. Sulfur-containing compounds can lead to corrosion and engine oil contamination [38]. NH3 can lead to NOx emissions. For reciprocating engines, a H2S concentration exceeding 1000 ppm requires removal [38].
As of 2013, 45% of the CHP capacity at WWTPs in the U.S. was obtained via reciprocating engines [39], with 68.9% of installations in 2018 being reciprocating engines based on data shown in Figure 2. This may be due to their relatively high electrical efficiency, low cost and extensive amount of manufacturers building these systems [39]. One internal combustion engine CHP system in Austria maintains a 25% electrical efficiency and a 56% thermal efficiency for a total 81% system efficiency with biomass as the primary fuel source [40]. In an EPA model of a typical U.S. WWTP with an internal combustion engine, the overall CHP efficiency was found to be 71% with a power-to-heat ratio of 0.86, significantly higher than that of a microturbine [29]. One gas engine prime mover installed in a Finnish WWTP generates 736 kWe of electric power and 905 kWth of heat power which is enough to cover around 40% of the WWTP electricity requirements [27]. Reciprocating engines have also been deployed on farms to generate electricity for the grid from the biogas generated with livestock effluents [41].

3.2.3. Diesel Engine

Diesel engines are most often a four-stroke internal combustion engine, though diesel engines can also be built as a two-stroke engine. Unlike in a standard spark plug-igniting combustion engine, diesel engines utilize a fuel injector. As the air compression inside the combustion chamber reaches its peak, a small amount of fuel is injected into the chamber. By this point, the compressed air’s temperature has risen above the fuel’s auto-ignition temperature and the fuel spontaneously combusts, pushing the piston back across the chamber [37].
Diesel engines have been utilized in CHP systems, and have been found to have a thermal efficiency of roughly 45% and an electric efficiency of roughly 40% when using liquid biofuel [42]. This similarity in efficiencies can allow diesel engines to be relevant for both thermal and electric demand, where other prime movers may have far higher efficiencies in one form or the other (see the Stirling engine). When utilizing liquid biofuel, diesel engines also show a reduction or no change in carcinogen emissions. The EPA found reductions in emissions for several known carcinogens (acetaldehyde, formaldehyde, and naphthalene for example), and found no correlation between biodiesel fuel and standard diesel fuel for other carcinogens (benzene, 1,3-butadiene and toluene) [43]. This has been attributed to the higher O2 content in biodiesel fuels and the chemical difference in soot particles in biodiesel and standard diesel fuel [44].
Limited data on previously installed diesel engines for CHP in WWTPs limit the ability to present accurate industrial data. However, a recent model of a WWTP in Southern Italy showed that installation of a CHP system with this prime mover could reduce their sludge export by up to 68%, by utilizing waste vegetable oil purchased from outside the plant for the diesel engine CHP system. This system would also reduce total CO2 emissions from the plant, and lower the energy cost of the plant by 35% through using their waste instead of relying as heavily on the electric grid [45].

3.2.4. Stirling Engine

The Stirling engine, first patented in 1816 by Robert Stirling, is another type of heat engine that can have a reversible cycle. Working in tandem with an external heat source and an external heat sink, a Stirling engine relies solely on gas pressure differential to move internal pistons [46]. The ideal thermodynamic cycle for this engine, the Stirling cycle, as shown in Figure 3, has two isothermal processes and two isochoric processes [46]. For the theoretical Stirling cycle, the internal gas begins by offloading heat to the external heat sink in an isochoric process. This internal gas is then heated and compressed in an isothermal process, increasing the overall pressure while maintaining temperature. The gas then absorbs heat from the external heat sink in an isochoric process. Isothermal heat addition and expansion reduce the pressure of the system. This is similar to a Carnot thermodynamic cycle, and the two are often compared as both operate in external combustion engines and can theoretically garner close to the same maximum system efficiency [47].
Stirling engines generate minimal noise, which could allow their use in residential areas [48]. The combination of Stirling engines’ efficiency, minimal noise production, and a lack of explosive combustion reactions needed to move the engine have allowed their usage in many different industries. The Stirling engine has been utilized in refrigerators [49], solar energy generation via concentrated solar radiation [50], and in micro-CHP systems [51].
The Stirling engine better suits a smaller CHP system, as most tend to fall in the below-200 kilowatt category [33,34]. Stirling engines are also noted for their low electric-power-to-thermal-power ratio. For example, one recent Australian case study for a micro-CHP system utilizing a Stirling engine found an electric efficiency of 15%, but a thermal efficiency of 80% [52].
Stirling engines have been utilized in industrial micro-CHP systems with a wide array of fuel types. Due to their low fuel usage, Stirling engines are a prime technology in a CHP system fueled by biomass [53]. This is particularly useful for WWTPs for the direct use of biogas. The biogas could also potentially be directly utilized as the working fluid for a Stirling engine [53]. As Stirling engine micro-CHP technology improves, investment in this prime mover for a biogas-integrated system will begin to be more feasible. Stirling engines can also provide a “slight advantage” over a standard internal combustion engine for risk analysis for a biogas-integrated system [53]. However, their small size and low electrical efficiency are two reasons why few Stirling engines have been installed in WWTPs.

3.2.5. Gas Turbine

The gas turbine is a type of internal combustion engine that relies on the Brayton thermodynamic cycle to produce mechanical or electrical power. Gas turbines can be either open or closed cycle, though the ideal Brayton cycle is typically open cycle. For CHP systems an open-cycle gas turbine is most normally used [54]. The ideal Brayton cycle starts with an isentropic compression process in a gas compressor, which heats up the working gas. The working gas then moves through a combustion chamber and is heated in an isobaric process prior to entering the turbine. After driving the isentropic turbine to generate mechanical power or electrical power if a generator is present, the working gas is expelled [54]. An actual gas turbine using the Brayton cycle does not follow this pattern exactly, as Figure 4 demonstrates. By generating electric power via the turbine, and expelling the hot working gas, the gas turbine can be a CHP system.
As of 2015, gas turbines were the primary prime movers in CHP systems across the U.S., accounting for 63% of the total CHP capacity of the country [54]. Most of these systems are found in large-scale power plants. Steam turbines are the most common users of the exhausted thermal energy from the gas turbine cycle. Due to the gas turbine’s high exhaust temperatures, the steam turbine is able to efficiently generate electricity and low-pressure steam which can then be further utilized to mitigate a facility’s thermal demand [54]. Gas turbines rely heavily on natural gas as the primary fuel. Natural gas usage in the power sector is projected to remain at roughly 20% of the total power fuel share through 2040 [56].
Gas turbine CHP systems have been used across a wide array of industries, from credit unions [57] and food-processing facilities [58] to casinos [59] and WWTPs [60]. As evidenced by a 2001 economic analysis, gas turbines can provide large annual savings when utilized in a CHP system (USD 50–110/We) [61], which allows them to be competitive against other prime movers. For WWTPs, biogas can also be substituted as the fuel, rather than natural gas, which allows the gas turbine CHP systems to be more cost effective in WWTPs. Despite this opportunity, in WWTPs in the U.S., in 2015, only three utilized gas turbines. Micro gas turbines (gas turbines smaller than 500 kWe [24]) are far more prevalent, especially in smaller WWTPs [3], due to their better size match and more rapid startup capabilities.

3.2.6. Micro Gas Turbine

Micro gas turbines operate in a similar fashion to standard gas turbines, albeit usually smaller in both physical and CHP size. Scaling down the size of a gas turbine has some effects on the system, both positive and negative. Heat loss from the system increases due to the higher surface-to-volume ratio, which can potentially reduce the efficiency of the combustor. Fuel used within the system must also be either pre-mixed or have a shorter combustion time as the smaller size reduces the total time for combustion reactions [62]. However, micro gas turbines also offer several advantages over other prime movers: their size allows less facility space to be wasted, they typically run at a high power-to-weight ratio, and their start up time is relatively quick [63].
Micro gas turbines are frequently investigated for use in WWTPs. Helel et al. found that a micro gas turbine system provided the highest power-to-heat ratio of several CHP prime mover technologies and was the most economic over time for a WWTP in Toukh, Egypt [64]. Bin Basrawi et al. correlated the size of micro gas turbine CHP systems to the scale of the sewage plants studied [65]. Movahed et al. created a techno-economic optimization for a biogas-fueled micro gas turbine dependent on various proposed energy cost incentives and programs in Iran [66]. The utilization of micro gas turbines in WWTPs in the U.S. is mostly limited to smaller WWTPs. In 2015, Shen et al. found that, across the active WWTPs with an average flow rate of 100–1000 million gallons of wastewater per day (MGD), none were utilizing microturbines for CHP. However, for the WWTPs with a 1–10 MGD flowrate, 18% of those that generated power used microturbines [3].
Micro gas turbines are feasible for installation in WWTPs as long as they are properly sized. Proper sizing is key, as running at part-load typically depreciates both thermal and electric efficiency quickly for micro gas turbines [67]. In smaller WWTPs, micro gas turbines can be recommended to utilize a large portion of the site’s electric or thermal demand, while in a larger WWTP this may not be the case. A standard gas turbine should be utilized instead.

3.2.7. High and Low Temperature Fuel Cells

A fuel cell converts chemical energy into electrical energy through a chemical reaction and a series of electrodes. The hydrogen-rich fuel is moved across an electrode (anode) and adsorbed on the electrode materials [68]. An electrolyte membrane adjacent to the anode allows for the flow of the positive ions from the anode to another electrode (cathode) in the case of a polymer electrolyte membrane (PEM) fuel cell [69,70]. In the case of solid oxide fuel cells (SOFCs), O2 ions are transported through the electrolyte from the cathode to the anode side [71]. The electrons move from the anode to the cathode via an external circuit. An oxidant (typically O2 from air) moves through the porous cathode, reacting with the hydrogen ions to create water in PEM fuel cells. In SOFCs, the water is generated on the anode side from the O2 ions reacting with hydrogen, CO or hydrocarbons [72,73]. The water (and CO2 in the case of SOFCs using CO or hydrocarbons) exits the fuel cell [74].
Fuel cells have advantages over other prime movers for small system sizes (<100 kWe) as the total combined efficiency can remain high (>53%), even for small units, emissions are lower and operating costs are reduced [41]. Fuel cells have a higher capital cost than other prime movers which increases the investment payback period. However, for scenarios where electricity is the primary need, fuel cells can be competitive with engines over a longer investment horizon [41]. H2S is a concern for fuel cells, as anode poisoning is common and requires cleaning equipment for the biogas to ensure the longevity of the fuel cells [75]. PEM fuel cells have limited fuel flexibility and rapid startup capabilities [68], while SOFCs a have high fuel flexibility, but a slow startup due to stringent sealant constraints [76].
In the early 2000s, significant growth in the installation of fuel cells for CHP in WWTPs occurred [4]. Although fuel cell systems are costly to install, the growth was partially a result of the increased regulation of emissions. For example, phosphoric acid fuel cells were installed in WWTPs in Japan in 2002 [77]. Solid oxide fuel cells have also become a priority in the Japanese residential sector, with the Fuel Cell Development Information Center setting a goal of 5.3 million micro-CHP systems (50 kWe) in residential settings by 2030 [78]. The development of fuel cell technology for use in CHP continues, especially at the residential scale [68,79], though with some large barriers. Current fuel cell technology can require frequent change-outs of the fuel cell stacks, and development costs can become large quickly due to the short life cycle of fuel cells in CHP settings [75]. Microbial fuel cells are another potential technology for use in WWTPs, but limited installations are occurring in WWTPs as high costs and low conversion efficiency remain a challenge [8].
One case study that analyzed a WWTP looking to implement several CHP technologies found that while fuel cells required the largest cash flow with time, the electric output of fuel cells was far greater than the cash flow required when compared to other technologies [64]. At a WWTP in Collegno, Italy, a techno-economic assessment showed that installation of a SOFC could decrease the levelized cost of energy (LCOE) of the WWTP by 50% when compared to other CHP technologies [75]. In the U.S., 12 of the 235 WWTPs utilize fuel cells for CHP as shown in Figure 2, but fuel cell installations are growing in other sectors [35]. In 2015 only five WWTPs of the 305 with a flow rate of less than 100 MGD were utilizing fuel cells for CHP [3].

3.2.8. Combined High Temperature Fuel Cell with Gas Turbine

By combining fuel cells and gas turbine technologies rather than solely utilizing a fuel cell, up to a 50% increase in electric output can occur with a total efficiency increase of 2–5% [80]. These systems operate utilizing a high temperature fuel cell, usually a SOFC, and a micro gas turbine (MGT). The hot gases expelled from the SOFC are combusted and expanded in the turbine. Pressurizing the gases in the compressor prior to entering the SOFC raises the electrical efficiency of the SOFC [81]. This approach can be a high electrical efficiency option, especially for small-scale CHP [82]. Use of these combined systems is also being explored for auxiliary power units in the transportation sector [83].
Economically, adding a SOFC–MGT system is generally more manageable compared to a conventional fuel cell CHP system, with an LCOE 50% lower than that of an SOFC CHP system in the short term [75]. One study also found the payback period for an SOFC–MGT system to be 30% shorter than that of an SOFC CHP system. However in the long term, the LCOE of the SOFC matches that of the SOFC–MGT due to the high electrical efficiency of the SOFC [75]. One barrier SOFC–MGT systems face to achieve widespread use, like SOFC systems, is the high capital cost of investment. Further development of these technologies will be required to make this technology more economically viable for WWTPs [84].

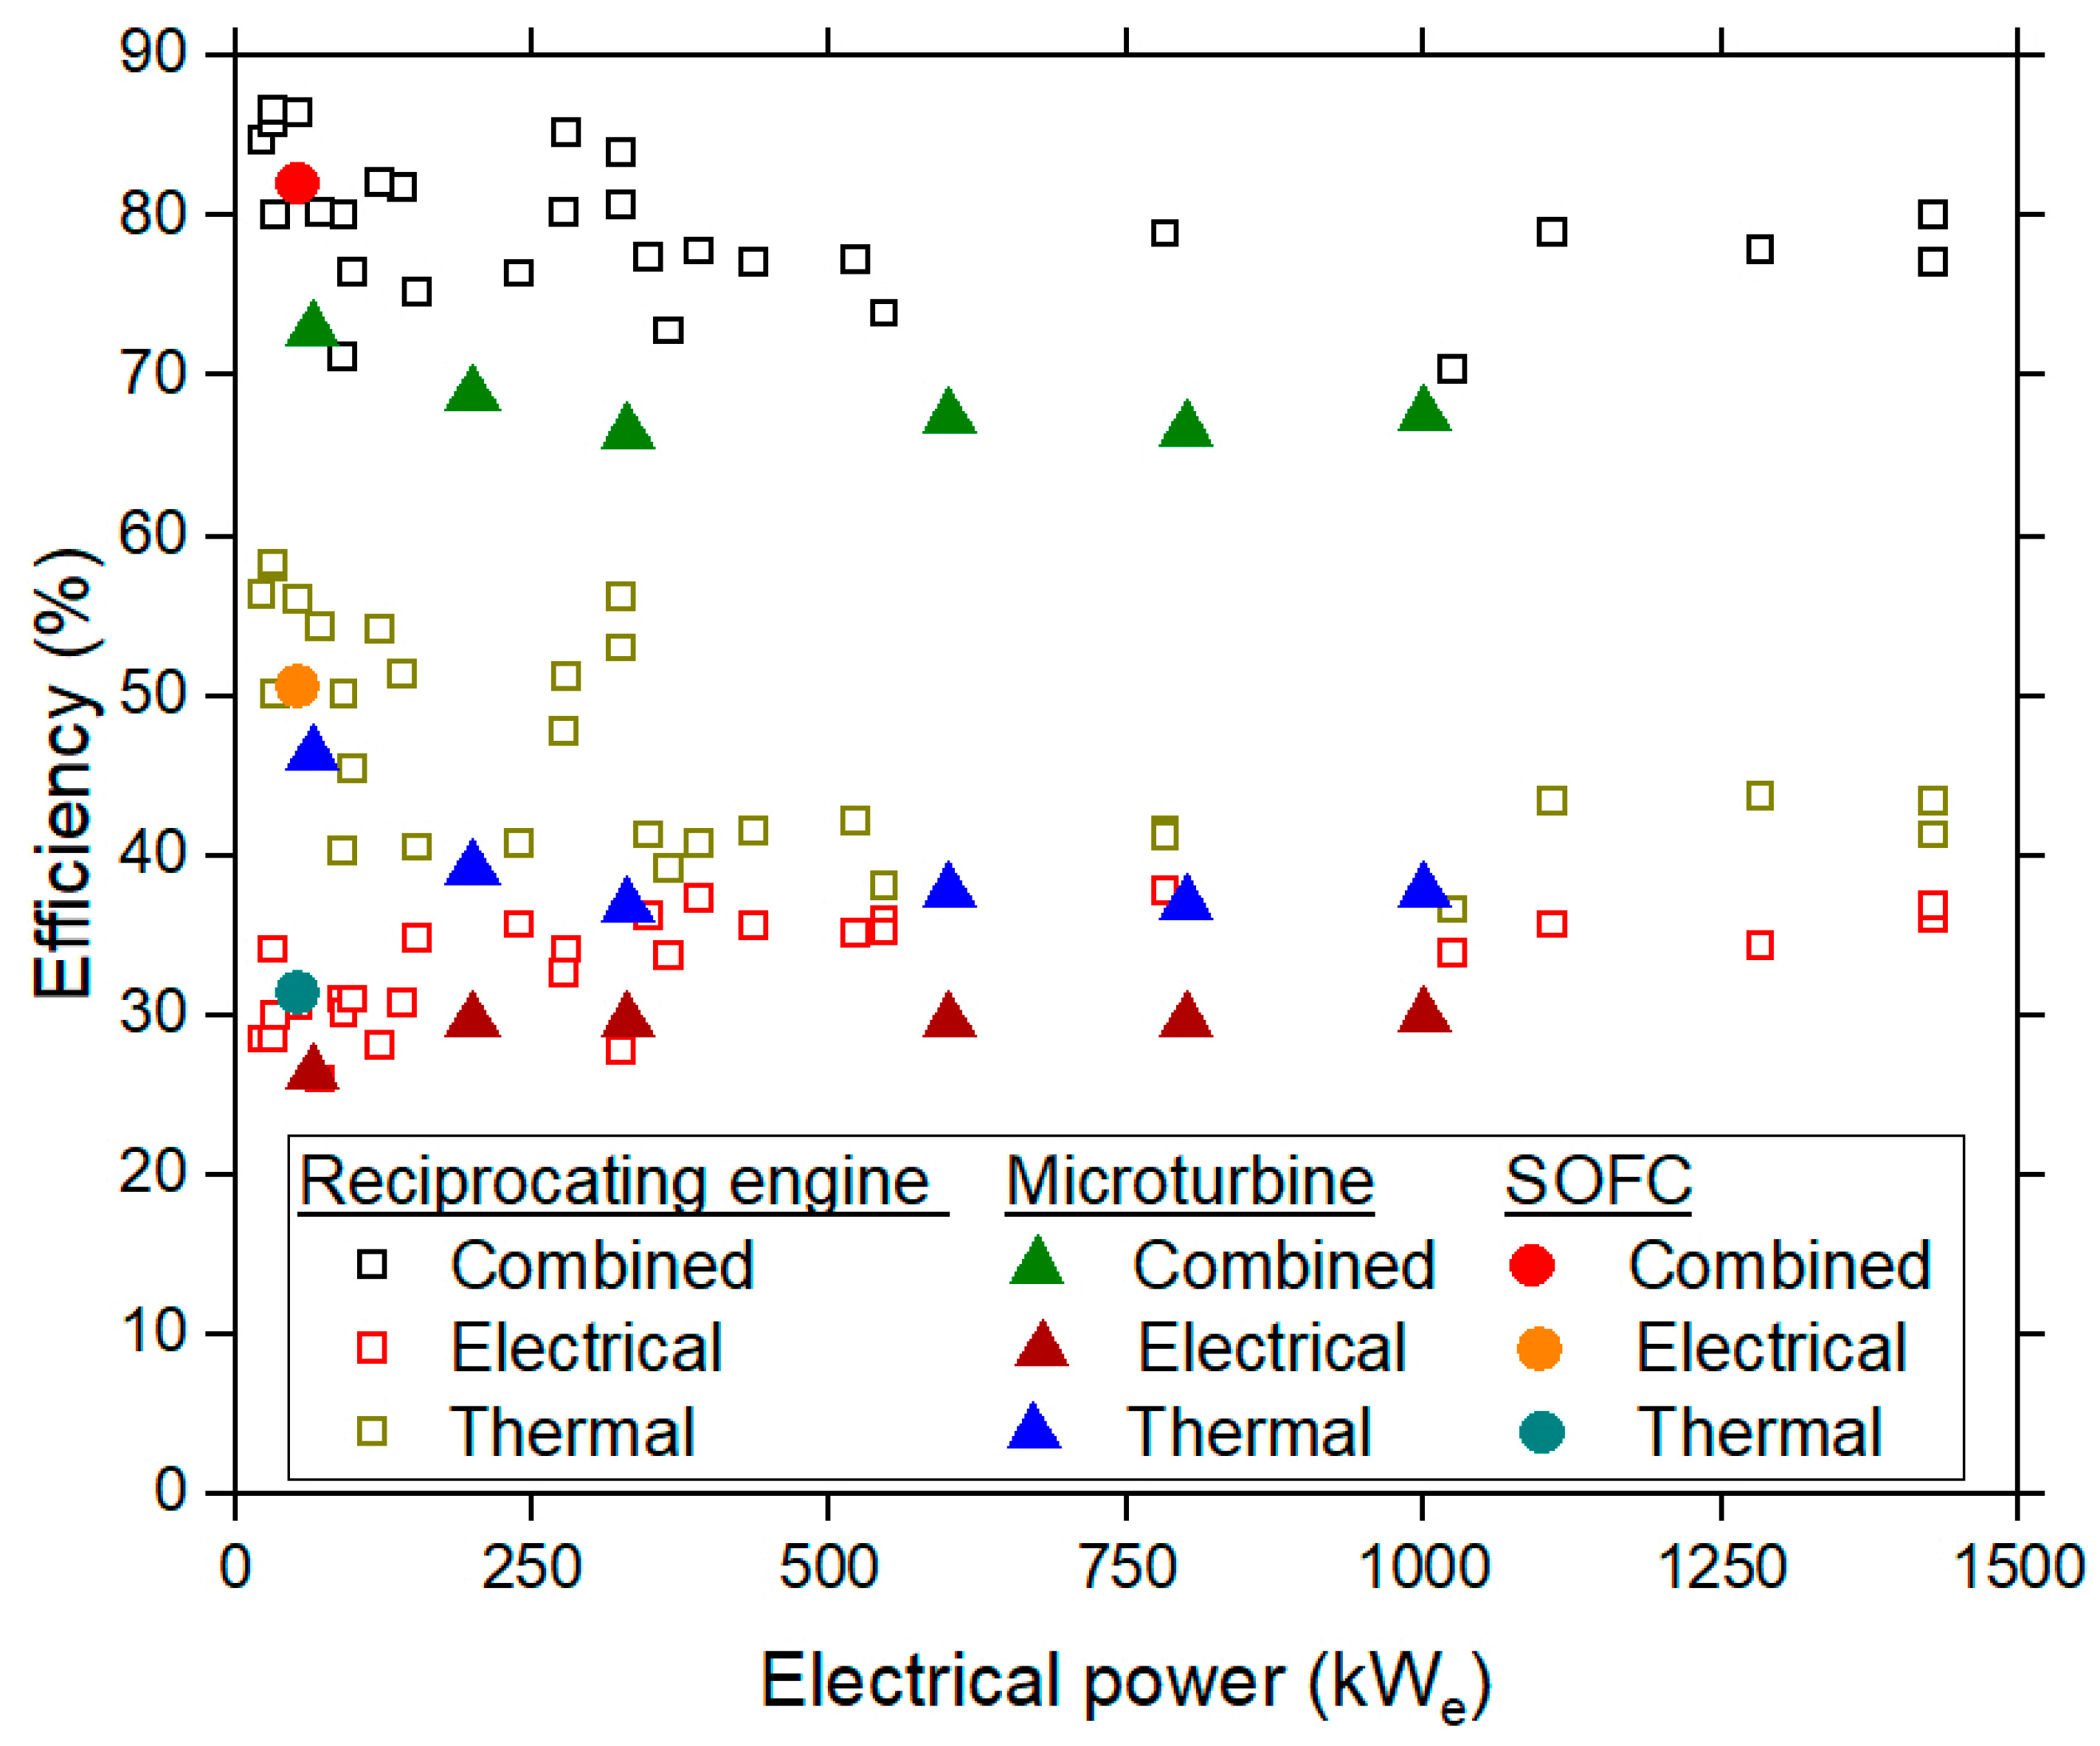
3.2.9. Performance Metrics

Table 1 provided a general overview of the performance characteristics for CHP systems. Figure 5 provides an overview of the electrical, thermal, and combined efficiency of reciprocating engine and microturbine-based CHP systems that are commercially available. This figure (in addition to Table 1) can be used to estimate the efficiency of these systems when calculating the energy savings. The electrical efficiency, thermal efficiency and combined efficiency data for micro-turbines and reciprocating engines were obtained from the Combined Heat and Power eCatalog [35]. The SOFC data were obtained from a 53-kWe system from the DEMOSOFC project [85].

3.2.10. Tolerance to Impurities

Biogas-fueled CHP systems that have heat engines as prime movers (gas turbine, micro gas turbine, reciprocating engine, Stirling engine) operate by oxidizing CH4 in a combustion chamber, which generates thermal energy and ultimately drives a piston or turbine. The resulting shaft work is converted to electricity in a generator. Fuel cells operate by electrochemically oxidizing the CH4 and generate electricity directly. CH4 is the primary fuel in each prime mover. N2 and CO2, which are also present in biogas, generally do not damage the prime mover, but they do dilute the fuel and reduce the performance. Trace impurities such as H2S, CO, NH3, and siloxanes can have a more detrimental effect on the prime mover. The oxidation of H2S can form sulfur dioxide (SO2) and sulfuric acid (H2SO4) which lead to the corrosion and breakdown of the prime mover. The oxidation of siloxanes can form silicon dioxide (SiO2, solid phase) in the combustion chamber, which can damage the turbine and piston. Generally, the prime mover can handle a small amount of these impurities, but if the concentration of impurities is left uncontrolled the CHP lifetime can be reduced to only a few years.
Impurity damage to the prime mover can take many forms. During long-term operation on biogas, impurities in biogas can lead to solid deposition on the engine’s piston cylinder head. The deposits tend to primarily consist of silicon, O2 and calcium [26,86]. Recent research has shown that the initial layer deposited in reciprocating engines, which is in direct contact with the aluminum piston cylinder wall, primarily consists of silicon [87]. The previously deposited silicon compounds create conditions that appear to promote the deposition of calcium and sulfur. The hardness of silica leads to the abrasion of the gas engine and turbine components. In addition, silica is a thermal insulator (which increases the temperature of engine components) and an electrical insulator (which affects monitoring and spark plug functioning) [26]. Other negative impacts of the deposition include an increase in CO and formaldehyde emissions [88].
Table 2 provides typical specifications for the tolerance of each prime mover to common biogas impurities. Different manufacturers have their own specifications for the tolerance of each prime mover to impurities, which accounts for some of the variation shown. In the case of fuel cells, the variation in impurities is also a result of different fuel cell types, which have different operating temperatures and materials. Fuel cell exposure to H2S results in sulfur poisoning of the anode and a significant increase in anode degradation when the concentration is above 1 ppm. This has been well documented in the literature and several example studies are given in Table 2. When fuel cells were in the early stages of development, their tolerance to siloxane was listed as 100 ppb(v) by one manufacturer [15], but a growing body of literature indicates that even this low concentration can result in rapid, irreversible damage to the fuel cell anode [12,89,90,91]. Some research has found that the siloxane accumulates near the nickel particles in the fuel cell anode and causes irreversible degradation [92]. Note that prime mover tolerance to NH3 is less reported in the literature. The main restriction on NH3 concentration is determined by limits on NOx emissions which increase with NH3 oxidation [93].

3.2.11. Cleaning Systems

Biogas is usually cleaned of several gas species and particulates to prevent corrosion and mechanical wear in downstream processes. Cleaning processes generally fall under three categories, namely physical, chemical and biological [25]. The removal of water, H2S and CO2 from biogas has been a common practice for many years using various techniques, including adsorption and absorption techniques, activated carbon, and membrane separation, among others [98]. More detailed reviews on cleaning technologies, especially for H2S and siloxane removal should be referenced for further information [25,88,99]. Key considerations for different cleaning technologies include the concentration of impurities, impurity removal requirements, biogas production rate, and the consideration of other impurities that may be added during clean up.
Biogas leaving the digester is saturated with water. As a result, water can easily condense if the biogas is cooled. Water removal from the biogas is necessary because it can accumulate in gas lines, react with other gases (NH3, CO2 and H2S) to form corrosive acidic solution and decrease the heating value of the fuel [98]. Water is removed by decreasing the temperature or increasing the pressure, causing condensation, through methods such as cooling, compression, absorption or adsorption. Burying the line with biogas and adding a condensate trap is an example of cooling the water and cleaning. Water can also be removed through adsorption with silica, activated carbon, or molecular sieves.
H2S is a colorless gas that is toxic and can cause corrosion in the prime mover. Specifically, H2S oxidizes to form SO2, which can react with water to form sulfuric acid. SO2 emissions are also regulated and must be kept below specified thresholds. While H2S has a characteristic smell at low concentrations, it does not smell at higher concentrations, which are often more dangerous [98]. It can be partially removed in the digester or cleaned up later. Biological aerobic oxidation of H2S based on Equation (1) below can be used to reduce H2S levels to 20–100 ppm with 80–99% removal [98]. Another common approach for H2S removal is dry desulfurization [77]. In dry desulfurization, the chemical adsorption of H2S on iron oxides (Fe2O3) forms iron sulfide (based on Equation (2) below). Other metal oxides such as ZnO, CuO, MnO, and TiO2 have all been explored for similar desulphurization processes as iron oxides [25]. ZnO has been effective at reducing the concentration of H2S from 17 ppm to 1 ppm [100]. Another method is the addition of iron ions to the digester to precipitate iron sulfide which is removed with the digestate (Equation (3)). This method has been effective at reducing H2S concentrations down to 100 ppm [98]. H2S can also be adsorbed on activated carbon, absorbed with liquids or oxidized by microorganisms using small amounts of air or pure O2:
2 H2S + O2 → 2 S + 2 H2O,
Fe2O3 + 3 H2S → Fe2S3 + 3 H2O,
2 Fe3+ + 3 S2− → 2 FeS + S,
The removal of other common gases like CO2, O2 and N2 can also occur. CO2 is a well-known asphyxiant, toxic compound that is recognized as one of the main greenhouse gases in the atmosphere. While CO2 is typically not removed for CHP applications, it must be removed if the biogas is going to be upgraded to natural gas quality [98]. Removing CO2 does provide advantages for CHP use as it increases the heating value. The removal of O2 and N2 requires processes such as adsorption on activated carbon, molecular sieves, or membranes, but the process is difficult, requiring significant expense. Removing N2 can improve the fuel’s heating value, while removing O2 reduces the undesirable oxidation of the fuel, known as engine knock, in the combustion chamber.
NH3 is a lachrymatory gas [98]. When it is combusted in a flare or CHP system it forms oxides of nitrogen (NOx), which are increasingly regulated. Separate cleaning of NH3 is usually not necessary as it can be removed during upgrading or when the gas is dried.
Siloxanes have silicon–oxygen bonds and usually originate from products like deodorants or shampoo. While siloxanes are not considered a significant health risk, some compounds may have adverse effects. For example, L2 siloxane can cause skin irritation while D4 siloxane may be carcinogenic [27]. Silica (SiO2), a white powder, is formed during siloxane oxidation and can deposit on surfaces. Silica deposition on catalysts used for biogas cleanup have resulted in rapid deactivation and damage within hours or days [15]. Siloxane is removed by cooling biogas, adsorption on activated carbon, activated aluminum or silica gel or by absorption in liquid mixtures of hydrocarbons. Adsorption on activated carbon is one of the older and more established techniques for siloxane removal, but the results have been mixed. Several previous experiments found that the siloxane adsorption capacity in activated carbon, the point where siloxane breakthrough can be detected, is in the order of 0.4–1.5 weighted percent of siloxane [15]. However, rising levels of L2 siloxane at the outlet of the activated carbon have been observed in several tests, raising concerns about the effectiveness of the removal process [15]. Later research indicates that more volatile compounds, like L2, which are initially adsorbed, are ultimately replaced by less volatile compounds which can render siloxane removal ineffective [88]. Pre-drying of the biogas before utilizing activated carbon is also required as the higher moisture content reduces the loading capacity [88]. Silica gel [101] and metal oxides like alumina [102,103] and CaO [104] have shown the potential for a higher siloxane capacity than activated carbon. Gas and surface analyses have shown that reactive adsorption of the siloxane at the metal oxide occurs according to Equation (4) below [104]. Absorption is also a common method for siloxane removal [88]. A combination of compression to 2517 kPa (365 psig) and refrigeration of the biogas to 4 °C resulted in the removal of 15–50% of siloxane gas due to an unknown mechanism that primarily removes D4 siloxane [15]. Cooling to a lower temperature (−30 °C) may result in up to 95% siloxane removal. Estimated costs for this removal can be seen in Table 3.
[(CH3)2SiO]3 + 6 OH → 6 CH4 + 3 SiO2 + 3 O2−,
Particulates or dust typically need to be removed from biogas. Depending on the requirements of downstream systems, much of the dust is removed with water [98]. Particulates may also need to be removed with mechanical filters. Fabric filters are well proven for particle removal of <10 microns [38].
The removal of each impurity, especially water, H2S and siloxane, is advised for CHP installations and cost estimates for each removal technology (based on the total flowrate of biogas) are shown in Figure 6. Capital costs for cleanup are significant and represent one of the obstacles in achieving the economic use of biogas. This is especially true for prime movers with higher capital costs, like fuel cells [25]. While the capital cost of cleanup remains a challenge for implementation, the cost of additional maintenance must be considered. Silicon deposition can lead to a five- to tenfold increase in maintenance [27], decreasing the time between full maintenance from 20,000–40,000 h to 2000–4000 h and as little as 200 h [26]. Cleanup of the siloxane can be economical in comparison to the increased maintenance costs [27].

3.2.12. Upgrading Systems

Upgrading biogas refers to the removal of contaminants to increase the purity of the CH4, often to greater than 95%. Different standards exist for the concentration of each of the species [98]. In some countries, the upgrading of biogas to bio-CH4 has increased significantly. Sweden saw an increase from 20% of biogas being upgraded in 2001 to 50% being upgraded in 2011 [105]. There were around 100 plants for upgrading biogas in 2009 [99]. Biogas can be upgraded for injection into the grid for domestic use, power generation [106] or as a vehicle fuel. Requirements for several countries in Europe have been documented [99].
The general process for upgrading biogas is to remove the water and H2S followed by the separation and removal of CO2 through pressure swing absorption, membrane separation or physical or chemical CO2 absorption [98]. After that, the gas is cooled, compressed, dust is removed, and the gas is odorized for safety. The economics of biogas upgrading depend on the technology and location. A brief description of processes for CO2 removal are described here with more detailed reviews available elsewhere [105,107].
Pressure swing adsorption (PSA) occurs when gas is selectively adsorbed to solid surfaces, which causes separation. It can be used for CO2 removal, but water and H2S will cause irreversible damage if not removed during pre-treatment. CH4 losses of 2–5% are common, but some plants have found losses of 10–12% [105,107]. While PSA was the dominant technology on the market, that has changed in the last two decades to include many more technologies [105]. Pressurized water scrubbing (PWS) is a simple and widely used method of absorbing CO2 through the counter-current motion of water and biogas. A high pressure of 7–10 bar is typically required [41]. The advantages of this process include a low loss of CH4 (possibly < 1%) and the removal of contaminants like H2S and NH3 as long as their concentration is low. Discrepancies exist for water scrubbing technologies, with some suppliers claiming < 2% losses of CH4 while up to 18% has also been reported [105]. Other physical absorption processes similar to water scrubbing exist and typically utilize organic solvents such as methanol or dimethyl ethers. Cryogenic separation is also being developed which has the advantages of high purity CH4 with low loss [108], but is energy intensive.
While generating biogas in an AD and using CHP is one means of energy recovery from WWTP, many alternatives and additional process steps are being considered. Even after generating biogas in an AD, significant amounts of solid sludge remain. The sludge can be dried and used as fertilizer. Alternatively, many approaches can be used to generate additional biomass fuel. Some examples include dewatering, pelletization [109], torrefaction [109,110,111], pyrolysis [109,112], gasification [112], combustion [112], and hydrothermal carbonization [113]. In pyrolysis and gasification, the solid sludge can be broken down to form H2, CO, and CH4 gases.

3.2.13. Emissions

As the impact of global climate change and environmental damage continues to grow, regulations play an increasingly important role in technology development. For CHP systems using biogas, regulations on oxides of nitrogen (NOx), CO, hydrocarbons (CxHy), and sulfur oxides (SOx) are common. Regulations on emissions tend to vary based on the prime mover type, prime mover size (e.g., 50 kWe compared to 1 MWe), engine efficiency and country. As an example, in the Netherlands, the following formula (Equations (5) and (6)) for NOx emissions has been utilized for engines [98]. From these equations, engines with higher electrical efficiency are permitted to have higher emissions, as are smaller sized engines:
For new engines less than 50 kWe: 800 g NOx/GJ × 1/30 of the Engine Efficiency =
Emission Limit (g NOx/GJ),
For new engines greater than 50 kWe and less than 50 MWe: 140 g NOx/GJ × 1/30 of the
Engine Efficiency = Emission Limit (g NOx/GJ),
The challenges associated with meeting emissions requirements vary with the prime mover. Reciprocating engines can have higher CO and hydrocarbon emissions operating with biogas than with other fuels due to a lower heat release rate during combustion [114,115]. Preheating or blending the biogas with other fuels can help reduce the NOx and hydrocarbon emissions, although the effect may increase the CO emissions in some cases [116,117]. Figure 7 provides emissions data from reciprocating engine and microturbine-based CHP systems that are commercially available. This figure can be used to estimate the total emissions of NOx, CO and non-CH4 hydrocarbons (NMHC). The NOx, CO and NMHC data for micro-turbines and reciprocating engines were obtained from the Combined Heat and Power eCatalog [35]. The SOFC data from a 53-kWe system were obtained from the DEMOSOFC project [85].

4. Techno-Economic Assessment of Combined Heat and Power in Wastewater Treatment Plants

The previous section outlined the techno-economic considerations for installing a CHP system in a WWTP. In the following section, a techno-economic assessment procedure is outlined for sizing, assessing electric demand and usage savings, and the capital and O&M costs for CHP systems installed in WWTPs. As many WWTPs currently in operation could benefit by adding CHP, the techno-economic assessment is conducted based on the WWTP’s current operating conditions such as on-site thermal demand, electric demand, and electric usage. There are many ways to conduct this analysis. The general procedure in this work was to first size the WWTP’s total thermal demand and then to assess how much of that thermal demand can be met by the CHP system. Any thermal demand not met by the CHP system due to insufficient biogas is provided by the systems currently in place in the facility. This demand not met by the CHP system will not be calculated. The procedure is generalized to be applicable for any prime mover with the performance parameters and costs used in the analysis determined by the specific prime mover.
Following the procedure, a case study analysis is given, and the results are compared for a common WWTP. To complete this techno-economic assessment, several factors were generalized or assumed. The characteristics of the WWTP chosen for the case study were selected to represent a common facility. For a specific WWTP, hourly variations in total biogas generation, thermal demand and electric demand will require a dynamic analysis to gain a more accurate assessment of the costs of implementing a CHP system in the WWTP. The analysis assumes that the current thermal demand for the WWTP is met by natural gas via a standard boiler, and that natural gas will be the fuel utilized in the CHP system if it requires more fuel than the annual on-site biogas production.

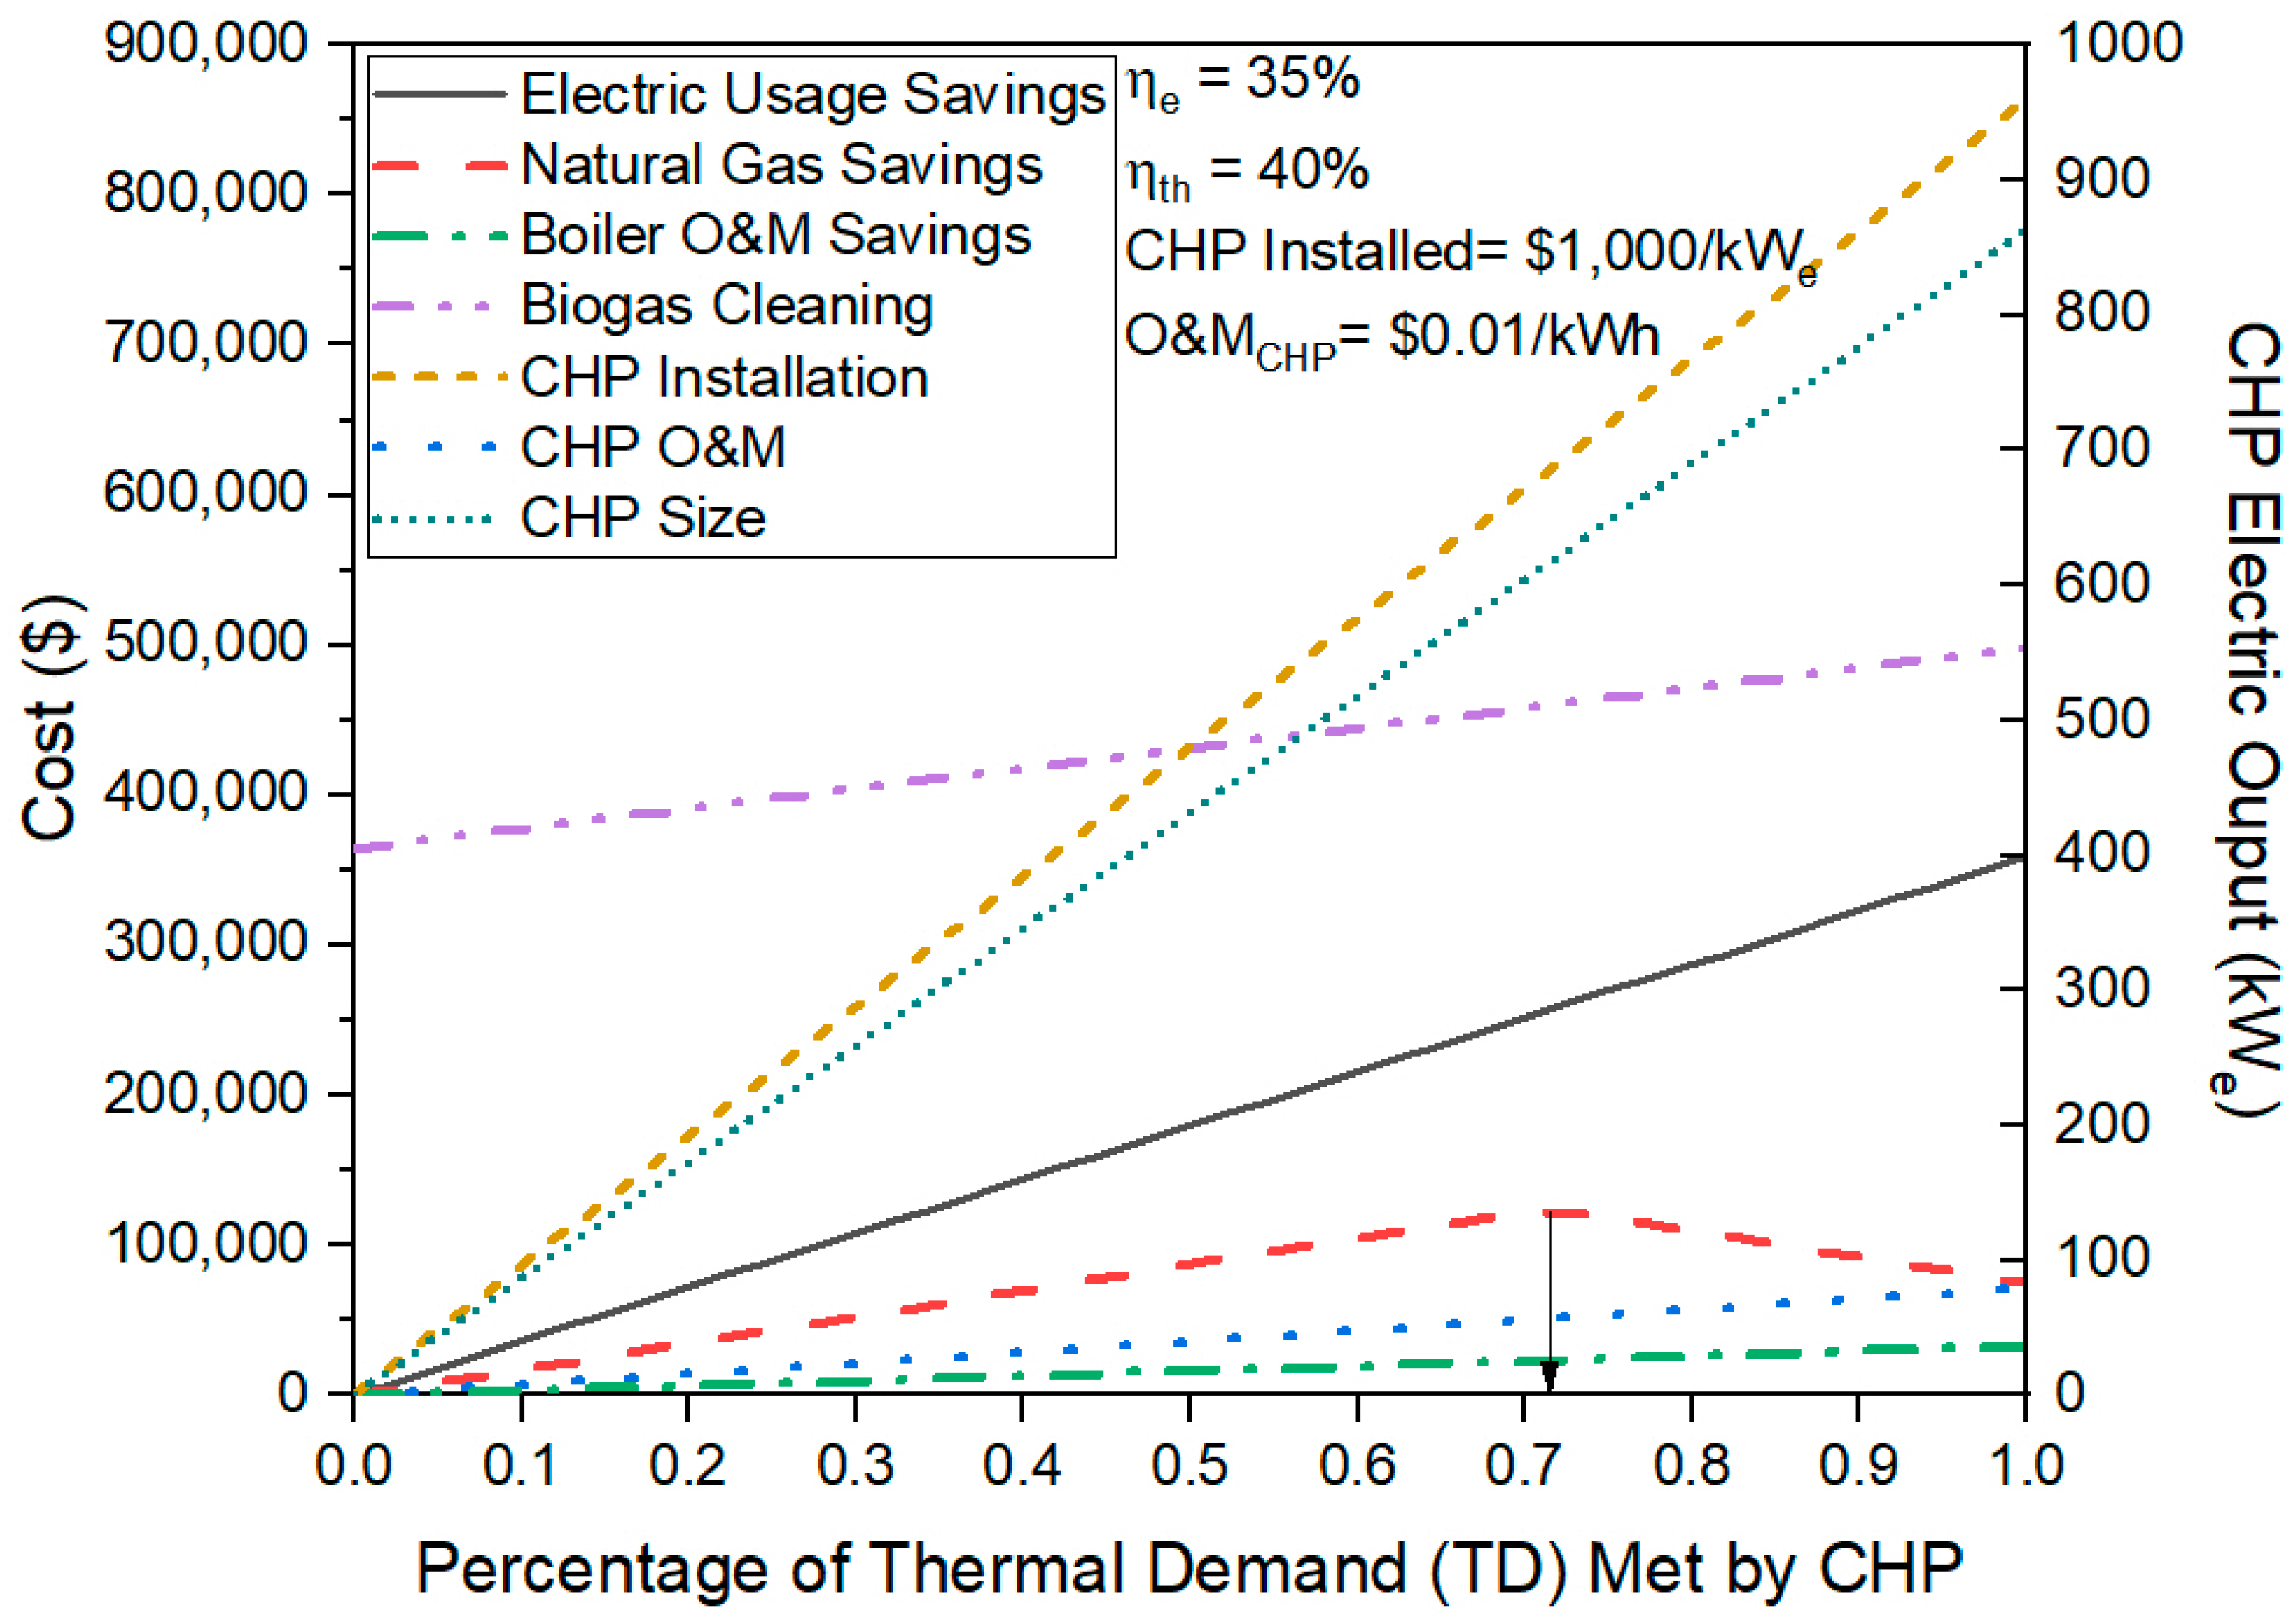
4.1. Annual Energy and Cost Savings

4.1.1. WWTP Thermal Load

Determining the current annual on-site thermal demand allows the assessment to be based on the CHP system’s ability to meet a certain threshold of a WWTP’s annual thermal demand. The annual thermal demand of a WWTP is the total energy needed for meeting heating requirements and can include the anaerobic digester, process heating, sludge drying, and space conditioning. CHP systems may be sized based on electric demand, but, in the case of this assessment, thermal demand was utilized. This was accomplished using the current annual on-site natural gas usage and the efficiency of the current boiler matching the plant’s thermal demand. The annual thermal demand of the WWTP (DT) is as follows:
DT = GN × ηB,
where GN is the current annual natural gas usage and ηB is the boiler efficiency.

4.1.2. CHP Annual Fuel Consumption

The CHP system itself will require fuel to operate, regardless of the prime mover. The CHP system’s annual fuel consumption (FCHP) is as follows:
FCHP = DT × DMT,
where ηT is the thermal efficiency of the installed CHP system. This efficiency will vary per prime mover installed and overall system size. Relevant values for each prime mover can be found in Section 3 above. The value DM is the percentage of thermal demand met by the CHP system with a value varying between zero and one.

4.1.3. Annual Biogas Heating Value

The CHP system will be fueled by the currently produced biogas, which is produced on site. As biogas production is generally measured in volume, the biogas heating value is needed for fuel calculations. The higher heating value (HHV) is utilized here, in line with several CHP-related fact sheets [34,37,118]. The annual biogas heating value (GBH) is found as follows:
GBH = GB × HHVB,
where GB is the current annual production of biogas and HHVB is the higher heating value of the biogas.

4.1.4. Annual Natural Gas Savings

It is assumed that the CHP system will solely utilize biogas until the amount of fuel required is greater than that of the produced biogas on site. Any additional biogas that is not being utilized by the CHP system has not been considered for this annual natural gas savings calculation. For a case when the available biogas is less than the amount needed to meet the total thermal demand of the WWTP, the annual natural gas savings (SNG) are found as follows:
If FCHP ≤ GBH,    SNG = (ηT × FCHP)/ηB,
If GBH < FCHP,    SNG = GN − ((1 − DM) × GN + ηT × (FCHP − GBH))/ηT)
If the proposed annual fuel consumption of the CHP system used to meet the thermal demand is less than the current amount of biogas available to meet the thermal demand, then the savings are equal to the amount of natural gas saved due to the thermal demand met by the CHP system. If the proposed annual fuel consumption of the CHP system used to meet the thermal demand is greater than the amount of biogas available to meet the thermal demand, then the savings decrease. This occurs because some natural gas will need to be purchased from the local utility to meet the rest of the site’s thermal demand.

4.1.5. Annual Natural Gas Cost Savings

When less natural gas needs to be purchased from the local utility, cost savings will occur. The total annual natural gas cost savings (SNGC) are as follows:
SNGC = SNG × CNG,
where CNG is the bundled natural gas charge for the WWTP.

4.1.6. CHP Electric Output

The CHP system’s total electric output is directly related to the total fuel consumption by the CHP system and the electrical efficiency of the CHP prime mover. The electric output of the CHP system (ECHP) is found as follows:
ECHP = FCHP × ηE/H,
where H is the annual proposed operating hours of the CHP system and ηE is the electrical efficiency of the CHP system.

4.1.7. Annual Electric Usage Savings

The annual electric usage savings (SE) are found as follows:
SE = ECHP × H
As biogas production and the electric and thermal demand throughout a 24-h period fluctuate so vastly at each individual WWTP, electrical demand savings were not included in the assessment. Further detailed calculations for electric demand savings are site specific.

4.1.8. Annual Electric Usage Cost Savings

The annual electric usage dollar savings (SEC) are then found as follows:
SEC = SE × CE,
where CE is the bundled electric usage cost for the WWTP.

4.1.9. Annual O&M Savings—Boiler

With installation of a new CHP system, annual operations and maintenance (O&M) costs must be accounted for. While the O&M costs of the boiler will be reduced as the CHP system takes the thermal load off the boiler, the CHP system itself will incur O&M costs. The reduction in O&M costs due to the boiler’s decreased usage (OB) are as follows:
OB = DT × DM × O&MBB,
where O&MB is the annual operations and maintenance cost for the boiler. This value will differ per WWTP and should be assessed based on previous costs for running the boiler at that WWTP.

4.1.10. Annual O&M Costs—CHP

Similarly, O&M costs for the CHP system (OCHP) must be accounted for and are as follows:
OCHP = ECHP × O&MCHP × H,
where O&MCHP is the annual operation and maintenance costs for the CHP system.

4.1.11. Total Annual Cost Savings

With fuel, electricity, and O&M costs all accounted for, the total expected annual cost savings (S) can be found as follows:
S = SNGC + SEC + OB − OCHP,

4.2. Implementation Cost

For the implementation cost of a CHP system, two main aspects must be considered: (1) the initial capital cost of the system itself and (2) the initial capital cost of the biogas cleaning system required to keep the CHP system running efficiently. These costs when compared against the total annual cost savings can be used to determine the simple payback period expected to fiscally break even for the CHP system.

4.2.1. CHP System Capital Cost

The capital cost for the CHP system (CCE) is based on costs found in the U.S. Department of Energy (DOE) Combined Heat and Power Technology Fact Sheet Series—Reciprocating Engines [119], on a per kWe basis, as follows:
CCE = CC × ECHP,
where CC is the average cost of implementation of a new CHP system per kWe. This linear relationship was modeled after the pattern followed in the DOE Fact Sheet, though it should be noted that the capital cost of a CHP system is best specified by industry professionals and manufacturers of CHP systems.

4.2.2. Biogas Flow Rate

To determine the biogas cleaning capital costs, as outlined in Figure 6, the biogas flow rate must first be determined. This will vary based on the size of the CHP system installed—a larger CHP system will require more biogas. The biogas flow rate needed for the CHP system (ĠB) is found as follows:
ĠB = FCHP/(H × HHVB),

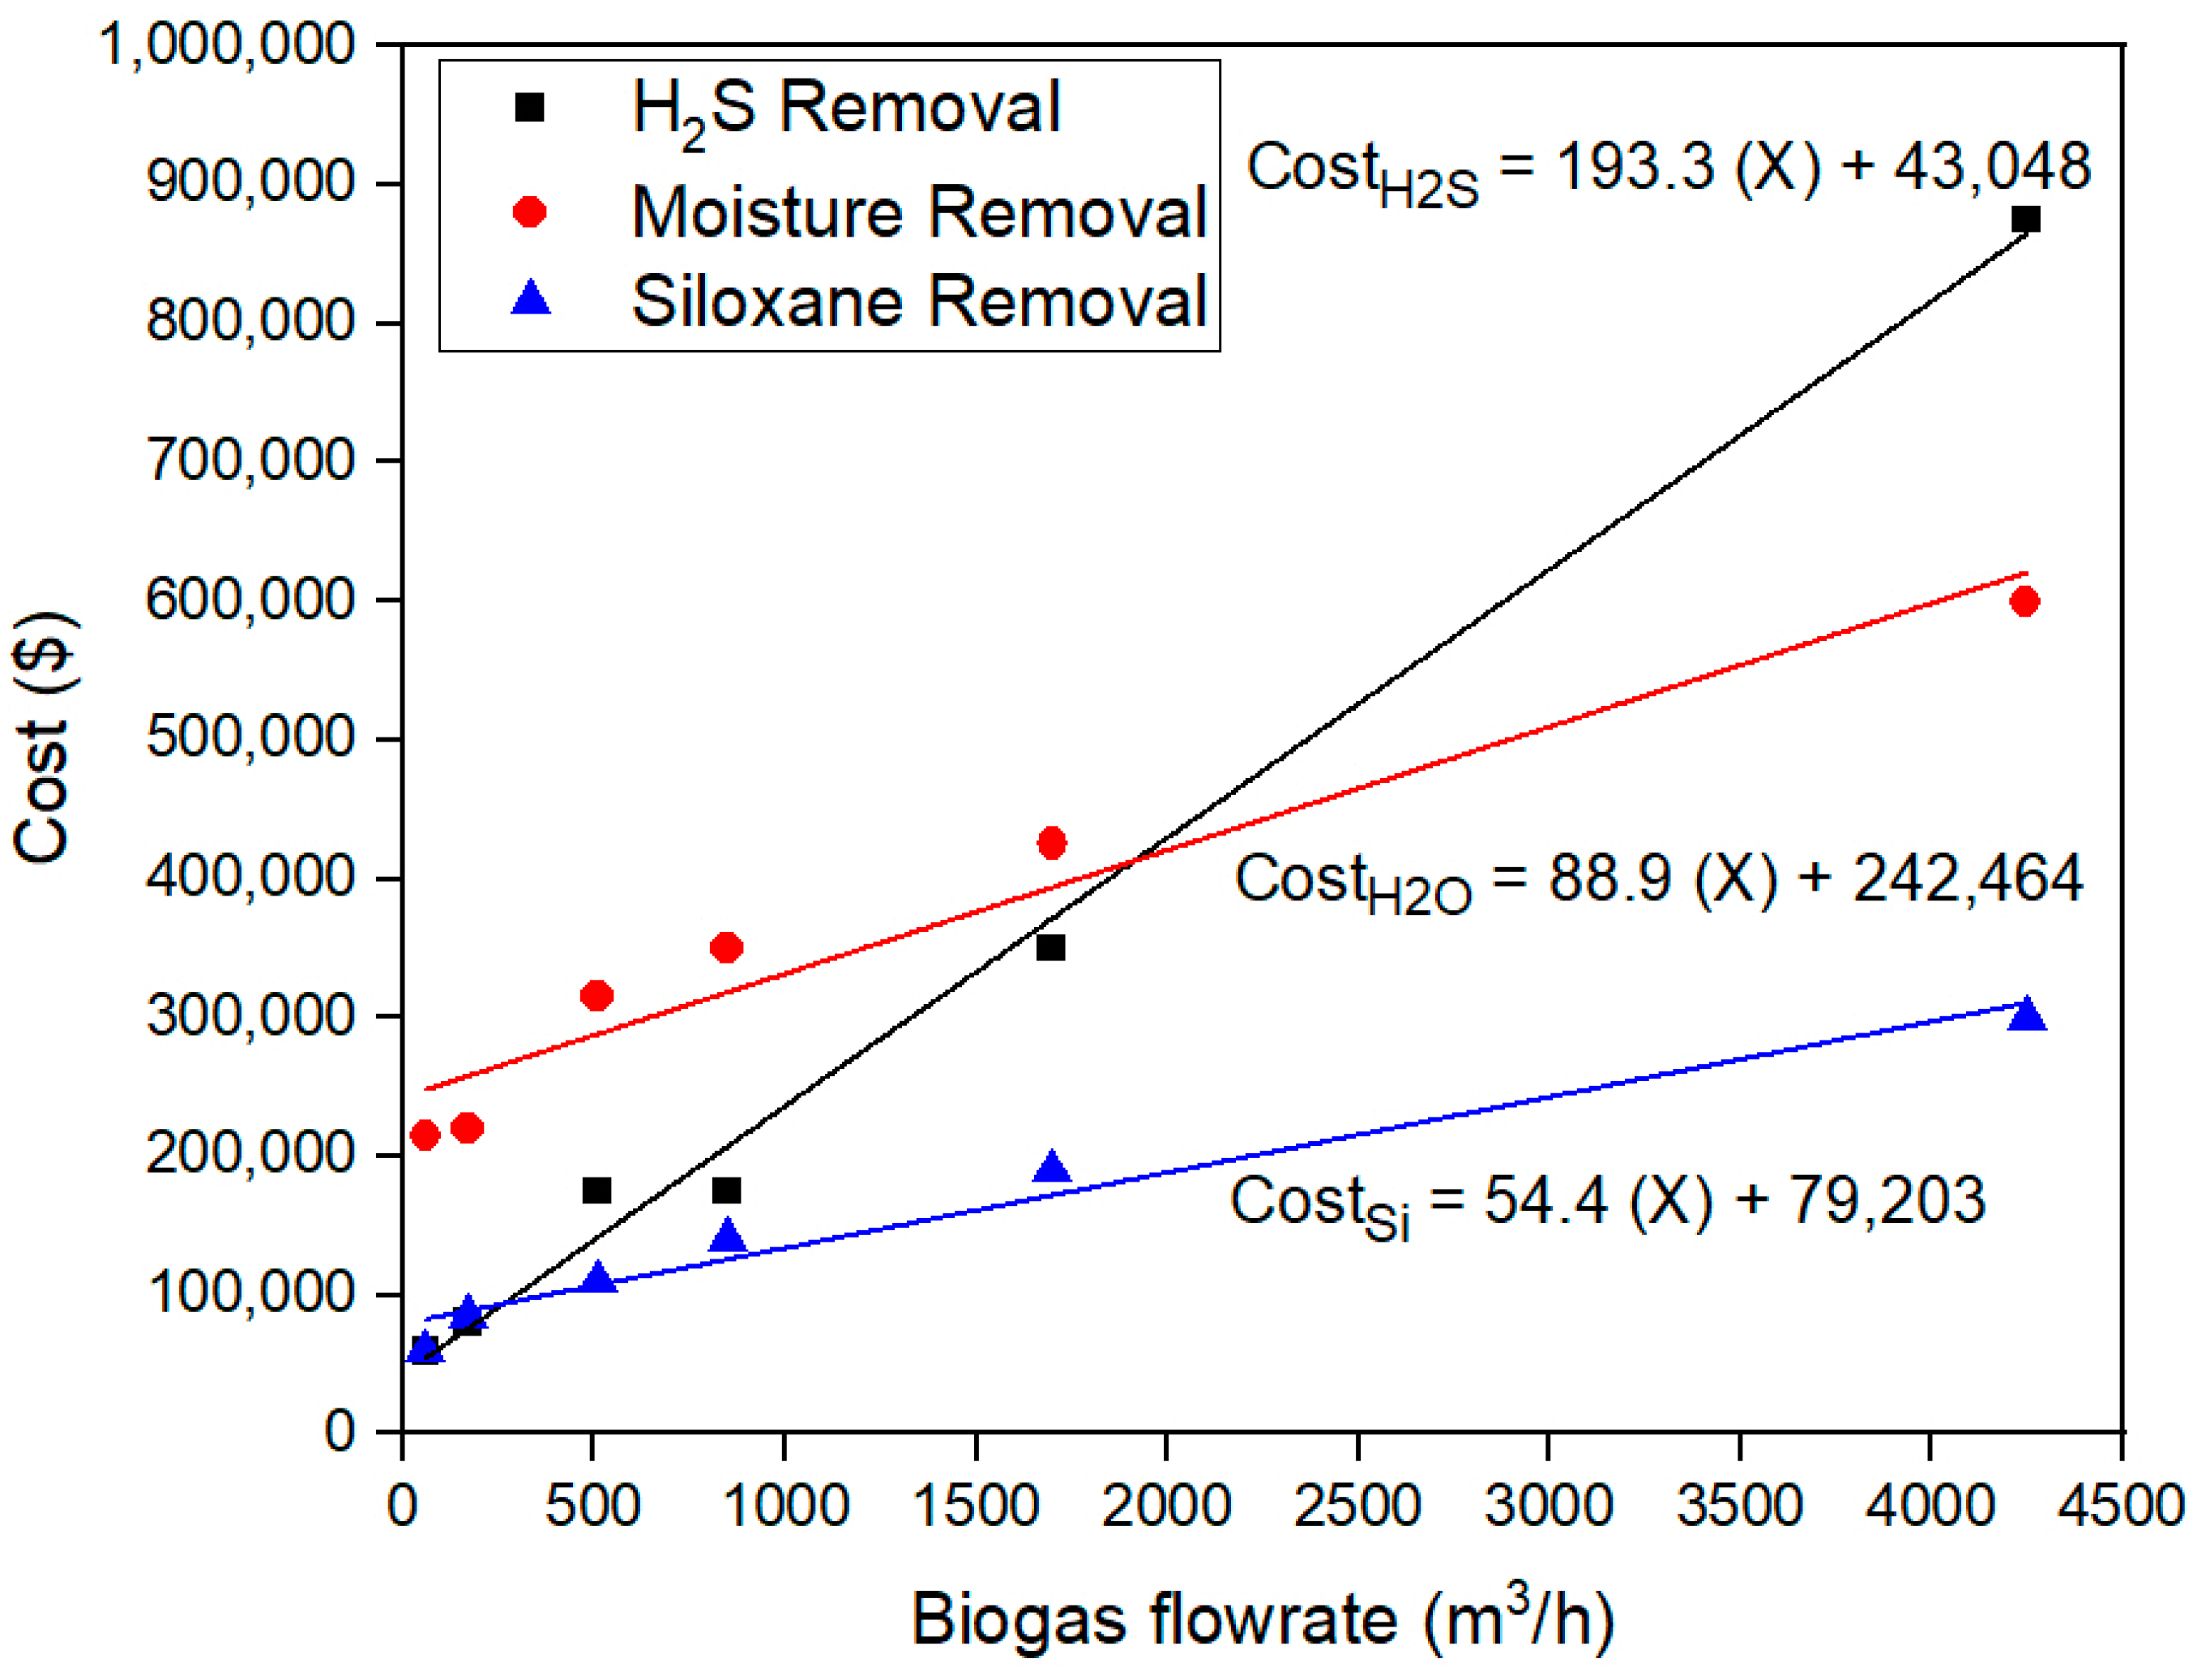
4.2.3. Biogas Cleaning Costs

Once the biogas flow rate has been determined, the capital cost for the removal of impurities in biogas can be determined. For this assessment, three impurities were assessed: H2S, water, and siloxane. The equations listed for the capital costs of impurity removal are given in Figure 6 and also presented below.

4.2.4. H2S Removal Cost

The capital cost for installing a H2S removal system (CCH2S) was modeled as follows:
CCH2S = 193.3 × ĠB + 43,048,

4.2.5. Water Removal Cost

The capital cost for installing a water removal system (CCW) was modeled as follows:
CCW = 88.9 × ĠB + 242,464,

4.2.6. Siloxane Removal Cost

The capital cost for installing a siloxane removal system (CCS) was modeled as follows:
CCS = 54.4 × ĠB + 79,203,

4.2.7. Total Implementation Cost

The total implementation cost for the CHP system (CC) is found as follows:
CC = CCE + CCH2S + CCW + CCS,
This is the final upfront capital cost required to purchase and install the CHP system and it can then be used to calculate the simple payback of the CHP system.

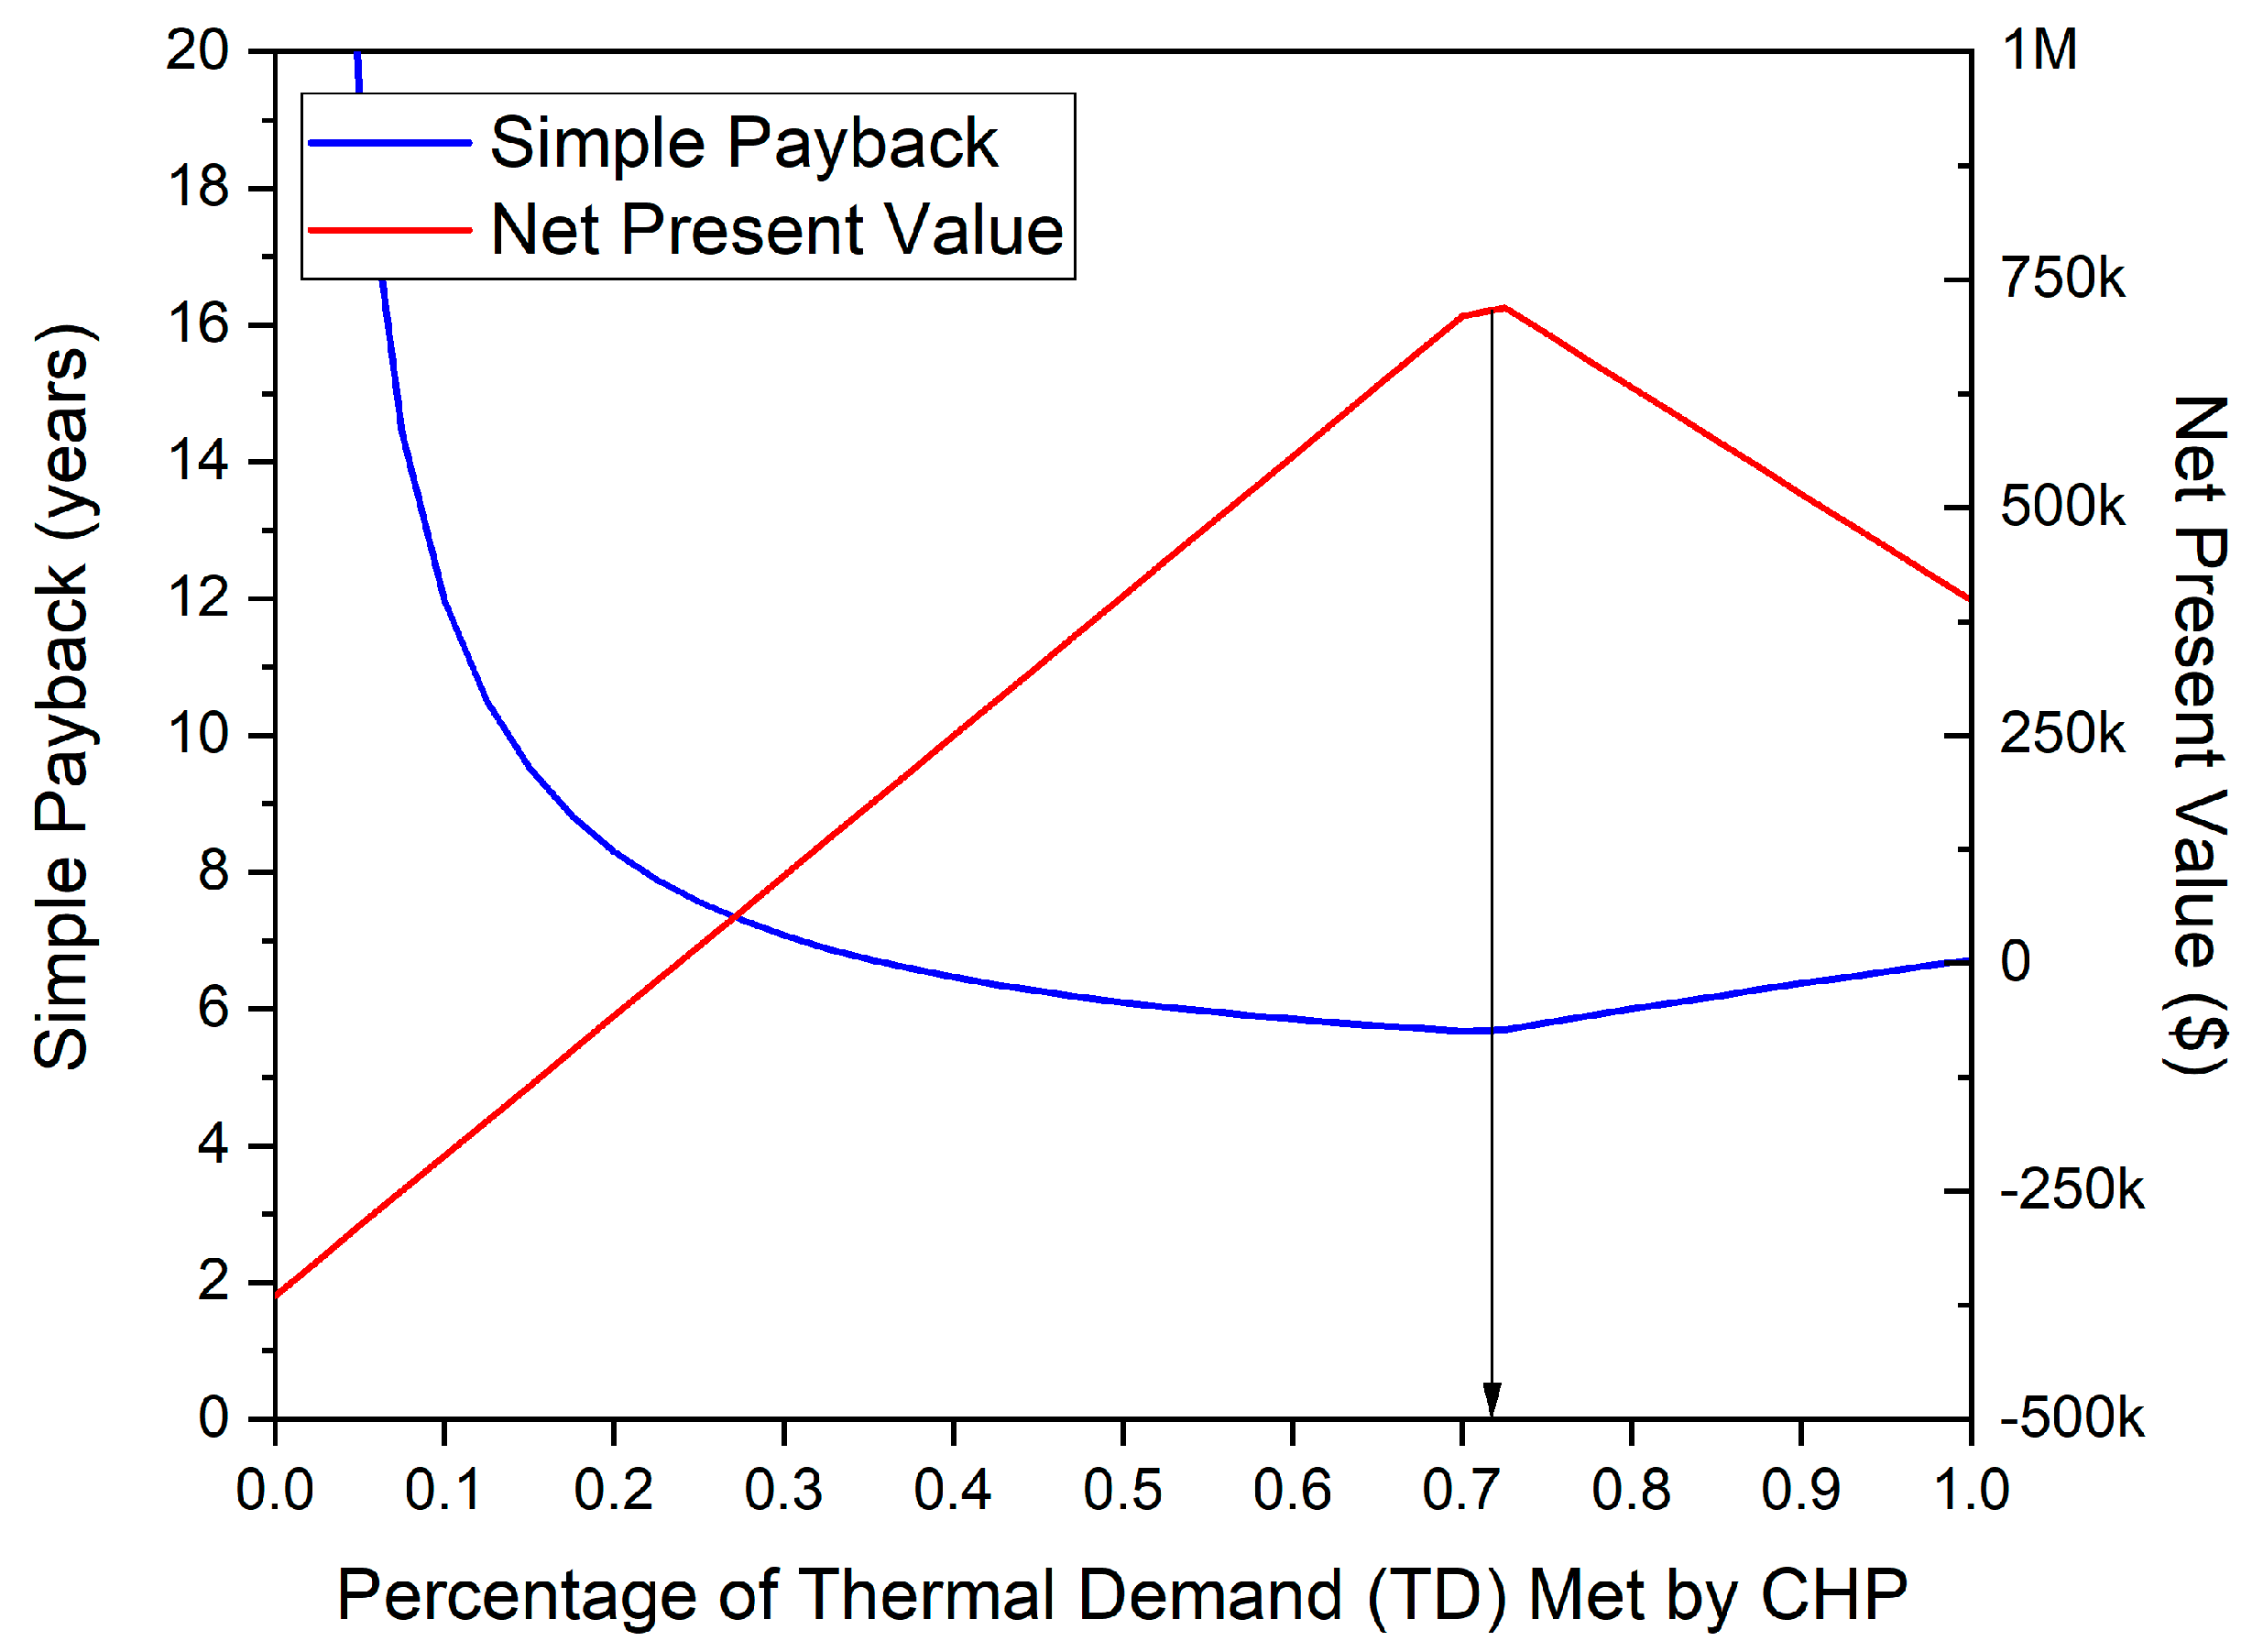
4.2.8. Simple Payback Period

The simple payback period is a simple metric to determine the amount of time required before the purchased item will save more than the cost of the initial investment. For a CHP system, payback can range from a few years to more than a decade depending on system size, local utility energy costs, and the other factors given in the techno-economic assessment. The simple payback period for the CHP system (P) is found as follows:
P = CC/S,
This simple calculation of total capital cost divided by the total annual cost savings gives the number of years after which the WWTP can be expected to truly begin saving costs prior to the CHP system’s installation. The equations presented in both the Implementation Cost and the Annual Energy and Cost Savings sections were utilized in the case study below.

4.2.9. Net Present Value

The net present value (NPV) is a value that establishes the future cash flows for a project, considering its initial costs, as well as yearly cash returns. The NPV for the installation of a CHP system is found as follows:
NPV = y = 1 10 S / ( 1 + R ) y ,
where R is the annual discount rate and y is the number of years the NPV is being calculated for. The equations presented in both the Implementation Cost and the Annual Energy and Cost Savings sections were utilized in the case study below.

4.3. Case Study

The data used in this study are based on an assessment of a relatively large WWTP (i.e., >10 MGD). The electric and natural gas usage costs are typical for the Southwest United States. Table 4 lists some of the preliminary data found during this assessment. The analysis was performed based on meeting varying levels of the WWTP’s thermal demand. Any thermal demand that is not provided by the CHP system is provided by a boiler. Using the equations above, calculations assessed different percentages of the on-site thermal demand. For example, a CHP system could be sized to meet only 65% of the thermal demand in the plant. The amount of thermal demand to be met by the CHP system at any particular WWTP is given at the discretion of those performing the CHP feasibility assessment and the WWTP personnel.
The calculations were done on a continuous scale from 0% to 100% of the WWTP’s thermal demand using the values listed in Table 4 and the equations above. Discrete results from the analysis at every 5% of the WWTP’s thermal demand are found in Table 5. The simple payback vs. percentage of thermal demand met are plotted in Figure 8.
The NPV assumed a 5% discount rate and a 10-year study period. As shown in Figure 8, the NPV for this installation peaks around 71% of the thermal demand met. This occurred because the CHP system chosen utilized 100% of the biogas at this point. As such, we recommended this WWTP to meet 71% of their thermal demand, giving roughly USD 347,000 in annual cost savings, a 10-year NPV of about USD 709,000, and a payback of 5.68 years. The relationships between each of the parameters listed in the techno-economic assessment can be found in Figure 9. The equations presented all create linear relationships as the CHP size increases to meet higher thermal demand at the WWTP, with one exception. The natural gas savings increase at a consistent rate until a specific point, after which the natural gas savings begin to decrease. This is the point at which the CHP system requires more fuel than the on-site biogas production can provide. After this point, natural gas is required to be purchased to continue running the CHP system efficiently. For the case study in Figure 9, that occurs at around 71% of the WWTP’s thermal demand.

Variable Modifications

To further analyze the trends in the techno-economic assessment presented, several variables were modified and plotted in Figure 10, Figure 11, Figure 12, Figure 13 and Figure 14. The variables were the same as those utilized in the case study above, with any modifications listed in the figures.
Figure 10 displays the effect of the installed CHP system cost on the simple payback. As the cost per kWe increases, so does the payback. The installed cost of the CHP system relies mainly on the prime mover utilized for the WWTP and the location of the WWTP for installation charges.
Figure 11 assumes 2500 USD/kW for the installed cost from the case study, but modifies the O&M costs of maintaining the CHP system. As those costs increase, the payback increases sharply. As the O&M costs increase, the difference between the natural gas and electric savings and the O&M costs will decrease, increasing the payback at a steeper rate. As a larger CHP system is sized to meet larger thermal demand, the capital cost continues to rise, and if the difference in savings and costs is not large enough to mitigate that, then the payback increases at a steep rate.
Figure 12 adjusts the electrical efficiency of the system subject to a system constraint that the combined efficiency is 75%, similar to the real systems shown in Figure 5. As the electrical efficiency is increased, the payback period grows, which initially appears counterintuitive. This occurs from roughly 23% of the thermal demand met onwards as, before then, the opposite is true. As the electrical efficiency is increased, the thermal efficiency is decreased. This lowers the percentage of thermal demand that the CHP system can meet with the on-site biogas, forcing the WWTP to purchase more natural gas. These added natural gas costs, in the case study, outweigh the added benefits of higher electrical efficiency, causing a longer payback period.
Figure 13 and Figure 14 modify the local utility costs of electricity and natural gas. As the local utility’s prices increase, so do the savings with the installation of the CHP system. As the savings increase, the simple payback period decreases. This is true for both the electric and natural gas costs.

5. Conclusions

A techno-economic review of CHP technologies and their status in WWTPs was presented here. This review covered biogas impurities and concentrations, typical prime movers found in WWTPs and the performance characteristics of each, the capital, maintenance and other costs of installation for CHP systems in WWTPs, and techno-economic assessment methods for the assessment of CHP projects in WWTPs. Several conclusions can be drawn from this techno-economic assessment, as follows.
  • Biogas is most commonly a mixture of CH4, CO2 and other trace gases like siloxanes. Some of these gases, like siloxane, are impurities from the biomass used to generate biogas and can be damaging to CHP systems if the proper cleaning of biogas is not installed and maintained. The cost of cleaning systems for H2S, water and siloxanes were found to show positive linear relationships based on the biogas flowrate associated with the installed CHP system. The large percentage of CH4 in biogas makes it a stable fuel source for CHP systems. The utilization of biogas in CHP systems increases plant efficiency and reduces the reliance on natural gas.
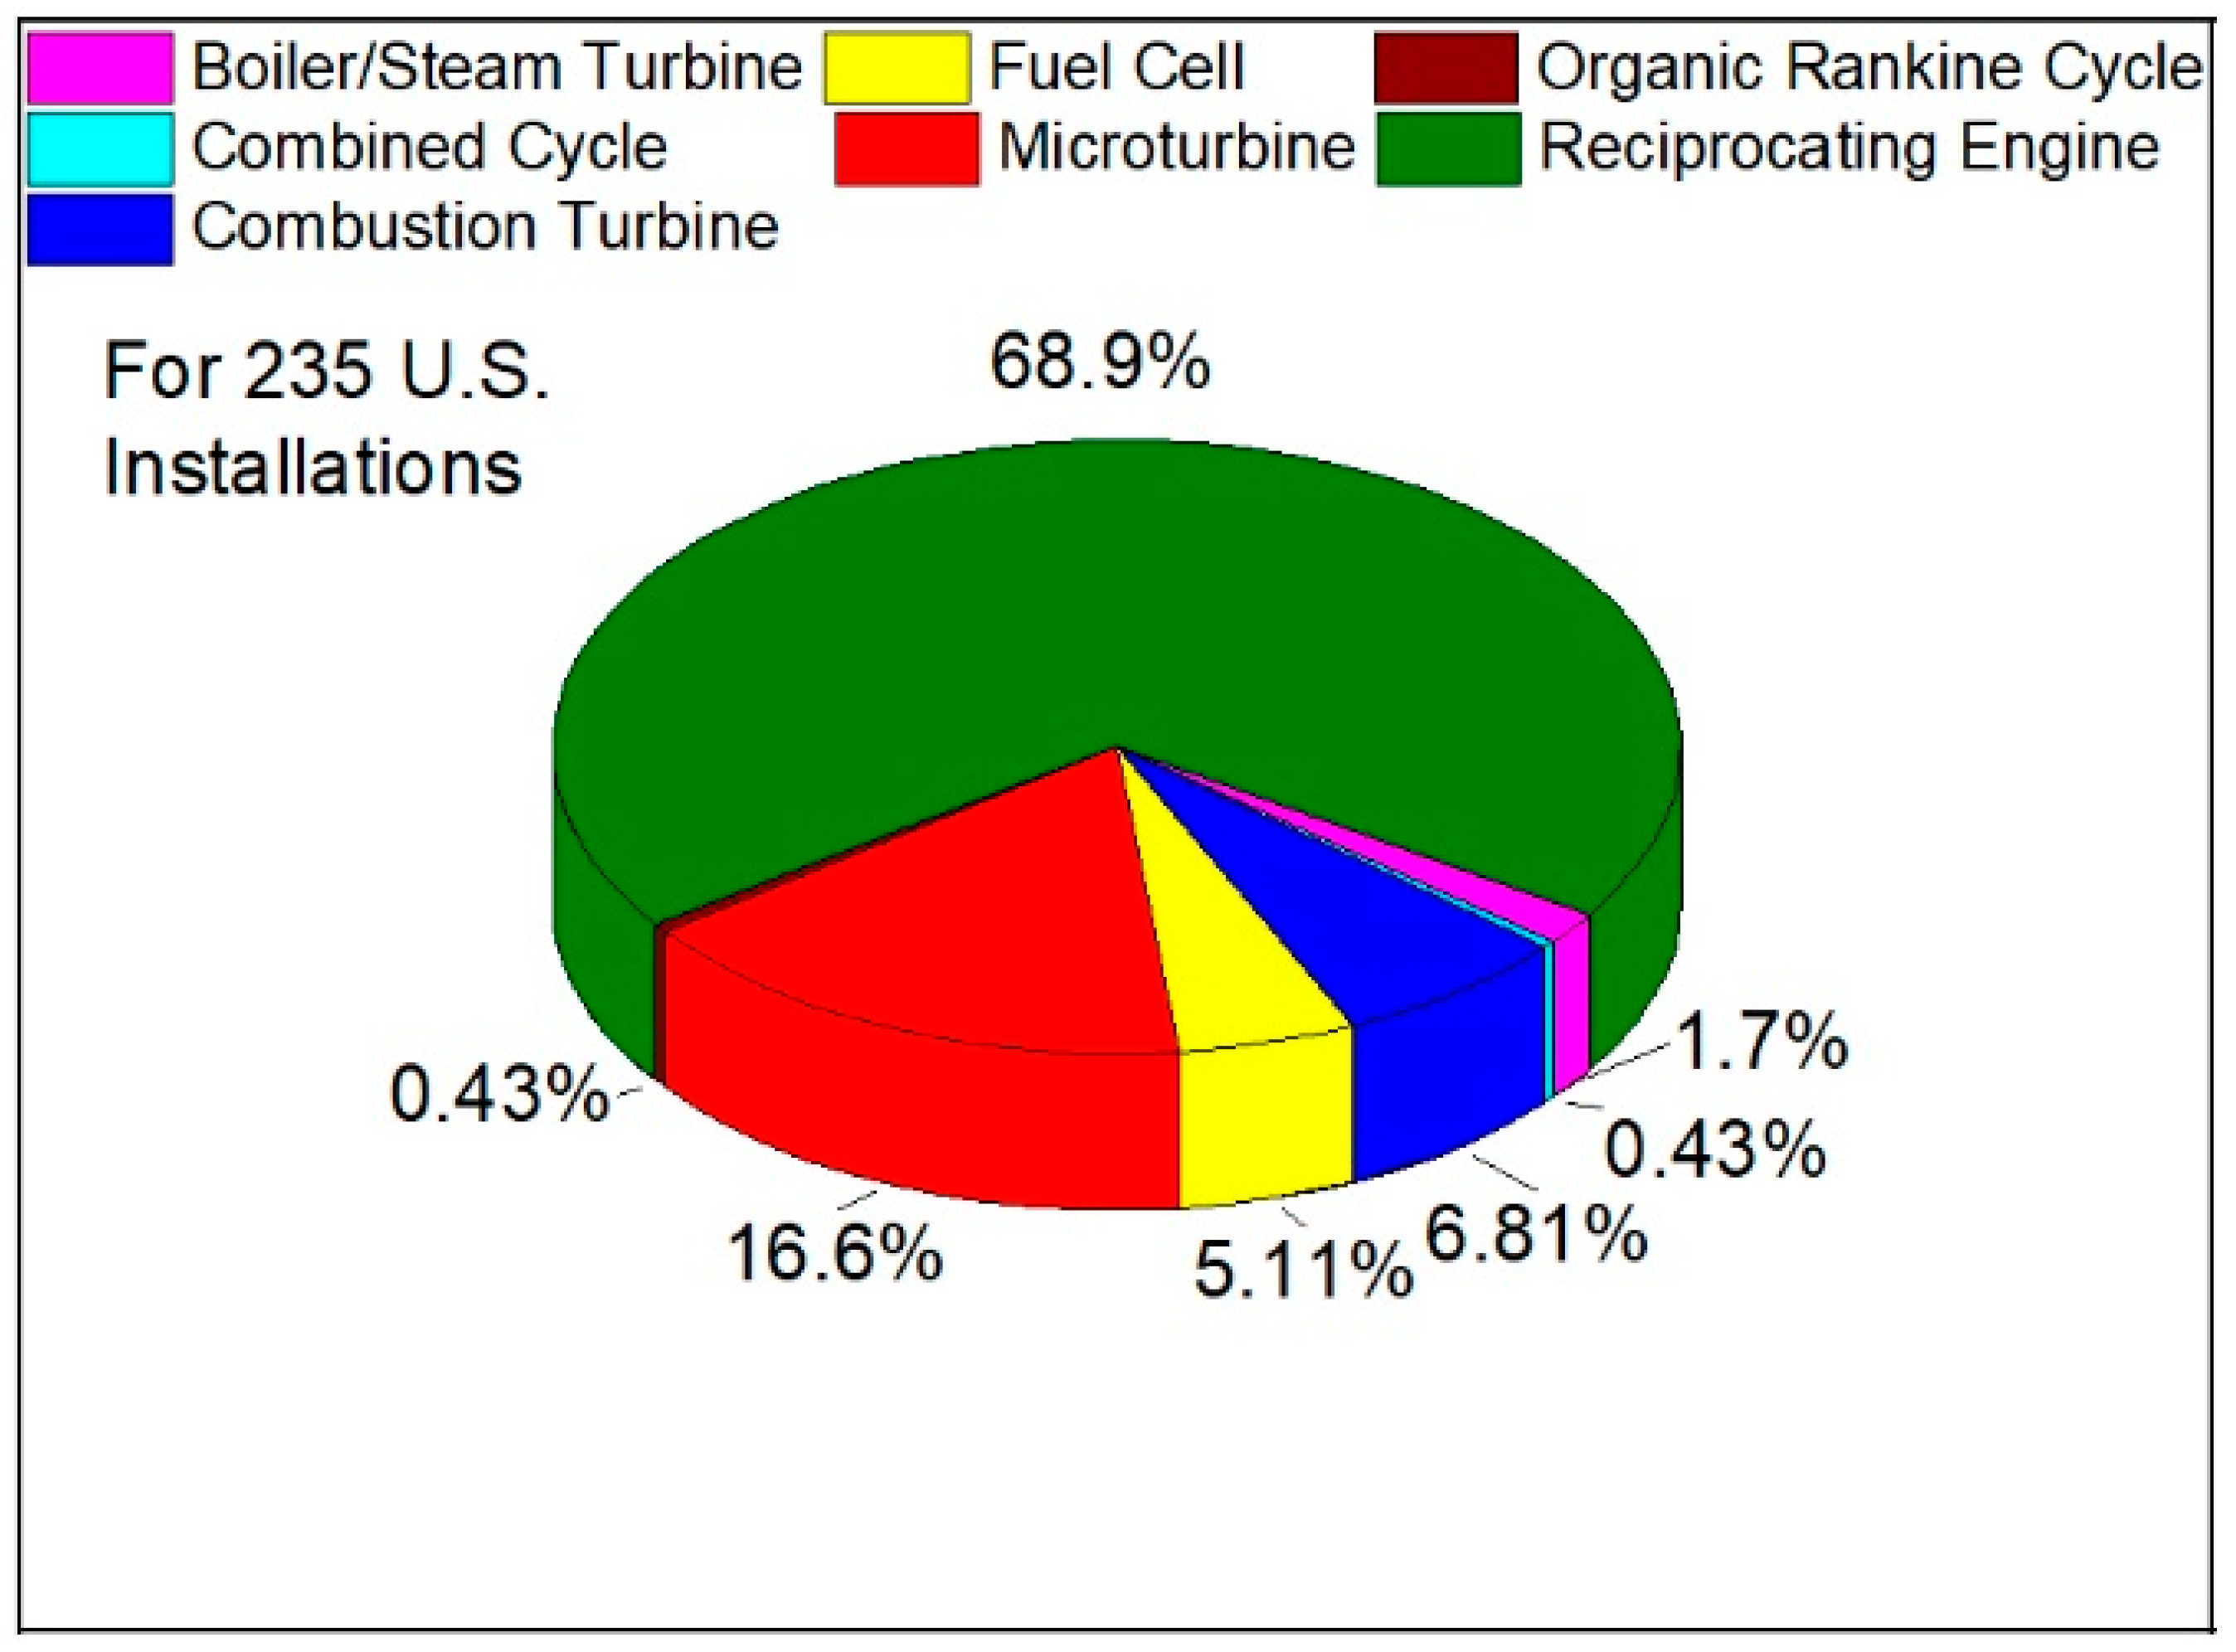
  • At the current time, reciprocating engines and microturbines are the most utilized CHP technologies in WWTPs across the United States, at roughly 69% and 17% of the national total, respectively. This is due to the widespread commercial availability and low cost of installation of these systems. However, with future development, fuel cells, gas turbines, and a combination of both could also become widely utilized in WWTPs. Fuel cells tend to have the highest electrical efficiency (30–63%), while reciprocating engines tend to have the highest total efficiency (70–87%). Most CHP systems tend to have overall efficiencies of 60–80%. Depending on the prime mover, capital costs for CHP technologies typically range from USD 1000 to USD 5000/kW for initial installation and 0.5–4.5 ¢/kWh for maintenance. Gas turbines are generally the least expensive to install at roughly USD 700–USD 2000/kW, and generally have the lowest operating cost at 0.6¢–1.3¢/kWh.
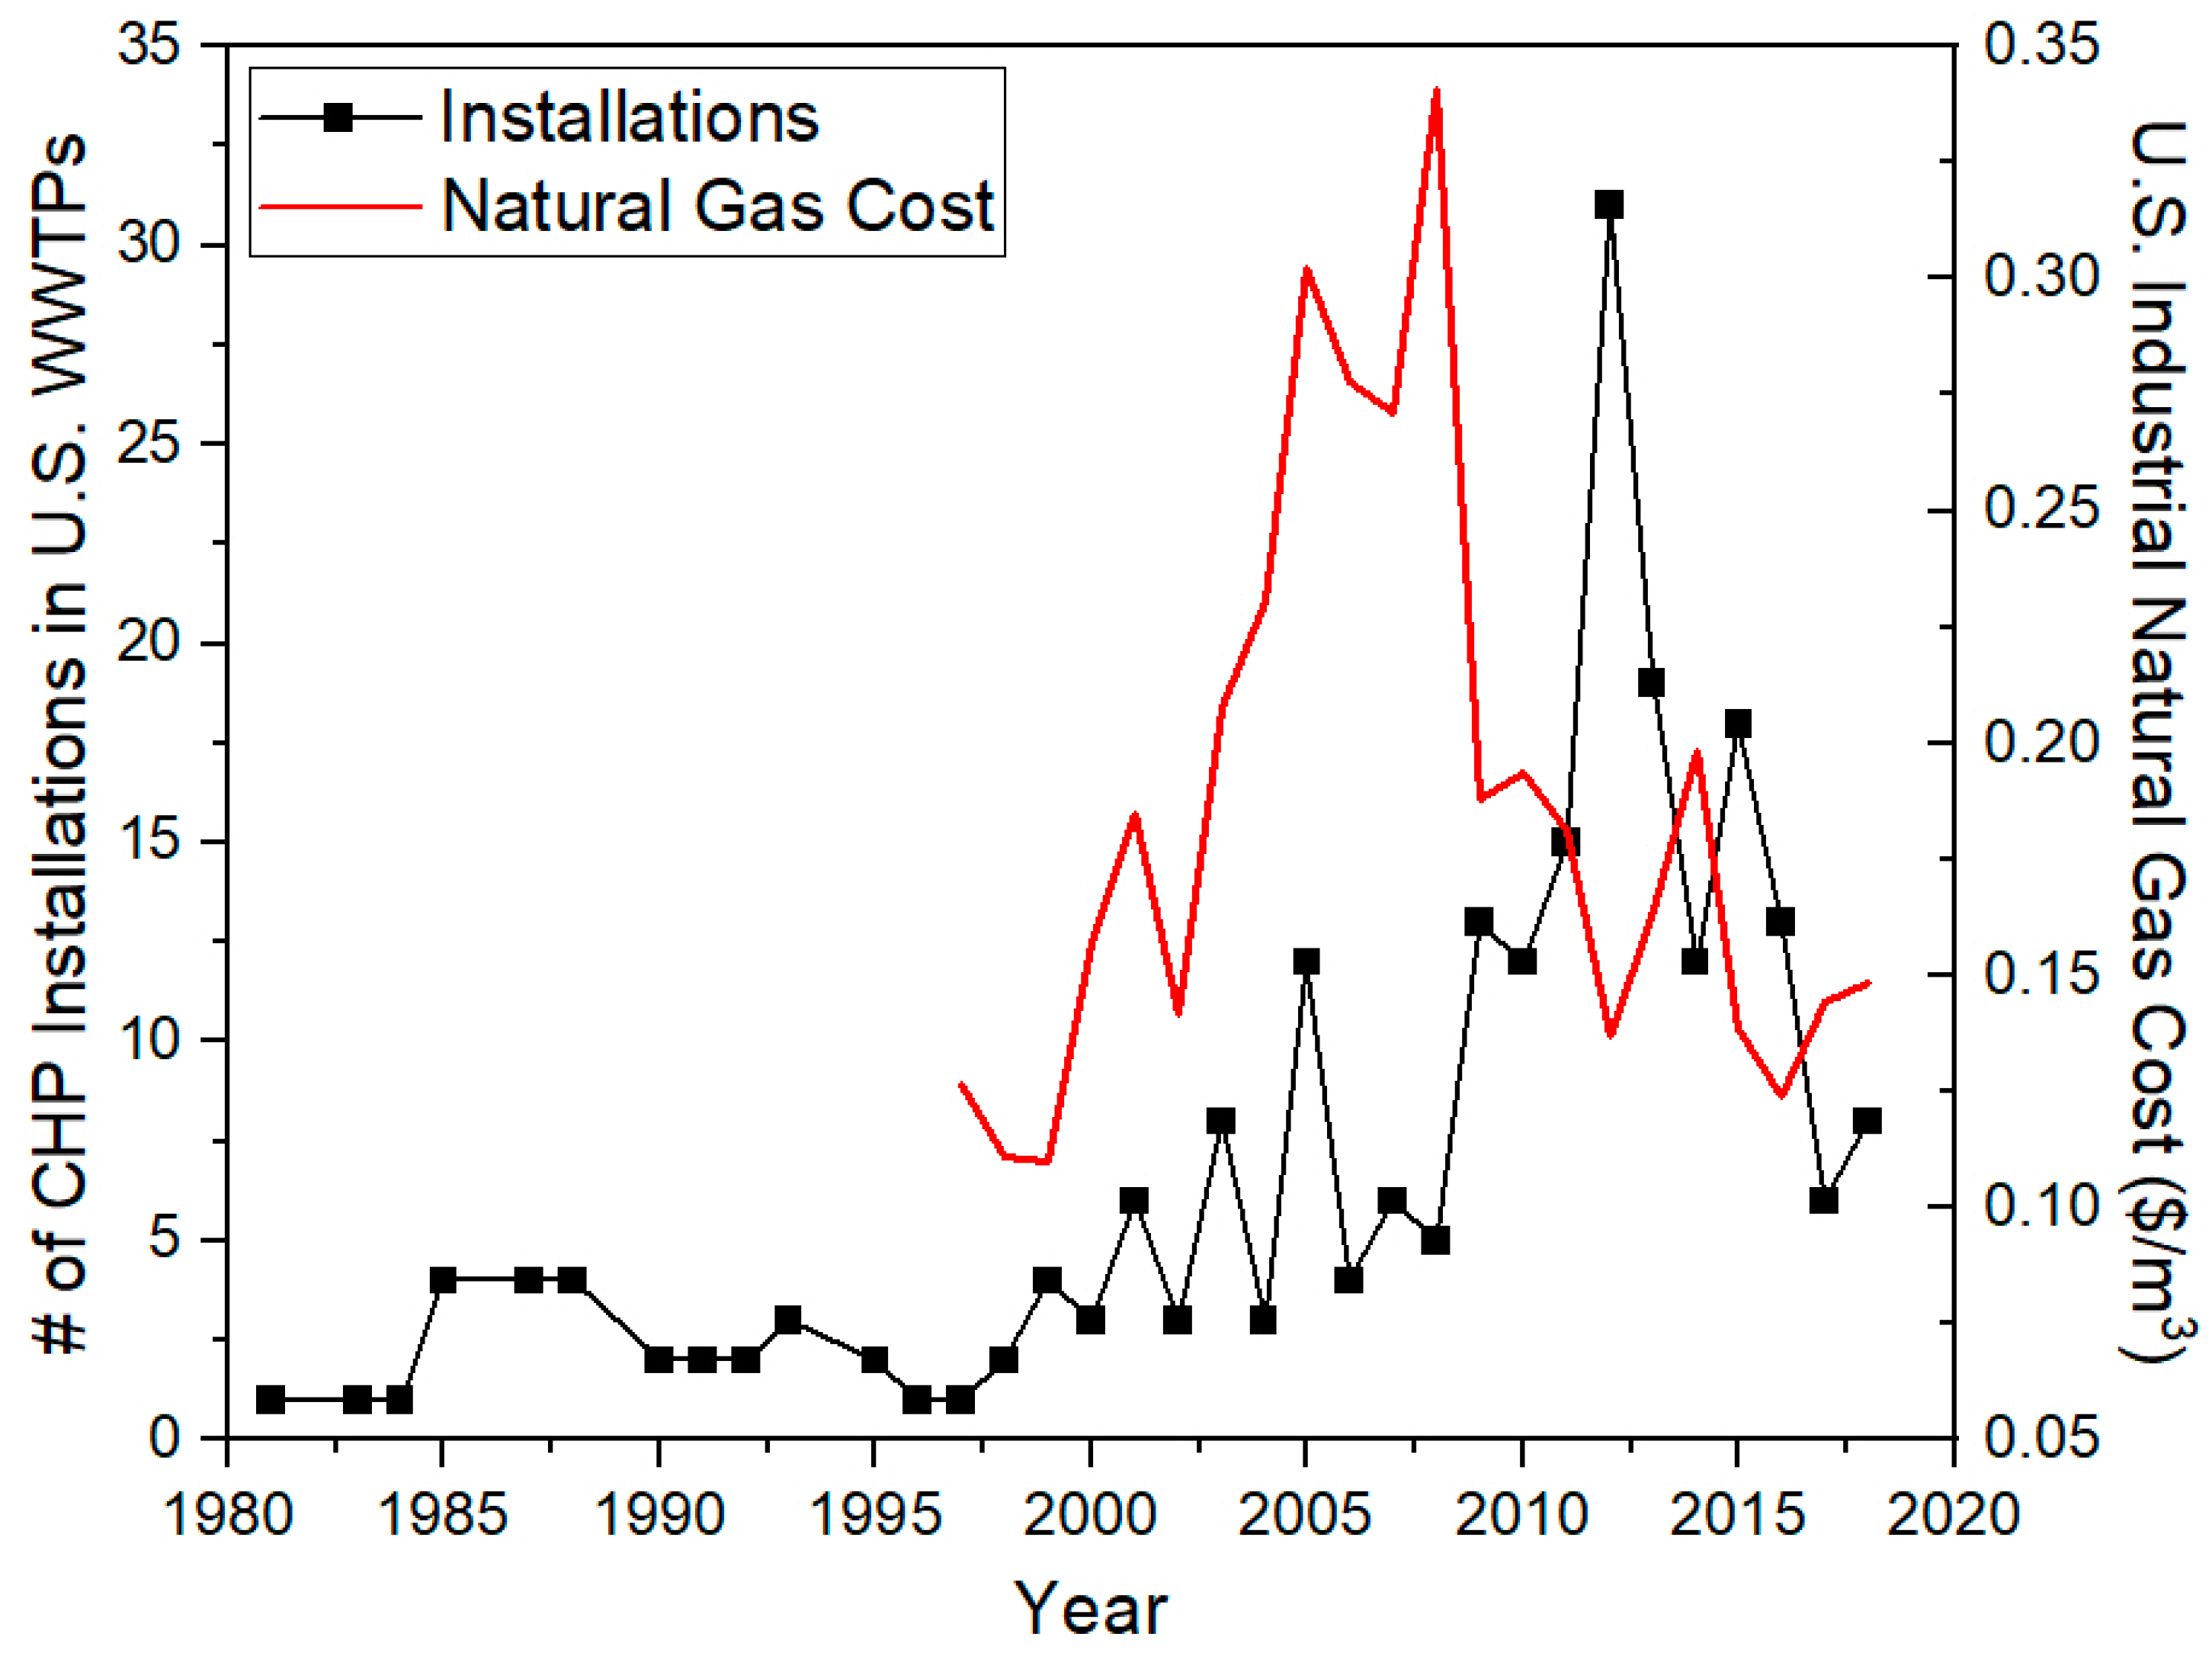
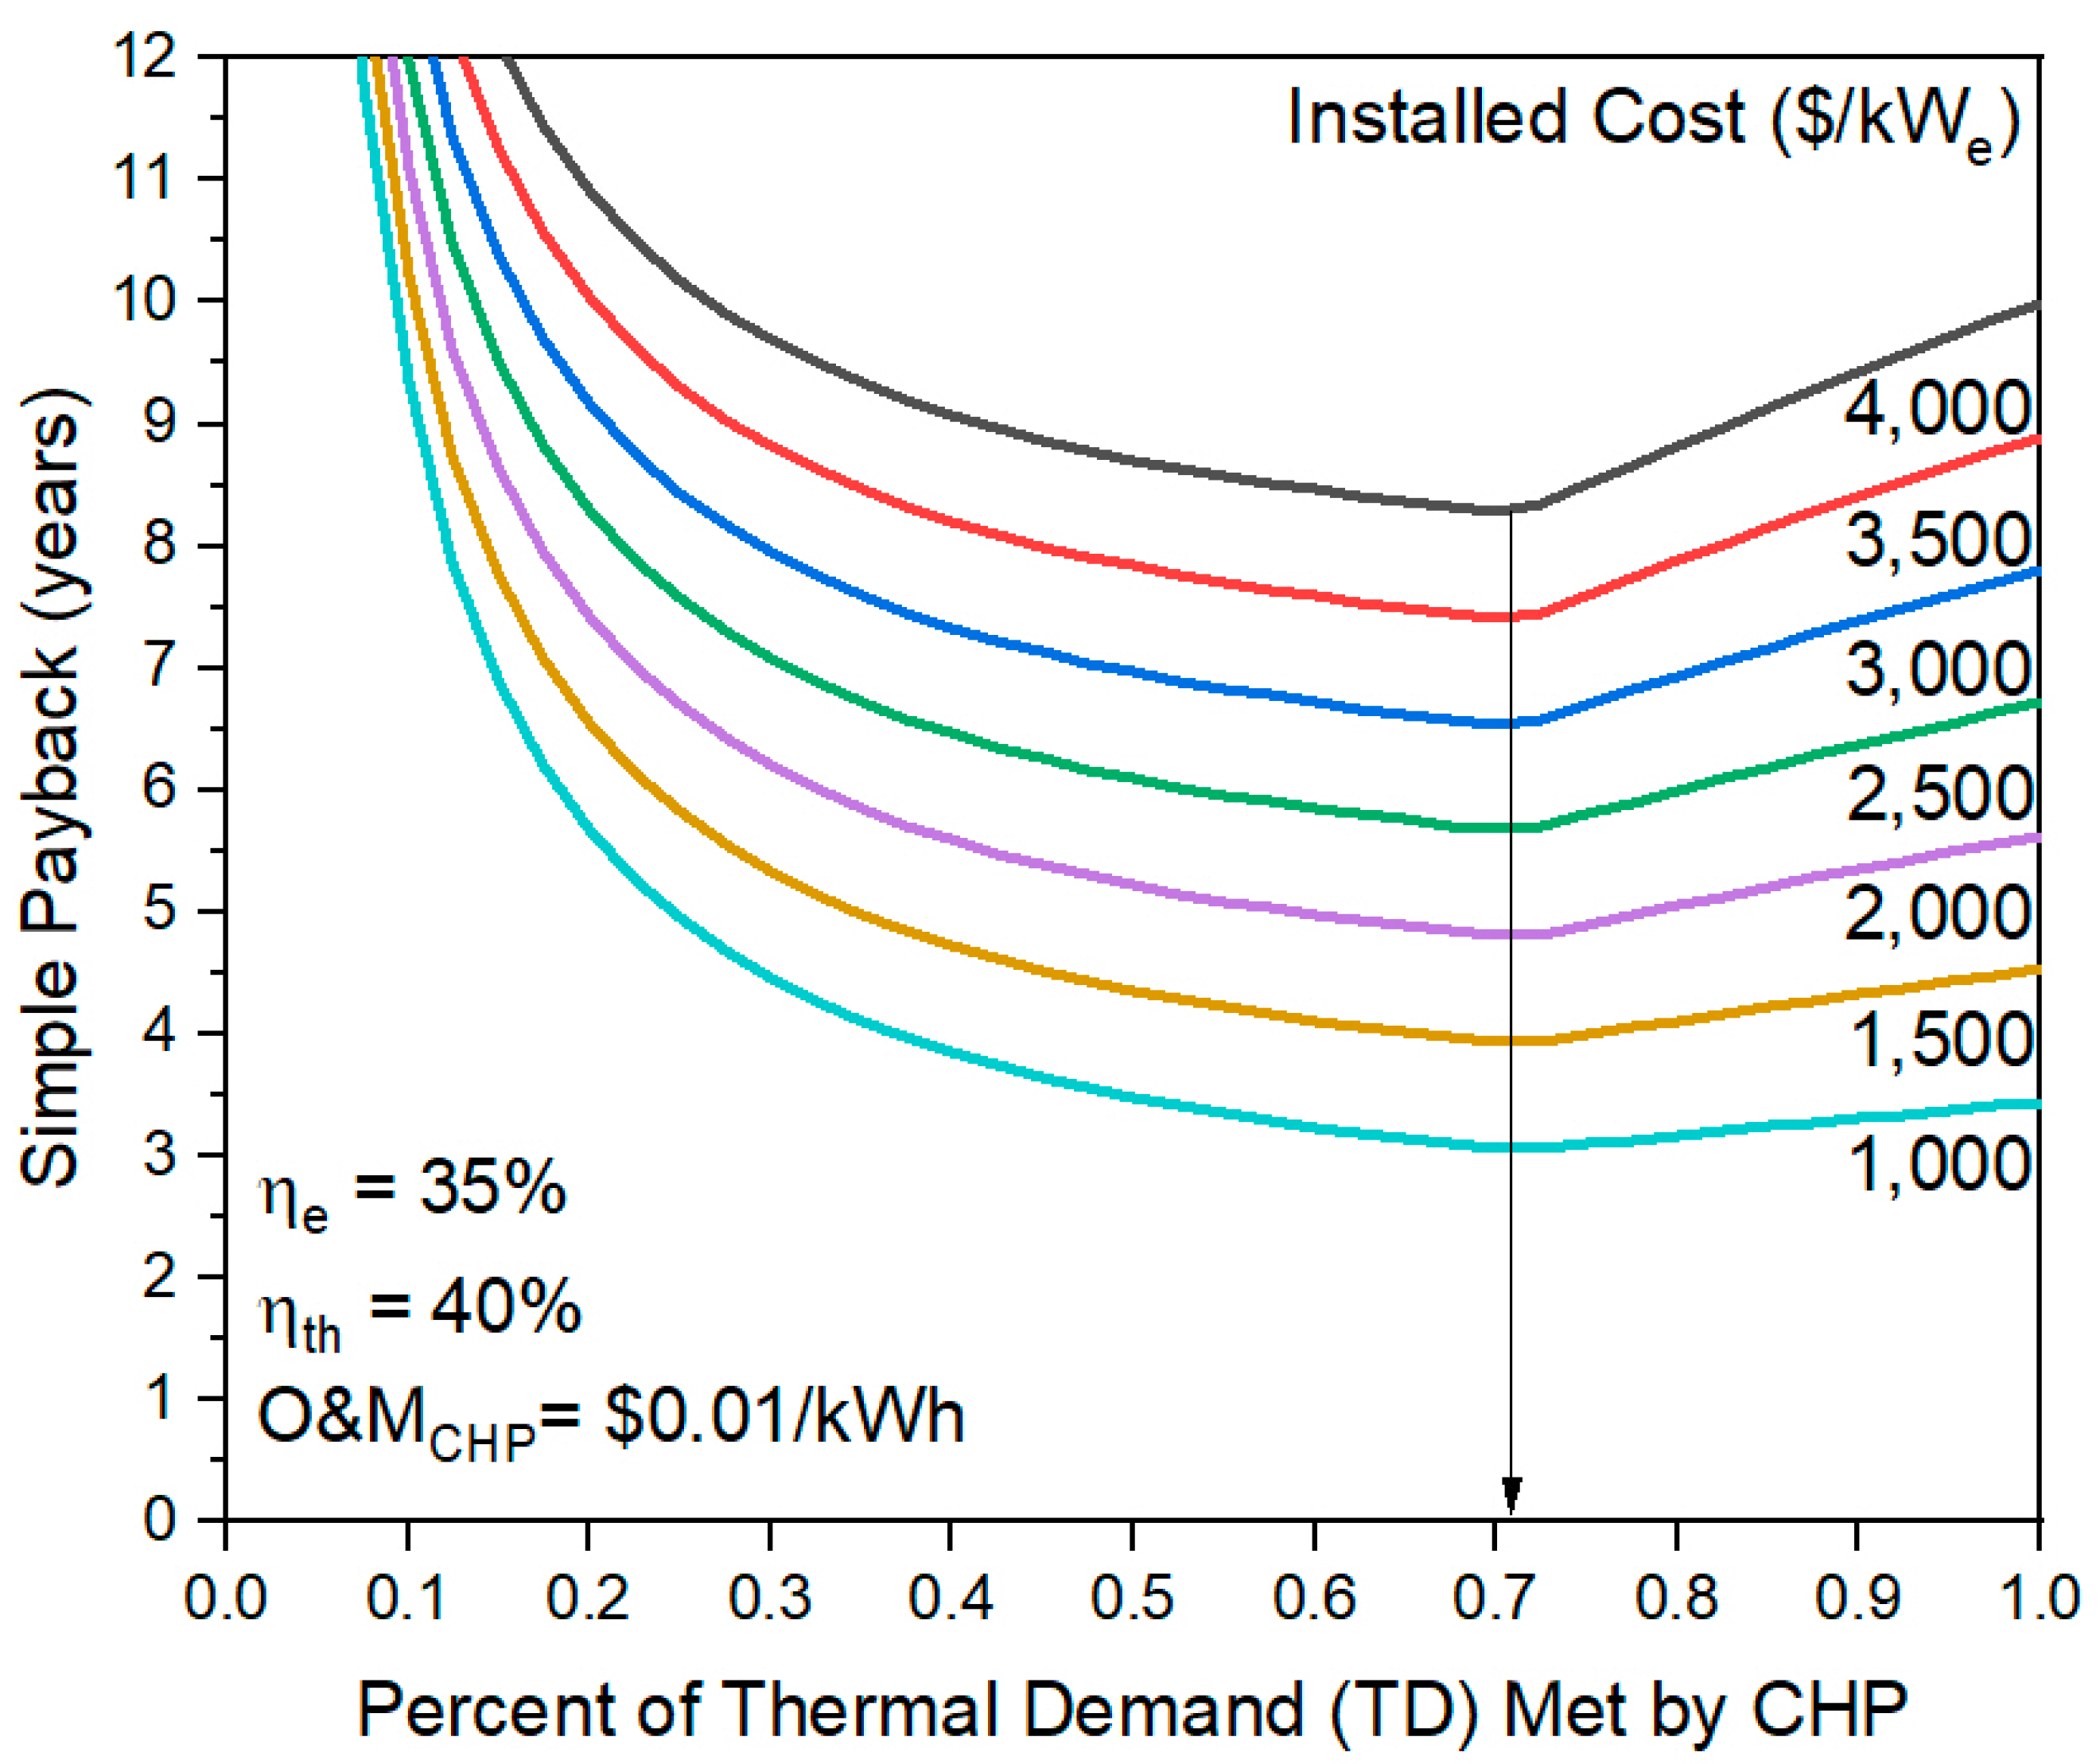
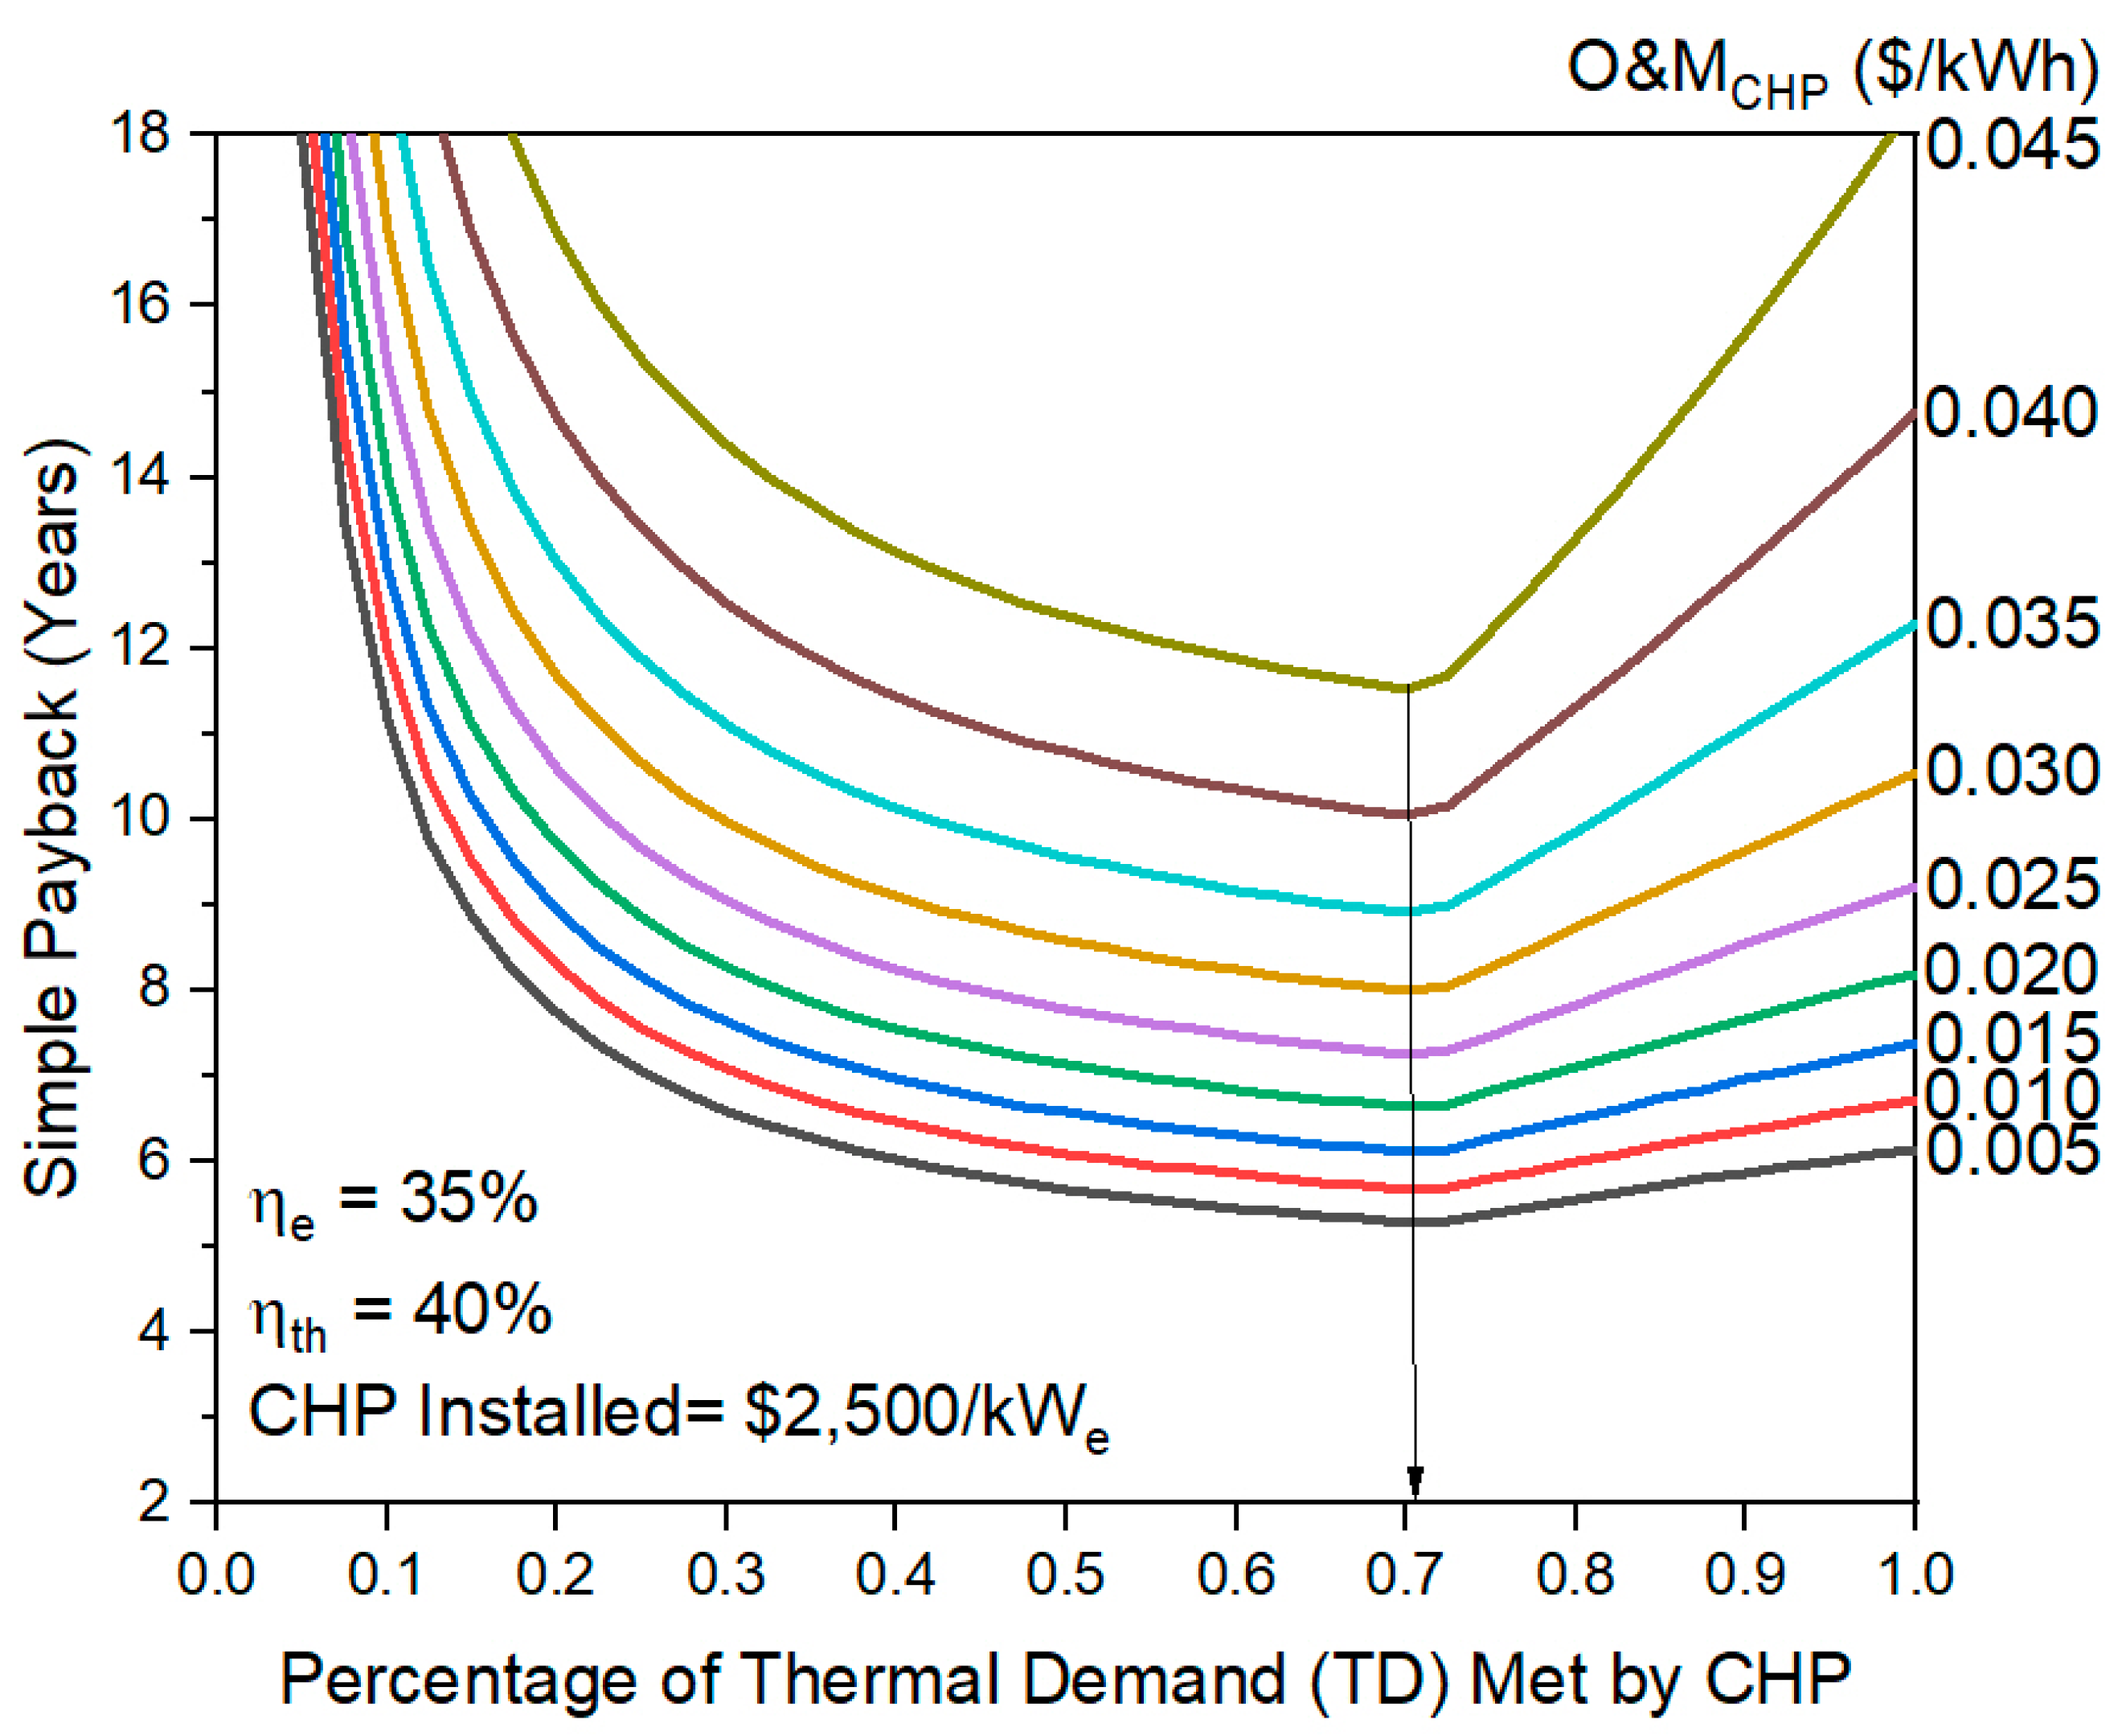
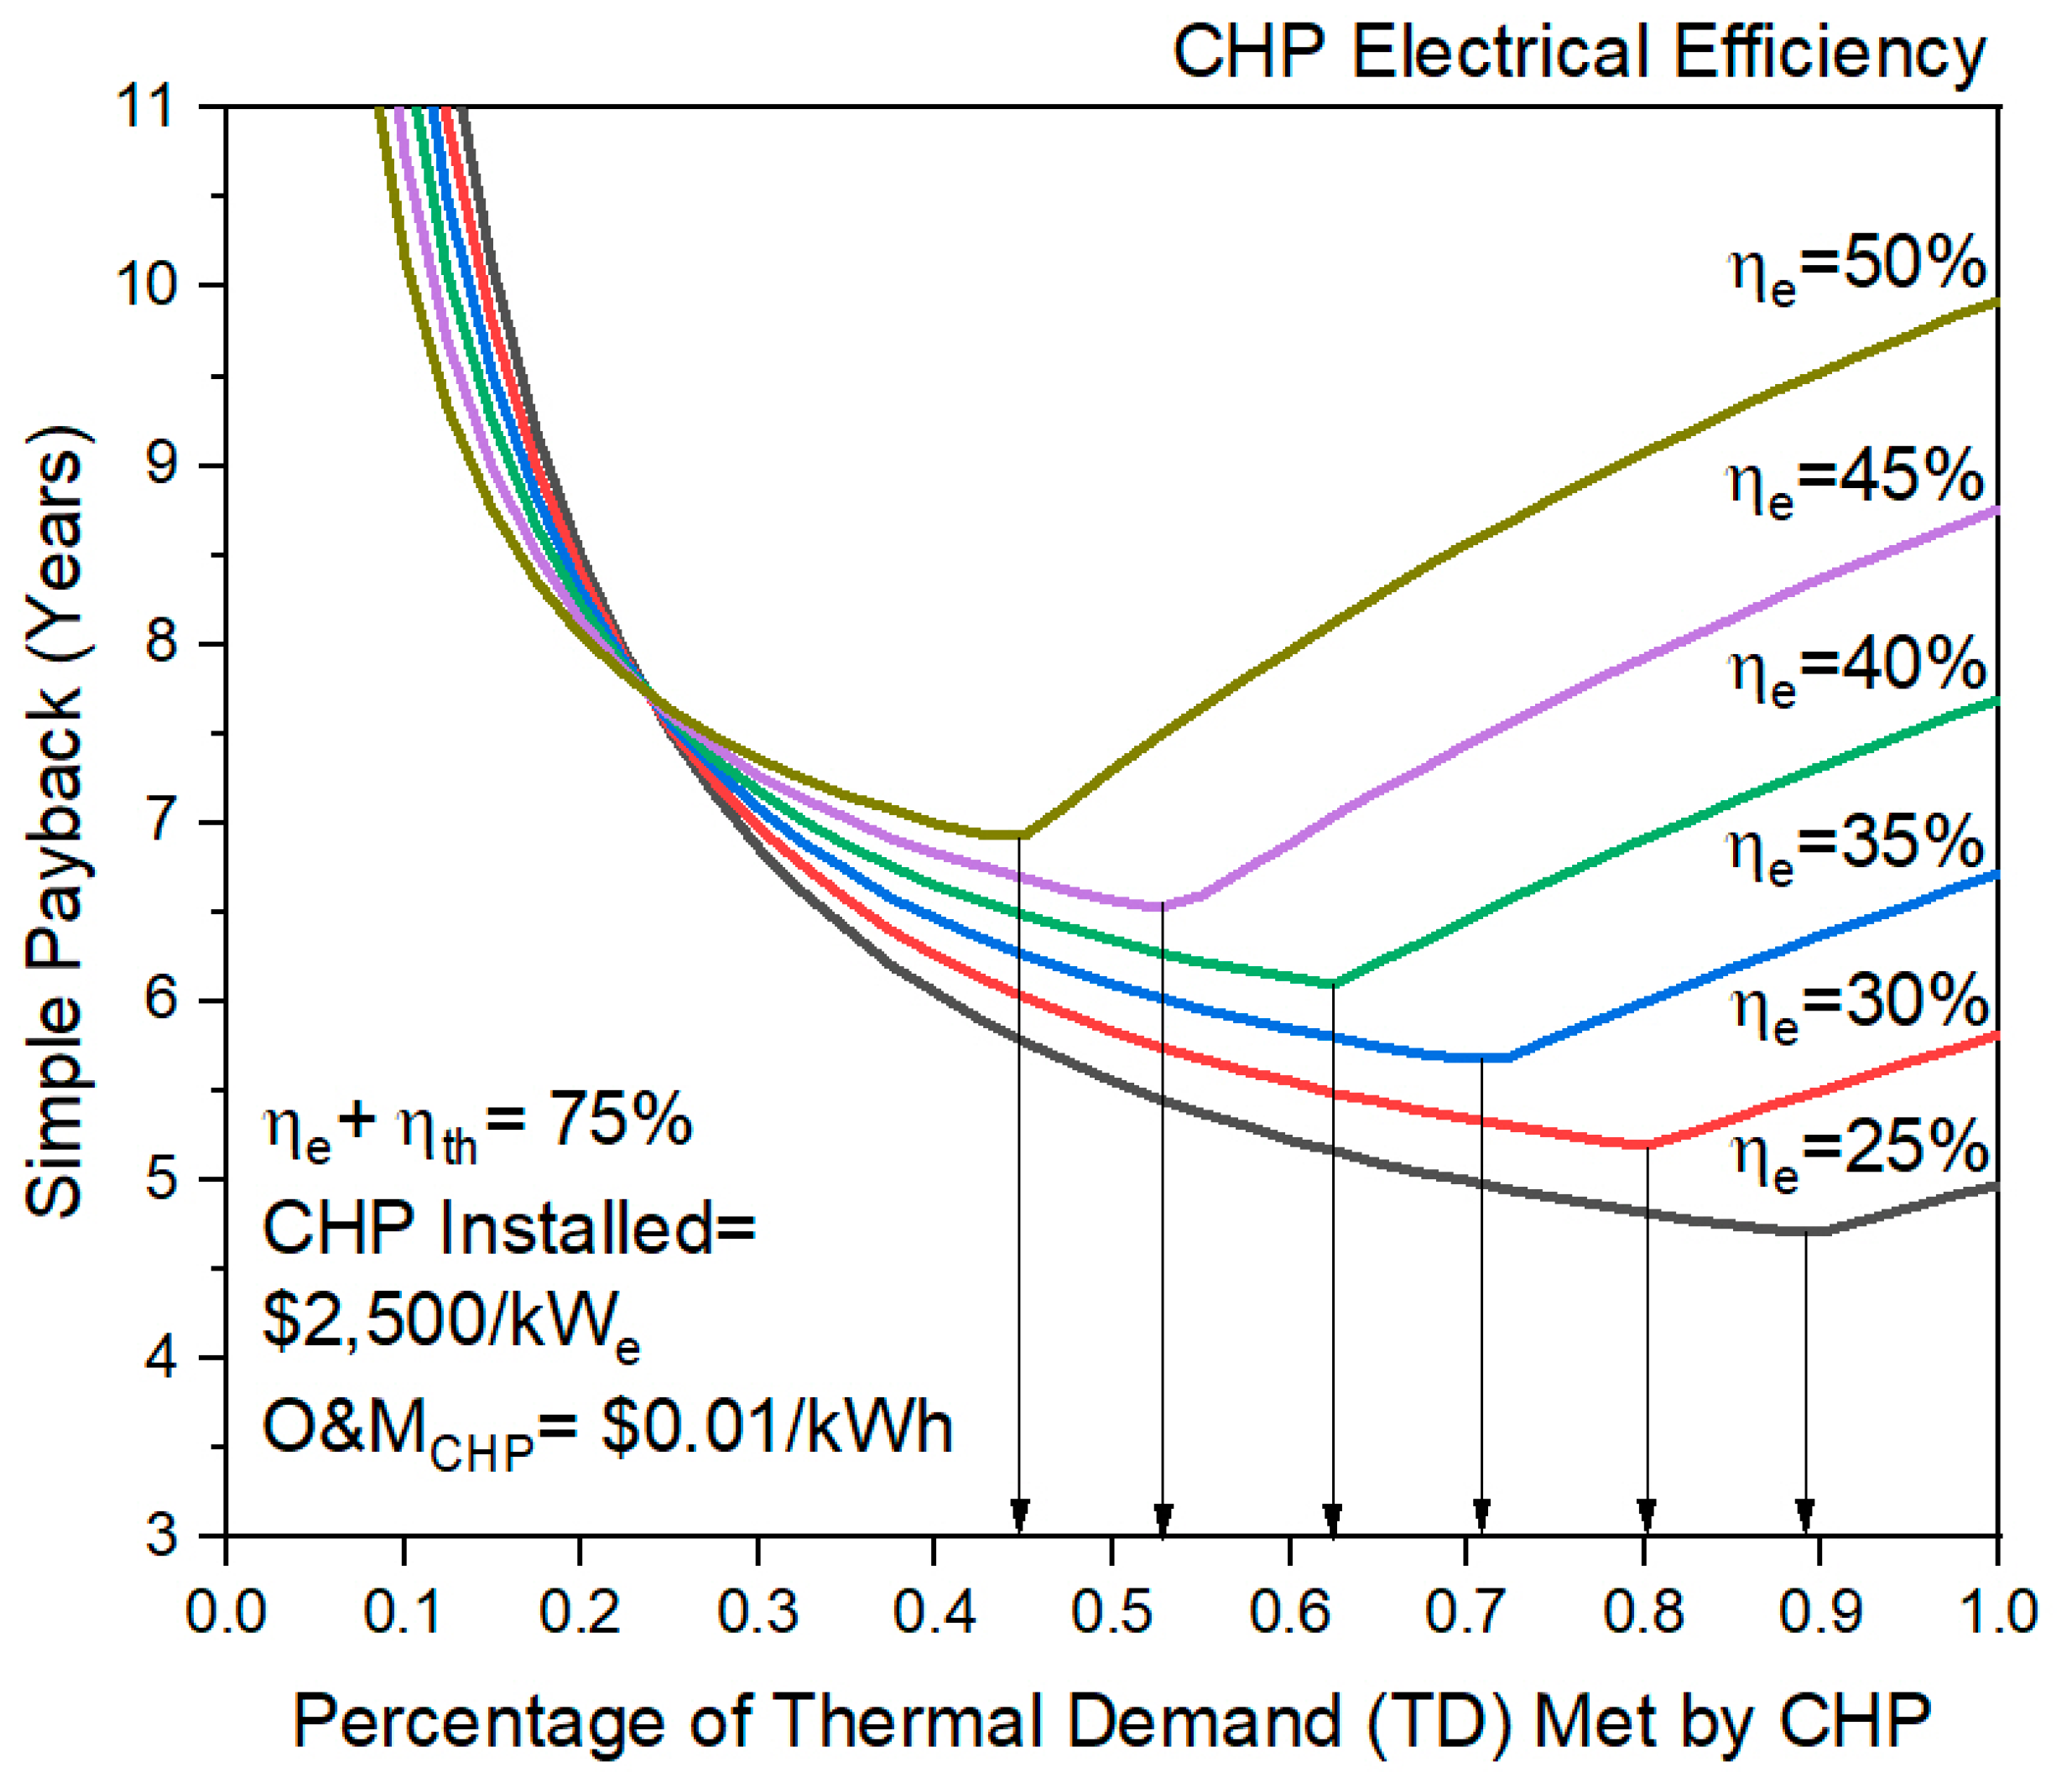
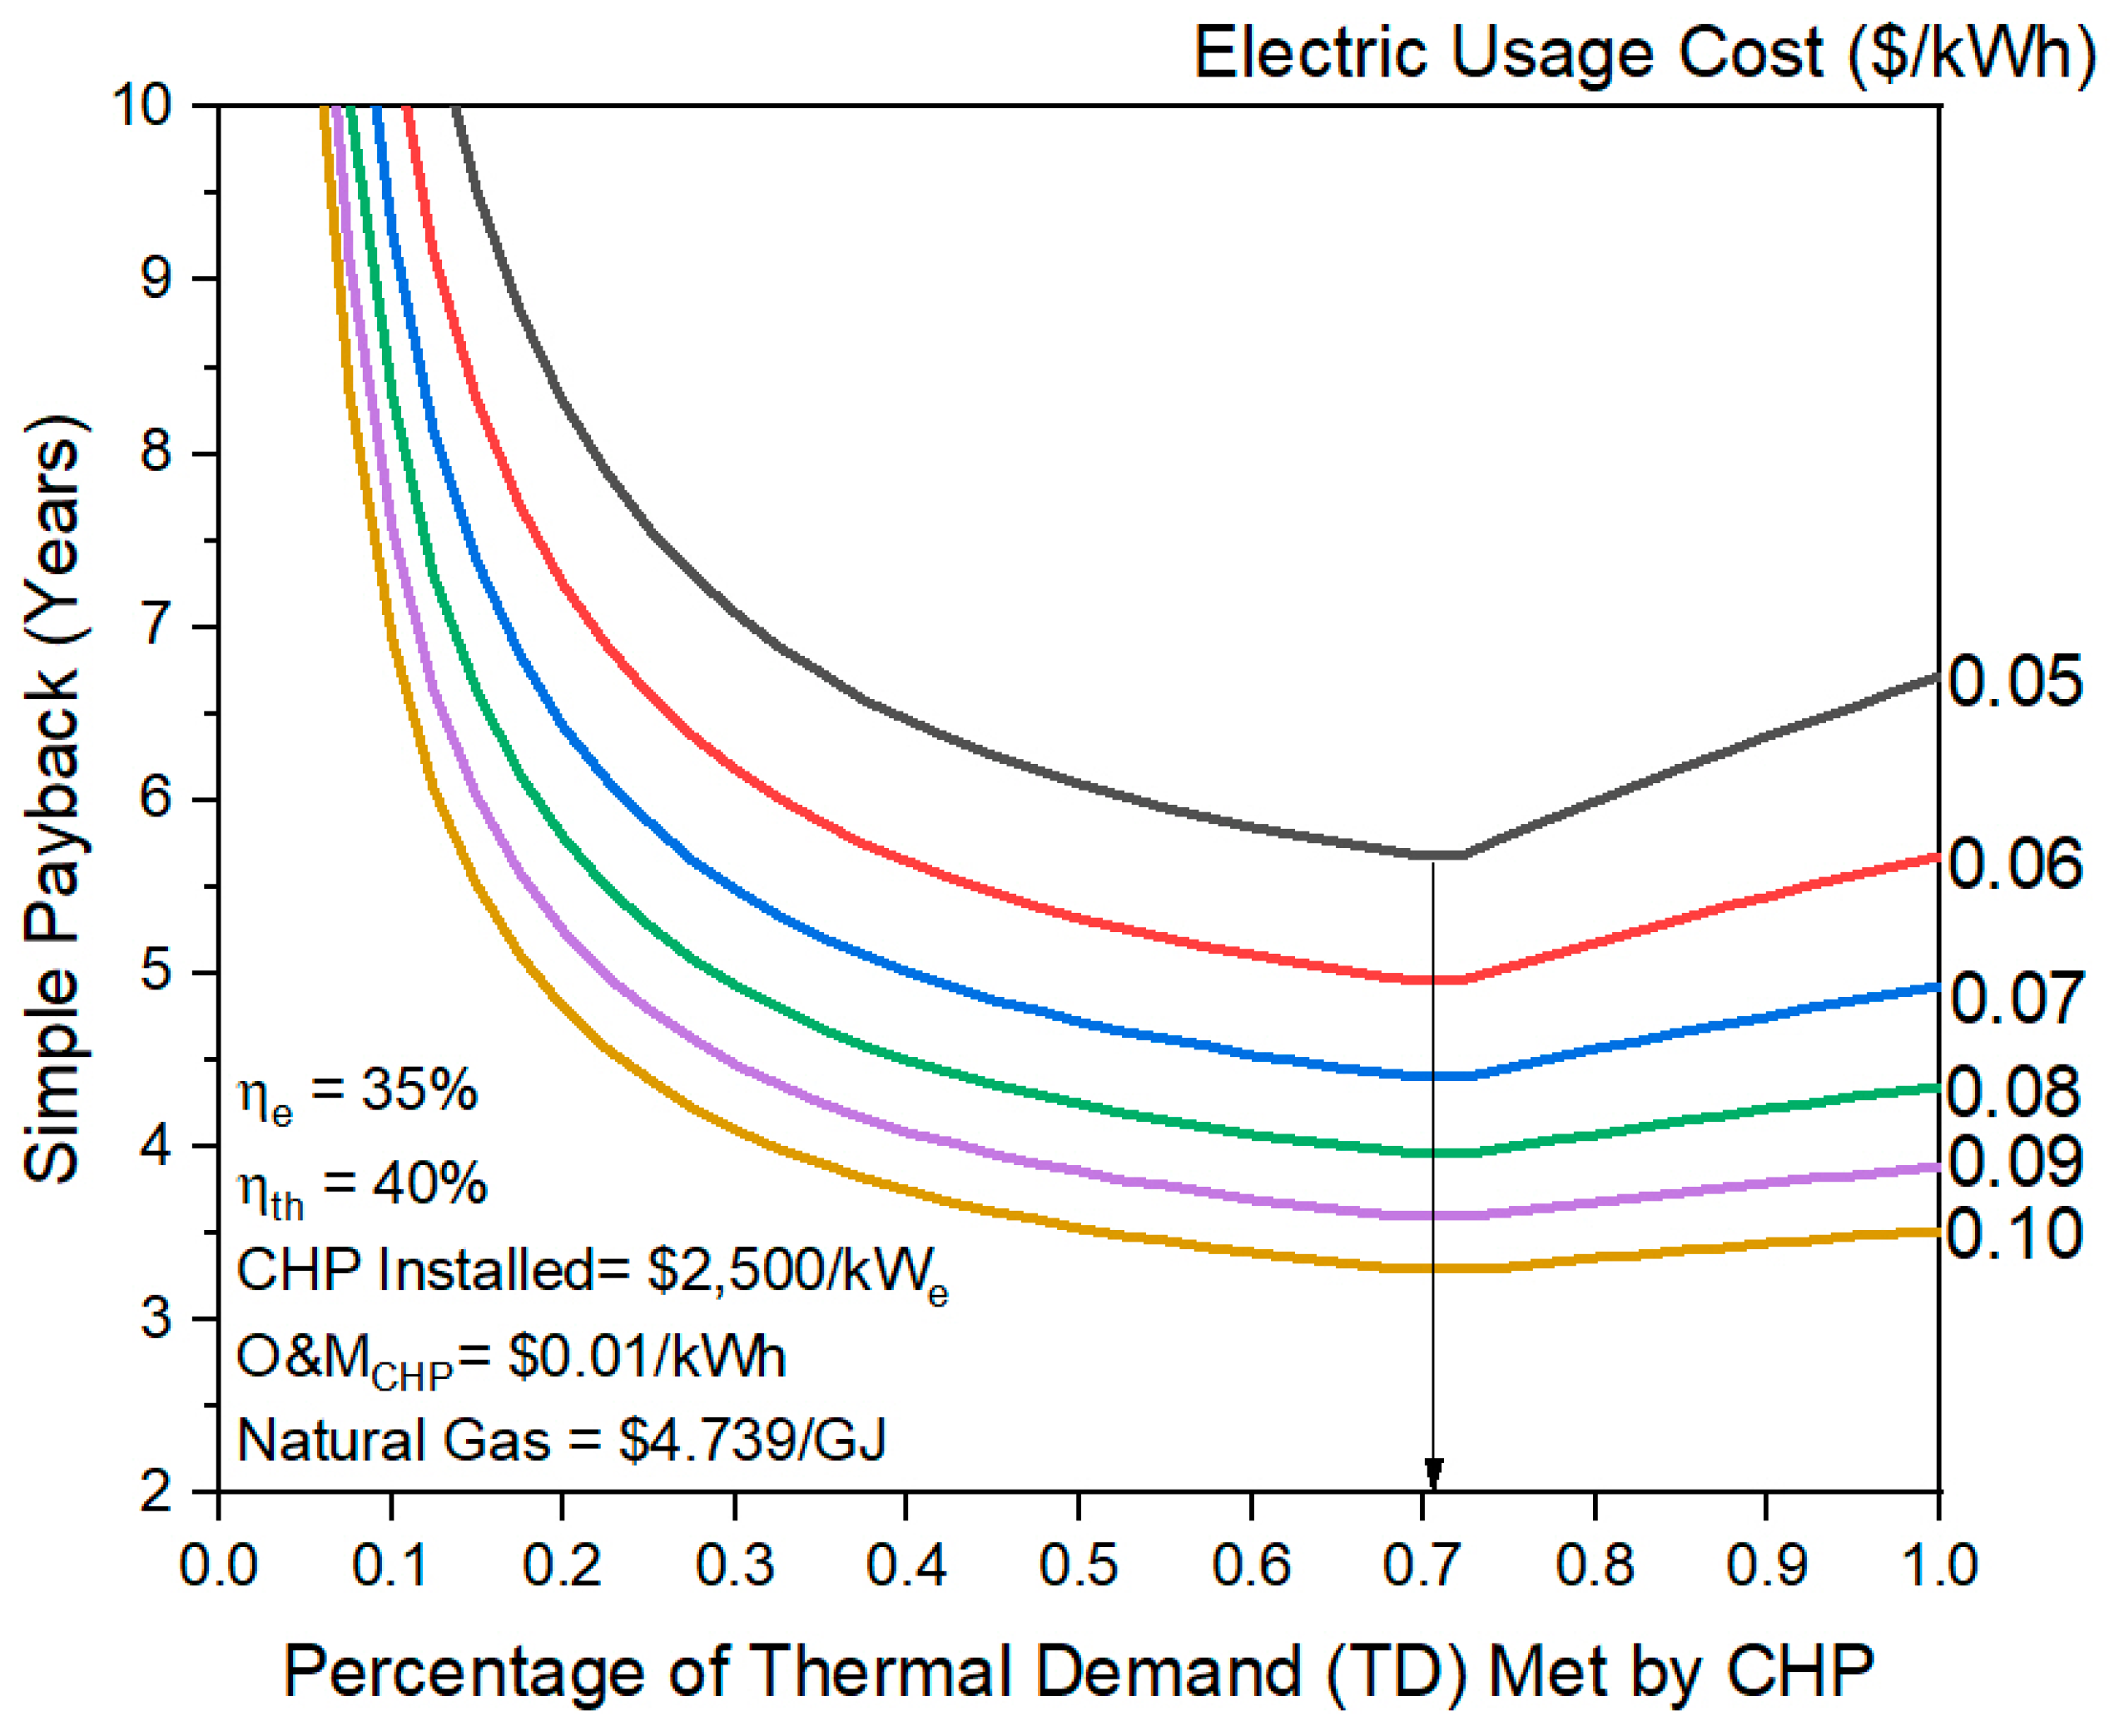
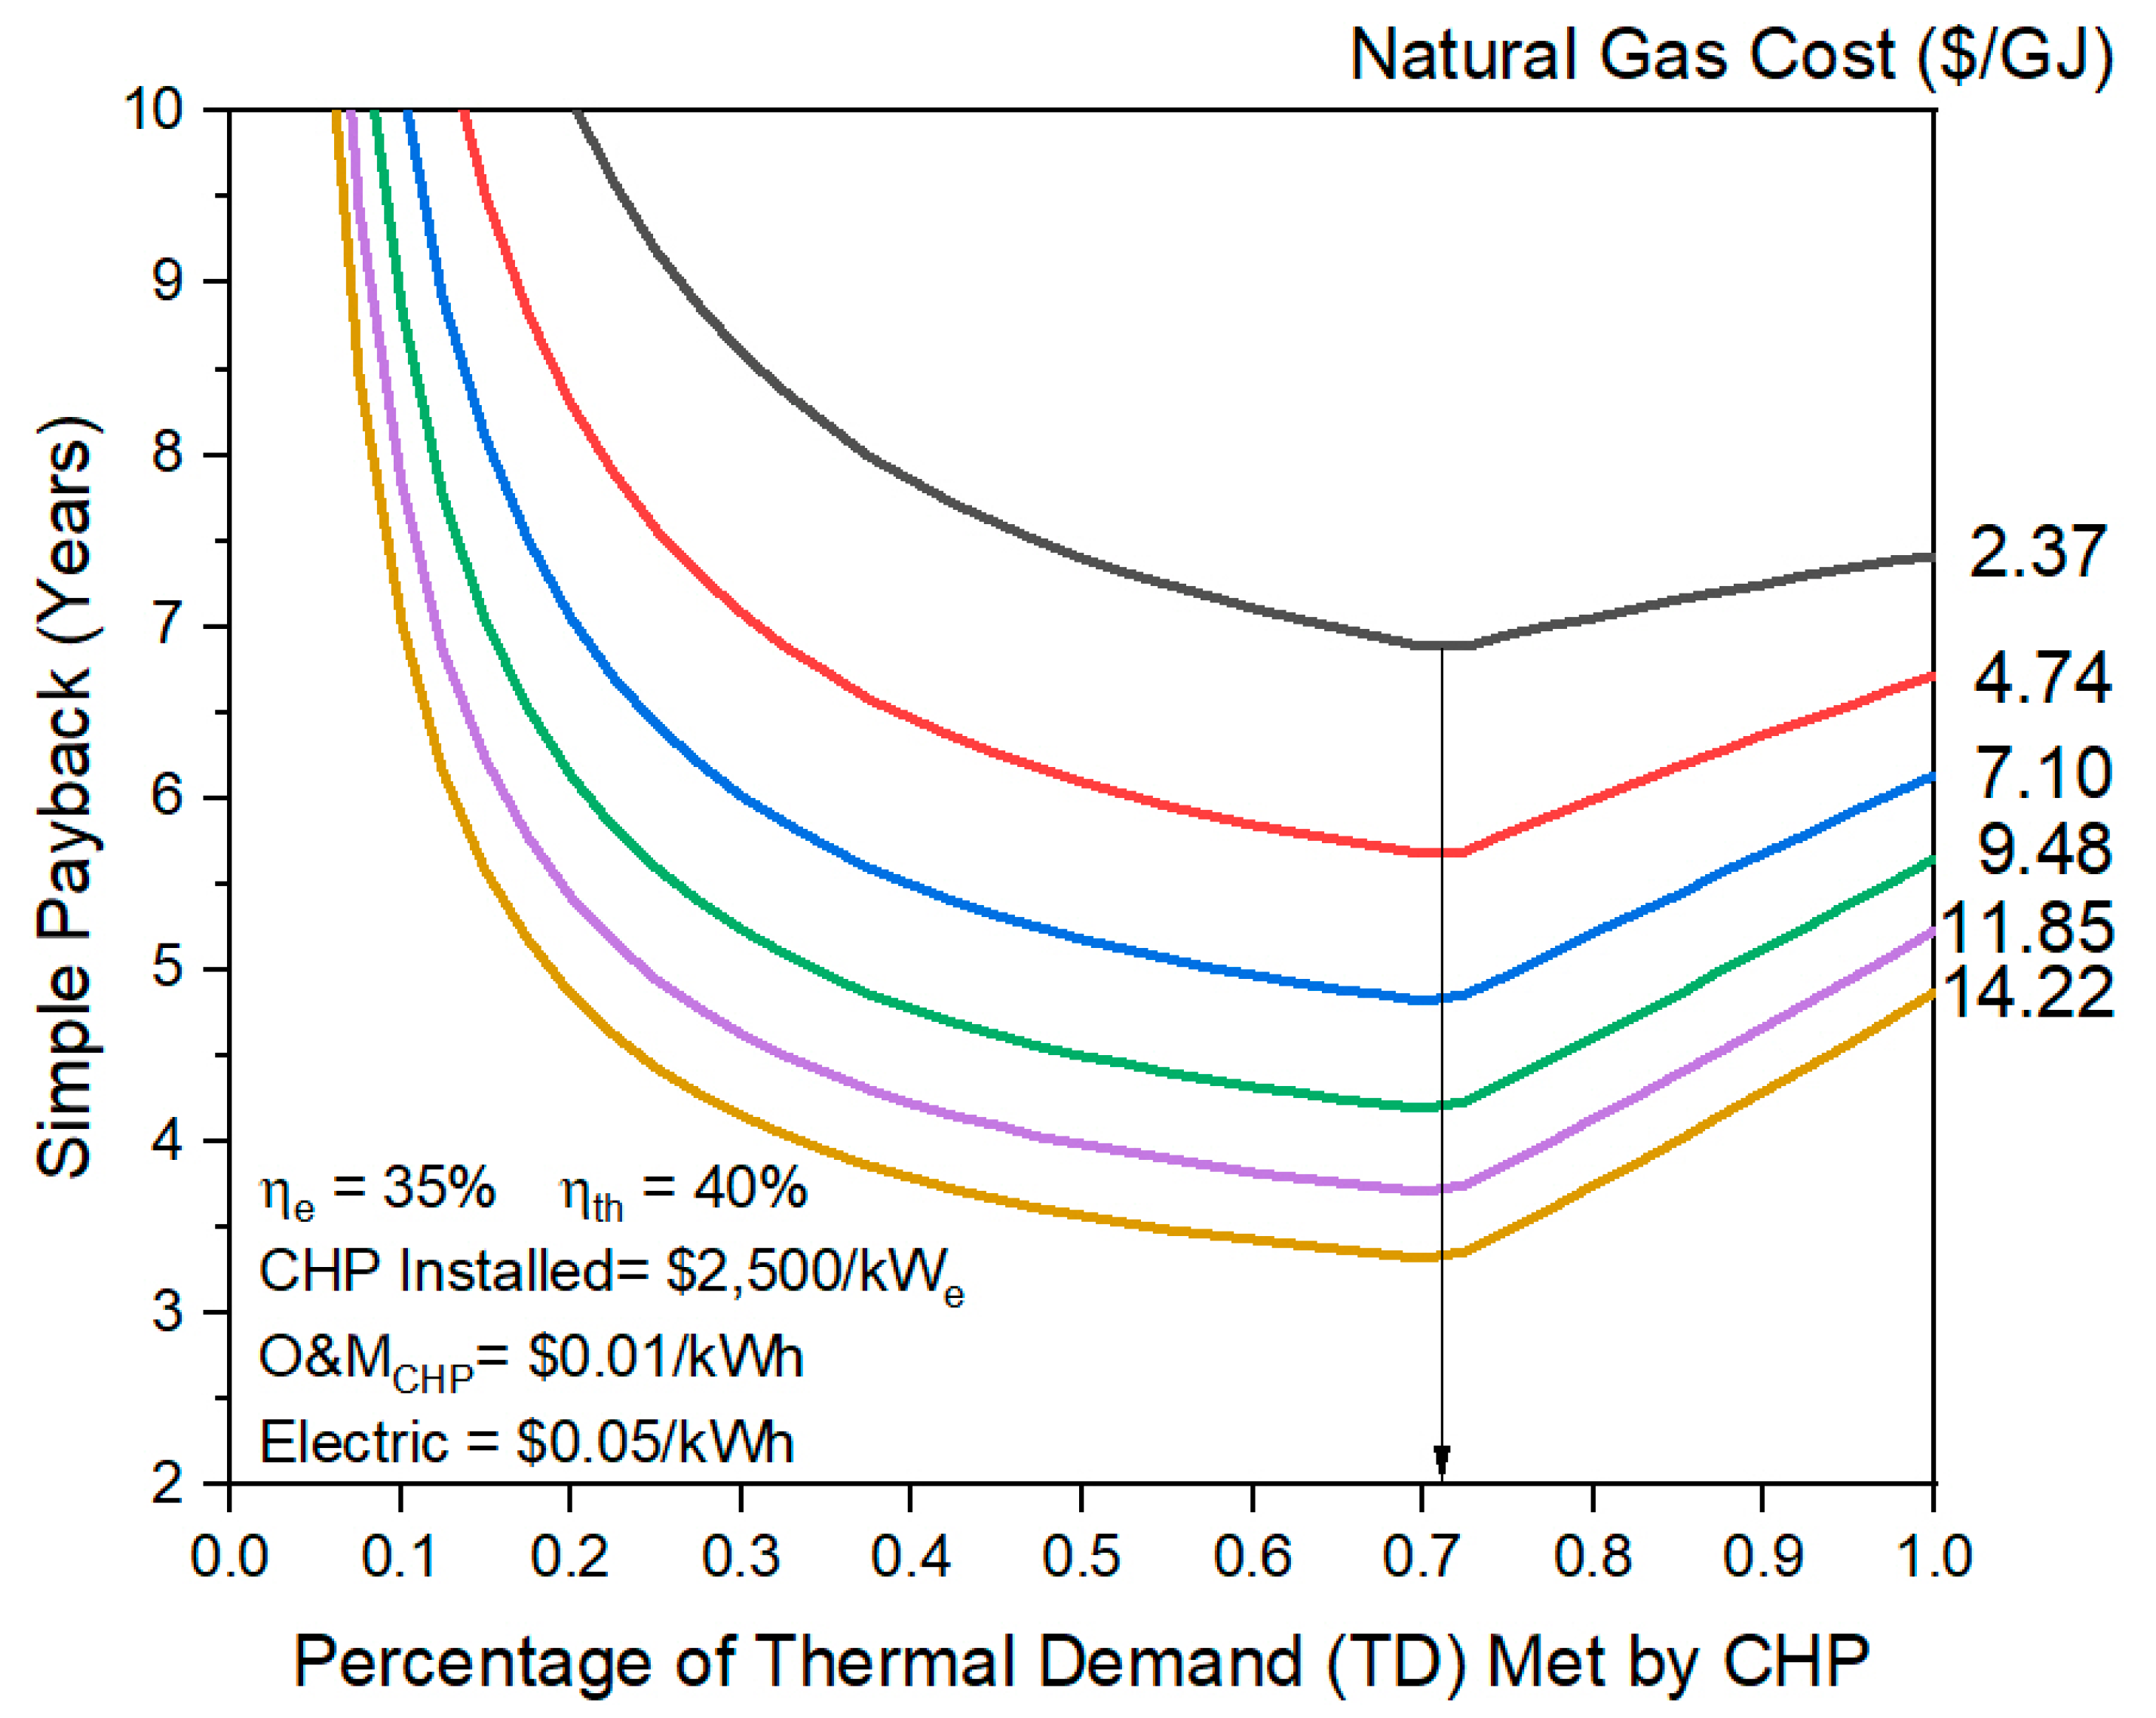
  • For the techno-economic assessment, linear relationships were generally assumed for costs and savings in utilities, cleaning, and installation. Natural gas savings, however, had a peaked linear relationship, increasing until a certain point before decreasing again. This occurs because there is insufficient biogas to meet facilities’ entire thermal demand. In the provided case study, optimal payback was found to be 5.68 years with a net present value of roughly USD 709,000. This depended heavily on the amount of biogas produced, natural gas purchased, CHP system efficiencies and the amount of thermal demand to be met. This case study found that roughly 71% of the thermal demand should be met at the studied WWTP for optimal savings. By modifying several parameters in the CHP system case study, payback periods changed significantly.

Author Contributions

Conceptualization, P.P., J.R.V. and R.J.M.; data curation, J.T. and R.J.M.; formal analysis, D.M.R.; funding acquisition, P.P., J.R.V. and R.J.M.; investigation, J.T.; methodology, D.M.R., J.R.V., R.J.M.; project administration, R.J.M.; software, D.M.R.; validation, D.M.R., J.R.V. and R.J.M.; writing—original draft preparation, D.M.R., G.G.-D. and R.J.M.; writing—review and editing, D.M.R., J.T., G.G.-D., P.P., J.R.V., R.J.M. All authors have read and agreed to the published version of the manuscript.

Funding

This material is based upon work supported by the U.S. Department of Energy under award number DE-EE0007721.

Conflicts of Interest

The authors declare no conflict of interest. The funders had no role in the design of the study; in the collection, analyses, or interpretation of data; in the writing of the manuscript, or in the decision to publish the results.

References

  1. Copeland, C.; Carter, N.T. Energy—Water Nexus: The Water Sector’s Energy Use; Congressional Research Service: Washington, DC, USA, 2017.
  2. EERE 2020 Wastewater infrastructure. Available online: https://www.energy.gov/eere/slsc/wastewater-infrastructure (accessed on 20 May 2020).
  3. Shen, Y.; Linville, J.L.; Urgun-Demirtas, M.; Mintz, M.M.; Snyder, S.W. An overview of biogas production and utilization at full-scale wastewater treatment plants (WWTPs) in the United States: Challenges and opportunities towards energy-neutral WWTPs. Renew. Sustain. Energy Rev. 2015, 50, 346–362. [Google Scholar] [CrossRef] [Green Version]
  4. Energy Conservation-Wastewater Management Fact Sheet; U.S. Environmental Protection Agency: Washington, DC, USA, 2006.
  5. Curtis, T.P. Low-energy wastewater treatment: Strategies and technologies. In Environmental Microbiology; Mitchell, R., Gu, J.D., Eds.; Wiley-Blackwell: Hoboken, NJ, USA, 2010. [Google Scholar]
  6. Water Environment Research Foundation (WERF). Energy Production and Efficiency Research—The Roadmap to Net-Zero Energy; Water Environment Research Foundation (WERF): Alexandria, VA, USA, 2011. [Google Scholar]
  7. Frijns, J.; Hofman, J.; Nederlof, M. The potential of (waste)water as energy carrier. Energy Convers. Manag. 2013, 65, 357–363. [Google Scholar] [CrossRef]
  8. McCarty, P.L.; Bae, J.; Kim, J. Domestic Wastewater Treatment as a Net Energy Producer–Can This be Achieved? Environ. Sci. Technol. 2011, 45, 7100–7106. [Google Scholar] [CrossRef] [PubMed]
  9. Bauer, D.; Philbrick, M.; Vallario, B.; Battey, H.; Clement, Z.; Fields, F.; Li, J. The Water-Energy Nexus: Challenges and Opportunities; U.S. Department of Energy: Washington, DC, USA, 2014.
  10. Wastewater Efficiency and Treatment Act. of 2019; 116th Congress (2019–2020). Available online: https://www.congress.gov/bill/116th-congress/senate-bill/3046 (accessed on 3 September 2020).
  11. Energy Efficiency in Water and Wastewater Facilities A Guide to Developing and Implementing Greenhouse Gas. Reduction Programs; U.S. Environmental Protection Agency: Washington, DC, USA, 2013.
  12. Madi, H.; Diethelm, S.; Poitel, S.; Ludwig, C.; Van herle, J. Damage of Siloxanes on Ni-YSZ Anode Supported SOFC Operated on Hydrogen and Bio-Syngas. Fuel Cells 2015, 15, 718–727. [Google Scholar] [CrossRef]
  13. Goff, C. Combined heat and power at wastewater treatment facilities: Market analysis and lessons from the field. In Proceedings of the Northeast Biomass Conference, Pittsburgh, PA, USA, 11–13 October 2011. [Google Scholar]
  14. Ryckebosch, E.; Drouillon, M.; Vervaeren, H. Techniques for transformation of biogas to biomethane. Biomass Bioenergy 2011, 35, 1633–1645. [Google Scholar] [CrossRef]
  15. Wheless, E.; Pierce, J. Siloxanes in Landfill and Digester Gas Update. In Proceedings of the 27th SWANA LFG Symposium, San Antonio, TX, USA, 22–25 March 2004. [Google Scholar]
  16. Lanzini, A.; Madi, H.; Chiodo, V.; Papurello, D.; Maisano, S.; Santarelli, M.; Van herle, J. Dealing with fuel contaminants in biogas-fed solid oxide fuel cell (SOFC) and molten carbonate fuel cell (MCFC) plants: Degradation of catalytic and electro-catalytic active surfaces and related gas purification methods. Prog. Energy Combust. Sci. 2017, 61, 150–188. [Google Scholar] [CrossRef] [Green Version]
  17. Atkinson, A.J.; Apul, O.G.; Schneider, O.; Garcia-Segura, S.; Westerhoff, P. Nanobubble Technologies Offer Opportunities To Improve Water Treatment. Acc. Chem. Res. 2019, 52, 1196–1205. [Google Scholar] [CrossRef]
  18. National Research Council. Chapter 3: Municipal Wastewater and Sludge Treatment. In Use of Reclaimed Water and Sludge in Food Crop Production; National Academies Press: Washington, DC, USA, 1996. [Google Scholar]
  19. Metcalf & Eddy Inc. Wastewater Engineering: Treatment and Reuse, 4th ed.; McGraw Hill: New York, NY, USA, 2003. [Google Scholar]
  20. Dick, R.I. Sludge Treatment. In Physicochemical Processes for Water Quality Control; Weber, W.J., Jr., Ed.; John Wiley and Sons: Hoboken, NJ, USA, 1972; pp. 533–596. [Google Scholar]
  21. Vesilind, P.A. Treatment and Disposal of Wastewater Sludges; Ann Arbor Science Publishers: Ann Arbor, MI, USA, 1975; ISBN 9780250400638. [Google Scholar]
  22. U.S. Environmental Protection Agency. Basic Information about Anaerobic Digestion (AD). Available online: https://www.epa.gov/anaerobic-digestion/basic-information-about-anaerobic-digestion-ad#HowADworks (accessed on 3 September 2020).
  23. Schnaars, K. What every operator should know about anaerobic digestion. Water Environ. Technol. 2012, 24, 82–83. [Google Scholar]
  24. Kaparaju, P.; Rintala, J. Generation of heat and power from biogas for stationary applications: Boilers, gas engines and turbines, combined heat and power (CHP) plants and fuel cells. In The Biogas Handbook; Elsevier: Amsterdam, The Netherlands, 2013; pp. 404–427. ISBN 9780857097415. [Google Scholar]
  25. Wasajja, H.; Lindeboom, R.E.F.; van Lier, J.B.; Aravind, P.V. Techno-economic review of biogas cleaning technologies for small scale off-grid solid oxide fuel cell applications. Fuel Process. Technol. 2020, 197, 106215. [Google Scholar] [CrossRef]
  26. Dewil, R.; Appels, L.; Baeyens, J. Energy use of biogas hampered by the presence of siloxanes. Energy Convers. Manag. 2006, 47, 1711–1722. [Google Scholar] [CrossRef]
  27. Arnold, M. Reduction and Monitoring of Biogas Trace Compounds; Valtion Teknillinen Tutkimuskeskus (VTT): Espoo, Finland, 2009. [Google Scholar]
  28. Burton, F.L. Water and Wastewater Industries: Characteristics and Energy Management Opportunities; Electric Power Research Institute: Palo Alto, CA, USA, 1996. [Google Scholar]
  29. U.S. Environmental Protection Agency Combined Heat and Power Partnership. Opportunities for Combined Heat and Power at Wastewater Treatment Facilities: Market Analysis and Lessons from the Field. Proc. Water Environ. Fed. 2012, 2012, 4532–4588. [Google Scholar] [CrossRef]
  30. U.S. Environmental Protection Agency Combined Heat and Power Partnership. Opportunites for and Benefits of Combined Heat and Power at Wastewater Treatment Facilities; U.S. Environmental Protection Agency Combined Heat and Power Partnership: Washington, DC, USA, 2007.
  31. Corigliano, O.; Fragiacomo, P. Technical analysis of hydrogen-rich stream generation through CO2 reforming of biogas by using numerical modeling. Fuel 2015, 158, 538–548. [Google Scholar] [CrossRef]
  32. Galvagno, A.; Chiodo, V.; Urbani, F.; Freni, F. Biogas as hydrogen source for fuel cell applications. Int. J. Hydrog. Energy 2013, 38, 3913–3920. [Google Scholar] [CrossRef]
  33. U.S. Environmental Protection Agency Combined Heat and Power Partnership. Power Generation Technologies. In Biomass CHP Catalog; U.S. Environmental Protection Agency Combined Heat and Power Partnership: Washington, DC, USA, 2007; pp. 62–77. [Google Scholar]
  34. U.S. DOE Combined Heat and Power Technology Fact Sheet Series Overview of CHP Technologies. 2016; pp. 2–5. Available online: https://www.energy.gov/eere/amo/combined-heat-and-power-basics (accessed on 3 September 2020).
  35. U.S. Department of Energy Combined Heat & Power eCatalog: Recognized Packaged CHP Systems. Available online: https://chp.ecatalog.lbl.gov/ (accessed on 3 September 2020).
  36. U.S. Energy Information Administration. Available online: https://www.eia.gov/ (accessed on 3 September 2020).
  37. Darrow, K.; Tidball, R.; Wang, J.; Hampson, A. Catalog of CHP Technologies, Technology Characterization—Reciprocating Internal Combustion Engines. Available online: https://www.epa.gov/sites/production/files/2015-07/documents/catalog_of_chp_technologies_section_2._technology_characterization_-_reciprocating_internal_combustion_engines.pdf (accessed on 1 March 2015).
  38. Chambers, A.; Potter, I. Gas Utilization from Sewage Waste; Alberta Research Council: Edmonton, AB, Canada, 2002; Volume 1. [Google Scholar]
  39. Trendewicz, A.A.; Braun, R.J. Techno-economic analysis of solid oxide fuel cell-based combined heat and power systems for biogas utilization at wastewater treatment facilities. J. Power Sources 2013, 233, 380–393. [Google Scholar] [CrossRef]
  40. Francois, J.; Abdelouahed, L.; Mauviel, G.; Patisson, F.; Mirgaux, O.; Rogaume, C.; Rogaume, Y.; Feidt, M.; Dufour, A. Detailed process modeling of a wood gasification combined heat and power plant. Biomass Bioenergy 2013, 51, 68–82. [Google Scholar] [CrossRef]
  41. Gandiglio, M.; Drago, D.; Santarelli, M. Techno-economic Analysis of a Solid Oxide Fuel Cell Installation in a Biogas Plant Fed by Agricultural Residues and Comparison with Alternative Biogas Exploitation Paths. Energy Procedia 2016, 101, 1002–1009. [Google Scholar] [CrossRef] [Green Version]
  42. Yang, Y.; Brammer, J.G.; Wright, D.G.; Scott, J.A.; Serrano, C.; Bridgwater, A.V. Combined heat and power from the intermediate pyrolysis of biomass materials: Performance, economics and environmental impact. Appl. Energy 2017, 191, 639–652. [Google Scholar] [CrossRef] [Green Version]
  43. United States Environmental Protection Agency. A Comprehensive Analysis of Biodiesel Impacts on Exhaust Emissions; United States Environmental Protection Agency: Washington, DC, USA, 2002.
  44. Lapuerta, M.; Armas, O.; Rodríguez-Fernández, J. Effect of biodiesel fuels on diesel engine emissions. Prog. Energy Combust. Sci. 2008, 34, 198–223. [Google Scholar] [CrossRef]
  45. Di Fraia, S.; Massarotti, N.; Prati, M.V.; Vanoli, L. A new example of circular economy: Waste vegetable oil for cogeneration in wastewater treatment plants. Energy Convers. Manag. 2020, 211, 112763. [Google Scholar] [CrossRef]
  46. Hachem, H.; Gheith, R.; Aloui, F.; Ben Nasrallah, S. Technological challenges and optimization efforts of the Stirling machine: A review. Energy Convers. Manag. 2018, 171, 1365–1387. [Google Scholar] [CrossRef]
  47. Gupta, V.; Sharma, S.; Narayan, S. Review of working of stirling engines. ACTA Tech. Corviniensis 2016, 9, 55. [Google Scholar]
  48. Thiers, S.; Aoun, B.; Peuportier, B. Experimental characterization, modeling and simulation of a wood pellet micro-combined heat and power unit used as a heat source for a residential building. Energy Build. 2010, 42, 896–903. [Google Scholar] [CrossRef]
  49. Flynn, G., Jr.; Percival, W.H.; Heffner, F.E. GMR Stirling thermal engine part of the Stirling engine story-1960 chapter. SAE Trans. 1960, 68, 665–684. [Google Scholar] [CrossRef]
  50. Nepveu, F.; Ferriere, A.; Bataille, F. Thermal model of a dish/Stirling systems. Sol. Energy 2009, 83, 81–89. [Google Scholar] [CrossRef]
  51. Lombardi, K.; Ugursal, V.I.; Beausoleil-Morrison, I. Proposed improvements to a model for characterizing the electrical and thermal energy performance of Stirling engine micro-cogeneration devices based upon experimental observations. Appl. Energy 2010, 87, 3271–3282. [Google Scholar] [CrossRef]
  52. Simons Green Energy Case Study—Micro-CHP Showcase. Available online: https://simonsgreenenergy.com.au/case-studies/case-study-micro-chp-showcase-frankston-victoria/ (accessed on 3 September 2020).
  53. Bartela, Ł.; Kotowicz, J.; Dubiel-Jurgaś, K. Investment risk for biomass integrated gasification combined heat and power unit with an internal combustion engine and a Stirling engine. Energy 2018, 150, 601–616. [Google Scholar] [CrossRef]
  54. Darrow, K.; Tidball, R.; Wang, J.; Hampson, A. Catalog of CHP Technologies, Technology Characterization—Combustion Turbines. Available online: https://www.epa.gov/sites/production/files/2015-07/documents/catalog_of_chp_technologies_section_3._technology_characterization_-_combustion_turbines.pdf (accessed on 1 March 2015).
  55. Olumayegun, O.; Wang, M.; Kelsall, G. Closed-cycle gas turbine for power generation: A state-of-the-art review. Fuel 2016, 180, 694–717. [Google Scholar] [CrossRef]
  56. BP. BP Energy Outlook. 2019. Available online: https://www.bp.com/content/dam/bp/business-sites/en/global/corporate/pdfs/energy-economics/energy-outlook/bp-energy-outlook-2019.pdf (accessed on 3 September 2020).
  57. Capstone Turbine Corporation Pennsylvania State Employees Credit Union. 2015. Available online: https://understandingchp.com/files/2017/03/Office-Building_Microturbine_Capstone-PA_State_Credit_Union.pdf (accessed on 3 September 2020).
  58. Energy Solutions Center Combustion Turbine CHP System for Food Processing Industry. Available online: http://www.energysolutionscenter.org/assets/1/AssetManager/Fact_Sheet_Frito%20Lay_DOE-ESC_Summer_2011-2.pdf (accessed on 3 September 2020).
  59. Solar Turbines Inc. 16 MWe-Natural Gas Fuel Tri-Generation Power Plant; Solar Turbines Inc.: San Diego, CA, USA, 2013. [Google Scholar]
  60. Power-Technology Charlton Power Plant, Massachusetts, USA. Available online: https://www.power-technology.com/projects/charlton/ (accessed on 3 September 2020).
  61. Moné, C.D.; Chau, D.S.; Phelan, P.E. Economic feasibility of combined heat and power and absorption refrigeration with commercially available gas turbines. Energy Convers. Manag. 2001, 42, 1559–1573. [Google Scholar] [CrossRef]
  62. Peirs, J.; Reynaerts, D.; Verplaetsen, F. A microturbine for electric power generation. Sens. Actuators A Phys. 2004, 113, 86–93. [Google Scholar] [CrossRef]
  63. Rist, J.F.; Dias, M.F.; Palman, M.; Zelazo, D.; Cukurel, B. Economic dispatch of a single micro-gas turbine under CHP operation. Appl. Energy 2017, 200, 1–18. [Google Scholar] [CrossRef]
  64. Helal, A.; Ghoneim, W.; Halaby, A. Feasibility Study for Self-Sustained Wastewater Treatment Plants—Using Biogas CHP Fuel Cell, Micro-Turbine, PV and Wind Turbine Systems. Smart Grid Renew. Energy 2013, 4, 227–235. [Google Scholar] [CrossRef] [Green Version]
  65. Bin Basrawi, M.F.; Yamada, T.; Nakanishi, K.; Katsumata, H. Analysis of the performances of biogas-fuelled micro gas turbine cogeneration systems (MGT-CGSs) in middle- and small-scale sewage treatment plants: Comparison of performances and optimization of MGTs with various electrical power outputs. Energy 2012, 38, 291–304. [Google Scholar] [CrossRef]
  66. Movahed, P.; Avami, A. Techno-economic optimization of biogas-fueled micro gas turbine cogeneration systems in sewage treatment plant. Energy Convers. Manag. 2020, 218, 112965. [Google Scholar] [CrossRef]
  67. Kaikko, J.; Backman, J. Technical and economic performance analysis for a microturbine in combined heat and power generation. Energy 2007, 32, 378–387. [Google Scholar] [CrossRef]
  68. Milcarek, R.J.; Ahn, J.; Zhang, J. Review and analysis of fuel cell-based, micro-cogeneration for residential applications: Current state and future opportunities. Sci. Technol. Built Environ. 2017, 23, 1224–1243. [Google Scholar] [CrossRef]
  69. Zuliani, N.; Taccani, R. Microcogeneration system based on HTPEM fuel cell fueled with natural gas: Performance analysis. Appl. Energy 2012, 97, 802–808. [Google Scholar] [CrossRef]
  70. Wilberforce, T.; El-Hassan, Z.; Khatib, F.N.; Al Makky, A.; Baroutaji, A.; Carton, J.G.; Thompson, J.; Olabi, A.G. Modelling and simulation of Proton Exchange Membrane fuel cell with serpentine bipolar plate using MATLAB. Int. J. Hydrog. Energy 2017, 42, 25639–25662. [Google Scholar] [CrossRef] [Green Version]
  71. Milcarek, R.J.; Ahn, J. Micro-Tubular Solid Oxide Fuel Cell Polarization and Impedance Variation With Thin Porous Samarium-Doped Ceria and Gadolinium-Doped Ceria Buffer Layer Thickness. J. Electrochem. Energy Convers. Storage 2020, 18, 021004. [Google Scholar] [CrossRef]
  72. Milcarek, R.J.; Nakamura, H.; Tezuka, T.; Maruta, K.; Ahn, J. Microcombustion for micro-tubular flame-assisted fuel cell power and heat cogeneration. J. Power Sources 2019, 413, 191–197. [Google Scholar] [CrossRef]
  73. Milcarek, R.J.; Nakamura, H.; Tezuka, T.; Maruta, K.; Ahn, J. Investigation of microcombustion reforming of ethane/air and micro-Tubular Solid Oxide Fuel Cells. J. Power Sources 2020, 450, 227606. [Google Scholar] [CrossRef]
  74. Kirubakaran, A.; Jain, S.; Nema, R.K. A review on fuel cell technologies and power electronic interface. Renew. Sustain. Energy Rev. 2009, 13, 2430–2440. [Google Scholar] [CrossRef]
  75. Giarola, S.; Forte, O.; Lanzini, A.; Gandiglio, M.; Santarelli, M.; Hawkes, A. Techno-economic assessment of biogas-fed solid oxide fuel cell combined heat and power system at industrial scale. Appl. Energy 2018, 211, 689–704. [Google Scholar] [CrossRef] [Green Version]
  76. Milcarek, R.J.; Garrett, M.J.; Welles, T.S.; Ahn, J. Performance investigation of a micro-tubular flame-assisted fuel cell stack with 3,000 rapid thermal cycles. J. Power Sources 2018, 394, 86–93. [Google Scholar] [CrossRef]
  77. Kubota, K.; Kuroda, K.; Akiyama, K. Present Status and Future Prospects of Biogas Powered Fuel Cell Power Units. Fuji Electr. Rev. 2002, 49, 68–72. [Google Scholar]
  78. Pellegrino, S.; Lanzini, A.; Leone, P. Techno-economic and policy requirements for the market-entry of the fuel cell micro-CHP system in the residential sector. Appl. Energy 2015, 143, 370–382. [Google Scholar] [CrossRef]
  79. Milcarek, R.J.; DeBiase, V.P.; Ahn, J. Investigation of startup, performance and cycling of a residential furnace integrated with micro-tubular flame-assisted fuel cells for micro-combined heat and power. Energy 2020, 196, 117148. [Google Scholar] [CrossRef]
  80. MosayebNezhad, M.; Mehr, A.S.; Gandiglio, M.; Lanzini, A.; Santarelli, M. Techno-economic assessment of biogas-fed CHP hybrid systems in a real wastewater treatment plant. Appl. Therm. Eng. 2018, 129, 1263–1280. [Google Scholar] [CrossRef]
  81. Henke, M.; Willich, C.; Westner, C.; Leucht, F.; Leibinger, R.; Kallo, J.; Friedrich, K.A. Effect of pressure variation on power density and efficiency of solid oxide fuel cells. Electrochim. Acta 2012, 66, 158–163. [Google Scholar] [CrossRef]
  82. Krummrein, T.; Henke, M.; Kutne, P.; Aigner, M. Numerical analysis of operating range and SOFC-off-gas combustor requirements of a biogas powered SOFC-MGT hybrid power plant. Appl. Energy 2018, 232, 598–606. [Google Scholar] [CrossRef] [Green Version]
  83. Ghotkar, R.; Milcarek, R.J. Investigation of flame-assisted fuel cells integrated with an auxiliary power unit gas turbine. Energy 2020, 204, 117979. [Google Scholar] [CrossRef]
  84. Kim, S.; Kim, K.C. Performance Analysis of Biogas-Fueled SOFC/MGT Hybrid Power System in Busan, Republic of Korea. Proceedings 2018, 2, 605. [Google Scholar] [CrossRef] [Green Version]
  85. Gandiglio, M.; Lanzini, A.; Santarelli, M.; Acri, M.; Hakala, T.; Rautanen, M. Results from an industrial size biogas-fed SOFC plant (the DEMOSOFC project). Int. J. Hydrog. Energy 2020, 45, 5449–5464. [Google Scholar] [CrossRef]
  86. Hagmann, M.; Heimbrand, E.; Hentschel, P. Determination of siloxanes in biogas from landfills and sewage treatment plants. In Proceedings of the Sardinia 99, Seventh International Waste Management and Landfill Symposium, Cagliari, Italy, 4–8 October 1999. [Google Scholar]
  87. Stanuch, I.; Sozańska, M.; Biegańska, J.; Cebula, J.; Nowak, J. Fluctuations of the elemental composition in the layers of mineral deposits formed on the elements of biogas engines. Sci. Rep. 2020, 10, 4244. [Google Scholar] [CrossRef] [PubMed]
  88. Ajhar, M.; Travesset, M.; Yüce, S.; Melin, T. Siloxane removal from landfill and digester gas – A technology overview. Bioresour. Technol. 2010, 101, 2913–2923. [Google Scholar] [CrossRef]
  89. Papurello, D.; Silvestri, S.; Tomasi, L.; Belcari, I.; Biasioli, F.; Santarelli, M. Biowaste for SOFCs. Energy Procedia 2016, 101, 424–431. [Google Scholar] [CrossRef] [Green Version]
  90. Madi, H.; Lanzini, A.; Diethelm, S.; Papurello, D.; Van Herle, J.; Lualdi, M.; Gutzon Larsen, J.; Santarelli, M. Solid oxide fuel cell anode degradation by the effect of siloxanes. J. Power Sources 2015, 279, 460–471. [Google Scholar] [CrossRef]
  91. Papurello, D.; Lanzini, A.; Leone, P.; Santarelli, M.; Silvestri, S. Biogas from the organic fraction of municipal solid waste: Dealing with contaminants for a solid oxide fuel cell energy generator. Waste Manag. 2014, 34, 2047–2056. [Google Scholar] [CrossRef]
  92. Veyo, S.E. Evaluation of Fuel Impurity Effects on Solid Oxide Fuel Cell Performance; Federal Energy Technology Center: Pittsburgh, PA, USA, 1998.
  93. Hasegawa, T. Gas Turbine Combustion and Ammonia Removal Technology of Gasified Fuels. Energies 2010, 3, 335–449. [Google Scholar] [CrossRef]
  94. Cigolotti, V. Non-Conventional Waste-Derived Fuels for Molten Carbonate Fuel Cells. Ph.D. Thesis, università degli studi di napoli federico ii, Naples, Italy, 2009. [Google Scholar]
  95. Bolhàr-Nordenkampf, M.; Rauch, R.; Bosch, K.; Aichernig, C.; Hofbauer, H. Biomass CHP Plant Güssing–using Gasification for Power Generation. In Proceedings of the 2nd Regional Conference on Energy Technology Towards a Clean Environment, Phuket, Thailand, 12–14 February 2003; pp. 566–572. [Google Scholar]
  96. Lee, J.G.; Jun, J.; Kim, T.H.; Ahn, B.; Park, K.; Choi, D.S.; Park, J.Y. Biogas Purifying for Application of MCFC. ECS Trans. 2007, 5, 733–738. [Google Scholar] [CrossRef]
  97. Papadias, D.D.; Ahmed, S.; Kumar, R. Fuel quality issues with biogas energy—An economic analysis for a stationary fuel cell system. Energy 2012, 44, 257–277. [Google Scholar] [CrossRef]
  98. Schomaker, A.H.H.M.; Boerboom, A.A.M.; Visser, A.; Pfeifer, A.E. Anaerobic Digestion of Agro-Industrial Wastes: Information Networks. Available online: https://silo.tips/download/anaerobic-digestion-of-agro-industrial-wastes-information-networks-technical-sum# (accessed on 25 January 2000).
  99. Petersson, A.; Wellinger, A. Biogas Upgrading Technologies-Developments and Innovations Task 37-Energy from Biogas and Landfill Gas; IEA bioenergy: Paris, France, 2009. [Google Scholar]
  100. Zuber, C.; Husmann, M.; Schroettner, H.; Hochenauer, C.; Kienberger, T. Investigation of sulfidation and regeneration of a ZnO-adsorbent used in a biomass tar removal process based on catalytic steam reforming. Fuel 2015, 153, 143–153. [Google Scholar] [CrossRef]
  101. Schweigkofler, M.; Niessner, R. Removal of siloxanes in biogases. J. Hazard. Mater. 2001, 83, 183–196. [Google Scholar] [CrossRef]
  102. Lee, S.H.; Cho, W.; Song, T.Y.; Kim, H.; Lee, W.J.; Lee, Y.C.; Back, Y. Removal process for octamethylcyclotetrasiloxane from biogas in sewage treatment plant. J. Ind. Eng. Chem. 2001, 7, 276–280. [Google Scholar]
  103. Setiawan, H.; Yu, T.-G.; Nguyen, T.G.H.; Sakamoto, M.; Uchida, T.; Shiratori, Y. Fuel Impurity Poisoning of Ru/γ-Al 2 O 3 Catalyst Packed in the Reformer for Biogas-Fueled SOFC System. ECS Trans. 2019, 91, 1651–1659. [Google Scholar] [CrossRef]
  104. Finocchio, E.; Garuti, G.; Baldi, M.; Busca, G. Decomposition of hexamethylcyclotrisiloxane over solid oxides. Chemosphere 2008, 72, 1659–1663. [Google Scholar] [CrossRef] [PubMed]
  105. Sun, Q.; Li, H.; Yan, J.; Liu, L.; Yu, Z.; Yu, X. Selection of appropriate biogas upgrading technology-a review of biogas cleaning, upgrading and utilisation. Renew. Sustain. Energy Rev. 2015, 51, 521–532. [Google Scholar] [CrossRef]
  106. Lampe, S. Assessment of Fuel Gas Cleanup Systems for Waste Gas Fueled Power Generation; Electric Power Research Institute: Palo Alto, CA, USA, 2006. [Google Scholar]
  107. Patterson, T.; Esteves, S.; Dinsdale, R.; Guwy, A. An evaluation of the policy and techno-economic factors affecting the potential for biogas upgrading for transport fuel use in the UK. Energy Policy 2011, 39, 1806–1816. [Google Scholar] [CrossRef]
  108. Johansson, N. Production of Liquid biogas, LBG, with Cryogenic and Conventional Upgrading Technology-Description of Systems and Evaluations of Energy Balances; Lunds Universitet: Lunds, The Swedish, 2008. [Google Scholar]
  109. Uslu, A.; Faaij, A.P.C.; Bergman, P.C.A. Pre-treatment technologies, and their effect on international bioenergy supply chain logistics. Techno-economic evaluation of torrefaction, fast pyrolysis and pelletisation. Energy 2008, 33, 1206–1223. [Google Scholar] [CrossRef]
  110. Eseyin, A.E.; Steele, P.H.; Pittman, C.U., Jr. Current Trends in the Production and Applications of Torrefied Wood/Biomass—A Review. BioResources 2015, 10, 8812–8858. [Google Scholar] [CrossRef]
  111. Saadon, S.; Uemura, Y.; Mansor, N. Torrefaction in the Presence of Oxygen and Carbon Dioxide: The Effect on Yield of Oil Palm Kernel Shell. Procedia Chem. 2014, 9, 194–201. [Google Scholar] [CrossRef] [Green Version]
  112. Jayaraman, K.; Gökalp, I. Pyrolysis, combustion and gasification characteristics of miscanthus and sewage sludge. Energy Convers. Manag. 2015, 89, 83–91. [Google Scholar] [CrossRef]
  113. Wilk, M.; Magdziarz, A.; Jayaraman, K.; Szymańska-Chargot, M.; Gökalp, I. Hydrothermal carbonization characteristics of sewage sludge and lignocellulosic biomass. A comparative study. Biomass Bioenergy 2019, 120, 166–175. [Google Scholar] [CrossRef]
  114. Agarwal, A.K.; Singh, A.P.; Maurya, R.K. Evolution, challenges and path forward for low temperature combustion engines. Prog. Energy Combust. Sci. 2017, 61, 1–56. [Google Scholar] [CrossRef]
  115. Swami Nathan, S.; Mallikarjuna, J.M.; Ramesh, A. An experimental study of the biogas–diesel HCCI mode of engine operation. Energy Convers. Manag. 2010, 51, 1347–1353. [Google Scholar] [CrossRef]
  116. Haggith, D.E.; Sobiesiak, A.; Miller, L.W.; Przybyla, G. Experimental Indicated Performance of a HCCI Engine Fuelled by Simulated Biomass Gas; SAE Technical Paper: Warrendale, PA, USA, 2010; pp. 1–1081. [Google Scholar]
  117. Kozarac, D.; Taritas, I.; Vuilleumier, D.; Saxena, S.; Dibble, R.W. Experimental and numerical analysis of the performance and exhaust gas emissions of a biogas/n-heptane fueled HCCI engine. Energy 2016, 115, 180–193. [Google Scholar] [CrossRef]
  118. U.S. Department of Energy. Combined Heat and Power Technology Fact Sheet Series—Fuel Cells; U.S. Department of Energy: Washington, DC, USA, 2016.
  119. U.S. Department of Energy. Combined Heat and Power Technology Fact Sheet Series—Reciprocating Engines; U.S. Department of Energy: Washington, DC, USA, 2016.
Figure 1. Annual CHP installations in wastewater treatment plants (WWTPs) in the U.S. compared to the natural gas cost.
Environments 07 00074 g001
Figure 2. Distribution of prime movers utilized in 235 CHP systems installed in WWTPs in the U.S.
Environments 07 00074 g002
Figure 3. Theoretical Pressure-Volume and Temperature-Entropy diagrams for Stirling cycle [46].
Environments 07 00074 g003
Figure 4. T-S Diagram for open and closed-cycle gas turbines [55].
Environments 07 00074 g004
Figure 5. Electrical, thermal and combined efficiency of reciprocating engine and microturbine-based CHP systems at different rated electric power outputs.
Environments 07 00074 g005
Figure 6. Typical cost of H2S, water and siloxane removal systems for reciprocating engine CHP.
Environments 07 00074 g006
Figure 7. Emissions for commercially available reciprocating engine and microturbine-based CHP systems at different rated electric power outputs.
Environments 07 00074 g007
Figure 8. Simple payback and percentage of thermal demand met by CHP at the case study WWTP.
Environments 07 00074 g008
Figure 9. Savings and costs of CHP per percentage of thermal demand met.
Environments 07 00074 g009
Figure 10. Payback period based on percent of thermal demand met and installed cost of CHP.
Environments 07 00074 g010
Figure 11. Payback period based on percent of thermal demand met and operation and maintenance (O&M) cost of CHP.
Environments 07 00074 g011
Figure 12. Payback period based on percent of thermal demand met and electrical efficiency.
Environments 07 00074 g012
Figure 13. Payback period based on percent of thermal demand met and electric usage cost.
Environments 07 00074 g013
Figure 14. Payback period based on percent of thermal demand met and natural gas cost.
Environments 07 00074 g014
Table 1. Comparison of common performance characteristics of combined heat and power (CHP) systems *.
CharacteristicPrime Mover
Gas TurbineMicro-TurbineReciprocating IC EngineFuel CellStirling Engine
Size500 kWe to 300 MWe30 kWe to 500 kWe10 kWe to 10 MWe5 kWe to 3 MWe<200 kWe
Fuel PreparationPM filterPM filterPM filterSulfur, CO, CH4 removalNone
Sensitivity to fuel moistureYesYesYesYesNo
Electric efficiency (HHV)22–36%22–30%22–45%30–63%5–45%
Overall CHP Efficiency (HHV)65–71%64–72%70–87%62–75%NA
Turn-down ratioGood, responds in minutesGood, responds quicklyWide range, responds in secondsWide range, slow to respond Wide range, responds in minutes
Operating issuesHigh reliability, high grade heat available, no cooling required, requires gas compressor, maintenance infrastructure availableFast start-up, requires fuel gas compressorFast start-up, good load following, cooling required if no thermal load, maintenance infrastructure readily available, noisyDurability, low noiseLow noise
Field experienceExtensiveExtensiveExtensiveSomeLimited
Commercialization statusNumerous models availableLimited models availableNumerous models availableLimited models availableCommercial intro., demo.
Installed cost (as CHP system)700–2000 USD/kWe1100–3200 USD/kWe800–2900 USD/kWe3000–10,000 USD/kWe1000–10,000 USD/kWe
Operations and maintenance (O&M) cost0.006–0.013 USD/kWh0.008–0.02 USD/kWh0.008–0.025 USD/kWh0.01–0.045 USD/kWh0.01 USD/kWh
* Data obtained from [33,34].
Table 2. CHP prime mover tolerance to biogas contaminants.
ImpurityPrime Mover
Gas TurbineMicro-turbineReciprocating IC EngineFuel CellStirling Engine
Hydrogen sulfide, H2S10,000 ppm [38]
10,000 ppm [27]
70,000 ppm [94]
70,000 ppm [27]
200 ppm [38]
20 ppm [95]
100 ppm [94]
545 ppm [27]
1 ppm [89]
1.2 ppm [96]
0.1 ppm [97]
2 ppm [25]
1 ppm [27]
1000 ppm [94]
280 ppm [27]
Silicon compounds87 ppbv [15]
87 ppb [27]
10 ppb [15]
5 ppb [15]
10 ppb [27]
5 ppmv [15]
1 ppmv [15]
9 ppm [27]
100 ppb [15]
None [12]
0.1 ppm [96]
Few ppb [25]
10 ppb [27]
0.42 ppm [94]
0.42 ppm [27]
Ammonia--400 ppm [95]1 ppm [77]-
Halogenated (e.g., HCl)1500 ppm [27]200 ppm [94]
200 ppm [27]
60 ppm [94]
60 ppm [27]
1 ppm [94]
5 ppm [27]
232 [94]
Table 3. Siloxane removal cost estimates for various technologies for data from [27].
TechnologySpecific Capital Cost (USD/m3)O&M Cost (USD/m3)
Activated carbon0.0019 0.0038
Resin adsorption0.00300.0046
Condensation and adsorption0.00930.0187
Table 4. WWTP utility and operating characteristics used for the case study analysis.
VariableValueUnit
Electric usage cost0.05USD/kWh
Natural gas usage cost4.739USD/GJ
Current electric usage40,000,000kWh/year
Current natural gas usage36,927GJ/year
Digester gas produced2,052,971m3/year
Biogas higher heating value25.71MJ/m3
Facility operating hours8322h/year
CHP capital cost2500USD/kWe
CHP operating cost0.01USD/kWh
Boiler operating cost0.9USD/GJ
Boiler efficiency0.8
CHP thermal efficiency0.4
CHP electrical efficiency0.35
NPV Discount Rate0.05
Table 5. Case study results listed by percent of thermal demand met by CHP.
Thermal Demand Met (%)CHP kWeUsage Cost Savings (USD/y)Natural Gas Cost Savings (USD/y)Operating Costs (USD/y)Total Cost Savings (USD/y)Total Capital Cost (USD)Payback Period (years)Net Present Value (USD) (Rate = 5%)
544USD 18,308USD 8750USD −2000USD 25,059USD 481,39719.21USD −287,899
1087USD 36,201USD 17,500USD −3915USD 49,785USD 595,57911.96USD −211,151
15130USD 54,093USD 26,250USD −5831USD 74,512USD 709,7619.53USD −134,403
20173USD 71,985USD 35,000USD −7747USD 99,238USD 823,9438.30USD −57,654
25216USD 89,878USD 43,750USD −9663USD 123,964USD 938,1257.57USD 19,094
30259USD 107,770USD 52,500USD −11,579USD 148,691USD 1,052,3087.08USD 95,842
35303USD 126,078USD 61,250USD −13,578USD 173,750USD 1,168,9906.73USD 172,660
40346USD 143,971USD 70,000USD −15,494USD 198,476USD 1,283,1726.47USD 249,408
45389USD 161,863USD 78,750USD −17,410USD 223,202USD 1,397,3546.26USD 326,156
50432USD 179,755USD 87,500USD −19,326USD 247,929USD 1,511,5366.10USD 402,905
55475USD 197,648USD 96,250USD −21,242USD 272,655USD 1,625,7185.96USD 479,653
60518USD 215,540USD 105,000USD −23,158USD 297,382USD 1,739,9005.85USD 556,401
65562USD 233,848USD 113,750USD −25,157USD 322,441USD 1,856,5835.76USD 633,219
70605USD 251,741USD 122,500USD −27,073USD 347,167USD 1,970,7655.68USD 709,967
75648USD 269,633USD 118,750USD −28,989USD 359,393USD 2,084,9475.80USD 690,194
80691USD 287,525USD 110,000USD −30,905USD 366,620USD 2,199,1296.00USD 631,812
85734USD 305,417USD 101,250USD −32,821USD 373,846USD 2,313,3116.19USD 573,429
90777USD 323,310USD 92,500USD −34,737USD 381,072USD 2,427,4936.37USD 515,047
95820USD 341,202USD 83,750USD −36,653USD 388,299USD 2,541,6756.55USD 456,665
100864USD 359,510USD 75,000USD −38,652USD 395,858USD 2,658,3586.72USD 398,353

