Article

Developments in Molecular Level Characterization of Naphthenic Acid Fraction Compounds Degradation in a Constructed Wetland Treatment System

1
Environmental Systems Engineering, University of Regina, 3737 Wascana Parkway, Regina, SK S4S 0A2, Canada
2
Watershed Hydrology & Ecology Research Division, Water Science & Technology Directorate, Environment & Climate Change Canada, 11 Innovation Boulevard, Saskatoon, SK S7N 3H5, Canada
3
Maven Water & Environment, 103-303 Wellman Crescent, Saskatoon, SK S7T 0J1, Canada
4
Department of Civil, Geological and Environmental Engineering, University of Saskatchewan, 57 Campus Drive, Saskatoon, SK S7N 5A9, Canada
5
Water Science and Technology Directorate, Environment and Climate Change Canada, Burlington, ON L7S 1A1, Canada
*
Authors to whom correspondence should be addressed.
Submission received: 8 August 2020 / Revised: 29 September 2020 / Accepted: 10 October 2020 / Published: 14 October 2020
(This article belongs to the Special Issue Treatment Wetlands)

Abstract

:
The reclamation of oil sands process-affected water (OSPW) is a matter of environmental importance because of the aquatic toxicity to biota. This study describes refinements in advanced analytical methods to assess the performance of biological treatment systems for OSPW, such as constructed wetland treatment systems (CWTSs). Assessment of treatment efficiency by measurement of the degradation of naphthenic acid fraction compounds (NAFCs) in OSPW is challenging in CWTS due to potentially interfering constituents such as humic acids, organic acids, salts, and hydrocarbons. Here we have applied a previous weak anion exchange (WAX) solid-phase extraction (SPE) method and high-resolution Orbitrap-mass spectrometry (MS) to remove major interferences from the NAFC analysis. The refinements in data processing employing principal component analysis (PCA) indicates that the relative abundance of NAFCs decreased with time in the treated OSPW relative to the untreated OSPW. The most saturated NAFCs with higher carbon numbers were relatively more degraded as compared to unsaturated NAFCs. The use of Kendrick plots and van Krevelen plots for assessment of the performance of the CWTS is shown to be well-suited to detailed monitoring of the complex composition of NAFCs as a function of degradation. The developments and application of analytical methods such as the WAX SPE method and high-resolution Orbitrap-MS are demonstrated as tools enabling the advancement of CWTS design and optimization, enabling passive or semi-passive water treatment systems to be a viable opportunity for OSPW treatment.

1. Introduction

The mining of oil sands in northeastern Alberta, Canada, generates large volumes of petroleum-contaminated water known as oil sands process-affected water (OSPW). The OSPW is stored in tailing ponds to enable water reuse and recycling. A volume of 720 million m3 of OSPW, held in tailing ponds that cover an area of more than 170 km2, awaits remediation [1]. Currently, the major challenge confronting oil sand operators is the remediation of OSPW and mining site reclamation, due to the huge volumes accrued as well as the refractory characteristic of organic acids found in OSPW [2]. There is currently a zero-discharge policy because of the acute and chronic toxicity of OSPW to aquatic biota across a variety of taxa [3]. For example, OSPW is toxic to the embryos of fish [4] and negatively impacted the development of tadpoles of Silurana (Xenopus) tropicalis [5]. Studies on early life stages of Chironomus dilutus indicates that OSPW causes growth and pupation abnormalities and interrupts endocrine balance [6]. Likewise, OSPW induces toxicity to plants, such as reductions in water channel activity, gas exchange, and leaf growth [7,8]. The OSPW is a complex mixture of varying proportions of suspended solids, including extremely fine clays, inorganic constituents (i.e., salts, metals, metalloids), and organic constituents (e.g., naphthenic acids (NAs), polycyclic aromatic hydrocarbons (PAHs), oil, and grease) [9]. The organic compounds contained in OSPW can be further classified as dissolved organics or water-soluble polar organic acid fraction, including a group of organic acids identified as naphthenic acid fraction compounds (NAFCs) [10,11,12]. The NAFCs found in OSPW include nitrogen and sulfur heteroatomic acids and heavily oxygenated acids that differ based on the number of oxygen, nitrogen, and sulfur atoms present. Naphthenic acids (NAs) are one component of NAFCs that are described by a general formula of CnH2n+ZOx, where n indicates the carbon number and Z specifies the hydrogen deficiency due to ring or double bond formation. Since Z is either zero or a negative integer, some researchers prefer the positive values of the double bond equivalent (DBE) as an alternative for Z [13]. Classical NAs are one component of NAFCs, and are denoted as x = 2, and species with more than two oxygen atoms (x ≥ 3) are described as oxidized NAFCs [4,5,6]. As a complex mixture, OSPW also contains heteroatoms such as sulfur and nitrogen NAFCs with the chemical formulae CnH2n+zSOx, and CnH2n+zNOx, respectively [13]. In addition to being complex and recalcitrant, NAFCs confer toxicity, requiring characterization and treatment [5]. Among OSPW different constituents, NAFCs have generated significant attention due to their recalcitrant character and contribute to the environmental concerns associated with OSPW [14].
Local governments in the Athabasca Oil Sands region of Canada recently concluded that management of tailing ponds is required according to a settled timeline. To achieve this aim, methods are needed for the treatment of OSPW [15]. Degradation of NAs in OSPW are used as one of the targets for achieving both local government and potential future OSPW treatment requirements [16]. Appropriate treatment solutions must be identified and successfully tested for the safe discharge of treated OSPW to the aquatic environment. Constructed wetland treatment systems (CWTSs) which incorporate natural processes and biogeochemical principles in their design are one potentially viable technology that show potential to degrade contaminants in a variety of wastewater sources [17,18].
Constructed wetland treatment systems are designed to simulate specifically targeted processes in natural wetlands and have shown promise in the oil sands industry for OSPW treatment [19]. For example, application of CWTSs for the removal of constituents of potential concern (COPCs) in OSPW including NAFCs and other constituents (e.g., metals, metalloids) has been recently explored, demonstrating remarkable treatment efficiency associated with appropriate selection of macro features (e.g., water depth, sediment type, flow path, plant species) specific for transfer and transformation of target COPCs [20,21]. Additionally, CWTSs have the benefit of providing an operationally passive low-energy method for the detoxification of OSPW. These features make CWTS technology a sustainable water treatment option compared to other physical and chemical processes for large-scale remediation of OSPW [21]. A key factor in the biodegradation of NAFCs is their structural composition and the position or extent of alkyl branching [22,23]. A laboratory scale constructed wetland, which reduced the total concentration of OSPW-NAs, also reduces toxicity to rainbow trout (Oncorhynchus mykiss) and Aliivibrio fischeri (formerly known as Vibrio fischeri) as measured by the Microtox bioassay [24]. Toor et al. [25], examined the preferential degradation of OSPW-NAs in constructed wetland systems at the laboratory-scale level. The biodegradation of NA species with fewer carbon numbers (11–16) and Z numbers (−2 to −4) followed first-order kinetics with half-lives between 19 and 28 weeks. Nevertheless, the more complex NAs (−6 to −12) with more carbon numbers (17–20) were more recalcitrant with half-lives between 37 and 52 weeks. Pilot-scale CWTS treatment of OSPW was found to decrease the concentration of NAs, hydrocarbons, and metals, as well as toxicity to Ceriodaphnia dubia [20].
A fundamental concern in the analysis of organic compounds in petroleum-derived waters such as OSPW is the complicated nature of the matrix, which requires extraction/fractionation and chemical clean-up [26]. To address this analytical challenge and improve the evaluation of the performance of remediation techniques, there is a need to improve both the extraction methods and high-resolution mass spectrometry analysis of NAFCs [16]. There are several recent breakthroughs for monitoring the fate of NAFCs in water treatment based on methods employing Fourier transform mass spectrometry [27]. The implementation of analytical methods using such instruments have vastly enhanced the determination of composition and abundance of NAFCs in complex samples according to carbon number and DBE. The changes in the distribution of DBE and carbon numbers are used to monitor the efficiency, progress of remediation, water treatment process designs, and development of environmental discharge guidelines.
The most important step in the analysis of COPCs prior to instrumental analysis is the isolation, clean-up, and concentration processes of complex environmental samples. Sample extraction offers the possibility of resolving OSPW composition by eliminating potentially confounding sample matrices (e.g., salinity, suspended solids) to enable the characterization and quantification of the organic compounds [16,26,28]. The sample preparation can facilitate the evaluation of the fate of NAFCs in CWTSs, where measurement of the biodegradation and toxicity reduction are crucial for optimization and scale up [29]. The use of the solid phase extraction (SPE) methods continues to grow as the selectivity of sorbent materials and availability for specific applications, such as OSPW extraction and concentration, improve [30,31]. Several SPE sorbents materials are applicable to assessment of organic compounds in OSPW including ENV+, Oasis Hydrophilic-Lipophilic-Balanced (HLB), C18 and ion exchange [29,32,33,34]. For the current research, weak anion exchange (WAX) SPE proved to be ideal for extraction of NAFCs to evaluate CWTS-facilitated treatment processes. In an earlier study, we reported the selectivity of WAX SPE compared with previously used ENV+ for NA extraction from OSPW in the presence of wetland plants [35]. The use of the WAX SPE method for analysis of organic acids in OSPW was essential to facilitate their detection and fate in constructed wetland. This study provides further evidence that the WAX SPE method combined with high-resolution Orbitrap-MS is viable and robust for measurement of the biodegradation of OSPW-NAs in CWTSs. Additionally, in our previous study, Ajaero et al. [36], we discussed and explored the composition and transformation of NAFCs in a CWTS according to carbon number and DBE and the electrospray ionization (ESI). Here, the NAFCs distributions in CWTSs are revisited [36]. We present new visualizations of the results including PCA, Kendrick plots and van Krevelen plots for the first time for improved understanding of the performance of the treatment wetland for OSPW. Emphasis is on refinement of analytical methods for data processing to provide improved insights on wetland performance. A rigorous assessment of the optimization of CWTs based on differences in wetland design; hydraulic retention time; horizontal flow versus vertical flow; wetland plant type; and positive controls to evaluate the kinetics of degradation; are not presented here. The latter are topics of another communication with focus on wetland performance [37].

2. Materials and Methods

2.1. Oil Sand Process-Affected Waters

The OSPW used in this study was obtained in July 2015 from Muskeg River Mine external tailings facility (MRM-ETF). Water was collected 1–2 m below the water surface of a tailings pond. The OSPW was transported in a 1000 L plastic tote to the Contango Strategies test facility in Saskatoon, SK, Canada where it was stored for about 6 months for the constructed wetland experiments. Assessment of the influent water chemistry showed that it was stable under the storage conditions and within the lower ranges of OSPW COPCs measured at other locations in the Athabasca oil sands area as reported in [20,38].

2.2. Constructed Wetland Treatment Systems

The study was carried out in the pilot-testing facilities in Saskatoon, Canada, where the pilot-scale CWTS was set up to assess the degradation of OSPW-NAFCs. The CWTS consists of four plastic Rubbermaid® bins in a series, each with a diameter of 42.5 cm filled with sand (porosity 0.23) up to 30 cm with an overlying water depth of 20 cm. The bins were planted with Carex aquatilis (Sedges) and aquatic bryophytes (mosses) and operated as a horizontal surface flow system. The CWTS was operated as a closed loop system for 27 days and water from the outflow was redirected back into the first cell of the series, to promote detectable changes in the degradation of NAFCs and to conserve the limited volumes of OSPW available for the experiments. This specific CWTS was not operated as a stand-alone system but was part of an integrated system of other CWTS and controls; full details of which are given elsewhere [37]. The flow rates were regulated by FMI® QG 400 pumps (Fluid metering Inc., Syosset, NY, USA) at 20 mL/min ± 3 mL/min. Samples from the outflow were collected in 500-mL plastic containers from the last cell of the wetland system at multiple time points and stored in a refrigerator at 4 °C before extraction and analysis within 24 h. The temperature at the greenhouse was maintained at 22 °C during daytime with a 4 °C night setback for a 12 h daylight time. All CWTSs are subject to evapotranspiration (ET), which raises local concentrations of the constituents and HRT, which in turn may lead to a perception of inadequate treatment efficiency due to measurement of concentrations rather than loads [39]. The measured concentrations of NAFCs were determined as reported in [36], and also adjusted for ET to assess load removed (and remaining) to enable the evaluation of treatment performance.

2.3. Sample Preparation and Extraction

A detailed procedure of the SPE sample preparation using WAX sorbent is described elsewhere [35]. Briefly, WAX SPE cartridges (200 mg, 33 μm polymeric; Phenomenex (Torrance, CA, USA) were conditioned with 5 mL of methanol followed by 5 mL of Milli-QH2O. Then 10 mL aqueous sample from the treatment wetlands (pH~7.0) was loaded onto the cartridges. The NAFCs adsorbed to the cartridges were eluted using 5 mL methanol + 5% ammonium hydroxide. The samples were dried under a steady stream of nitrogen and reconstituted in 1 mL 50/50 acetonitrile/Milli-QH2O + 0.1% ammonium hydroxide for high-resolution Orbitrap-MS analysis.

2.4. Analysis of NAFCs

The analysis of NAFCs by high-resolution negative-ion electrospray ionization (ESI) Orbitrap-MS was performed at Environment and Climate Change Canada (Saskatoon, SK, Canada). A Surveyor MS pump (Thermo Fisher Scientific Inc., San Jose, CA, USA) was used for loop injection of 5 µL of OSPW extract into the mass spectrometer with 50:50 acetonitrile/water containing 0.1% ammonium hydroxide as the eluent at 200 μL/min. A dual pressure linear ion trap-Orbitrap-MS (LTQ Orbitrap Elite Thermo Fisher Scientific) was used for mass spectrometric analysis. Mass spectra data were collected in the range of 100–600 m/z in full scan mode with a resolution of 240,000 at m/z 400. Mass calibration was performed using n-butyl benzenesulfonamide (212.07507 m/z scan-to-scan mass calibration correction). The ionization conditions of the ESI source are described elsewhere [36,40]. Data acquisition and quantitative analysis were controlled using Xcalibur version 2.2 software (Thermo Fisher Scientific). Data processing was done with Composer version 1.5.3 (Sierra Analytics, Inc. Modesto, CA, USA) by assignment of chemical formulas according to heteroatom class and DBE of classical NAs and NAFCs. Molecular assignments were based on mass accuracies of <2 ppm. The relative abundance of individual compound classes was obtained by dividing a given peak by the sum of the intensities of all peaks observed by the negative-ion ESI Orbitrap.
The estimation of the concentration of NAFCs was performed with a five-point external standard calibration of NAFCs at known concentrations, as reported in past studies [8] within the working range of the calibration curve (10–100 mg/L). The determination of NAFC concentration in this investigation, as well as in other studies, is based on semi-quantitative measurements. The semi-quantification is because of the lack of authentic standards for unambiguous quantification and non-existence of standard procedure for isolation and determination of individual NAFCs [36,40]. Accuracy and precision were measured for replicates (n = 3) of a Sigma-Aldrich (Oakville, ON, Canada) commercial NA. Additionally, as a quality assurance step, replicate analysis (n = 3) of a laboratory blank (Milli-Q water) was conducted following a similar procedure for the commercial NAs.

2.5. PCA, Kendrick Plot, and van Krevelen Plot Procedure

Principal component analysis (PCA) was conducted by exporting spectral data from Xcalibur to Composer version 1.5.6 software (Sierra Analytics, Modesto, CA, USA), to R 3.6.2 (R Core Team, 2020) where data was transformed, analyzed, and plotted. Exact-mass data from XCalibur was assigned to molecular formulae by Composer, and formula data was exported to R. Lists of identifiable molecular formulae, which were collected from each sample, and compiled into a master list of formulae present across all samples (339 common formulae) in R, along with molecular characteristics including heteroatom counts, ratios, Kendrick masses and Kendrick mass defects. Relative abundances of formulae in each wetland were assigned to formulae found on this master list by comparing the counts of each individual formula to the most abundant peak detected in each respective sample. Principal component analysis (PCA) was conducted by comparing differences in relative abundance of compounds (as defined above) and plotted using the “ggplot 2” [41] and “ggbiplot” [42] packages in R 3.6.2 [43]. Kendrick and van Krevelen plots were prepared to show the differences between day 0 (i.e., raw OSPW) and the final sample taken (day 27) from the wetland by comparing the relative abundance of all common molecular formulae. Both Kendrick and van Krevelen plots were plotted using the “ggplot 2” [41] package in R 3.6.2 [43].

3. Results and Discussion

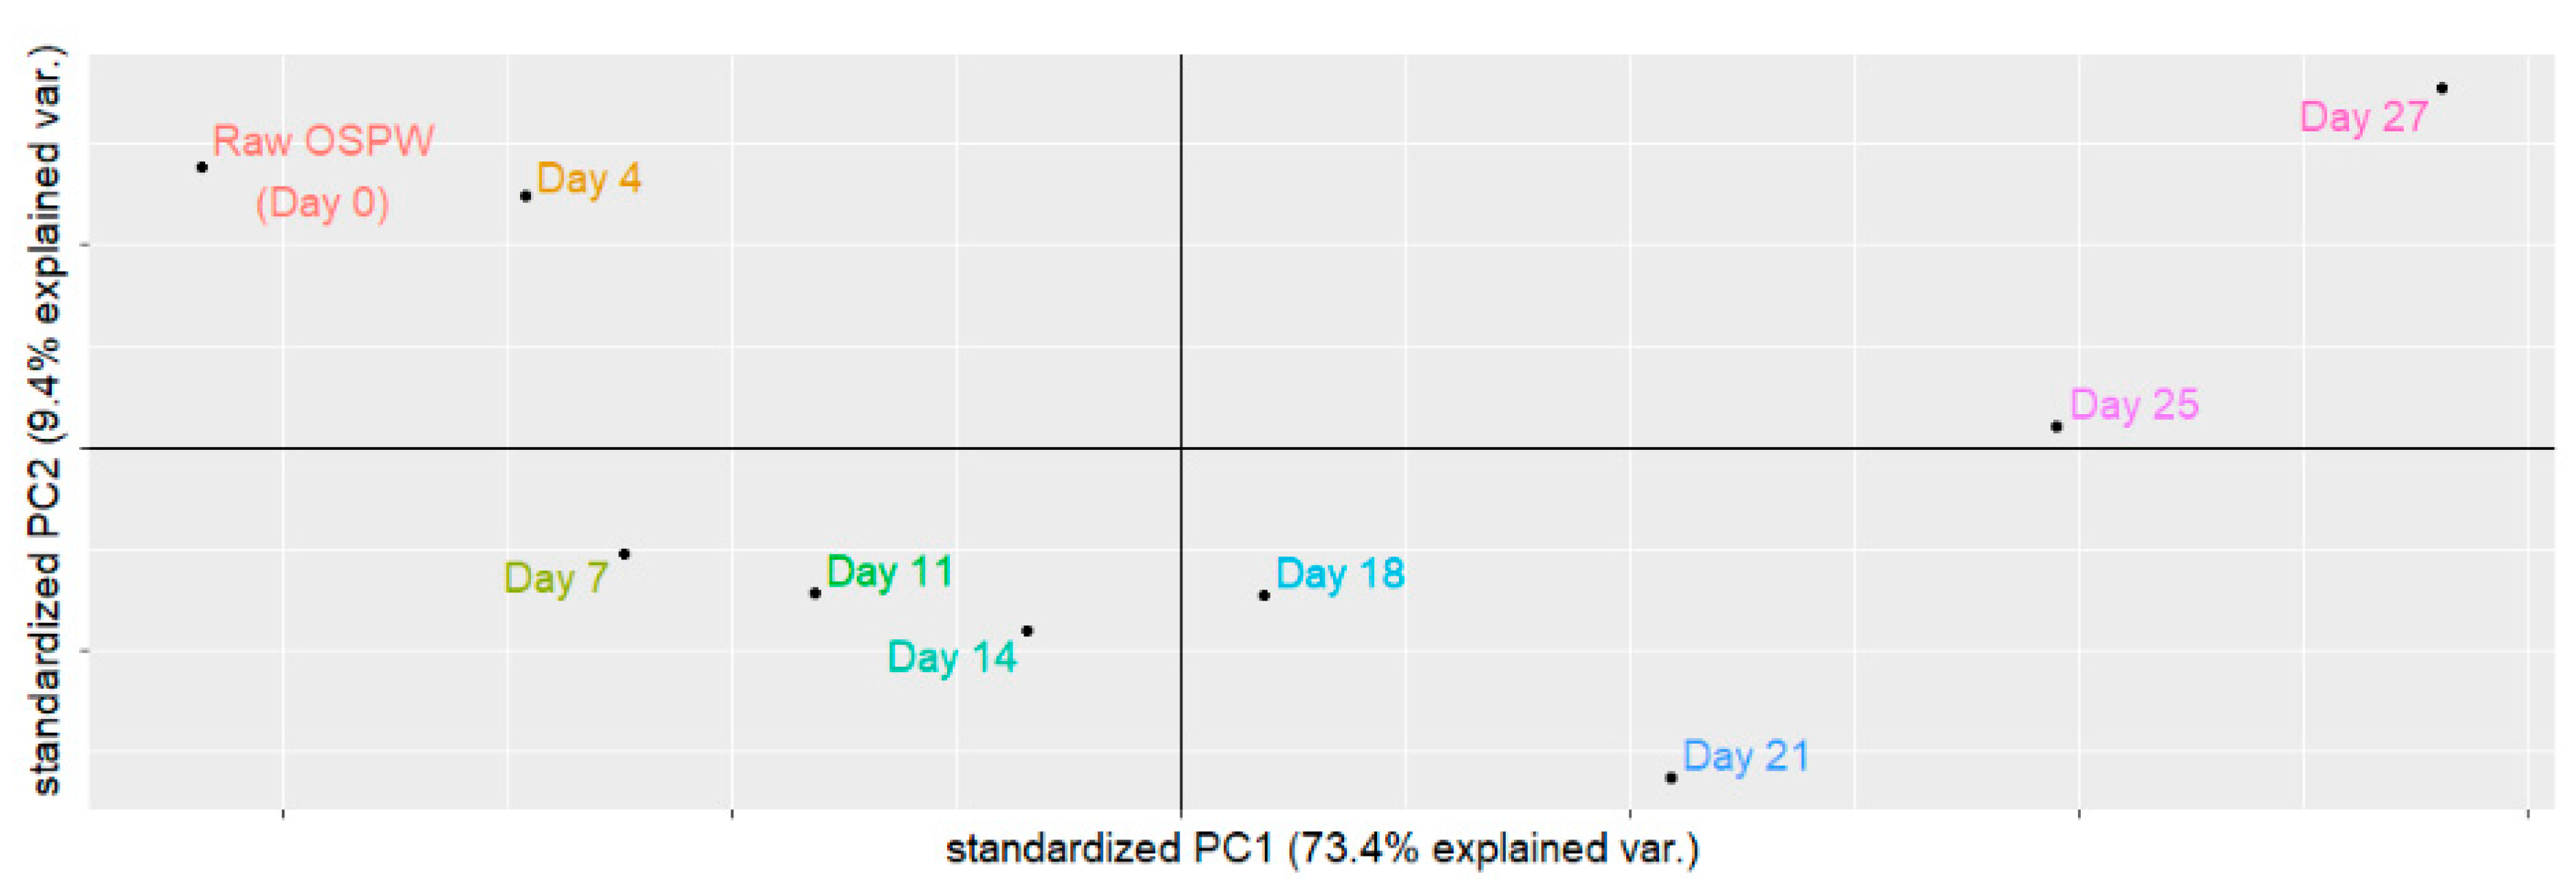
3.1. Principal Component Analysis

The data were initially evaluated by principal component analysis (PCA) (Figure 1). Nearly 83% of the dataset’s variability is captured along both principal components (PC1 = 73.4% explained variability, PC2 = 9.4% explained variability). This analysis focused on separation across PC1 because it accounts for approximately 8x greater variability than PC2. A few factors may introduce sample data separation across PC2, such as slight temporal differences in the microbiological communities in the treatment setup [44], which was not evaluated in this experiment. In addition, the apparent sample variability across PC2 could be due to a slight arch effect, a well-known consequence of data ordination using PCA [45]. The most prominent differences between samples are also apparent across PC1; therefore, this analysis focuses on separation between samples along PC1.
Samples separate steadily from the far left of PC1 to the far right over time, suggesting consistent and gradual changes lead to differences in NAFC profiles. Variability between samples reaches a maximum between the untreated OSPW and samples on day 27; these samples are therefore subsequently compared to highlight major compositional differences in NAFC molecular characteristics observed across the experiment. Additionally, the distribution along PC1 increases in distance over time, which may indicate further dynamics of the biotransformation where at least two mechanisms for degradation occur. The first one from day zero to day 21; and the second after day 21.
To evaluate how formula characteristics, contribute to sample separation along PC1, Kendrick [46] and van Krevelen plots of all formulae detected across the experiment were prepared by colour-coding formulae according to their factor loadings along PC1. The Kendrick plot (Figure 2) highlights that the highest m/z saturated components (i.e., m/z range 200–275, Kendrick mass defect 0.05–0.1) are the most strongly associated with a low PC1 sample score, and that more unsaturated (i.e., higher Kendrick mass defect) components are associated with a high PC1 sample score. This suggests that on Day 27, NAFCs in the treatment wetland had a higher proportion of highly-unsaturated components than did the Raw OSPW. The van Krevelen of the formulae (Figure 3) offers complementary information; only high H/C ratio components (i.e., saturated) are associated with a low PC1 score. In addition, there are a few low-O/C components (approximately 1.2–1.5 H/C ratio and 0.1 O/C ratio) that are associated with a low PC1 score. These two plots together predict that most sample variability is likely attributable to differences in relative abundance of saturated components; higher relative abundance of saturated components is expected from the Raw OSPW, whereas more unsaturated components persist to Day 27.

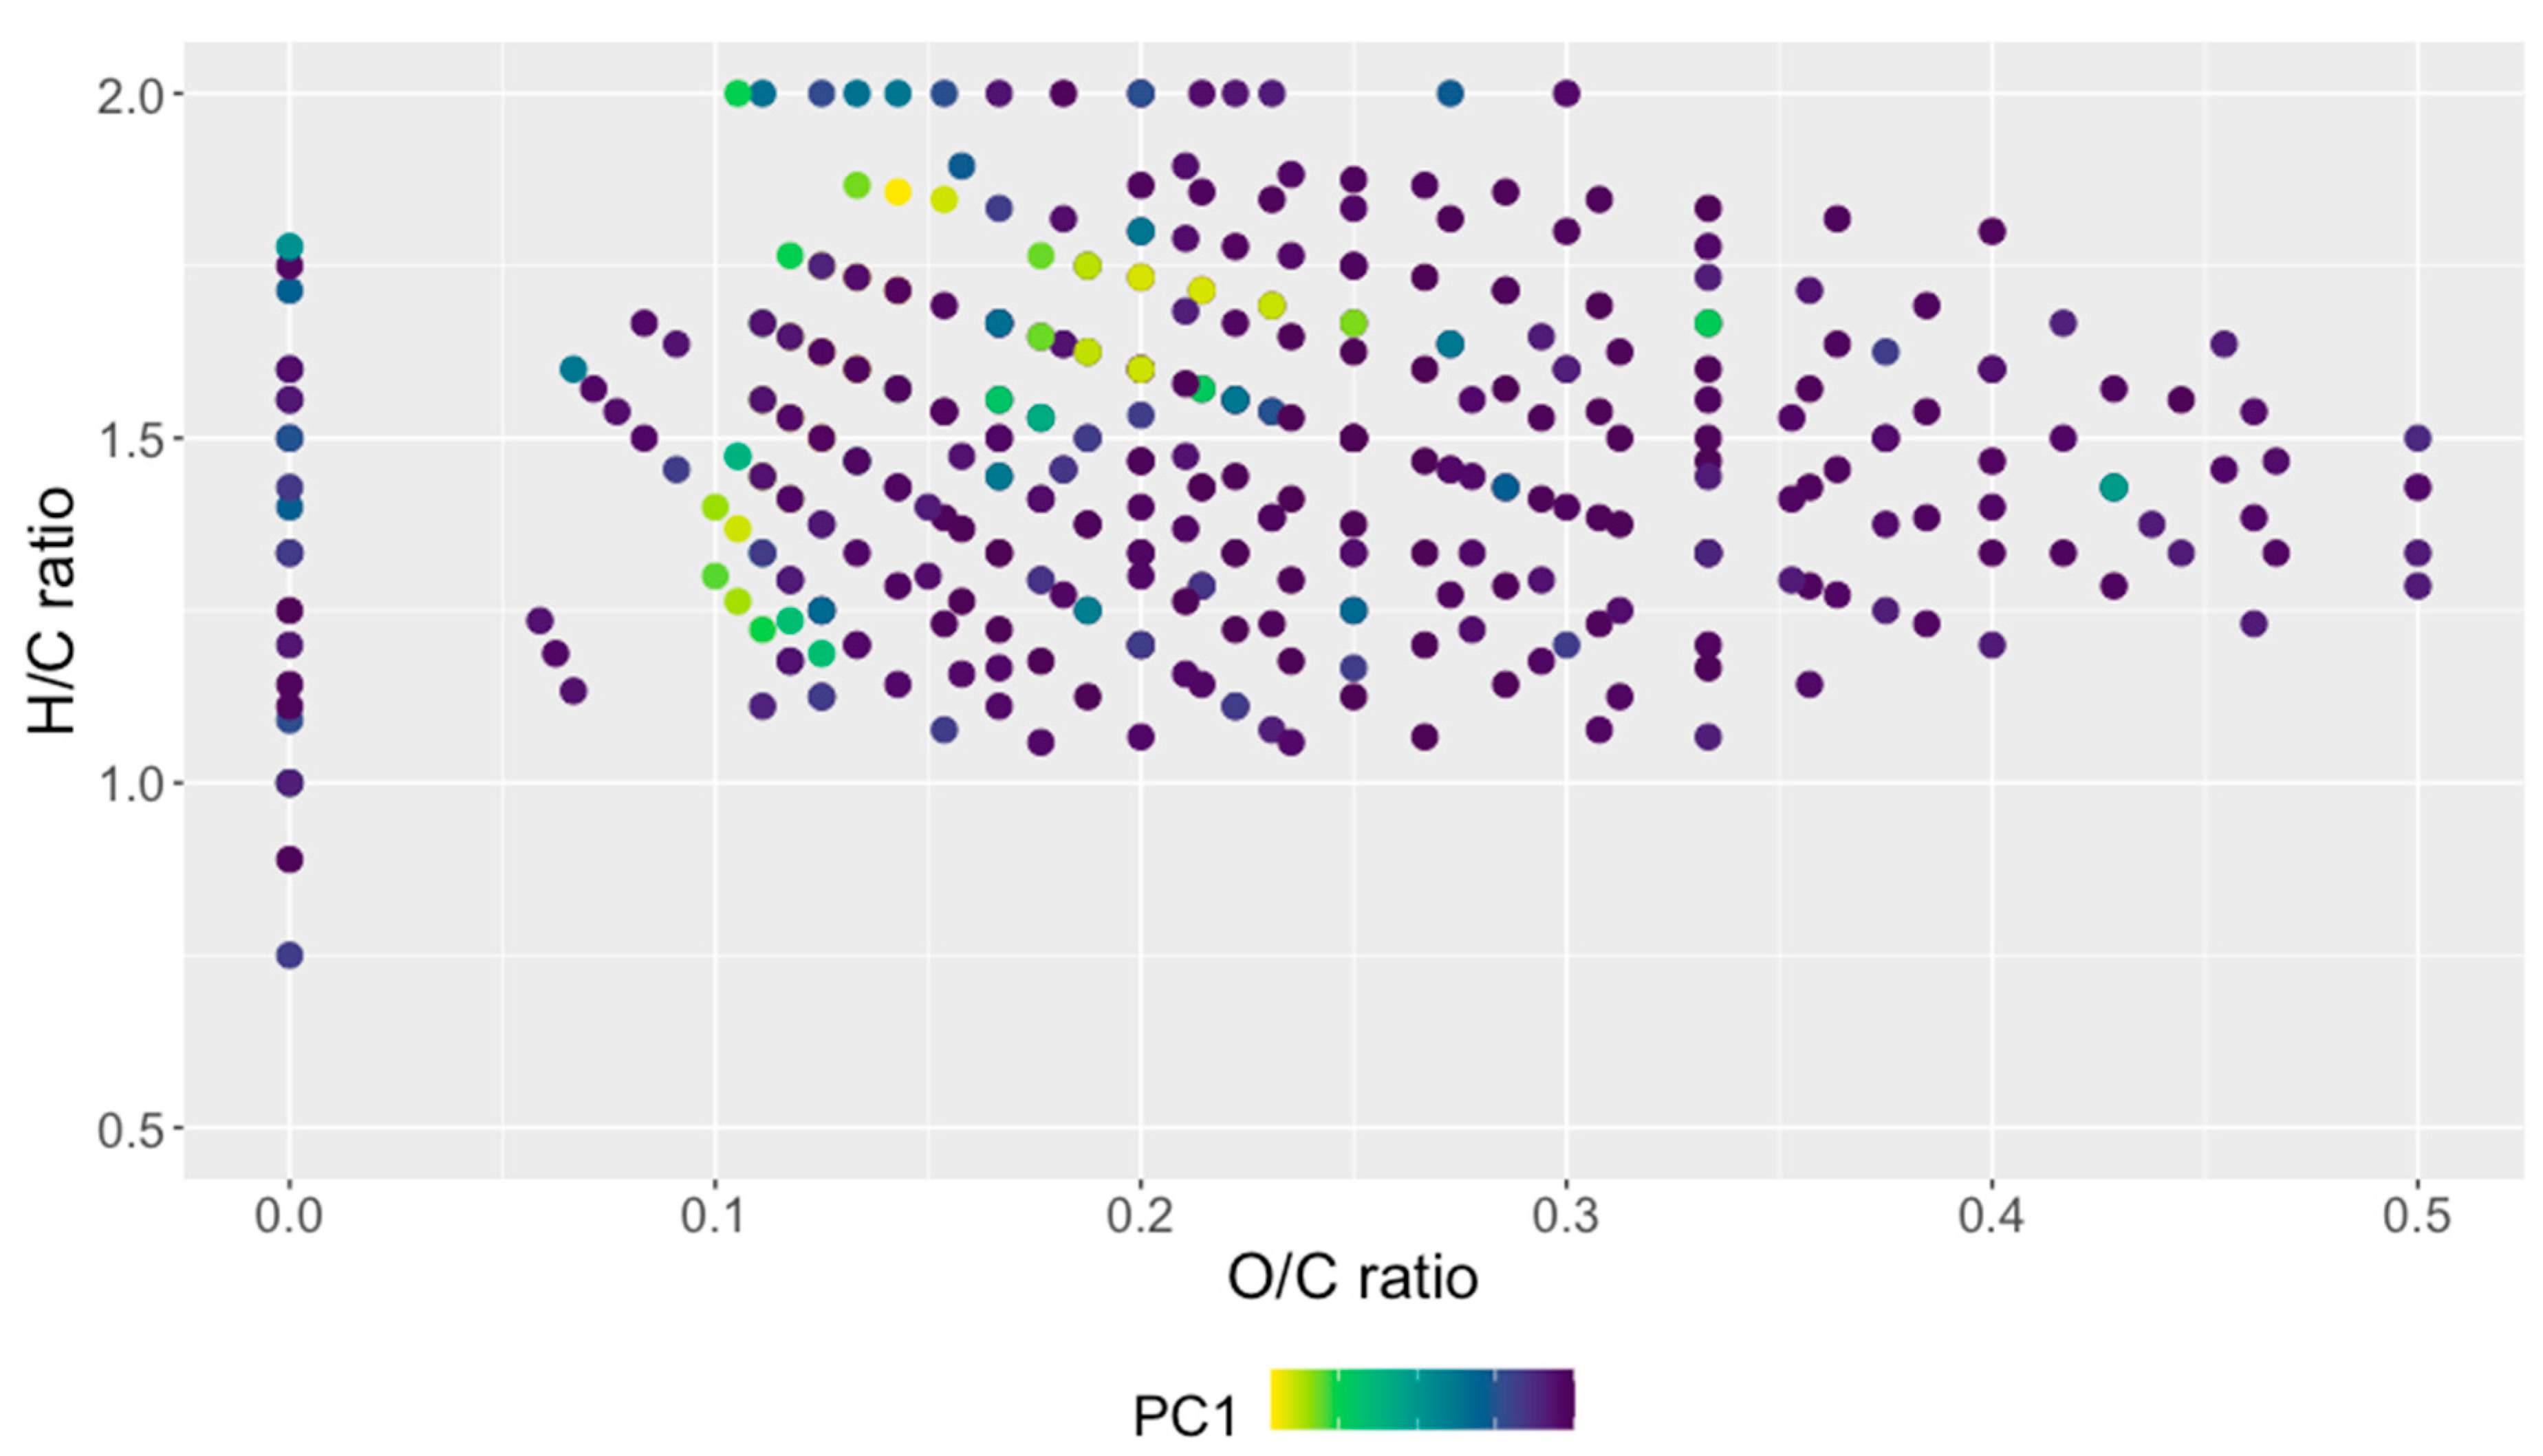
3.2. Interpretation of Kendrick and van Krevelen Plots

To visualize the predictions discernible from the PC1-coded Kendrick plot, sample data were plotted in a Kendrick plot [46] showing the difference in relative abundance of various NAFCs across the full spectrum (Figure 4). As illustrated in Figure 4, the most substantial decreases in relative abundance were observed from compounds with an approximate Kendrick Mass of 220–280 with Kendrick mass defects (KMD) ≤ 0.1. There were also some modest decreases in the relative abundance of compounds with approximate Kendrick Masses of 240–325 with an approximate KMD of 0.165, and a smaller series with approximate Kendrick Masses of 280–315 with an approximate KMD of 0.175. On the other hand, most compounds from Kendrick Mass 200–300 and KMDs from 0.1–0.15 simultaneously increased in relative abundance. In addition, there are some formulae across the Kendrick plot that were not present in the untreated OSPW that increased slightly in relative abundance. These trends suggest that the most saturated compounds (i.e., low mass defects) from m/z 220–300 are the most susceptible to changes and/or dissipation in this system. Unsaturated compounds across a similar mass range therefore appear to be resistant to degradation and/or dissipation in the CWTS, leading to an increase in relative proportion of those unsaturated compounds.
Complementary observations were made by plotting data in a van Krevelen plot showing the net-change in the relative abundance of major Ox (i.e., O2, O3, O4, O5, O6, and O7) formulae to simultaneously examine the change in oxygen content and unsaturation of NAFCs across the sampling period (Figure 5). As shown in Figure 5, some O2 compounds with relatively high H/C ratios (i.e., H/C ratio > 1.6) decrease the most in relative abundance. There are also some compounds from H/C 1.2–1.5 and low O/C ratio (i.e., ~0.1) that also decrease in relative proportion; since these are O2-NAFCs, these are necessarily the longest (i.e., highest carbon number) compounds among the O2-NAFCs detected. In comparison, O3-O7 compounds with lower H/C ratios (i.e., H/C ratio ≈ 1.5) increase in relative proportion. In addition, many formulae observed in the final sample were not initially observed in the untreated OSPW, increasing slightly in relative abundance. Increases are most prominent at a higher O/C ratio (i.e., O/C ratio < 0.2), which in combination with the trends observed in the previous Kendrick plot (Figure 4), suggest that changes in NAFCs in the CWTS are due, at least in part, to oxidative reactions. Smaller unsaturated compounds are the least susceptible to oxidation, increasing in relative abundance; conversely, increasing molecular size and saturation were associated with decreases in relative abundance.
As a note of caution, this method of comparing base-peak normalized abundance between unlike samples may not capture some changes, especially if various mixture components simultaneously increase in concentration while the dominance of the base peak decreases. Such disparities between samples would generate a general increase in relative abundance, wherein many components may simultaneously increase in relative abundance in a comparison between two samples, preventing the observation of actual decreases in concentrations of sample components. Similarly, if the base peak were to increase in concentration while other sample components remained consistent, this would lead to the opposite phenomenon, decreasing relative abundance of numerous sample components simultaneously. However, this does not negate differences that are observed, and only serves to provide a note of caution about interpretation of “real” differences in sample component concentrations.

3.3. Heteroatom Class Distribution

The relative abundances of heteroatom classes in the untreated and wetland treated samples are displayed in Figure 6. For all assigned peaks, the relative abundance of each heteroatom class was determined by normalizing the peak abundance to the total abundance. From our previous work, the contribution of the Ox compounds (x = 2–6) to the total abundance was the greatest, as compared to other compound classes in the untreated OSPW [36], and is in line with results from another study [27]. The O2-NAs accounted for 56.1% of the total NAFCs detected in the OSPW, followed by O3-NAs and O4-NAs. The abundance of the oxygen-containing compounds follows the order O2-NAs ≥ O3-NAs≈O4-NAs ≥ O5-NAs ≥ O6-NAs, which is characteristic of OSPW composition [16,47]. The evaluation of the transformation of NAFCs in the wetland system indicates that abundance of Ox-NAs (3 ≤ x ≤ 6) increased while the O2-NAs species decreased (Figure 4). The O2-NAs decreased and total Ox-NAs increased in the wetland system compared to the untreated OSPW (Table 1). The increased abundance of the Ox-NAs in the wetland systems is due to the oxidation of O2-NAs to higher Ox-NAs. The oxidized NAs (Ox-NAs) are deemed as intermediate products of the biodegradation of O2-NAs [48]. Also, past literature found that O2-NAs were transformed to Ox-NAs during the biodegradation of commercial NAs [49]. It is worth mentioning that in earlier findings, high proportions of the Ox-NAs (x = 3–6) were used as marker of OSPW sources for groundwater and surface water samples [50].
With respect to sulfur containing NAFC species, SO3, SO4, and SO5 were the most abundant species, with proportions in the untreated OSPW as shown in Table 1. As reported in our previous study [36], the relative abundance of SO4 and SO5 increased while that of the SO3 species decreased after treatment in the CWTS. Among the NAFCs, the nitrogen containing compounds (NOx) showed the lowest abundance in both the untreated and CWTS treated OSPW samples detected by high-resolution negative-ion ESI-Orbitrap-MS (Table 1) [36]. A previous study reported a low abundance of nitrogen-containing species in the acid extracted organic fractions of OSPW characterized by ESI (−) [11]. Nitrogen-containing compounds have been detected in high abundance by ESI (+) and atmospheric pressure photoionization [34,51]. Additionally, low abundances of sulfur-containing and nitrogen-containing compounds 3.9 and 0.5%, respectively, were detected in the acid extractable organics of OSPW with ESI-FT-ICR-MS [11].

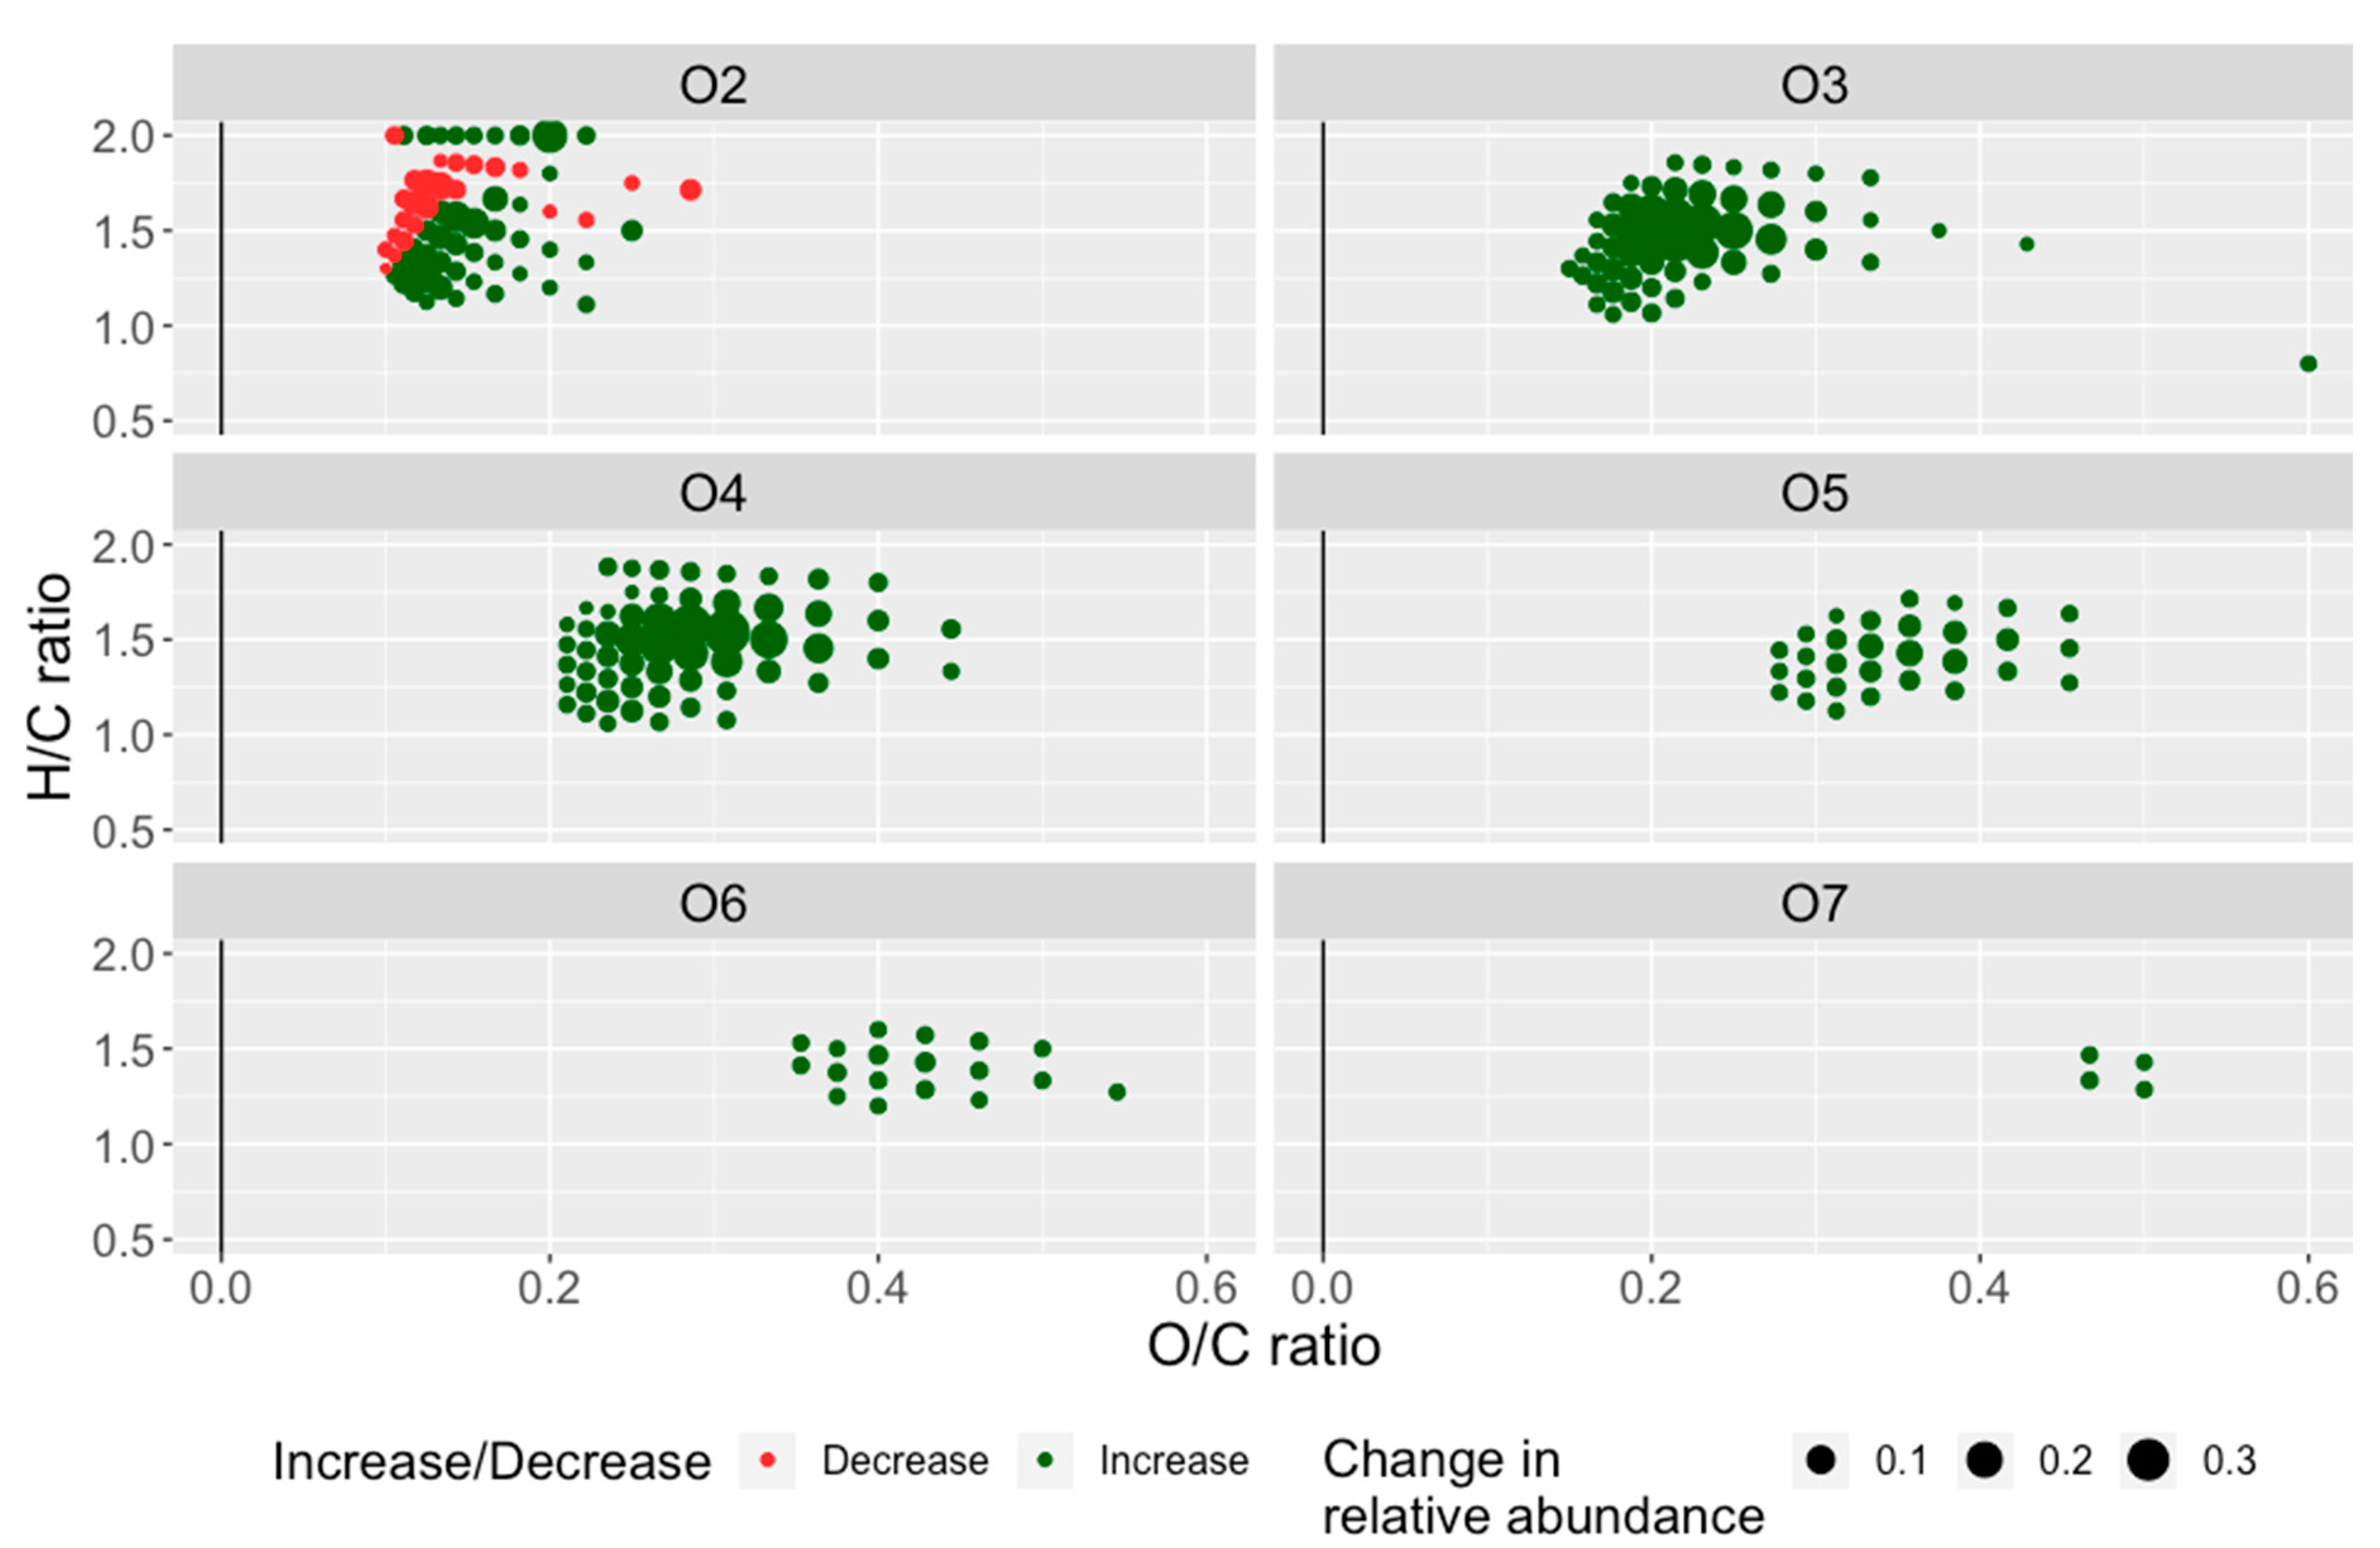
3.4. Degradation of Individual NA Species

The carbon number and DBE are structural characteristics of classical NAs, which provide evidence on their structural affinity for degradation. These are useful parameters for assessing the efficiency of degradation of classical NAs and the selectivity of treatment. In complex systems such as CWTSs, several processes such as sorption, photolysis, hydrolysis, speciation/ionization, oxidation, reduction, and biotransformation contribute to the removal of COPCs (e.g., NAFCs) [20]. However, this study did not investigate the major removal mechanism of OSPW-NAFCs in the CWTS and the elucidation of the major removal process requires further research. The high-resolution Orbitrap-MS data provided information on the molecular distribution of classical NA species. The plots of O2-NA concentration versus carbon number and DBE value before and after wetland treatment are given in Figure 6A,B. A similar NA profile was observed in both the untreated and treated OSPW; however, the classical NA concentration in the wetland system was lower. The total concentrations of O2-NAs in untreated OSPW decreased from 40.3 mg/L to 12.7 mg/L (after correction for measured ET, transformation efficiency of 69.5%), indicating that the CWTS has the efficiency to degrade O2-NAs. NA subgroups with higher initial concentrations (carbon numbers 12–17 and 13–16 with DBE 3 and DBE 4 respectively) were degraded significantly [36].
To further illustrate the changes in NA species that occurred in the treatment wetland, the ratios of NAΣno/NAΣni and NAΣDBEo/NAΣDBEi for carbon number and DBE respectively were calculated. NAΣno and NAΣni is the total concentration of O2-NAs with the equivalent carbon number in the outflow on day 27 of the treatment and the inflow samples on day zero respectively and used to indicate the extent of degradation of NAs with each carbon number. The NAΣDBEo/NAΣDBEi ratio is the total concentration of NAs with the equivalent DBE values in the outflow and inflow samples, respectively, and is used to indicate the extent of degradation of NAs with each DBE. A lower ratio (<1.0) means a better degradation in the treatment system [52,53]. To assess the influence of carbon number and DBE on degradation of classical NAs, a plot was generated showing changes in the most prevalent carbon numbers (11–19) and DBE values (2–8) of total NA and O2-NA species. Figure 6C show the degradation of O2-NAs according to DBE values and carbon number value in the wetland system after treatment for 27 days. The NAΣDBEo/NAΣDBEi ratio showed no distinctive pattern for the degradation of DBE compounds.
The ratio of NAΣno/NAΣni clearly indicates that the extent of degradation is directly proportional to the increase in carbon number. It is of interest that the CWTS showed high efficiency for the degradation of the more recalcitrant NAs. An earlier study observed that classical NAs with higher carbon numbers in crude oil were preferentially degraded under anaerobic conditions [54]. The increase in carbon number is correlated to a more hydrophobic character of NAs [55]. This may result in their accumulation in the wetland systems. The local concentration of NAs in a system could be increased because of hydrophobic interactions between NAs-NAs and NA/colloidal particles, making them more susceptible to biodegradation [52]. Bacterial cells that have unique hydrophobic surfaces are capable of directly adsorbing accumulated hydrophobic pollutants [52]. Therefore, more hydrophobic organic contaminants (or higher lipophilicity) are more available for adsorption onto or permeation through the cell membrane which in turn improves efficiency of biodegradation under certain conditions [56]. However, very high logKow may affect the bioavailability of NAFCs for biotransformation because these compounds could be strongly adsorbed to sediment or plants. Furthermore, the pH and the characteristics of the media can influence permeation into membranes.
As discussed above, there was an increase in the rate of transformation of O2-NA in the CWTS, as the concentration of Ox-NAs increased. The Ox-NAs have more -OH groups than O2-NAs making them less hydrophobic which may lead to reduced toxicity [57], because more hydrophobic compounds can penetrate the lipid bilayer and disrupt membrane integrity, resulting in cell death [36]. The O2-NA species implicated in toxicity are C ≥ 17 NAs [58], C15-18 and DBE = 4, and C14–17 and DBE = 3 [59]. The CWTS transformation of the classical NAs is expected to reduce OSPW toxicity.
The feasibility of any treatment process involves both analytical evaluation and toxicity tests for any wastewater to be deemed safe for return to the aquatic environment. Currently, the critical requirements for the evaluation and careful choice of the best treatment options for OSPW are based on the analytical and toxicological assessment of the OSPW [38]. However, to date, there is no standard analytical method for OSPW-NA characterization and quantification, and therefore continuous development of robust analytical methods for the identification and measurement of NAs is warranted. The anticipated environmental discharge of treated OSPW will require a good analytical approach for the evaluation of the degradation of the most potent toxic components in the wastewater. The refinements in the data processing of the WAX SPE Orbitrap MS method provided improved insights into the fate of NAFCs in the CWTS. The refinements of the analytical tools may thus be useful for monitoring the progress of environmental remediation.

4. Conclusions

The present investigation provided improved insights and confirmed earlier reports on extraction techniques used to monitor the degradation of NAFCs in CWTS. The result highlighted the importance of the sample preparation method on the identification of OSPW-NAFCs. The refinements in the data processing (PCA, Kendrick plots and van Krevelen plots) and combined use of the WAX SPE method and high-resolution Orbitrap-MS revealed new insights on wetland performance. The horizontal flow wetland system demonstrated high efficiency for the degradation of more hydrophobic NAs (with higher carbon numbers) compared to the less hydrophobic NAs (with lower carbon numbers). The finding is contrary to previous studies which showed that the carbon numbers may have either an inverse correlation or little influence on NA biodegradation [49,60]. These collective findings demonstrate the suitability of the WAX SPE and high-resolution Orbitrap-MS techniques for monitoring the degradation of NAFCs in CWTS. Moreover, in view of the lack of methods to measure the NAFCs directly in the wetland plant tissue, it is difficult to differentiate between possible adsorption and biodegradation mechanism in the CWTS. While the CWTS evidently degraded and oxidized the NAFCs, it is beyond the scope of the evidence presented here to conclude that biodegradation was the sole mechanism of the treatment.

Author Contributions

Formal analysis, C.A., I.V.M. and K.M.P.; Funding acquisition, M.C.S., D.W.M. and J.V.H.; Investigation, C.A. and M.C.S.; Methodology, M.C.S.; Project administration, M.C.S., D.W.M. and J.V.H.; Resources, M.C.S. and J.V.H.; Supervision, D.W.M. and J.V.H.; Writing–original draft, C.A. and I.V.M.; Writing–review & editing, C.A., I.V.M., M.C.S., M.l.R., J.P., K.M.P., D.W.M. and J.V.H. All authors have read and agreed to the published version of the manuscript.

Funding

We acknowledge the generous support for this research provided by the Panel of Energy Research and Development (grant number 1C03.006A), National Research Council of Canada Industrial Research Assistance Program (grant number 850296), Natural Sciences and Engineering Research Council of Canada discovery grants program (McMartin 2020-04014), and the University of Regina, Canada.

Acknowledgments

We are grateful to Contango personnel (Vanessa Friesen, Rachel Martz, Jordyn Bergsveinson, and technologists) for coordinating assembly and sampling of the system, and to Gwen O’Sullivan for helpful discussions. We thank John Rodgers and his team at Clemson University for helpful discussions relating to designs of the CWTS and for providing the methods for preparation of the synthetic OSPW.

Conflicts of Interest

The authors declare no conflict of interest.

References

  1. Pramanik, S. Review of biological processes in oil sands: A feasible solution for tailings water treatment. Environ. Rev. 2016, 24, 274–284. [Google Scholar] [CrossRef]
  2. Abdalrhman, A.S.; Zhang, Y.; Arslan, M.; Gamal El-Din, M. Low-current electro-oxidation enhanced the biodegradation of the recalcitrant naphthenic acids in oil sands process water. J. Hazard. Mater. 2020, 398, 122807. [Google Scholar] [CrossRef] [PubMed]
  3. Madison, B.N.; Reynolds, J.; Halliwell, L.; Leshuk, T.; Gu, F.; Peru, K.M.; Headley, J.V.; Orihel, D.M. Can the toxicity of naphthenic acids in oil sands process-affected water be mitigated by a green photocatalytic method? FACETS 2020, 5, 474–487. [Google Scholar] [CrossRef]
  4. Marentette, J.R.; Sarty, K.; Cowie, A.M.; Frank, R.A.; Hewitt, L.M.; Parrott, J.L.; Martyniuk, C.J. Molecular responses of Walleye (Sander vitreus) embryos to naphthenic acid fraction components extracted from fresh oil sands process-affected water. Aquat. Toxicol. 2017, 182, 11–19. [Google Scholar] [CrossRef] [PubMed]
  5. Gutierrez-Villagomez, J.M.; Vázquez-Martínez, J.; Ramírez-Chávez, E.; Molina-Torres, J.; Trudeau, V.L. Profiling low molecular weight organic compounds from naphthenic acids, acid extractable organic mixtures, and oil sands process-affected water by SPME-GC-EIMS. J. Hazard. Mater. 2020, 390, 122186. [Google Scholar] [CrossRef]
  6. Wiseman, S.B.; Anderson, J.C.; Liber, K.; Giesy, J.P. Endocrine disruption and oxidative stress in larvae of Chironomus dilutus following short-term exposure to fresh or aged oil sands process-affected water. Aquat. Toxicol. 2013, 142, 414–421. [Google Scholar] [CrossRef]
  7. Kamaluddin, M.; Zwiazek, J.J. Naphthenic acids inhibit root water transport, gas exchange and leaf growth in aspen (Populus tremuloides) seedlings. Tree Physiol. 2002, 22, 1265–1270. [Google Scholar] [CrossRef] [Green Version]
  8. Armstrong, S.A.; Headley, J.V.; Peru, K.M.; Germida, J.J. Phytotoxicity of oil sands naphthenic acids and dissipation from systems planted with emergent aquatic macrophytes. J. Environ. Sci. Health Part A Toxic/Hazard. Subst. Environ. Eng. 2008, 43, 36–42. [Google Scholar] [CrossRef]
  9. Mahaffey, A.; Dubé, M. Review of the composition and toxicity of oil sands process-affected water. Environ. Rev. 2017, 25, 97–114. [Google Scholar] [CrossRef]
  10. Headley, J.v.; Barrow, M.P.; Peru, K.M.; Fahlman, B.; Frank, R.A.; Bickerton, G.; McMaster, M.E.; Parrott, J.; Hewitt, L.M. Preliminary fingerprinting of Athabasca oil sands polar organics in environmental samples using electrospray ionization Fourier transform ion cyclotron resonance mass spectrometry. Rapid Commun. Mass Spectrom. 2011, 25, 1899–1909. [Google Scholar] [CrossRef]
  11. Grewer, D.M.; Young, R.F.; Whittal, R.M.; Fedorak, P.M. Naphthenic acids and other acid-extractables in water samples from Alberta: What is being measured? Sci. Total Environ. 2010, 408, 5997–6010. [Google Scholar] [CrossRef] [PubMed]
  12. Headley, J.V.; Peru, K.M.; Mohamed, M.H.; Frank, R.A.; Martin, J.W.; Hazewinkel, R.R.O.; Humphries, D.; Gurprasad, N.P.; Hewitt, L.M.; Muir, D.C.G.; et al. Chemical fingerprinting of naphthenic acids and oil sands process waters-A review of analytical methods for environmental samples. J. Environ. Sci. Health Part A 2013, 48, 1145–1163. [Google Scholar] [CrossRef] [PubMed]
  13. Nyakas, A.; Han, J.; Peru, K.M.; Headley, J.V.; Borchers, C.H. Comprehensive analysis of oil sands processed water by direct-infusion fourier-transform ion cyclotron resonance mass spectrometry with and without offline UHPLC sample prefractionation. Environ. Sci. Technol. 2013, 47, 4471–4479. [Google Scholar] [CrossRef] [PubMed]
  14. Li, C.; Fu, L.; Stafford, J.; Belosevic, M.; Gamal El-Din, M. The toxicity of oil sands process-affected water (OSPW): A critical review. Sci. Total Environ. 2017, 601, 1785–1802. [Google Scholar] [CrossRef]
  15. Zhang, L.; Zhang, Y.; Patterson, J.; Arslan, M.; Zhang, Y.; Gamal El-Din, M. Biofiltration of oil sands process water in fixed-bed biofilm reactors shapes microbial community structure for enhanced degradation of naphthenic acids. Sci. Total Environ. 2020, 718, 137028. [Google Scholar] [CrossRef]
  16. Meshref, M.N.A.; Ibrahim, M.D.; Huang, R.; Yang, L.; How, Z.T.; Klamerth, N.; Chelme-Ayala, P.; Hughes, S.A.; Brown, C.; Mahaffey, A.; et al. Fourier transform infrared spectroscopy as a surrogate tool for the quantification of naphthenic acids in oil sands process water and groundwater. Sci. Total Environ. 2020, 734, 139191. [Google Scholar] [CrossRef]
  17. Rodgers, J.H.; Castle, J.W. Constructed wetland systems for efficient and effective treatment of contaminated waters for reuse. Environ. Geosci. 2008, 15, 1–8. [Google Scholar] [CrossRef]
  18. Haakensen, M. Key Aspects for Successful Design and Implementation of Passive Water Treatment Systems. J. Environ. Solut. Oilgasand Min. 2015, 1, 59–81. [Google Scholar] [CrossRef]
  19. Foote, L. Threshold considerations and wetland reclamation in Alberta’s mineable oil sands. Ecol. Soc. 2012, 17, 35. [Google Scholar] [CrossRef] [Green Version]
  20. McQueen, A.D.; Hendrikse, M.; Gaspari, D.P.; Kinley, C.M.; Rodgers, J.H.; Castle, J.W. Performance of a hybrid pilot-scale constructed wetland system for treating oil sands process-affected water from the Athabasca oil sands. Ecol. Eng. 2017, 102, 152–165. [Google Scholar] [CrossRef]
  21. Hendrikse, M.; Gaspari, D.P.; McQueen, A.D.; Kinley, C.M.; Calomeni, A.J.; Geer, T.D.; Simair, M.C.; Peru, K.M.; Headley, J.V.; Rodgers, J.H.; et al. Treatment of oil sands process-affected waters using a pilot-scale hybrid constructed wetland. Ecol. Eng. 2018, 115, 45–57. [Google Scholar] [CrossRef]
  22. Misiti, T.M.; Tezel, U.; Pavlostathis, S.G. Effect of alkyl side chain location and cyclicity on the aerobic biotransformation of naphthenic acids. Environ. Sci. Technol. 2014, 48, 7909–7917. [Google Scholar] [CrossRef] [PubMed]
  23. Bowman, D.T.; Warren, L.A.; McCarry, B.E.; Slater, G.F. Profiling of individual naphthenic acids at a composite tailings reclamation fen by comprehensive two-dimensional gas chromatography-mass spectrometry. Sci. Total Environ. 2019, 649, 1522–1531. [Google Scholar] [CrossRef] [PubMed]
  24. Toor, N.S.; Franz, E.D.; Fedorak, P.M.; MacKinnon, M.D.; Liber, K. Degradation and aquatic toxicity of naphthenic acids in oil sands process-affected waters using simulated wetlands. Chemosphere 2013, 90, 449–458. [Google Scholar] [CrossRef]
  25. Toor, N.S.; Han, X.; Franz, E.; Mackinnon, M.D.; Martin, J.W.; Liber, K. Selective biodegradation of naphthenic acids and a probable link between mixture profiles and aquatic toxicity. Environ. Toxicol. Chem. 2013, 32, 2207–2216. [Google Scholar] [CrossRef] [PubMed]
  26. Alharbi, H.A.; Morandi, G.D.; Jones, P.D.; Wiseman, S.B.; Giesy, J.P. Comparison of the Effects of Extraction Techniques on Mass Spectrometry Profiles of Dissolved Organic Compounds in Oil Sand Process-Affected Water. Energy Fuels 2019, 33, 7001–7008. [Google Scholar] [CrossRef]
  27. Headley, J.V.; Peru, K.M.; Barrow, M.P. Advances in mass spectrometric characterization of naphthenic acids fraction compounds in oil sands environmental samples and crude oil-A review. Mass Spectrom. Rev. 2016, 35, 311–328. [Google Scholar] [CrossRef]
  28. Huang, R.; Chen, Y.; Gamal El-Din, M. Silver-Ion Solid Phase Extraction Separation of Classical, Aromatic, Oxidized, and Heteroatomic Naphthenic Acids from Oil Sands Process-Affected Water. Environ. Sci. Technol. 2016, 50, 6433–6441. [Google Scholar] [CrossRef]
  29. Headley, J.V.; Peru, K.M.; Janfada, A.; Fahlman, B.; Gu, C.; Hassan, S. Characterization of oil sands acids in plant tissue using Orbitrap ultra-high resolution mass spectrometry with electrospray ionization. Rapid Commun. Mass Spectrom. 2011, 25, 459–462. [Google Scholar] [CrossRef]
  30. Samanipour, S.; Hooshyari, M.; Baz-Lomba, J.A.; Reid, M.J.; Casale, M.; Thomas, K.V. The effect of extraction methodology on the recovery and distribution of naphthenic acids of oilfield produced water. Sci. Total Environ. 2019, 652, 1416–1423. [Google Scholar] [CrossRef]
  31. Qin, R.; Lillico, D.; How, Z.T.; Huang, R.; Belosevic, M.; Stafford, J.; Gamal El-Din, M. Separation of oil sands process water organics and inorganics and examination of their acute toxicity using standard in-vitro bioassays. Sci. Total Environ. 2019, 695, 133532. [Google Scholar] [CrossRef] [PubMed]
  32. Bataineh, M.; Scott, A.C.; Fedorak, P.M.; Martin, J.W. Capillary HPLC/QTOF-MS for characterizing complex naphthenic acid mixtures and their microbial transformation. Anal. Chem. 2006, 78, 8354–8361. [Google Scholar] [CrossRef] [PubMed]
  33. Gagné, F.; André, C.; Turcotte, P.; Gagnon, C.; Sherry, J.; Talbot, A. A comparative toxicogenomic investigation of oil sand water and processed water in rainbow trout hepatocytes. Arch. Environ. Contam. Toxicol. 2013, 65, 309–323. [Google Scholar] [CrossRef] [PubMed]
  34. Alharbi, H.A.; Saunders, D.M.V.; Al-Mousa, A.; Alcorn, J.; Pereira, A.S.; Martin, J.W.; Giesy, J.P.; Wiseman, S.B. Inhibition of ABC transport proteins by oil sands process affected water. Aquat. Toxicol. 2016, 170, 81–88. [Google Scholar] [CrossRef]
  35. Ajaero, C.; McMartin, D.W.; Peru, K.M.; Bailey, J.; Haakensen, M.; Friesen, V.; Martz, R.; Hughes, S.A.; Brown, C.; Chen, H.; et al. Fourier Transform Ion Cyclotron Resonance Mass Spectrometry Characterization of Athabasca Oil Sand Process-Affected Waters Incubated in the Presence of Wetland Plants. Energy Fuels 2017, 31, 1731–1740. [Google Scholar] [CrossRef]
  36. Ajaero, C.; Peru, K.M.; Simair, M.; Friesen, V.; O’Sullivan, G.; Hughes, S.A.; McMartin, D.W.; Headley, J.V. Fate and behavior of oil sands naphthenic acids in a pilot-scale treatment wetland as characterized by negative-ion electrospray ionization Orbitrap mass spectrometry. Sci. Total Environ. 2018, 631, 829–839. [Google Scholar] [CrossRef] [PubMed]
  37. Simair, M.C.; Parrott, J.L.; Le Roux, M.; Gupta, V.; Frank, R.A.; Peru, K.M.; Ajaero, C.; McMartin, D.W.; Headley, J.V. Treatment of oil sands process affected waters by constructed wetlands: Evaluation of designs and plant types by multiple lines of evidence. (under review).
  38. McQueen, A.D.; Kinley, C.M.; Hendrikse, M.; Gaspari, D.P.; Calomeni, A.J.; Iwinski, K.J.; Castle, J.W.; Haakensen, M.C.; Peru, K.M.; Headley, J.V.; et al. A risk-based approach for identifying constituents of concern in oil sands process-affected water from the Athabasca Oil Sands region. Chemosphere 2017, 173, 340–350. [Google Scholar] [CrossRef]
  39. Beebe, D.A.; Castle, J.W.; Molz, F.J.; Rodgers, J.H. Effects of evapotranspiration on treatment performance in constructed wetlands: Experimental studies and modeling. Ecol. Eng. 2014, 71, 394–400. [Google Scholar] [CrossRef] [Green Version]
  40. Mohamed, M.H.; Wilson, L.D.; Shah, J.R.; Bailey, J.; Peru, K.M.; Headley, J.V. A novel solid-state fractionation of naphthenic acid fraction components from oil sands process-affected water. Chemosphere 2015, 136, 252–258. [Google Scholar] [CrossRef]
  41. Rubio, V.G. Book review: Gplot2-Elegant Graphics for Data Analysis (2nd Edition). J. Stat. Softw. 2017, 77, 2–5. [Google Scholar] [CrossRef] [Green Version]
  42. Vince, Q.V. Software. Available online: http://www.vince.vu/software/ (accessed on 3 August 2020).
  43. R: The R Project for Statistical Computing. Available online: https://www.r-project.org/ (accessed on 3 August 2020).
  44. Demeter, M.A.; Lemire, J.A.; Yue, G.; Ceri, H.; Turner, R.J. Culturing oil sands microbes as mixed species communities enhances ex situ model naphthenic acid degradation. Front. Microbiol. 2015, 6, 936. [Google Scholar] [CrossRef] [PubMed]
  45. Morton, J.T.; Toran, L.; Edlund, A.; Metcalf, J.L.; Lauber, C.; Knight, R. Uncovering the Horseshoe Effect in Microbial Analyses. mSystems 2017, 2, e00166-16. [Google Scholar] [CrossRef] [PubMed] [Green Version]
  46. Hughey, C.A.; Hendrickson, C.L.; Rodgers, R.P.; Marshall, A.G.; Qian, K. Kendrick mass defect spectrum: A compact visual analysis for ultrahigh-resolution broadband mass spectra. Anal. Chem. 2001, 73, 4676–4681. [Google Scholar] [CrossRef]
  47. Huang, R.; Chen, Y.; Meshref, M.N.A.; Chelme-Ayala, P.; Dong, S.; Ibrahim, M.D.; Wang, C.; Klamerth, N.; Hughes, S.A.; Headley, J.V.; et al. Characterization and determination of naphthenic acids species in oil sands process-affected water and groundwater from oil sands development area of Alberta, Canada. Water Res. 2018, 128, 129–137. [Google Scholar] [CrossRef] [PubMed]
  48. Han, X.; MacKinnon, M.D.; Martin, J.W. Estimating the in situ biodegradation of naphthenic acids in oil sands process waters by HPLC/HRMS. Chemosphere 2009, 76, 63–70. [Google Scholar] [CrossRef]
  49. Han, X.; Scott, A.C.; Fedorak, P.M.; Bataineh, M.; Martin, J.W. Influence of molecular structure on the biodegradability of naphthenic acids. Environ. Sci. Technol. 2008, 42, 1290–1295. [Google Scholar] [CrossRef]
  50. Ahad, J.M.E.; Pakdel, H.; Savard, M.M.; Calderhead, A.I.; Gammon, P.R.; Rivera, A.; Peru, K.M.; Headley, J.V. Characterization and quantification of mining-related “naphthenic acids” in groundwater near a major oil sands tailings pond. Environ. Sci. Technol. 2013, 47, 5023–5030. [Google Scholar] [CrossRef]
  51. Barrow, M.P.; Peru, K.M.; McMartin, D.W.; Headley, J.V. Effects of Extraction pH on the Fourier Transform Ion Cyclotron Resonance Mass Spectrometry Profiles of Athabasca Oil Sands Process Water. Energy Fuels 2016, 30, 3615–3621. [Google Scholar] [CrossRef]
  52. Xue, J.; Zhang, Y.; Liu, Y.; Gamal El-Din, M. Dynamics of naphthenic acids and microbial community structures in a membrane bioreactor treating oil sands process-affected water: Impacts of supplemented inorganic nitrogen and hydraulic retention time. RSC Adv. 2017, 7, 17670–17681. [Google Scholar] [CrossRef] [Green Version]
  53. Huang, C.; Shi, Y.; Xue, J.; Zhang, Y.; Gamal El-Din, M.; Liu, Y. Comparison of biomass from integrated fixed-film activated sludge (IFAS), moving bed biofilm reactor (MBBR) and membrane bioreactor (MBR) treating recalcitrant organics: Importance of attached biomass. J. Hazard. Mater. 2017, 326, 120–129. [Google Scholar] [CrossRef]
  54. Hostettler, F.D.; Wang, Y.; Huang, Y.; Cao, W.; Bekins, B.A.; Rostad, C.E.; Kulpa, C.F.; Laursen, A. Forensic fingerprinting of oil-spill hydrocarbons in a methanogenic environment-Mandan, ND and Bemidji, MN. Environ. Forensics 2007, 8, 139–153. [Google Scholar] [CrossRef]
  55. Zubot, W.; MacKinnon, M.D.; Chelme-Ayala, P.; Smith, D.W.; Gamal El-Din, M. Petroleum coke adsorption as a water management option for oil sands process-affected water. Sci. Total Environ. 2012, 427, 364–372. [Google Scholar] [CrossRef] [PubMed]
  56. Parsons, J.R.; Govers, H.A.J. Quantitative structure-activity relationships for biodegradation. Ecotoxicol. Environ. Saf. 1990, 19, 212–227. [Google Scholar] [CrossRef]
  57. Wang, N.; Chelme-Ayala, P.; Perez-Estrada, L.; Garcia-Garcia, E.; Pun, J.; Martin, J.W.; Belosevic, M.; Gamal El-Din, M. Impact of ozonation on naphthenic acids speciation and toxicity of oil sands process-affected water to vibrio fischeri and mammalian immune system. Environ. Sci. Technol. 2013, 47, 6518–6526. [Google Scholar] [CrossRef] [PubMed]
  58. Hughes, S.A.; Huang, R.; Mahaffey, A.; Chelme-Ayala, P.; Klamerth, N.; Meshref, M.N.A.; Ibrahim, M.D.; Brown, C.; Peru, K.M.; Headley, J.V.; et al. Comparison of methods for determination of total oil sands-derived naphthenic acids in water samples. Chemosphere 2017, 187, 376–384. [Google Scholar] [CrossRef]
  59. Yue, S.; Ramsay, B.A.; Wang, J.; Ramsay, J. Toxicity and composition profiles of solid phase extracts of oil sands process-affected water. Sci. Total Environ. 2015, 538, 573–582. [Google Scholar] [CrossRef]
  60. Clemente, J.S.; Mackinnon, M.D.; Fedorak, P.M. Aerobic Biodegradation of Two Commercial Naphthenic Acids Preparations. Environ. Sci. Technol. 2004, 38, 1009–1016. [Google Scholar] [CrossRef]
Figure 1. Principal component analysis (PCA) plot of negative-ion electrospray ionization (ESI)high-resolution Orbitrap-MS showing the variance in the degradation of naphthenic acid fraction compounds (NAFCs) over time in the constructed wetland treatment system (CWTS).
Environments 07 00089 g001
Figure 2. A Kendrick plot of all formulae used to calculate sample distribution in the previous PCA (Figure 1). Formulae are colour-coded according to factor loadings according to principal component one (PC1).
Environments 07 00089 g002
Figure 3. A van Krevelen plot of all formulae used to calculate sample distribution in the previous PCA (Figure 1). Formulae are colour-coded according to factor loadings according to PC1.
Environments 07 00089 g003
Figure 4. Kendrick mass plot of the relative abundance of NAFCs for all assigned formulas analyzed by negative-ion ESI-high-resolution Orbitrap-MS.
Environments 07 00089 g004
Figure 5. Van Krevelen diagram of the net-change in the relative abundance for O2, O3, O4, O5, O6, and O7 NAFC formulae assigned across the sampling period and analyzed by negative-ion ESI-high-resolution Orbitrap-MS.
Environments 07 00089 g005
Figure 6. Profiles of O2-NA concentration versus carbon number (n) and double bond equivalent (DBE) values before and after wetland treatment (A) Day 0 (untreated), (B) Day 27 (wetland system), and (C) profile of the ratio of NAΣDBEo/NAΣDBEi and NAΣno/NAΣni versus DBE values and carbon number, respectively, in the wetland treatment system. Figures A and B are adapted with permission from [36]
Environments 07 00089 g006
Table 1. The abundance (%) of the NAFCs in untreated and wetland treated OSPW sample.
NAFCsAbundance (%)
Untreated OSPWTreated OSPW
O2-NA56.129.0
O3-NAs16.125.2
O4-NAs16.728.3
O5-NAs1.94.0
O6-NAs0.40.8
Total Ox-NAs
(3 ≤ x ≤ 6)
35.157.4
SO20.24.9
SO35.12.0
SO42.73.2
SO50.311.1
Total SOx (2 ≤ x ≤ 5)8.311.2
Total NOx0.40.6

