Measuring Soil Metal Bioavailability in Roadside Soils of Different Ages
by
 , ,
, ,
Shamali De Silva
1,* ,
,
Trang Huynh
2,
Andrew S. Ball
3,
Demidu V. Indrapala
1,3 and
Suzie M. Reichman
1,4 
1
School of Engineering, RMIT University, Melbourne 3001, Australia
2
Hydrobiology Pty Ltd., Auchenflower 4066, Australia
3
School of Science, RMIT University, Melbourne 3001, Australia
4
Centre for Anthropogenic Pollution Impact and Management, School of Biosciences, University of Melbourne, Parkville 3010, Australia
*
Author to whom correspondence should be addressed.
Environments 2020, 7(10), 91; https://0-doi-org.brum.beds.ac.uk/10.3390/environments7100091
Submission received: 16 August 2020
/
Revised: 5 October 2020
/
Accepted: 11 October 2020
/
Published: 15 October 2020
(This article belongs to the Special Issue Soil Contamination by Heavy Metals and Metalloids)
Abstract
:Finding a reliable method to predict soil metal bioavailability in aged soil continues to be one of the most important problems in contaminated soil chemistry. To investigate the bioavailability of metals aged in soils, we used roadside soils that had accumulated metals from vehicle emissions over a range of years. We collected topsoil (0–10 cm) samples representing new-, medium- and old-aged roadside soils and control site soil. These soils were studied to compare the ability of the diffusive gradients in thin films technique (DGT), soil water extraction, CaCl2 extraction, total metal concentrations and optimised linear models to predict metal bioavailability in wheat plants. The response time for the release of metals and the effect on metal bioavailability in field aged soils was also studied. The DGT, and extractable metals such as CaCl2 extractable and soil solution metals in soil, were not well correlated with metal concentrations in wheat shoots. In comparison, the strongest relationships with concentrations in wheat shoots were found for Ni and Zn total metal concentrations in soil (e.g., Ni r = 0.750, p = 0.005 and Zn r = 0.833, p = 0.001); the correlations were still low, suggesting that total metal concentrations were also not a robust measure of bioavailability. Optimised linear models incorporating soil physiochemical properties and metal extracts together with road age as measure of exposure time, demonstrated a very strong relationship for Mn R2 = 0.936; Ni R2 = 0.936 and Zn R2 = 0.931. While all the models developed were dependent on total soil metal concentrations, models developed for Mn and Zn clearly demonstrated the effect of road age on metal bioavailability. Therefore, the optimised linear models developed have the potential for robustly predicting bioavailable metal concentrations in field soils where the metals have aged in situ. The intrinsic rate of release of metals increased for Mn (R2 = 0.617, p = 0.002) and decreased for Cd (R2 = 0.456, p = 0.096), Cu (R2 = 0.560, p = 0.083) and Zn (R2 =0.578, p = 0.072). Nickel did not show any relationship between dissociation time (Tc) and road age. Roadside soil pH was likely to be the key parameter controlling metal aging in roadside soil.
1. Introduction
Metals are persistent, bioaccumulate and are well-known for their toxicity. The presence of elevated concentrations of metals in soil due to natural or anthropogenic activity represents a potential risk to human and ecological health; consequently, the assessment of soil metal contamination risks is of great interest to governments and regulators [1]. The measurement and understanding of the bioavailability of elevated metals in soil are an important part of any risk assessment. The bioavailability of metals in soil is a complex dynamic process and believed to be driven by speciation, sorption and biological processes in soil, but still little is known about their interplay in soil systems [2]. Previous studies have shown the importance of soil metal bioavailability in determining metal toxicity; however, there is still no general agreement on how best to measure metal bioavailability in soils [2,3,4,5,6]. Over the years, researchers have attempted to measure bioavailable metals in soil using many techniques such as ion exchange extraction, chelate extractions, rhizosphere extractions, isotopic solution extractions and the diffusive gradients in thin films technique (DGT). Effective elemental concentrations available for uptake from the solution-phase and solid-phase [7] can be simulated using the 2D DIFS model used in DGT. The DGT technique has also been used to estimate metal release kinetics from the solid to solution phase in soils [8,9]. The response time of soil to the resupply of metals in to the solution phase represents the response to metal depletion, and is directly related to the rate constant of the metal resupply process from the solution phase to the DGT film and therefore to plant roots [7]. To predict the concentration of metals in wheat plants as a result of the uptake of metals from uncontaminated soil, mathematical models including multiple regression analysis have also been validated and applied [10,11]. Generally, these techniques may not account for metals that have been accumulated over time in soil i.e., the aging effect of metals in soil. Thus, there is still a need to find and validate techniques for measuring bioavailable metals in aged contaminated soil.
Metal aging in soil is the process by which the bioavailability, mobility and/or the exchangeability of metals declines over time. The aging process is also referred to as natural attenuation or the fixation effect of metals in soil [12]. Aging of metals in soil is a long-term process and an important aspect affecting metal bioavailability [13,14]. However, our current understanding of the kinetics of metal aging in soil is limited. Experiments have confirmed that metal bioavailability in soil decreases as a result of the aging process [15,16,17]. Temperature, pH, moisture content and climate affect the rate of metal aging in soil, with pH considered as the most important parameter [18]. However, the majority of experiments on metal aging have been conducted using soils that have been spiked with metals in a laboratory [19], and thus have only assessed short-term aging effects.
The aim of this study was to systematically investigate metal bioavailability in roadside soil at varying road ages and metal concentrations. Wheat plants were used as a bioassay to accumulate bioavailable metals. The ability of DGT, soil water extraction, CaCl2 extraction, total metal concentrations in soil and optimised linear models to measure metal bioavailability, together with the release response time of metals and its impact on metal bioavailability in field-aged soils were studied. We used roadside soil to investigate soil properties and metal aging effects on bioavailability for a wide range of metals. Cadmium, Cu, Ni, Mn and Zn have previously been found to be elevated in roadside soils from Melbourne, Australia [20]. More information on the vehicular sources of Cd, Cu, Mn, Ni and Zn in roadside soils can be found in De Silva et al. [21]. Soil samples were collected from sites representing three different road ages, i.e., new, medium and old-aged roads.
2. Methods
2.1. Soil Sampling
Metals in roadside soils have been deposited from vehicle emissions over varying time periods of up to multiple decades depending on the age of the roads. Thus, roadside soils provide an opportunity to study bioavailability and metal aging processes in long-term in situ metal-contaminated soils. Soil samples were collected in December 2012 from roadside soils formed on chromosol [22] of newer volcanic basaltic geology [23] in the west of Melbourne, Australia. The selection of roads from the same geology ensured that the soil derived from similar parent material reduced variations due to natural soil derivatives. All chosen roads were constructed from the same surface material, i.e., asphalt. Samples were collected adjacent to roads carrying ≥ 1500 vehicles/day and represented three different road ages, i.e., new (N = 1.5–5 years), medium (M = 5–10 years) and old (O ≥ 15 years). Three soil replicates for each road type were collected. Three sites in parklands at least 1 km away from roads and industry were included as control sites. Approximately 500 g of topsoil samples from 0–10 cm were collected using a clean stainless steel spatula and placed in zip-lock polythene bags. The immediate road edge up to 1 m was avoided to minimise the risk of sampling refilled or recently disturbed soil from road constructions and upgrades [24]. Soil samples were air-dried (23 ± 2 °C), sieved (≤2 mm), sealed in zip lock polythene bags and stored at ambient laboratory conditions (20 ± 2 °C) in the dark until further analysis [20].
2.2. Wheat Assay
Soil aliquots (75 g) were placed into 24 polystyrene plastic pots (180 mL). The pots were moistened to 50% of the maximum water holding capacity (MWHC) with ultrapure water (18 MΩ.cm) and left to equilibrate for 24 h at 21 °C in the dark. Triticum aestivum cv. AXE (bread wheat) seeds (Department of Primary Industries, New South Wales, Australia) were surface sterilised with 0.3% NaOCl solution and rinsed with deionised water [25]. Twenty seeds were sown into each pot and the pots placed in a growth chamber at 21 °C/15 °C on a 14 h/10 h light/dark cycle for 28 days. On the 5th day after sowing, the seedlings were thinned to 10 plants per pot. Aliquots (5 mL) of Ruakara nutrient solution [6] were added to the pots on days 5, 10, 15, 20 and 25 prior to watering. Throughout the experiment, pots were regularly watered with ultrapure water to maintain 50% MWHC.
On day 28, seedlings were harvested by cutting shoots 1 cm above the soil surface. Shoots were washed thoroughly with ultrapure water, dried for 24 h at 45 °C, and the shoot dry weight was recorded for each pot. Dried shoot samples were finely ground and stored in polypropylene plastic storage vials at ambient laboratory conditions (20 ± 2 °C) in the dark until further processing. Nitric acid (HNO3, 5 mL, 70%, Sigma Aldrich analytical grade), together with hydrogen peroxide (H2O2, 1 mL, 30% w/w, Sigma Aldrich analytical grade), was added to aliquots of the dried plant samples (0.2 g) and digested at 115 °C using a microwave digester (Milestone, Ethos d’ model). After digestion, samples were filtered (pore size 0.45 µm) and diluted with ultrapure water before being analysed for total metals using inductively coupled plasma-mass spectrometry (ICP-MS, Agilent Technologies 7700x element analyser). The isotopes chosen for this investigation were Cd (111), Cu (63), Ni (60), Mn (55) and Zn (66). The accuracy of the method was verified by analysing reagent blanks, which represented 10% of the total digested sample population and replicates of certified reference citrus plant material [NCS ZC73018 (GSB-11)]. The recovery of the certified reference material was >90% for all certified metals and no signs of contamination were found.
2.3. Analysis of Metals in Soil
2.3.1. Total Metal Digestion
Air-dried and sieved soil aliquots of 0.5 g were digested in 2.5 mL of aqua regia (HNO3: HCl, 1:3) at 105 °C for 2 h, followed by the addition of 1 mL of H2O2 30% (w/w). Digested soil samples were cooled and final volumes were diluted to 50 mL using ultrapure water. Diluted acid digestate was then filtered using 0.45 µm nylon filter membranes. To determine the contamination, precision and bias of the analysis, reagent blanks which represented 10% of the total digested sample population and replicated certified reference materials (DO82-540, ERA) were incorporated into the analysis. The findings of the analytical results showed no signs of contamination, and the accuracy was found to be consistently within 10% of the certified values [20].
2.3.2. Metal CaCl2 Extraction
For the extraction of soluble metals from soil, air-dried soil aliquots (10 g) were placed in 250 mL high density polyethylene (HDPE) plastic bottles. Calcium chloride (100 mL, 0.01 M) was then added to each bottle [26]. The bottles were vortexed for 2 h at 20 °C. The suspension was decanted into a 100 mL centrifuge tube and centrifuged for 10 min at 1800 rpm. A 10 mL aliquot of the supernatant was filtered using a 0.45 µm syringe filter. The filtered supernatant was acidified with 4% HNO3 at a ratio of 1:2 ratio before metal analysis.
2.3.3. Analysis of Metals in Soil Digests and Extracts
Total metals and CaCl2 extractable metals were analysed for Cd, Cu, Mn, Ni and Zn using ICP-MS. The isotopes chosen for this investigation were Cd (111), Cu (63), Ni (60), Mn (55) and Zn (66). The accuracy of the method was verified by analysing certified reference soil (DO82-540) alongside samples and with recovery >90% for all certified metals as previously described in De Silva et al. [20].
2.3.4. Other Soil Analysis
Methods described in Rayment and Higginson [27] were used to determine soil parameters. The following soil analyses methods were used: pH (method 4A1) using 1:5 soil/water extract, effective cation exchange capacity (ECEC) (method 15D1) using 1 M ammonium acetate at pH 7.0; pre-treatment for soluble salts and manual leaching, and organic carbon (OC) (method 6A1) using the Walkley and Black (W and B) method.
2.4. Diffusive Gradients in Thin Films (DGT) Technique
The DGT soil measurement method followed the DGT soil deployment protocol guided by DGT research (DGT soil deployment guide A2-20), and as described by Zhang et al. [28]. Briefly, 50 g soil aliquots were moistened to MWHC by adding the measured mass of ultrapure water while mixing with a wooden spatula until a smooth paste was formed. The soil paste was covered with clean plastic wrap to prevent water evaporation and left to equilibrate for 24 h in the dark at 20 ± 1 °C. Before DGT deployment in the soil, the DGT (Chelex-100) devices (Griffith University, Australia) were rinsed thoroughly with ultrapure water to remove the NaNO3 storage solution and dried with tissue paper. A small subsample of each soil paste was applied directly to the DGT device membrane to ensure complete contact between the soil paste and the DGT membrane, before the device was placed with gentle pressure directly onto the soil paste sample. During deployment of the DGT devices, the dishes were covered with plastic paraffin film (Parafilm M®, Bemis NA) to minimise water evaporation. Blank DGT without soil paste were also deployed. In this experiment, the deployment time of 7 h was used to avoid exceeding the capacity of the resin gel, as verified by calculations for the highest concentrations of metals in water extractable metal concentrations [29,30]. The deployment occurred at ambient laboratory lighting conditions. The temperature throughout the deployment was recorded using two data loggers and a mean temperature of deployment period of 20 °C (range 19–21 °C) was used for DGT calculation.
Upon retrieval, each DGT device was rinsed using ultrapure water to remove soil particles, and dried using clean, dry tissue paper. The resin gel was removed using separate, clean plastic tweezers for each sample. Metals bound within the resin gel were extracted using 1 mL of 1 M HNO3 in 5 mL polypropylene centrifuge tubes. To obtain soil solution samples for the analysis of soil solution metal concentration (CSOL), an aliquot of the sample of the soil paste was added to a 50 mL centrifuge tube and centrifuged at 5000 rpm for 5 min. The supernatant was decanted and filtered through a nylon filter membrane (0.45 µm). The metal concentrations in the resin gel and soil solution samples were analysed using ICP-MS.
DGT Data Analysis
The concentration of metal accumulated on the binding gel in the DGT device (M) was determined according to Equation (1).
where: C is the metal concentration eluted from the binding gel measured by ICP-MS
M = C (Vacid + Vgel)/fe
Vacid is the volume of acid used for elution (Vacid = 1 mL),
Vgel is the volume of resin gel (Vgel = 0.16 mL),
fe is the elution factor (fe = 0.8).
Once M was calculated, the interfacial DGT concentration (CDGT) was calculated using Equation (2),
where: Δg is the diffusive layer thickness (0.8 mm) plus the thickness of the filter membrane (0.14 mm), which is 0.94 mm,
CDGT = MΔg/DAt
D is the diffusion coefficient of metal at a given temperature (cm2 S−1),
A is the area of the exposed membrane (A = 3.14 cm2),
t is the deployment time (in seconds).
The diffusion coefficients of the metal of interest (Ds) were calculated using Equations (3)–(5).
where: m is the total mass of all soil particles;
Pc = m / V
ϕ = Dp / (Pc + Dp)
Ds = D0 / (1 − ln ϕ2)
V the pore water volume in a given volume of total soil (cm3),
Dp is the density of soil particles (2.65g cm−3) in soil,
Do is the diffusion coefficient of the metal ion at 20 ± 1 °C, (cm2 S−1),
Ds is the diffusion coefficient in sediment (cm2 S−1).
The input parameters used in the 2D DFIS model to calculate RDIFF, were particle concentration (Pc) and soil porosity (ϕ). Pc (g cm−3) was determined using Equation (3) and soil porosity (ϕ) was determined using Equation (4), and the diffusion coefficient in sediment (Ds) was calculated using Equation (5).
Effective solution concentrations, CE, were derived using Equation (6).
where: CDGT was the metal concentration measured by the DGT technique (in mg/kg).
CE = CDGT / RDIFF
The effective concentration (CE) was used to estimate the potential metal concentration that can be absorbed by plants. The DGT technique is designed to mimic root uptake metal from soil. During DGT measurement, interface metal concentrations were measured to take into account the continuous depletion of metals, due to the uptake and the resupply process of metals from solid to solution phase. Metal depletion is indicated as a ratio (R) using the CDGT and independently measured solution (CSOL) concentrations (Equation (7)).
where: Tc (seconds) is the time taken to reach the equilibrium, Tc is determined using Equation (8).
R = CDGT/ CSOL
Tc = C (1 − R / R − d)2
Note: For samples with high porosity; C = 403, d = 0.0247 and for low porosity case C = 229, d = 0.0186 [7]. The soils for this study were treated as being low porosity.
2.5. Statistical Analysis
Data were analysed using SPSS Statistics IBM version 21 (2012). Soil physicochemical parameters were analysed for descriptive statistics (mean ± standard error). Roadside and control sites were compared using one-way ANOVA, with significance taken as p < 0.05. Where necessary, data were square root or log10 transformed to obtain an acceptable normal distribution and to stabilise the variance of the residuals, and significance was based on an analysis of the transformed data. Relationships between the metal of interest and other physicochemical parameters were analysed using a 2-tailed Pearson correlation test; significance was treated as p < 0.05. Optimised linear models for soil metal concentrations were determined using stepwise regression with criteria of α = 0.05 for entry. The input parameters used were soil physiochemical properties including pH, EC, ECEC, TOC, Tc, DGT, soil total metals, CaCl2 extractable metals, water extractable metals, and the age of the road as a measure of metal aging in soil. Linear correlations were also developed; p < 0.05 was considered significant and 0.05 < p < 0.10 was considered marginally significant.
3. Results
3.1. Soil Properties
There were differences in general soil characteristics between road types and the control sites (Table 1). Significantly more alkaline pH was recorded from new roadsides compared to other sites; total organic carbon was highest in the oldest roadside soils and EC was lowest in the control soil. There was no significant difference in Pc or ECEC between the roadside soil sites, i.e., new, medium and old roads.
3.2. Metal Concentrations in Soil, Wheat, DGT, CE, CSOL, CaCl2 Extractable Metals
Total metal (Cd, Cu, Mn, Ni and Zn) concentrations measured in the control soil were lower than in the roadside soil (Table 2). The highest Zn and Cd concentrations (45 mg/kg and 0.2 mg/kg) were recorded adjacent to old roads and the highest Mn concentration (599 mg/kg) was recorded next to a new road. The highest Cu concentration (12 mg/kg) and highest Ni concentration (21 mg/kg) were recorded from medium-aged roads [20].
Metal concentrations in wheat shoots varied across the sites. Significantly higher wheat shoot concentrations were measured for Mn (p = 0.041), Ni (p = 0.024) and Zn (p = 0.035) for roadside soils compared to the control sites (Table 2). Cadmium showed a significant accumulation in wheat shoots grown in medium-aged roadside soil compared to control site grown wheat. Copper accumulation did not vary significantly in wheat shoots at any site. Some roadside soil samples showed a significant difference in CaCl2 extracted metals, soil solution metals (CSOL) and effective concentrations (CE) among roadside and control soils (Table 2).
Both the DGT technique and CaCl2 extractable metals were not statistically correlated to metals in wheat shoots for plants grown in roadside soil (Table 3), except for Cu, where a significant negative correlation r = −0.562 was found for CaCl2 extractable Cu. In general, the factors best correlated with shoot metal concentrations were total metal concentrations in soil (Ni: r = 0.750, p = 0.005; Zn: r = 0.833, p = 0.001), CSOL concentrations (Cu: r = −0.528, p = 0.009; Mn: r = −0.544, p = 0.005; Ni: r = 0.465, p = 0.025; Zn: r = 0.485, p = 0.016) and soil pH (Ni: r = 0.632, p = 0.001; Zn: r = 0.589, p = 0.004).
Soil pH also correlated with several other soil metal measurements, in particular with R, CSOL and Tc (Table 3). The dissociation time for Cd (r = 0.630, p = 0.028), Ni (r = 0.661, p = 0.027) and Zn (r = 0.807, p = 0.002) in soil was significantly correlated with soil pH (Table 3), while Tc showed a strong correlation with soil TOC for Mn (r = 0.701).
3.3. Metal Aging and Dissociation Time in Soil
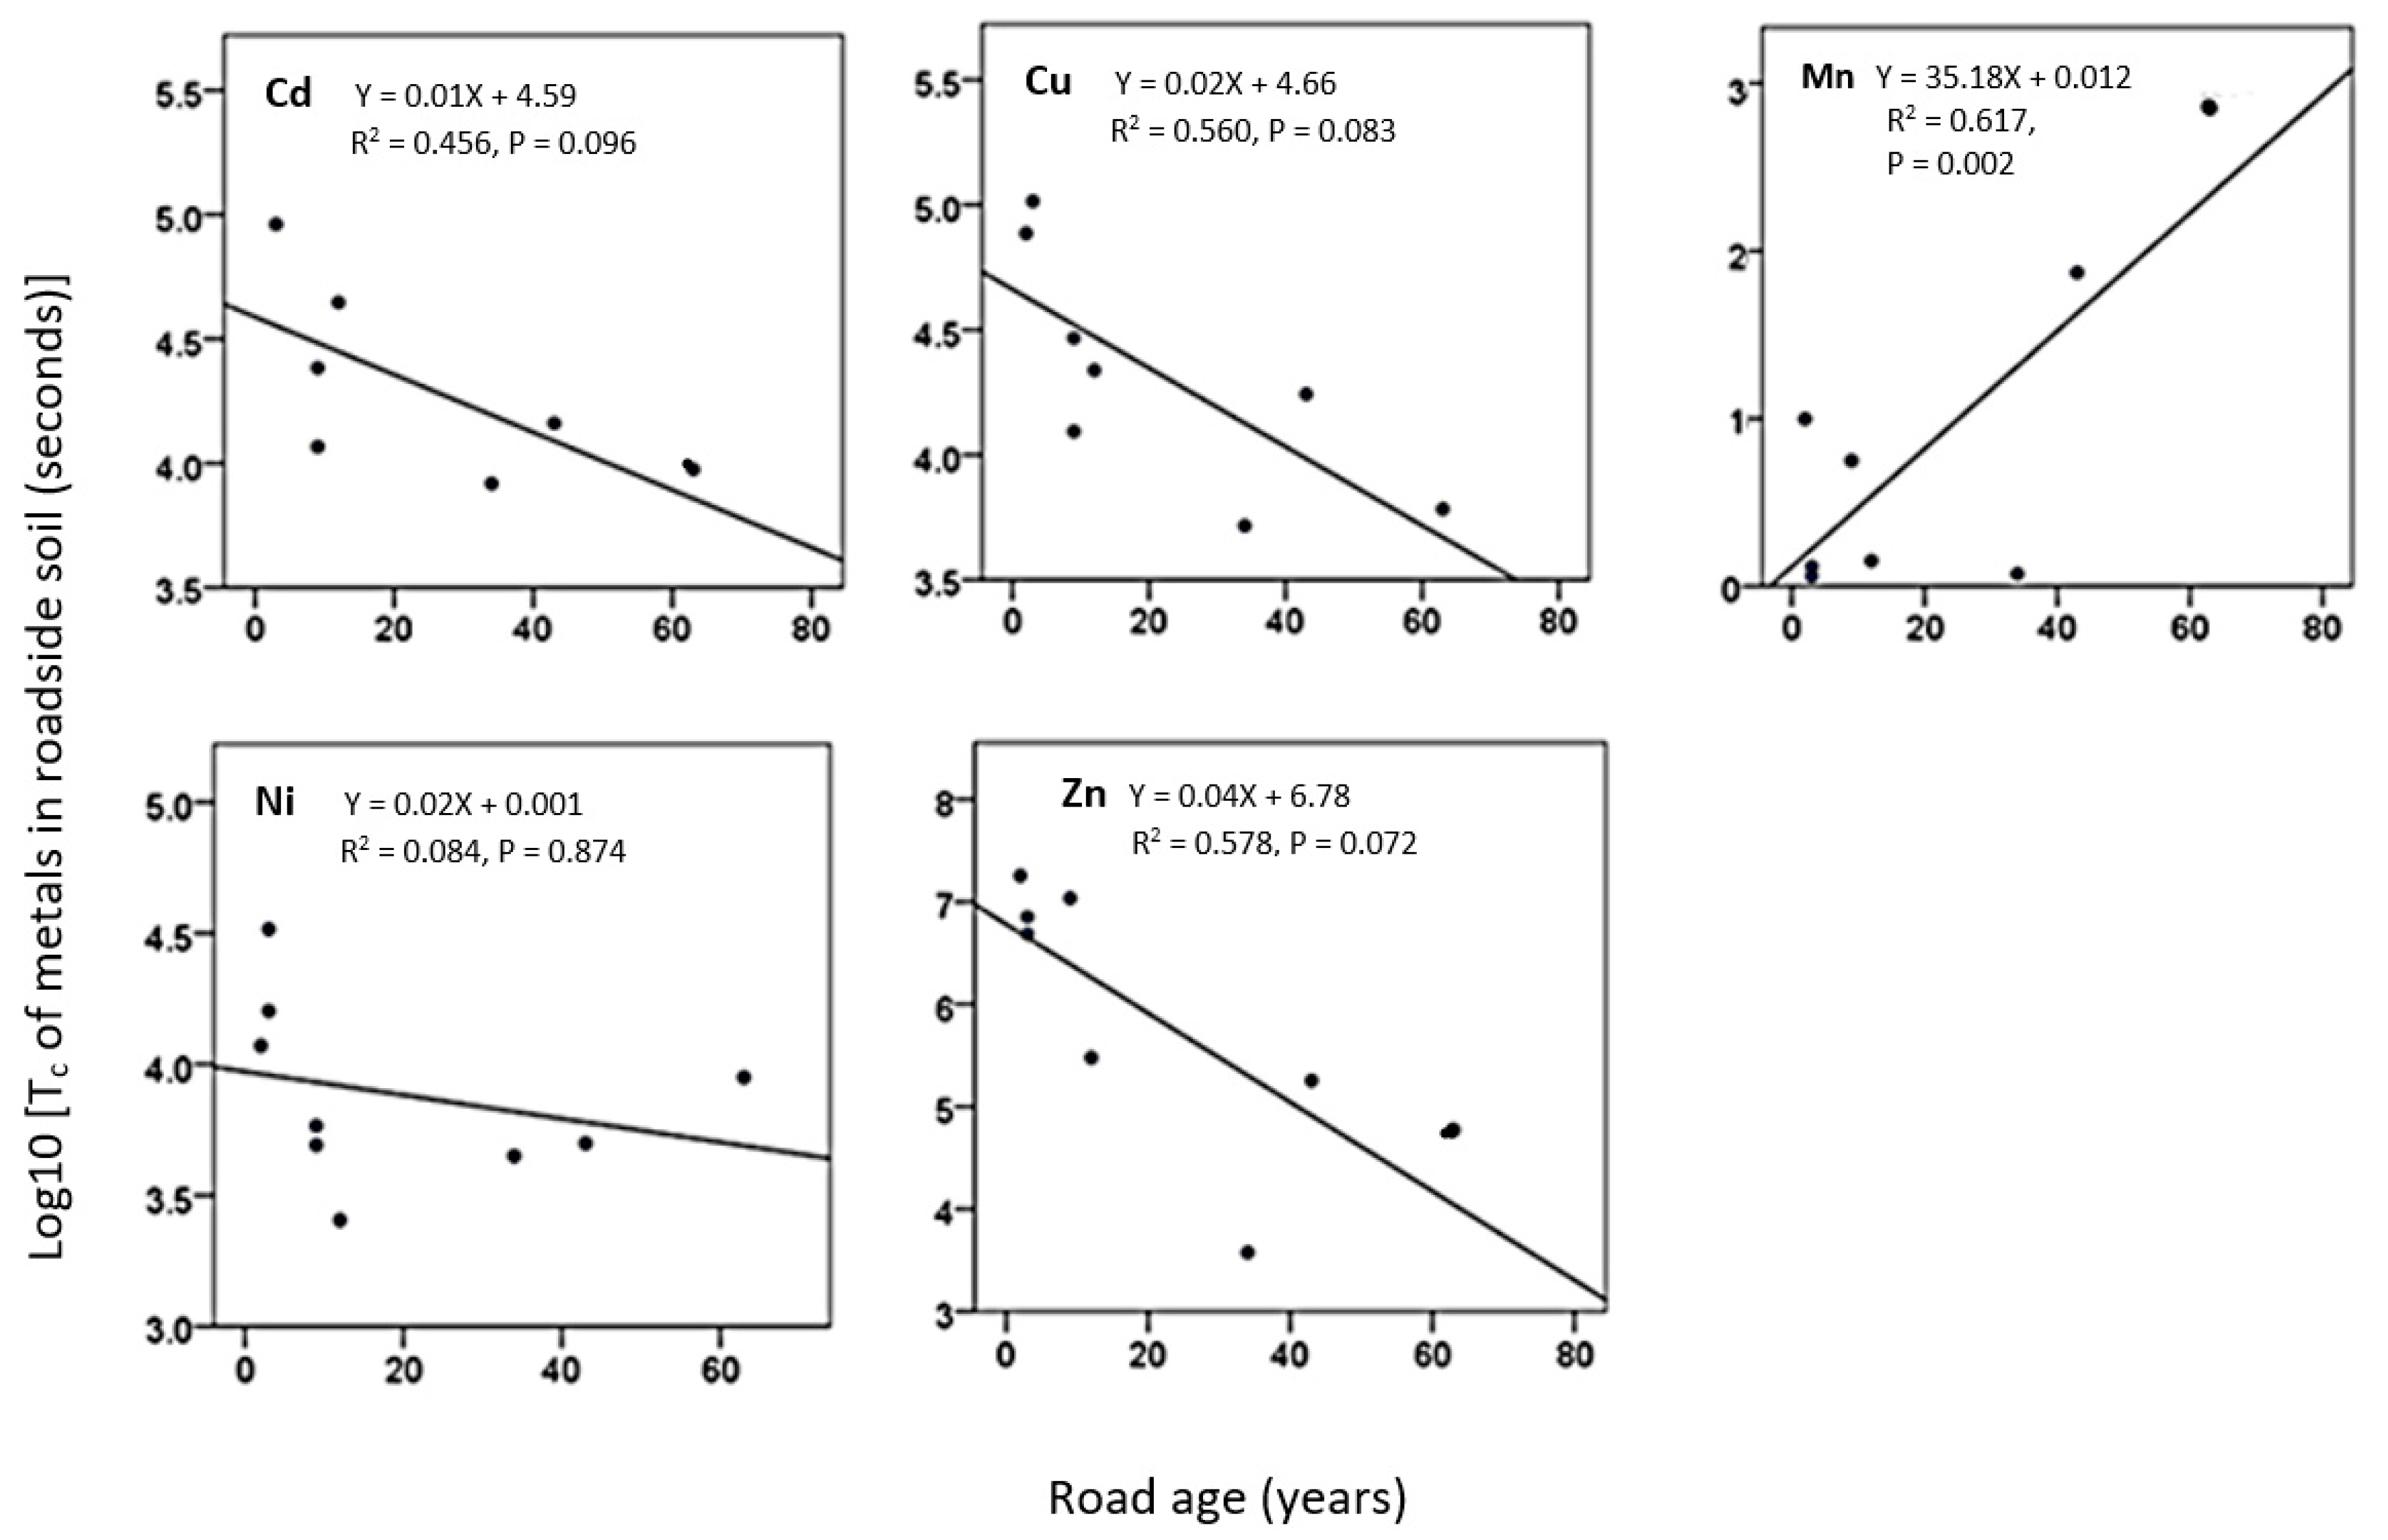
The time for the dissociation of metals from the solid-liquid interface was examined with respect to the effect of the time of soil exposure to vehicular emitted metal contamination (i.e., road age) on metal dissociation in soil (Figure 1). Negative marginally significant (p < 0.1) linear correlations were found between Tc and the following soil metal concentrations: Cd (R2 = 0.456, p = 0.096), Cu (R2 = 0.560, p = 0.083) (Figure 1) and Zn (R2 = 0.578, p = 0.072) (Figure 1). In contrast, the Tc of Mn increased significantly (p < 0.05) with the length of time for contamination (R2 = 0.617, p = 0.002), and Ni did not show a linear relationship between Tc and road age (R2 = 0.084, p = 0.874).
Optimised linear models between wheat shoot concentrations, i.e., bioavailable metal concentrations and other soil properties for Mn, Ni and Zn all had R2 > 0.9, but for Cd and Cu, no relationships were able to be developed (Table 4). Total metal concentrations in soil showed a consistent positive relationship with Ni and Zn metal bioavailability, but a negative relationship for Mn. Overall, the metal bioavailability was best explained by the total metal concentration in soil and the road age, while soil properties such as TOC and soil moisture were also important.
4. Discussion
Wheat grown in roadside soils accumulated Cd, Mn, Ni and Zn significantly in shoots compared to the control site grown wheat (Table 2). These findings are an indication of the presence of bioavailable metals in the roadside soils tested. In general, out of all the soil assays tested, correlations between metals in wheat shoots and optimized linear models (Table 4) were the best representation of the bioavailability of metals found in the studied roadside soils. Other studies have shown that the toxicity and mobility of metals in soils are as dependent on the total concentrations of metals in soil [31,32].
The magnitude of the r-values for soil concentration (CSOL) relationships in this current study were weak (Table 3 and Table 4) and demonstrates that only a small proportion of the variation in metal bioavailability to wheat could be explained via soil solution concentrations. That is, only about 30% of these metals found in wheat shoot could be explained by CSOL for metal concentrations like Zn and Ni. Thus, the CSOL metal concentrations in soil do not appear to be an appropriate measure of bioavailability in roadside soils where the metals have aged in the soil over a number of years. In comparison, CSOL concentrations have previously been reported as a good measure of bioavailability for Zn in spiked roadside soils [33].
The CaCl2 extraction was also found to be a poor measure for metal bioavailability in roadside soils, with the only significant correlation being for Cu (r = −0.582, p = 0.077). It should be noted that the r value for Cu in the current study, while significant is not strong, suggesting that CaCl2 extraction is a poor predictor of the variability of the metal bioavailability in roadside soil (aged). In comparison, Menzies et al. [34], in a meta-analysis of the literature, reported CaCl2 as a good measure of Cu bioavailability for grasses in soil.
The concentration of metals in roadside soils as measured by DGT did not correlate significantly with metal concentrations in wheat shoots (Table 3). This indicates that, in roadside soils where metals have aged for multiple years, DGT measurements of soils were not a good measure of the bioavailability of metals to wheat shoots. While Zhang et al. [33] found good correlations between DGT measurements and Zn plant uptake, their results were for soils that had been recently spiked with metals collected from roadsides, rather than soils where the metals had been present for extended periods of time.
Even though there has been considerable research into metal bioavailability in soil (including Naidu et al. [2], Smolders et al. [35], Zogaj and Düring [11] and many others) there remains a lack of ability to robustly predict bioavailable metal concentrations in soil. Many soil properties such as pH, organic matter content, clay contents/soil composition, and contaminant physicochemical properties such as oxidation state and aqueous solubility are responsible for controlling the behaviour of metals in soil [4]. These properties can be used to predict the fraction of contaminants that may be bioavailable in a given soil, such that a model which can incorporate many of these individual effects on bioavailability may be more effective. The optimised linear models we developed using soil physiochemical properties, different metal concentrations representing different metal extracting techniques and age of the roadside soil showed very strong relationship for Mn, R2 = 0.936; Ni, R2 = 0.936 and Zn, R2 = 0.931 (Table 4). While all the models developed were dependent on total soil metal concentrations, models developed for Mn and Zn clearly demonstrated the effect of road age, i.e., how long metals had aged in situ on metal bioavailability. Thus, optimised linear models have the potential for use in robustly predicting bioavailable metal concentrations in field soils where the metal concentrations have aged in situ.
The low R (CDGT/CSOL) values determined in this research (Table 3) may be as a result of metals being only slowly resupplied from the soil solid phase [36]. The reasons for the low resupply of metals could include limited metal reservoirs, a slow rate constant of the metal resupply process (Kdl) and/or slow desorption metal kinetics [7]. The results suggest a decrease in the R value in soil metals after the wheat assay compared to prior growing wheat. The low R values may be as a result of a reduction in labile metal concentration in the solution due to plant uptake [37].
The biological impact of metals will depend on the rate of the metal dissociation (desorption) from the soil solid to liquid phase and its subsequent availability to organisms. The Tc marginally significantly (p ≤ 0.1) decreased with the age of the roads for Cd (p = 0.096), Cu (p = 0.08) and Zn (p = 0.072), while for Mn, Tc significantly increased (p = 0.002) with the age of the roads (Figure 1). Therefore, Cd, Cu, Ni and Zn showed a slower release rate from the solid to solution phase compared to Mn in newer roads and a higher rate of release for old roads (Figure 1). This is counterintuitive for all metals except Mn, as it would generally be expected that metals that had aged longer in soils would be more tightly bound and therefore dissociate at lower rates. However, correlation coefficients analysis (Table 3) showed that Tc was positively related to soil pH for Cd (r = 0.630, p = 0.028, Ni (r = 0.661, p = 0.027) and Zn (r = 0.807, p = 0.004) (Table 2). The trend of decreasing soil pH with increasing age of roads (Table 1) is likely to have lowered the Tc for these metals. This is in contrast to Ernstberger et al. [8], who reported no clear trend for Ni between Tc and pH. The decrease of soil pH with the age of the road is possible due to sulphur contained in vehicular emissions, resulting in acid generation in soil [38]. The high Mn concentrations present in the newest roads could have also controlled the labile metal pools of other metals by binding to Mn-oxide. For example the presence of high Mn has been shown to effect the binding ability of Cd with Fe-Mn oxides and organics [39], resulting in lower solubility of the corresponding metal in new roadside soil metals. In addition, Temminghoff et al. [40] observed increases in solubility with increases in the organic carbon content of the soil for Cu and Zn in soil, and a similar scenario may have been operating in the roadside soils measured in the current experiment. Thus, a more alkaline pH, low Mn content and higher TOC in older roadside soils (Table 1) may have caused the higher availability of Cd, Cu and Zn compared to soils besides newer roads. Tc and pH could be used as an important tool in comparing soil metal aging effect in soil solutions, thus metal bioavailability.
5. Conclusions
This study investigated the bioavailability of metals aged in situ in roadside soil. None of the soil assays tested (total metals, DGT, soil solution and CaCl2 extractable metals) were good approaches for measuring the bioavailability of metals aged in roadside soils. Optimised linear models showed good potential for use in predicting bioavailable Mn, Ni and Zn in field contaminated aged soils. Soil concentration (CSOL) relationships in this current study were weak, while CaCl2 showed only one significant correlation with Cu (r = −0.582, p = 0.077). This study provided insights into the understanding of the kinetics of long-term metal aging in field contaminated soil, using roadside soils as the model. The dissociation time, Tc, was used for comparing soil metal aging effects. The results showed that Tc was pH dependent for most metals tested (Cd, Ni and Zn). Soil pH was likely to be the key parameter controlling aging of metals in roadside soil, thus metal bioavailability.
Author Contributions
Conceptualization, S.D.S., T.H., S.M.R., and A.S.B.; methodology, S.D.S., T.H., S.M.R., and A.S.B.; validation, S.D.S., T.H., S.M.R.; A.S.B., and D.V.I.; formal analysis, S.D.S, T.H.S. and D.V.I.; investigation, S.D.S.; resources, S.M.R. and T.H.; data curation, S.D.S. and S.M.R.; writing, original draft preparation, S.D.S.; writing, review and editing, S.D.S., S.M.R., T.H., A.S.B., D.V.I.; visualization, S.D.S.; supervision, S.M.R., T.H., and A.B.; project administration, S.M.R. All authors have read and agreed to the published version of the manuscript.
Funding
S.D.S. would like to thank the School of Civil, Chemical and Environmental Engineering, RMIT University for providing the PhD scholarship and Higher degree by research (HDR) publication fellowship.
Acknowledgments
We would like to thank RMIT University, School of Civil, Chemical and Environmental engineering for SDS’s PhD scholarship and Higher Degree by Research Publication Grant (HDRPG), during this work. The authors gratefully acknowledge the assistance provided by Paul Morrison for ICP-MS operation and Sandro Logano, Cameron Crombie and Babu Iyer for technical assistance in the laboratory
Conflicts of Interest
The authors declare no conflict of interest.
References
- Fairbrother, A.; Wenstel, R.; Sappington, K.; Wood, W. Framework for metals risk assessment. Ecotoxicol. Environ. Saf. 2007, 68, 145–227. [Google Scholar] [CrossRef] [PubMed]
- Naidu, R.; Juhasz, A.; Mallavarapu, M.; Smith, E.; Lombi, E.; Bolan, N.S.; Wong, M.H.; Harmsen, J. Chemical Bioavailability in the Terrestrial Environment-recent advances. J. Hazard. Mater. 2013, 261, 685–686. [Google Scholar] [CrossRef] [PubMed]
- McLaughlin, M.J.; Hamon, R.E.; McLaren, R.G.; Speir, T.W.; Rogers, S.L. A bioavailability-based rationale for controlling metal and metalloid contamination of agricultural land in Australia and New Zealand. Soil Res. 2000, 38, 1037–1086. [Google Scholar] [CrossRef]
- Naidu, R.; Bolan, N.S. Contaminant chemistry in soils: Key concepts and bioavailability. Dev. Soil Sci. 2008, 32, 9–37. [Google Scholar]
- Peijnenburg, W.J.; Zablotskaja, M.; Vijver, M.G. Monitoring metals in terrestrial environments within a bioavailability framework and a focus on soil extraction. Ecotoxicol. Environ. Saf. 2007, 67, 163–179. [Google Scholar] [CrossRef] [PubMed]
- Smart, M.; Zarcinas, G.; Stevens, B.; Barry, D.; Cockley, G.; McLaughlin, T. CSIRO Land and Water’s Methods Manual for ACIAR Project no. LWR1/1998/119; CSIRO Land and Water: Clayton, Australia, 2004. [Google Scholar]
- Harper, M.P.; Davison, W.; Zhang, H.; Tych, W. Kinetics of metal exchange between solids and solutions in sediments and soils interpreted from DGT measured fluxes. Geochim. Cosmochim. Acta 1998, 62, 2757–2770. [Google Scholar] [CrossRef]
- Ernstberger, H.; Davison, W.; Zhang, H.; Tye, A.; Young, S. Measurement and dynamic modeling of trace metal mobilization in soils using DGT and DIFS. Environ. Sci. Technol. 2002, 36, 349–354. [Google Scholar] [CrossRef]
- Ernstberger, H.; Zhang, H.; Tye, A.; Young, S.; Davison, W. Desorption kinetics of Cd, Zn, and Ni measured in soils by DGT. Environ. Sci. Technol. 2005, 39, 1591–1597. [Google Scholar] [CrossRef]
- Ivezić, V.; Almås, Å.R.; Singh, B.R. Predicting the solubility of Cd, Cu, Pb and Zn in uncontaminated Croatian soils under different land uses by applying established regression models. Geoderma 2012, 170, 89–95. [Google Scholar] [CrossRef]
- Zogaj, M.; Düring, R.A. Plant uptake of metals, transfer factors and prediction model for two contaminated regions of Kosovo. J. Plant Nutr. Soil Sci. 2016, 179, 630–640. [Google Scholar] [CrossRef]
- Zeng, S.; Li, J.; Wei, D.; Ma, Y. A new model integrating short-and long-term aging of copper added to soils. PLoS ONE 2017, 12, e0182944. [Google Scholar] [CrossRef] [Green Version]
- Anxiang, L.U.; Zhang, S.; Xiangyang, Q.; Wenyong, W.U.; Honglu, L.I.U. Aging effect on the mobility and bioavailability of copper in soil. J. Environ. Sci. 2009, 21, 173–178. [Google Scholar]
- Tagami, K.; Uchida, S. Aging effect on bioavailability of Mn, Co, Zn and Tc in Japanese agricultural soils under waterlogged conditions. Geoderma 1998, 84, 3–13. [Google Scholar] [CrossRef]
- Buekers, J. Fixation of Cadmium, Copper, Nickel and Zinc in Soil: Kinetics, Mechanisms and Its Effect on Metal Bioavailability. Ph.D. Thesis, Faculteit Bio-ingenieurswetenschappen, Katholieke Universiteit Lueven, Leuven, Belgium, 2007. [Google Scholar]
- López-García, P.; Moreira, D. Tracking microbial biodiversity through molecular and genomic ecology. Res. Microbiol. 2008, 159, 67–73. [Google Scholar] [CrossRef] [PubMed]
- Ma, Y.; Lombi, E.; McLaughlin, M.J.; Oliver, I.W.; Nolan, A.L.; Oorts, K.; Smolders, E. Aging of nickel added to soils as predicted by soil pH and time. Chemosphere 2013, 92, 962–968. [Google Scholar] [CrossRef] [PubMed]
- Lock, K.; Janssen, C. Ecotoxicity of chromium (III) to Eisenia fetida, Enchytraeus albidus, and Folsomia candida. Ecotoxicol. Environ. Saf. 2002, 51, 203–205. [Google Scholar] [CrossRef] [PubMed]
- Lock, K.; Janssen, C.R. Influence of Aging on Metal Availability in Soils, Reviews of Environmental Contamination and Toxicology; Springer: Berlin, Germany, 2003; pp. 1–21. [Google Scholar]
- De Silva, S.; Ball, A.S.; Huynh, T.; Reichman, S.M. Metal accumulation in roadside soil in Melbourne, Australia: Effect of road age, traffic density and vehicular speed. Environ. Pollut. 2016, 208, 102–109. [Google Scholar] [CrossRef]
- De Silva, S.; Ball, A.S.; Indrapala, D.V.; Reichman, S.M. Review of the interactions between vehicular emitted potentially toxic elements, roadside soils, and associated biota. Chemosphere 2020. [Google Scholar] [CrossRef]
- Isbell, R. The Australian Soil Classification; CSIRO Publishing: Clayton, Australia, 2016; pp. 11–41. [Google Scholar]
- Price, R.C.; Gray, C.M.; Frey, F.A. Strontium isotopic and trace element heterogeneity in the plains basalts of the Newer Volcanic Province, Victoria, Australia. Geochim. Cosmochim. Acta 1997, 61, 171–192. [Google Scholar] [CrossRef]
- Werkenthin, M.; Kluge, B.; Wessolek, G. Metals in European roadside soils and soil solution—A review. Environ. Pollut. 2014, 189, 98–110. [Google Scholar] [CrossRef]
- Reichman, S.M. Probing the plant growth-promoting and heavy metal tolerance characteristics of Bradyrhizobium japonicum CB1809. Eur. J. Soil Boil. 2014, 63, 7–13. [Google Scholar] [CrossRef]
- Houba, V.; Temminghoff, E.; Gaikhorst, G.; Van Vark, W. Soil analysis procedures using 0.01 M calcium chloride as extraction reagent. Commun. Soil Sci. Plant Anal. 2000, 31, 1299–1396. [Google Scholar] [CrossRef]
- Rayment, G.E.; Higginson, F.R. Australian Laboratory Handbook of Soil and Water Chemical Methods; Inkata Press: Melbourne, Australia, 1992. [Google Scholar]
- Zhang, H.; Davison, W.; Knight, B.; McGrath, S. In situ measurements of solution concentrations and fluxes of trace metals in soils using DGT. Environ. Sci. Technol. 1998, 32, 704–710. [Google Scholar] [CrossRef]
- Huynh, T.T.; Laidlaw, W.S.; Singh, B.; Zhang, H.; Baker, A.J. Effect of plants on the bioavailability of metals and other chemical properties of biosolids in a column study. Int. J. Phytoremediat. 2012, 14, 878–893. [Google Scholar] [CrossRef]
- van der Ent, A.; Echevarria, G.; Tibbett, M. Delimiting soil chemistry thresholds for nickel hyperaccumulator plants in Sabah (Malaysia). Chemoecology 2016, 26, 67–82. [Google Scholar] [CrossRef]
- Brümmer, G.W.; Gerth, J.; Herms, U. Heavy metal species, mobility and availability in soils. J. Plant Nutr. Soil Sci. 1986, 149, 382–398. [Google Scholar]
- Rodríguez-Flores, M.; Rodríguez-Castellón, E. Lead and cadmium levels in soil and plants near highways and their correlation with traffic density. Environ. Pollut. Ser. B Chem. Phys. 1982, 4, 281–290. [Google Scholar] [CrossRef]
- Zhang, H.; Lombi, E.; Smolders, E.; McGrath, S. Kinetics of Zn Release in Soils and Prediction of Zn Concentration in Plants Using Diffusive Gradients in Thin Films. Environ. Sci. Technol. 2004, 38, 3608–3613. [Google Scholar] [CrossRef]
- Menzies, N.W.; Donn, M.J.; Kopittke, P.M. Evaluation of extractants for estimation of the phytoavailable trace metals in soils. Environ. Pollut. 2007, 145, 121–130. [Google Scholar] [CrossRef] [Green Version]
- Smolders, E.; Oorts, K.; Van Sprang, P.; Schoeters, I.; Janssen, C.R.; McGrath, S.P.; McLaughlin, M.J. Toxicity of trace metals in soil as affected by soil type and aging after contamination: Using calibrated bioavailability models to set ecological soil standards. Environ. Toxicol. Chem. Int. J. 2009, 28, 1633–1642. [Google Scholar] [CrossRef]
- Yao, Y.; Watanabe, T.; Yano, T.; Iseda, T.; Sakamoto, O.; Iwamoto, M.; Inoue, S. An innovative energy-saving in-flight melting technology and its application to glass production. Sci. Technol. Adv. Mater. 2008, 2, 025013. [Google Scholar] [CrossRef] [PubMed] [Green Version]
- Nolan, A.L.; Zhang, H.; McLaughlin, M.J. Prediction of zinc, cadmium, lead, and copper availability to wheat in contaminated soils using chemical speciation, diffusive gradients in thin films, extraction, and isotopic dilution techniques. J. Environ. Qual. 2005, 34, 496–507. [Google Scholar] [CrossRef] [PubMed]
- Maricq, M.M.; Chase, R.E.; Xu, N.; Podsiadlik, D.H. The effects of the catalytic converter and fuel sulfur level on motor vehicle particulate matter emissions: Gasoline vehicles. Environ. Sci. Technol. 2002, 36, 276–282. [Google Scholar] [CrossRef]
- Maiz, I.; Esnaola, M.V.; Millan, E. Evaluation of heavy metal availability in contaminated soils by a short sequential extraction procedure. Sci. Total Environ. 1997, 206, 107–115. [Google Scholar] [CrossRef]
- Temminghoff, E.J.M.; Van der Zee, S.E.; de Haan, F.A.M. Copper mobility in a copper-contaminated sandy soil as affected by pH and solid and dissolved organic matter. Environ. Sci. Technol. 1997, 31, 1109–1115. [Google Scholar] [CrossRef]
Figure 1.
The relationship between roadside soil metal dissociation time Tc (seconds) and the age of the adjacent roads representing soil exposure to vehicular emissions (years). R2 = linear correlation. Please note that in total 9 data points are included for each element, although some points overlap and are not visible.


Table 1.
Soil characteristics for roadside soils in western Melbourne, Australia, on Newer Volcanic parent material; values are mean ± standard error (n = 3). Soils were collected from new (N = 1.5–5 years), medium (M = 5–10 years) and old (O ≥ 15 years) roads. Numbers in a column with the same letter are not significantly different (p > 0.05).
| Site | pH | Pc (g/cm3) | TOC (C% dry Soil) | EC (mS/cm) | ECEC (meq/100 g) |
|---|---|---|---|---|---|
| Control | 5.2 ± <0.1 a | 1.6 ± <0.1 a | 1.8 ± 0.1 a | 48 ± 4 a | 8 ± 2 a |
| New | 8.2 ± 0.1 b | 1.6 ± 0.3 a | 1.8 ± 0.4 a | 174 ± 37 b | 31 ± 3 a |
| Medium | 6.2 ± 0.2 ab | 1.4 ± 0.4 a | 1.9 ± 0.5 a | 225 ± 39 b | 25 ± 3 a |
| Old | 6.3 ± 0.5 ab | 1.6 ± <0.1 a | 3.5 ± 0.7 b | 162 ± 15 b | 22 ± 2 a |
Pc = soil particle concentration determined using Equation (3); EC = electrical conductivity, TOC = total organic carbon, ECEC = effective cation exchange capacity. Values are means (n = 3), ± standard error, a, b, c, denotes the significance between the sites at p < 0.05.
Table 2.
Metal concentrations (Cd, Cu, Mn, Ni and Zn) in soil, wheat, DGT, CE, CSOL, CaCl2 extractable metals for soil and soil after the growth of wheat.
Table 2.
Metal concentrations (Cd, Cu, Mn, Ni and Zn) in soil, wheat, DGT, CE, CSOL, CaCl2 extractable metals for soil and soil after the growth of wheat.
| Metal | Type | Total (mg/kg) | µg/L | Plant (mg/kg DW) | R | |||
|---|---|---|---|---|---|---|---|---|
| CaCl2 | CSOL | CE | CDGT | |||||
| Cd | C | 0.05 ± 0.02 a | 0.22 ± 0.01 a | 0.004 ± <0.001 a | 0.02 ± 0.02 a | 0.002 ± 0.001 a | 0.02 ± 0.01 a | 0.41 ± 0.17 b |
| N | 0.07 ± 0.02 ab | 0.10 ± <0.01 a | 0.011 ± <0.001 a | 0.02 ± 0.01 a | 0.002 ± 0.001 a | 0.04 ± 0.03 ab | 0.09 ± 0.05 a | |
| M | 0.13 ± 0.01 b | 0.30 ± 0.032 a | 0.008 ± <0.001 a | 0.06 ± 0.02 a | 0.005 ± 0.000 a | 0.07 ± 0.01 b | 0.39 ± 0.09 b | |
| O | 0.21 ± 0.02 b | 0.16 ± <0.01 a | 0.027 ± 0.010 a | 0.07 ± 0.02 a | 0.006 ± 0.002 a | 0.01 ± 0.00 a | 0.11 ± 0.05 a | |
| Cu | C | 3.94 ± 0.45 a | 0.02 ± 0.01 a | 0.03 ± 0.006 a | 0.04 ± 0.01 a | 0.003 ± 0.001 a | 1.78 ± 0.00 a | 0.13 ± 0.01 a |
| N | 7.80 ± 0.98 b | 0.08 ± 0.03 ab | 0.04 ± 0.006 a | 0.03 ± 0.01 a | 0.002 ± 0.001 a | 1.87 ± 0.36 a | 0.05 ± 0.01 a | |
| M | 8.96 ± 1.16 b | 0.17 ± 0.12 b | 0.06 ± 0.02 a | 0.10 ± 0.03 b | 0.009 ± 0.003 ab | 2.36 ± 1.18 a | 0.14 ± 0.02 a | |
| O | 8.65 ± 0.65 b | 0.06 ± 0.01 ab | 0.07 ± 0.02 a | 0.11 ± 0.05 b | 0.010 ± 0.004 b | 2.38 ± 1.00 a | 0.13 ± 0.02 a | |
| Mn | C | 55 ± 12 a | 0.02 ± 0.01 a | 0.53 ± 0.11 a | 2.10 ± 0.07 a | 0.21 ± 0.01 a | 14.37 ± 9.79 a | 0.42 ± 0.08 a |
| N | 599 ± 26 c | 0.01 ± 0.004 a | 0.21 ± 0.07 a | 1.29 ± 0.58 a | 0.12 ± 0.06 a | 52.88 ± 2.88 b | 0.53 ± 0.10 a | |
| M | 323 ± 117 b | 0.03 ± 0.03 a | 0.37 ± 0.02 a | 2.28 ± 0.37 a | 0.20 ± 0.04 a | 71.50 ± 16.2 b | 0.53 ± 0.08 a | |
| O | 171 ± 54 b | 0.06 ± 0.002 a | 0.80 ± 0.26 b | 3.32 ± 0.11 a | 0.27 ± 0.01 a | 59.84 ± 7.94 b | 0.54 ± 0.07 a | |
| Ni | C | 4.3 ± 1.20 a | 0.14 ± 0.03 a | 0.016 ± 0.006 a | 0.069 ± 0.02 a | 0.006 ± 0.001 a | 2.70 ± 0.61 a | 0.25 ± 0.06 a |
| N | 16.6 ± 5.7 b | 0.07 ± 0.01 a | 0.054 ± 0.011 a | 0.065 ± 0.005 a | 0.006 ± 0.001 a | 10.5 ± 4.98 b | 0.12 ± 0.01 a | |
| M | 19.0 ± 3.9 b | 0.15 ± 0.05 a | 0.053 ± 0.005 a | 0.118 ± 0.019 a | 0.011 ± 0.001 b | 9.09 ± 0.43 b | 0.21 ± 0.01 a | |
| O | 14.5 ± 1.1 b | 0.13 ± 0.03 a | 0.058 ± 0.012 a | 0.106 ± 0.016 a | 0.010 ± 0.001 b | 10.81 ± 2.31 b | 0.18 ± 0.01 a | |
| Zn | C | 8.4 ± 1.8 a | 2.20 ± 0.69 a | 0.04 ± 0.301 a | 0.36 ± 0.06 a | 0.034 ± 0.006 a | 06.30± 1.74 a | 0.20 ± 0.08 a |
| N | 25.7 ± 6.7 b | 1.48 ± 0.48 a | 1.14 ± 0.115 b | 0.21 ± 0.03 a | 0.02 ± 0.003 a | 24.66 ± 1.91 b | 0.02 ± 0.00 a | |
| M | 38.6 ± 3.9 b | 2.97 ± 0.32 a | 0.43 ± 0.301 ab | 0.38 ± 0.06 a | 0.036 ± 0.005 a | 25.34 ± 2.51 b | 0.19 ± 0.07 a | |
| O | 45.2 ± 1.4 b | 2.10 ± 0.87 a | 1.02 ± 0.004 b | 0.54 ± 0.16 a | 0.052 ± 0.015 a | 28.47 ± 1.73 b | 0.05 ± 0.02 a | |
DGT = Diffusive gradients in thin film, CE = effective concentration, CSOL = pore water metal concentrations, CaCl2 extractable = available metals, R = ratio of CDGT and CSOL, C = soil not exposed to vehicular emissions (control), N = new aged roads (2–5 years), M = medium aged roads (5–10 years) and O = old aged roads (≥15 years). Values are means (n = 3), ± standard error, a, b, c, denotes the significance between the sites at p < 0.05.
Table 3.
Pearson correlation coefficients (r) between metal concentrations in wheat tissues, soil physiochemical properties and extractable metals measured by different methods in soil. Statistically significant values (p < 0.05) are in bold font.
Table 3.
Pearson correlation coefficients (r) between metal concentrations in wheat tissues, soil physiochemical properties and extractable metals measured by different methods in soil. Statistically significant values (p < 0.05) are in bold font.
| Metal | Variable | CDGT | CSOL | R | Wheat | Soil | CE | CaCl2 | pH | TOC |
|---|---|---|---|---|---|---|---|---|---|---|
| Cd | CSOL | 0.54 * | 1 | |||||||
| R | 0.27 | −0.27 | 1 | |||||||
| Wheat | 0.27 | 0.02 | 0.37 | 1 | ||||||
| Soil | 0.41 | 0.55 * | −0.27 | 0.48 * | 1 | |||||
| CE | 0.99 *** | 0.55 * | 0.26 | 0.25 | 0.39 | 1 | ||||
| CaCl2 | 0.22 | −0.46 | 0.48 | 0.10 | −0.34 | 0.21 | 1 | |||
| pH | 0.06 | 0.26 | −0.57 * | 0.22 | 0.57 * | 0.04 | −0.20 | 1 | ||
| TOC | 0.18 | 0.23 | −0.14 | −0.44 | 0.01 | 0.20 | −0.09 | −0.20 | 1 | |
| TC | −0.23 | 0.10 | −0.25 | 0.32 | 0.58 ** | −0.25 | −0.17 | 0.63 ** | −0.08 | |
| Cu | CSOL | 0.90 *** | 1 | |||||||
| R | 0.66 ** | 0.33 | 1 | |||||||
| Wheat | −0.44 | −0.53 * | −0.01 | 1 | ||||||
| Soil | 0.13 | 0.30 | −0.21 | 0.26 | 1 | |||||
| CE | 0.99 *** | −0.91 *** | 0.65 ** | −0.46 | 0.13 | 1 | ||||
| CaCl2 | 0.42 | 0.57 | 0.03 | −0.58 * | 0.25 | 0.45 | 1 | |||
| pH | −0.22 | 0.10 | −0.63 ** | 0.11 | 0.51 * | −0.22 | 0.04 | 1 | ||
| TOC | 0.30 | 0.2 | -0.02 | −0.23 | 0.27 | 0.31 | −0.03 | −0.20 | 1 | |
| TC | −0.32 | −0.21 | −0.55 * | 0.11 | −0.17 | −0.32 | 0.01 | 0.36 | −0.04 | |
| Mn | CSOL | 0.13 | 1 | |||||||
| R | 0.31 | 0.07 | 1 | |||||||
| Wheat | −0.15 | −0.54 * | −0.16 | 1 | ||||||
| Soil | −0.46 | −0.46 | 0.10 | 0.27 | 1 | |||||
| CE | 0.96 *** | −<0.01 | 0.26 | 0.04 | −0.50 | 1 | ||||
| CaCl2 | 0.09 | 0.27 | 0.07 | 0.05 | −0.10 | 0.13 | 1 | |||
| pH | −0.44 | −0.59 ** | 0.31 | 0.36 | 0.81 *** | −0.37 | −0.20 | 1 | ||
| TOC | 0.43 | −0.22 | −0.36 | 0.30 | −0.26 | 0.54 * | −0.009 | −0.20 | 1 | |
| TC | 0.17 | −0.15 | −0.91 *** | 0.13 | −0.34 | 0.31 | −0.34 | −0.25 | 0.70 ** | |
| Ni | CSOL | 0.56 * | 1 | |||||||
| R | 0.04 | −0.59 * | 1 | |||||||
| Wheat | 0.22 | 0.46 | −0.3 | 1 | ||||||
| Soil | 0.48 * | 0.67 ** | −0.2 | 0.75 *** | 1 | |||||
| CE | 0.99 *** | 0.52 * | 0.01 | 0.19 | 0.42 | 1 | ||||
| CaCl2 | 0.32 | −0.03 | 0.4 * | −0.33 | 0.13 | 0.30 | 1 | |||
| pH | −0.15 | 0.45 | −0.73 ** | 0.63 ** | 0.52 * | −0.19 | −0.52 * | 1 | ||
| TOC | 0.37 | 0.30 | 0.10 | −0.16 | −0.04 | 0.38 | 0.26 | −0.20 | 1 | |
| TC | −0.20 | 0.50 | −0.79 *** | 0.20 | 0.31 | −0.19 | −0.45 | 0.66 ** | −0.03 | |
| Zn | CSOL | 0.14 | 1 | |||||||
| R | −0.10 | −0.97 *** | 1 | |||||||
| Wheat | 0.13 | 0.48 * | −0.45 | 1 | ||||||
| Soil | 0.43 | 0.31 | −0.32 | 0.83 *** | 1 | |||||
| CE | 0.99 *** | 0.15 | −0.10 | 0.13 | 0.43 | 1 | ||||
| CaCl2 | −0.08 | −0.32 | 0.30 | 0.07 | 0.02 | −0.07 | 1 | |||
| pH | −0.48 | 0.55 * | −0.60 ** | 0.59 ** | 0.27 | −0.49 * | −0.21 | 1 | ||
| TOC | 0.82 *** | 0.42 | −0.34 | 0.35 | 0.50 * | 0.83 *** | −0.09 | −0.20 | 1 | |
| TC | −0.57 * | 0.46 | −0.53 * | 0.28 | −0.06 | −0.57 * | 0.02 | 0.81 *** | −0.33 |
*** Correlation is significant at the 0.001 level, ** Correlation is significant at the 0.01 level, * Correlation is significant at the 0.05 level, Wheat = metal concentrations in wheat shoots, Soil = total metal concentration in soil, R = CDGT/CSOL.
Table 4.
Optimised linear models for the relationship between metal concentration in wheat, and soil chemical and physical properties. Models were determined by stepwise regression using list wise forward selection (criteria of α = 0.05 for entry).
Table 4.
Optimised linear models for the relationship between metal concentration in wheat, and soil chemical and physical properties. Models were determined by stepwise regression using list wise forward selection (criteria of α = 0.05 for entry).
| Independent Variable | Model | R2 |
|---|---|---|
| Metal concentrations in wheat | Cd = No models were able to be developed | - |
| Cu = No models were able to be developed | - | |
| Mn (mg/kg) = 104 + 0.01 TOC (C% dry soil) − 0.9 road age (years) − 0.08 soil Mn (mg/kg) | 0.936 | |
| Ni (mg/kg) = −7.78 + 0.73 soil-Ni (mg/kg) + 0.37 soil moisture (%) | 0.936 | |
| Zn (mg/kg) = 16.5 + 0.32 soil-Zn (mg/kg) − 0.12 age (years) | 0.931 |
Publisher’s Note: MDPI stays neutral with regard to jurisdictional claims in published maps and institutional affiliations. |
© 2020 by the authors. Licensee MDPI, Basel, Switzerland. This article is an open access article distributed under the terms and conditions of the Creative Commons Attribution (CC BY) license (http://creativecommons.org/licenses/by/4.0/).
Share and Cite
MDPI and ACS Style
De Silva, S.; Huynh, T.; Ball, A.S.; Indrapala, D.V.; Reichman, S.M. Measuring Soil Metal Bioavailability in Roadside Soils of Different Ages. Environments 2020, 7, 91. https://0-doi-org.brum.beds.ac.uk/10.3390/environments7100091
AMA Style
De Silva S, Huynh T, Ball AS, Indrapala DV, Reichman SM. Measuring Soil Metal Bioavailability in Roadside Soils of Different Ages. Environments. 2020; 7(10):91. https://0-doi-org.brum.beds.ac.uk/10.3390/environments7100091
Chicago/Turabian StyleDe Silva, Shamali, Trang Huynh, Andrew S. Ball, Demidu V. Indrapala, and Suzie M. Reichman. 2020. "Measuring Soil Metal Bioavailability in Roadside Soils of Different Ages" Environments 7, no. 10: 91. https://0-doi-org.brum.beds.ac.uk/10.3390/environments7100091
Note that from the first issue of 2016, this journal uses article numbers instead of page numbers. See further details here.