
Accounting for DEM Error in Sea Level Rise Assessment within Riverine Regions; Case Study from the Shatt Al-Arab River Region


Abstract
:1. Introduction
- Develop an error propagation model to enhance the SRTM 1 Arc-Second Global elevation model for the region.
- Transfer parameters such as vegetation cover and slope for error modelling of the SRTM.
- Apply this model to identify areas that are potentially vulnerable to inundation in the SARR.
- Understand the impact of error on inundation models in low-lying coastal regions.
2. Data and Methods
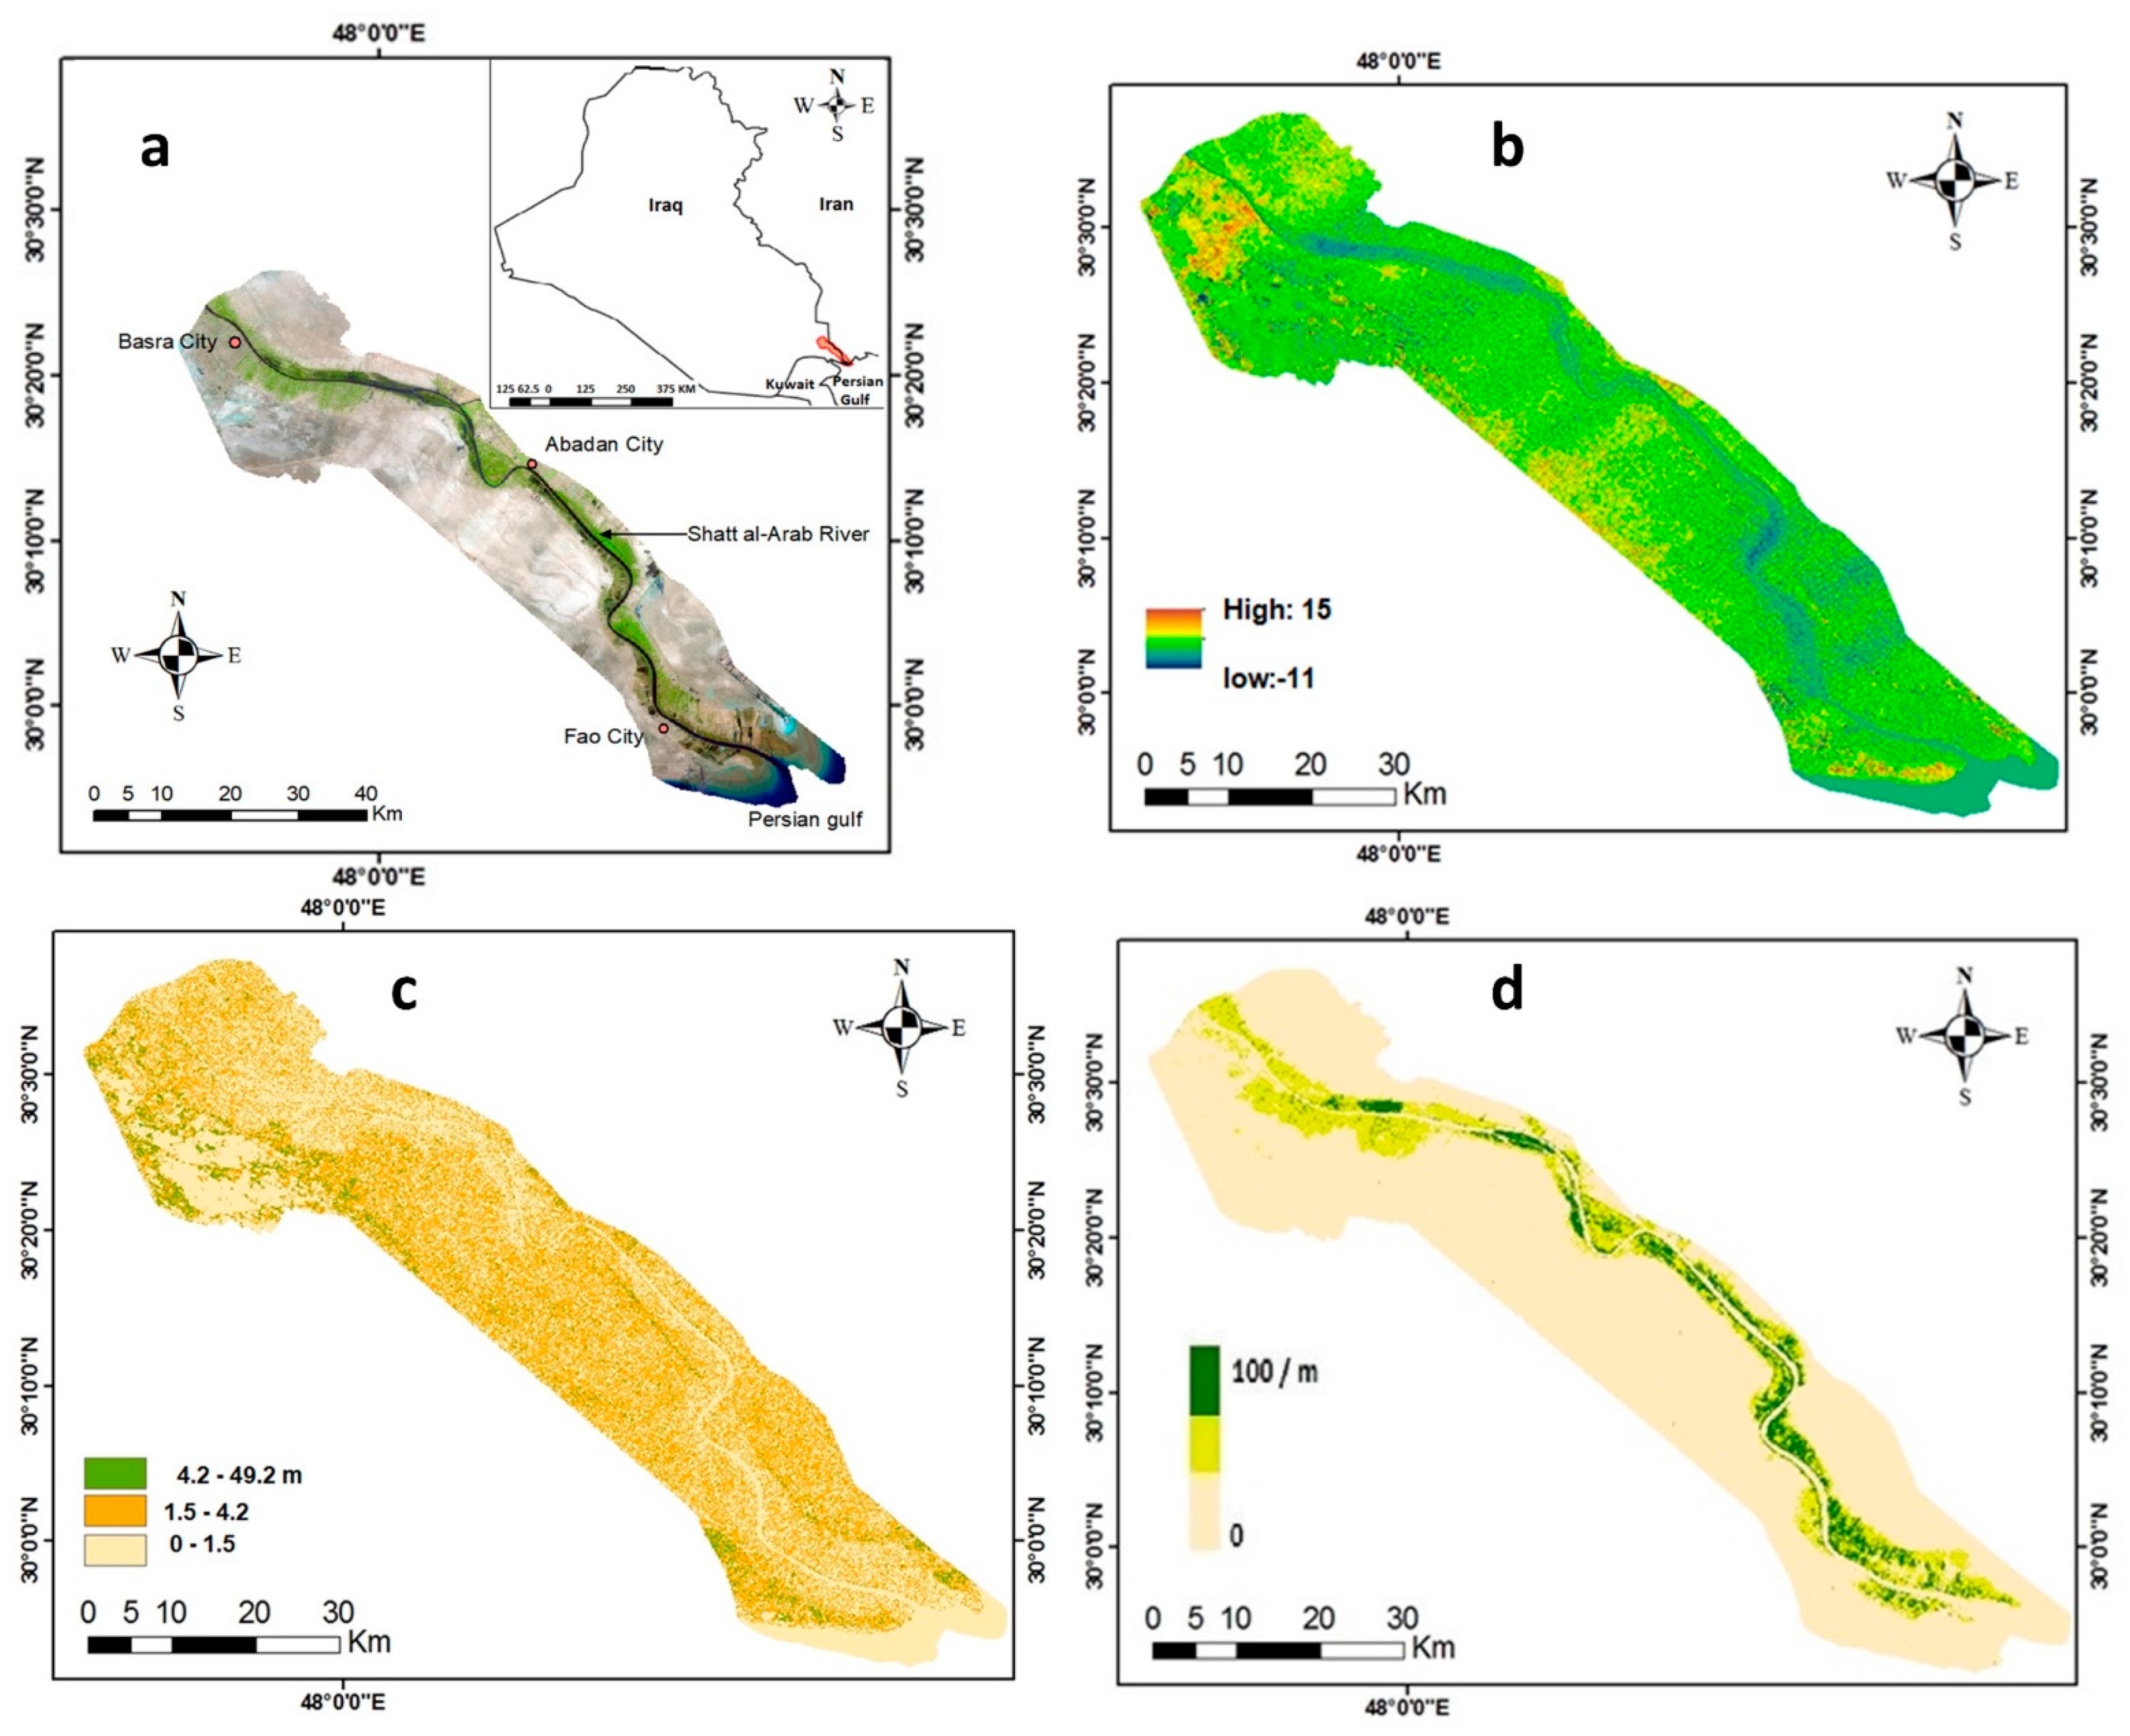
2.1. Study Area
2.2. SRTM 1 Arc-Second Global Coverage (30 m)
2.3. Vegetation Data
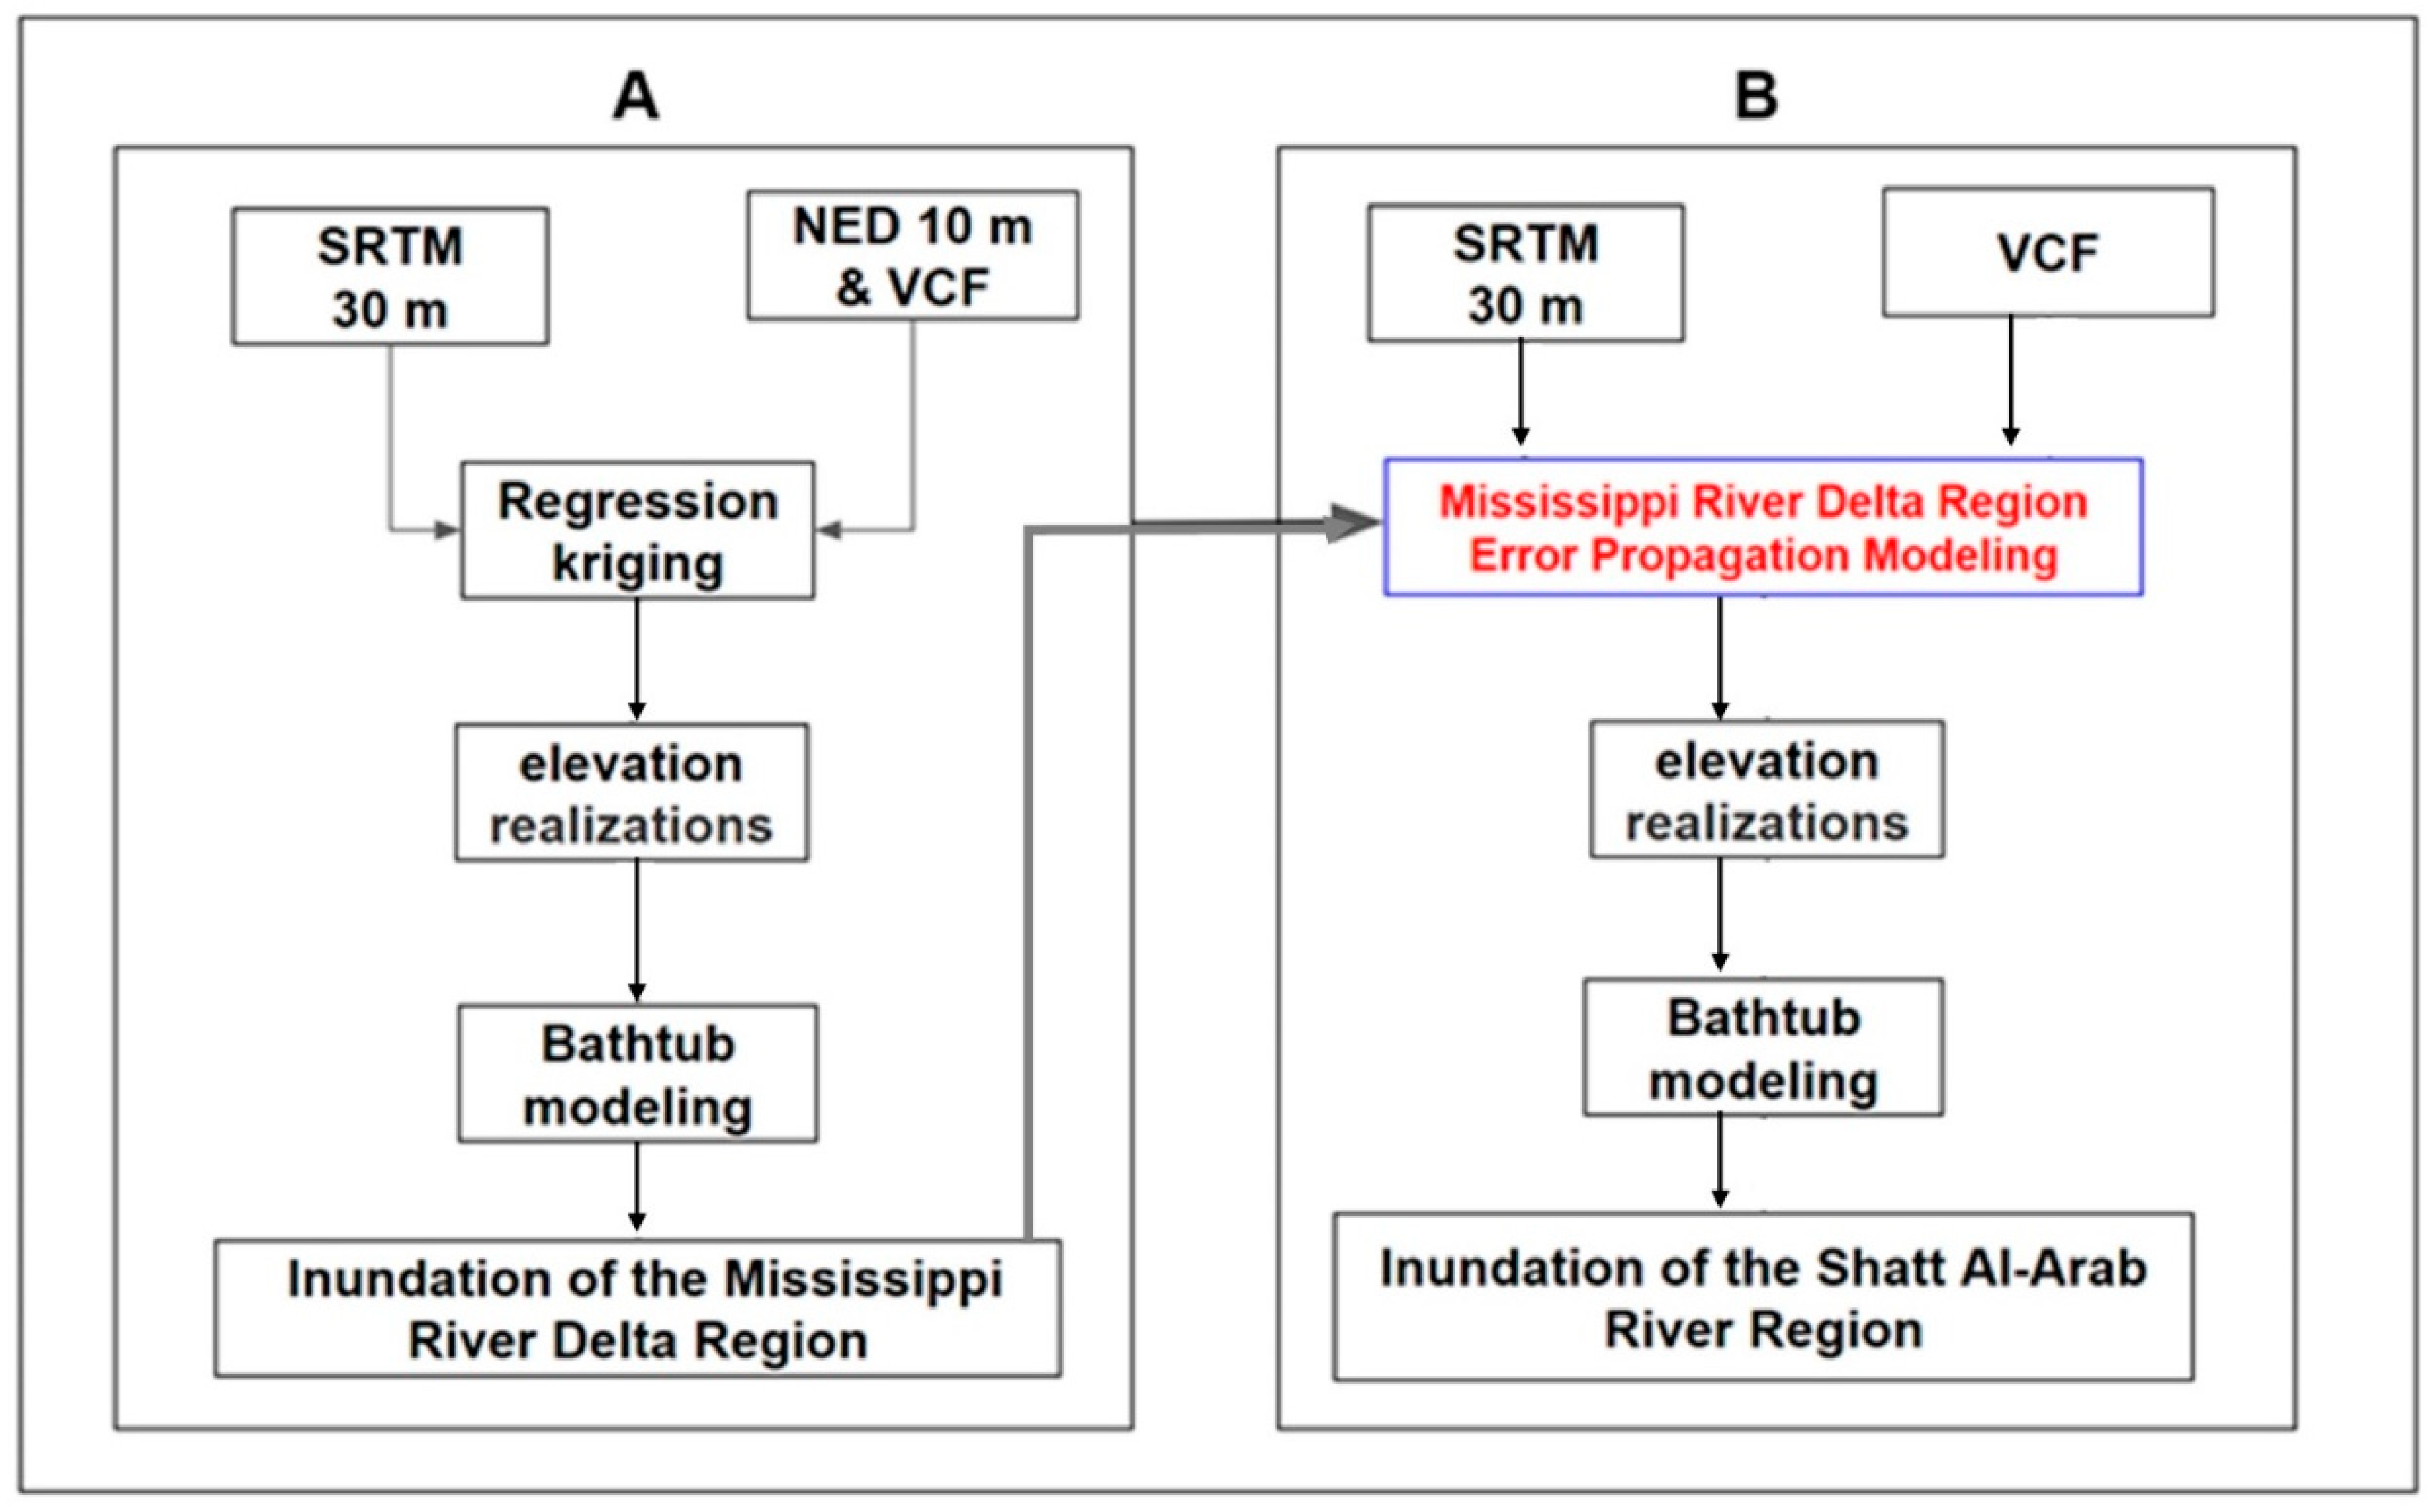
2.4. Methods
2.4.1. Monte Carlo Error Propagation
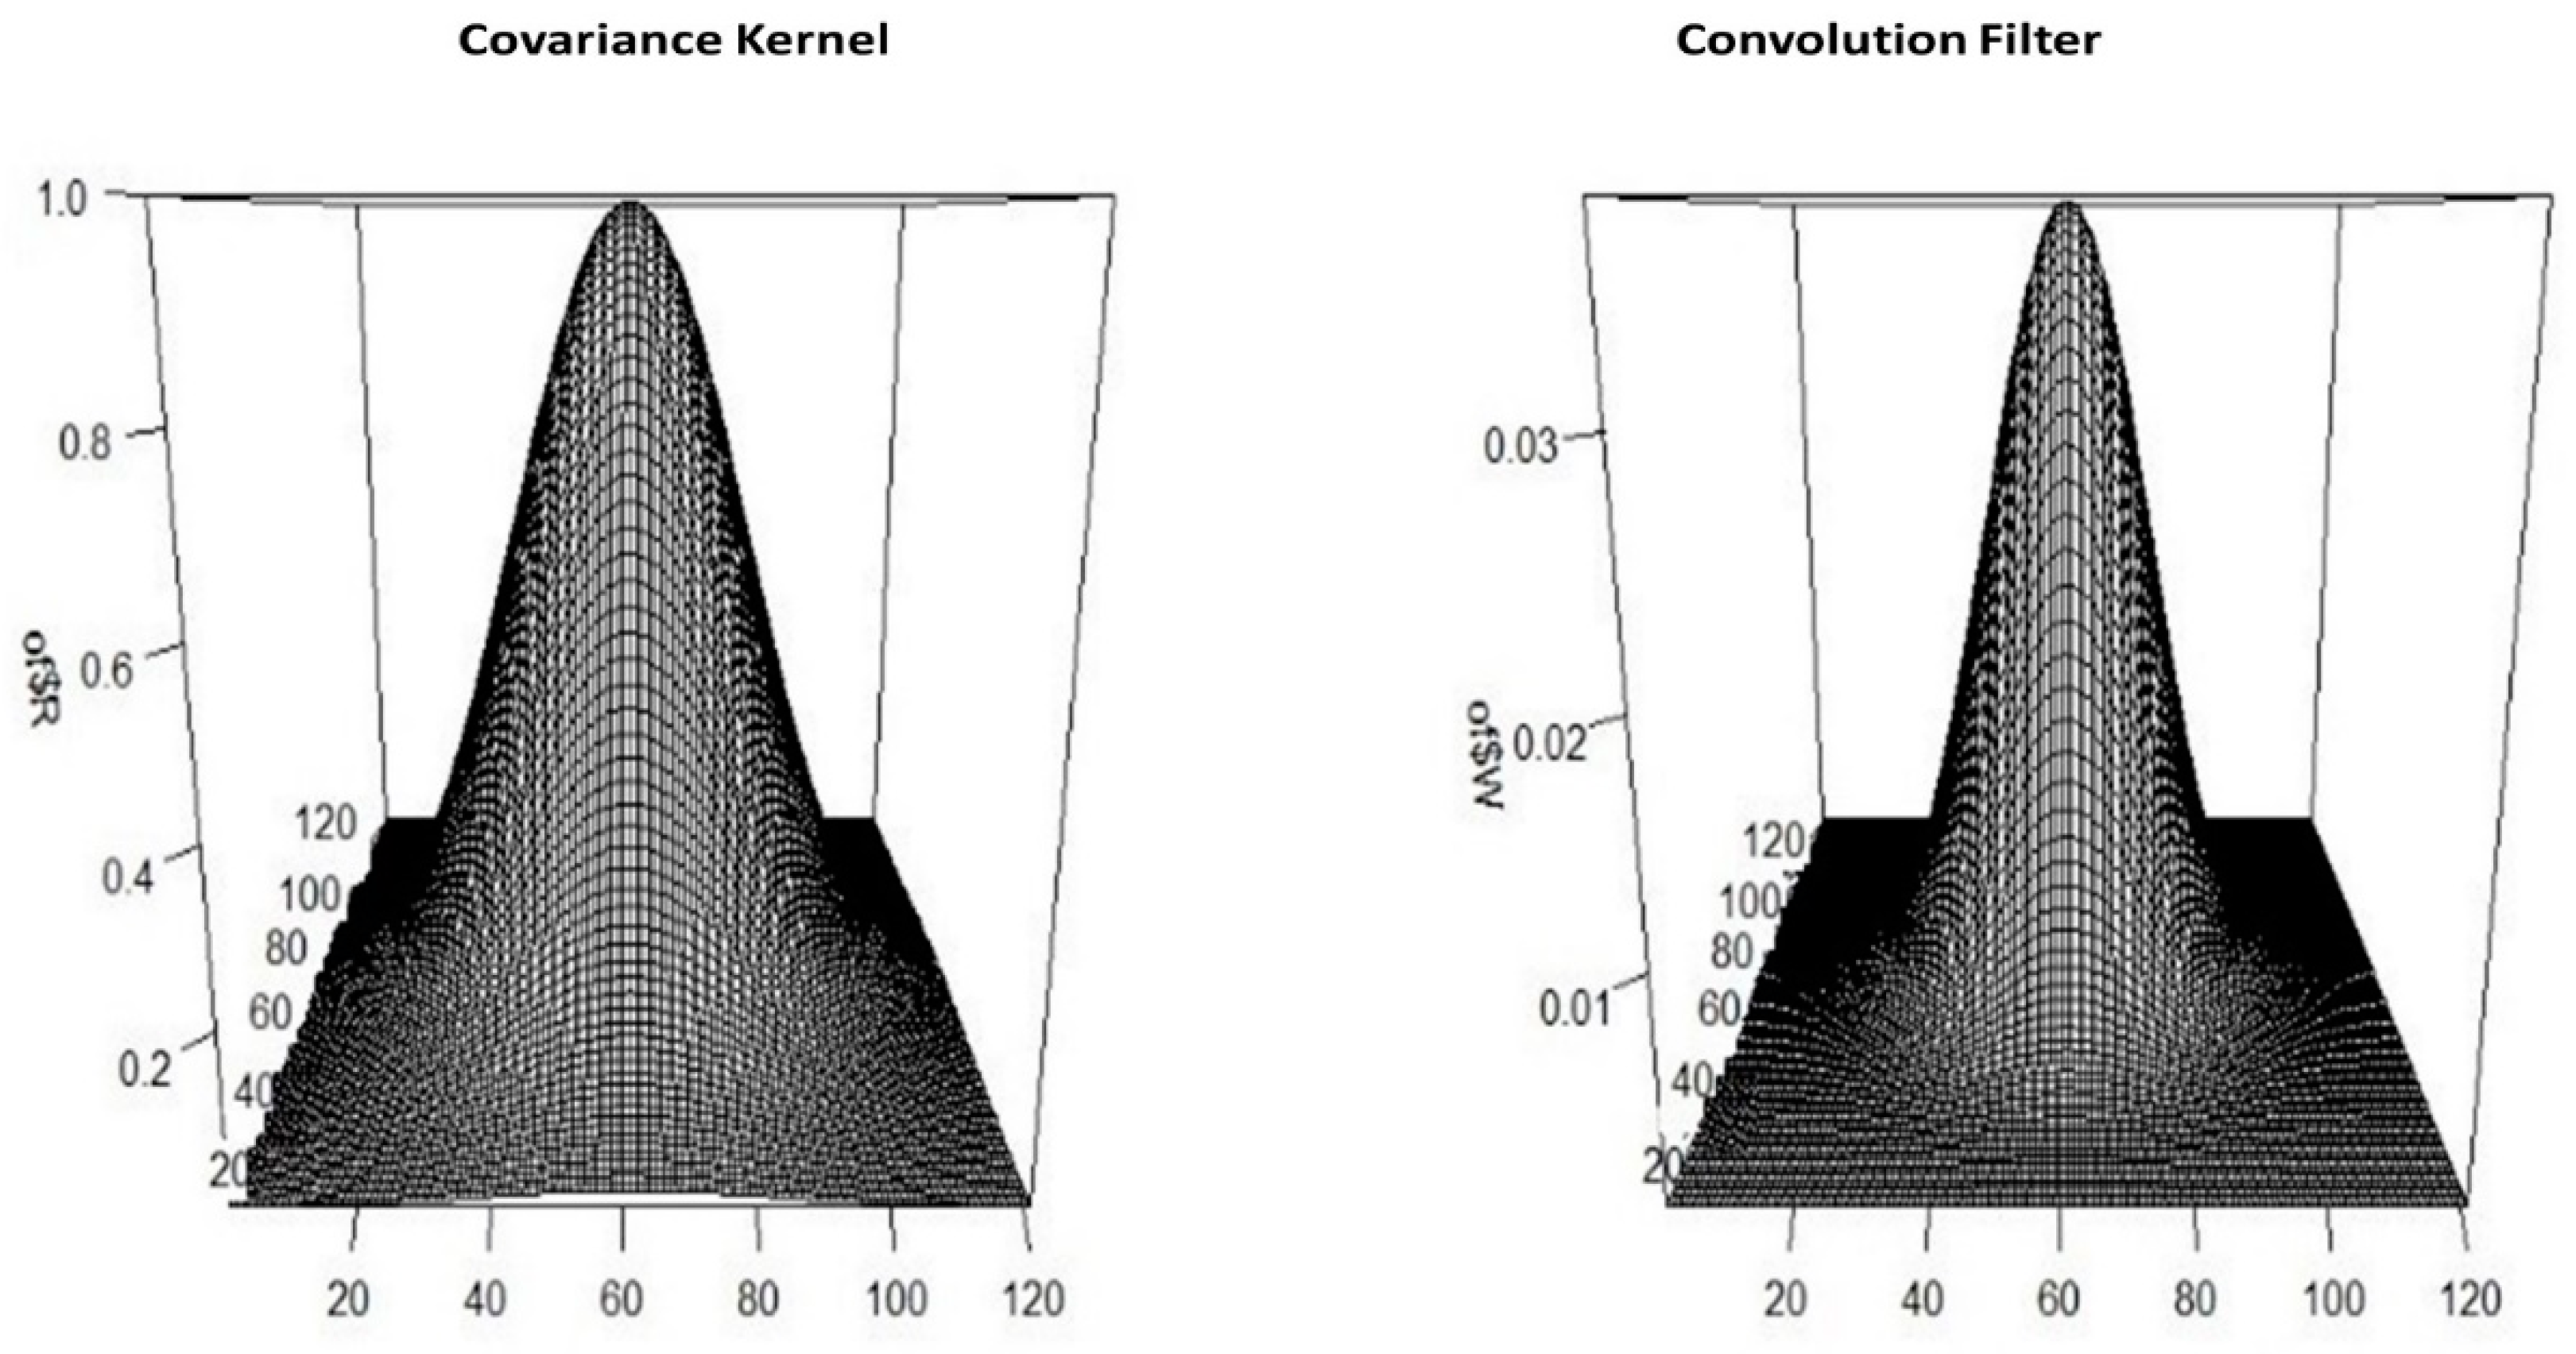
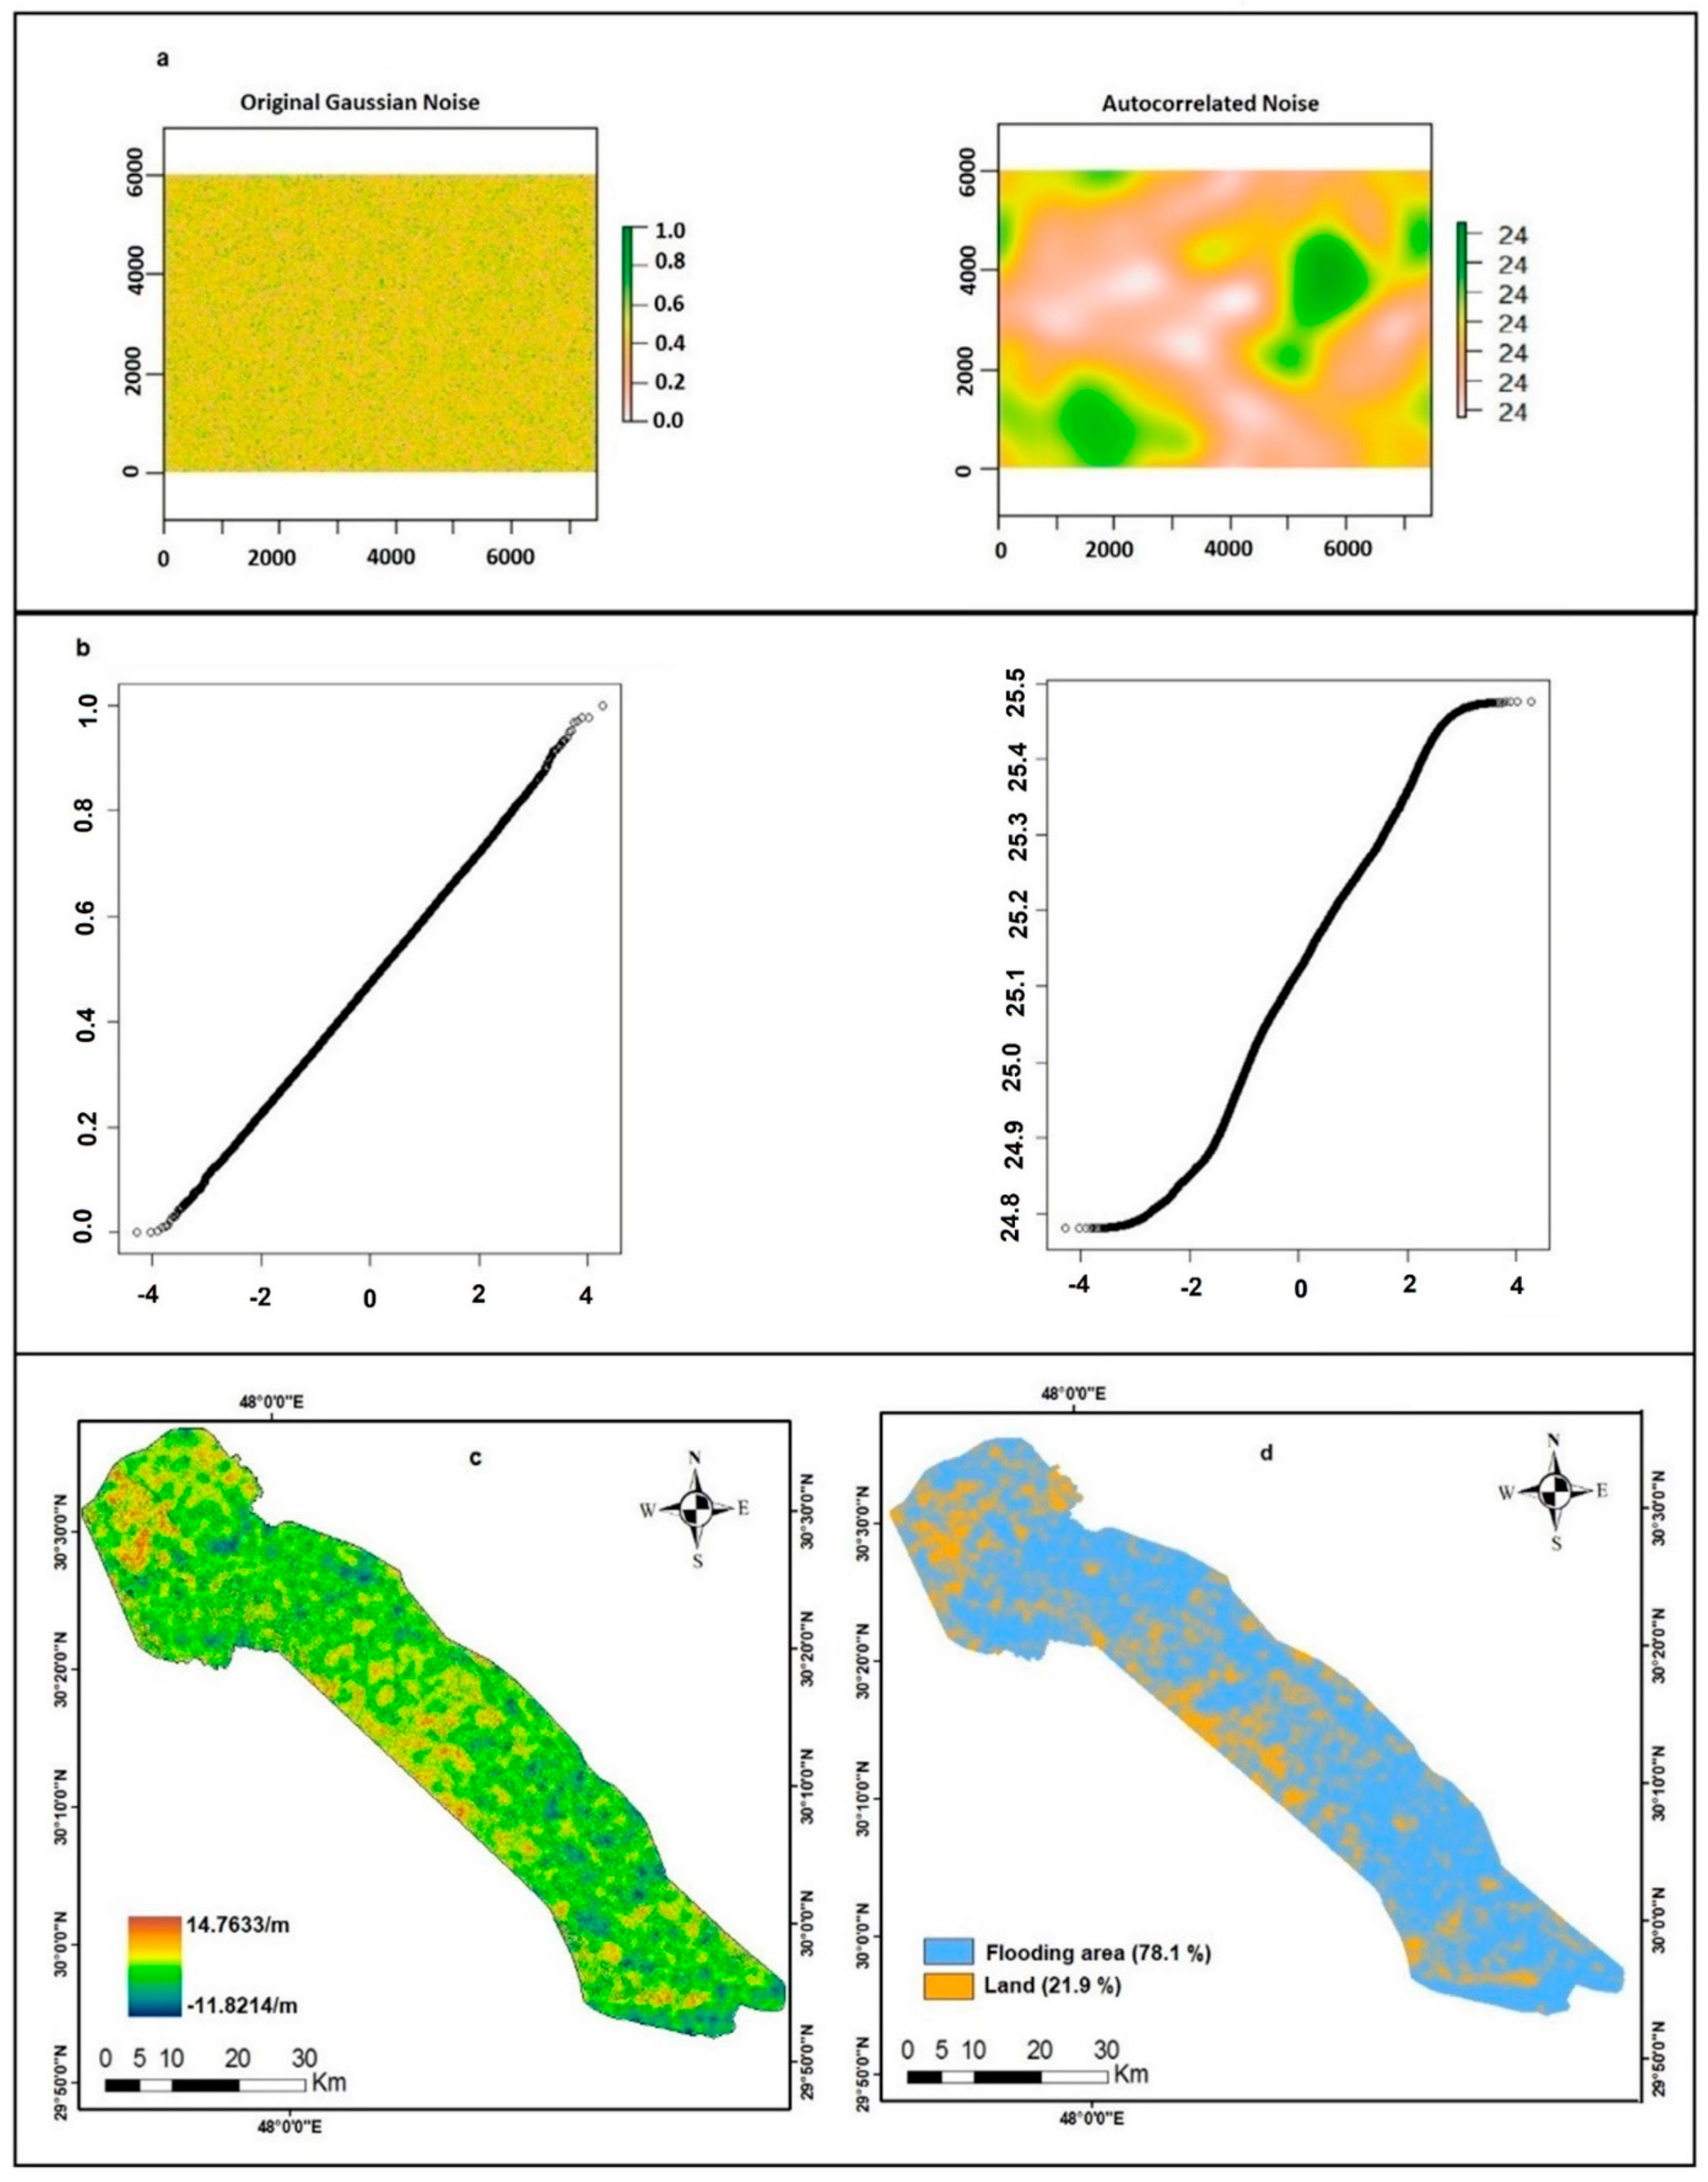
2.4.2. Unconditional Simulation with Convolution Filtering
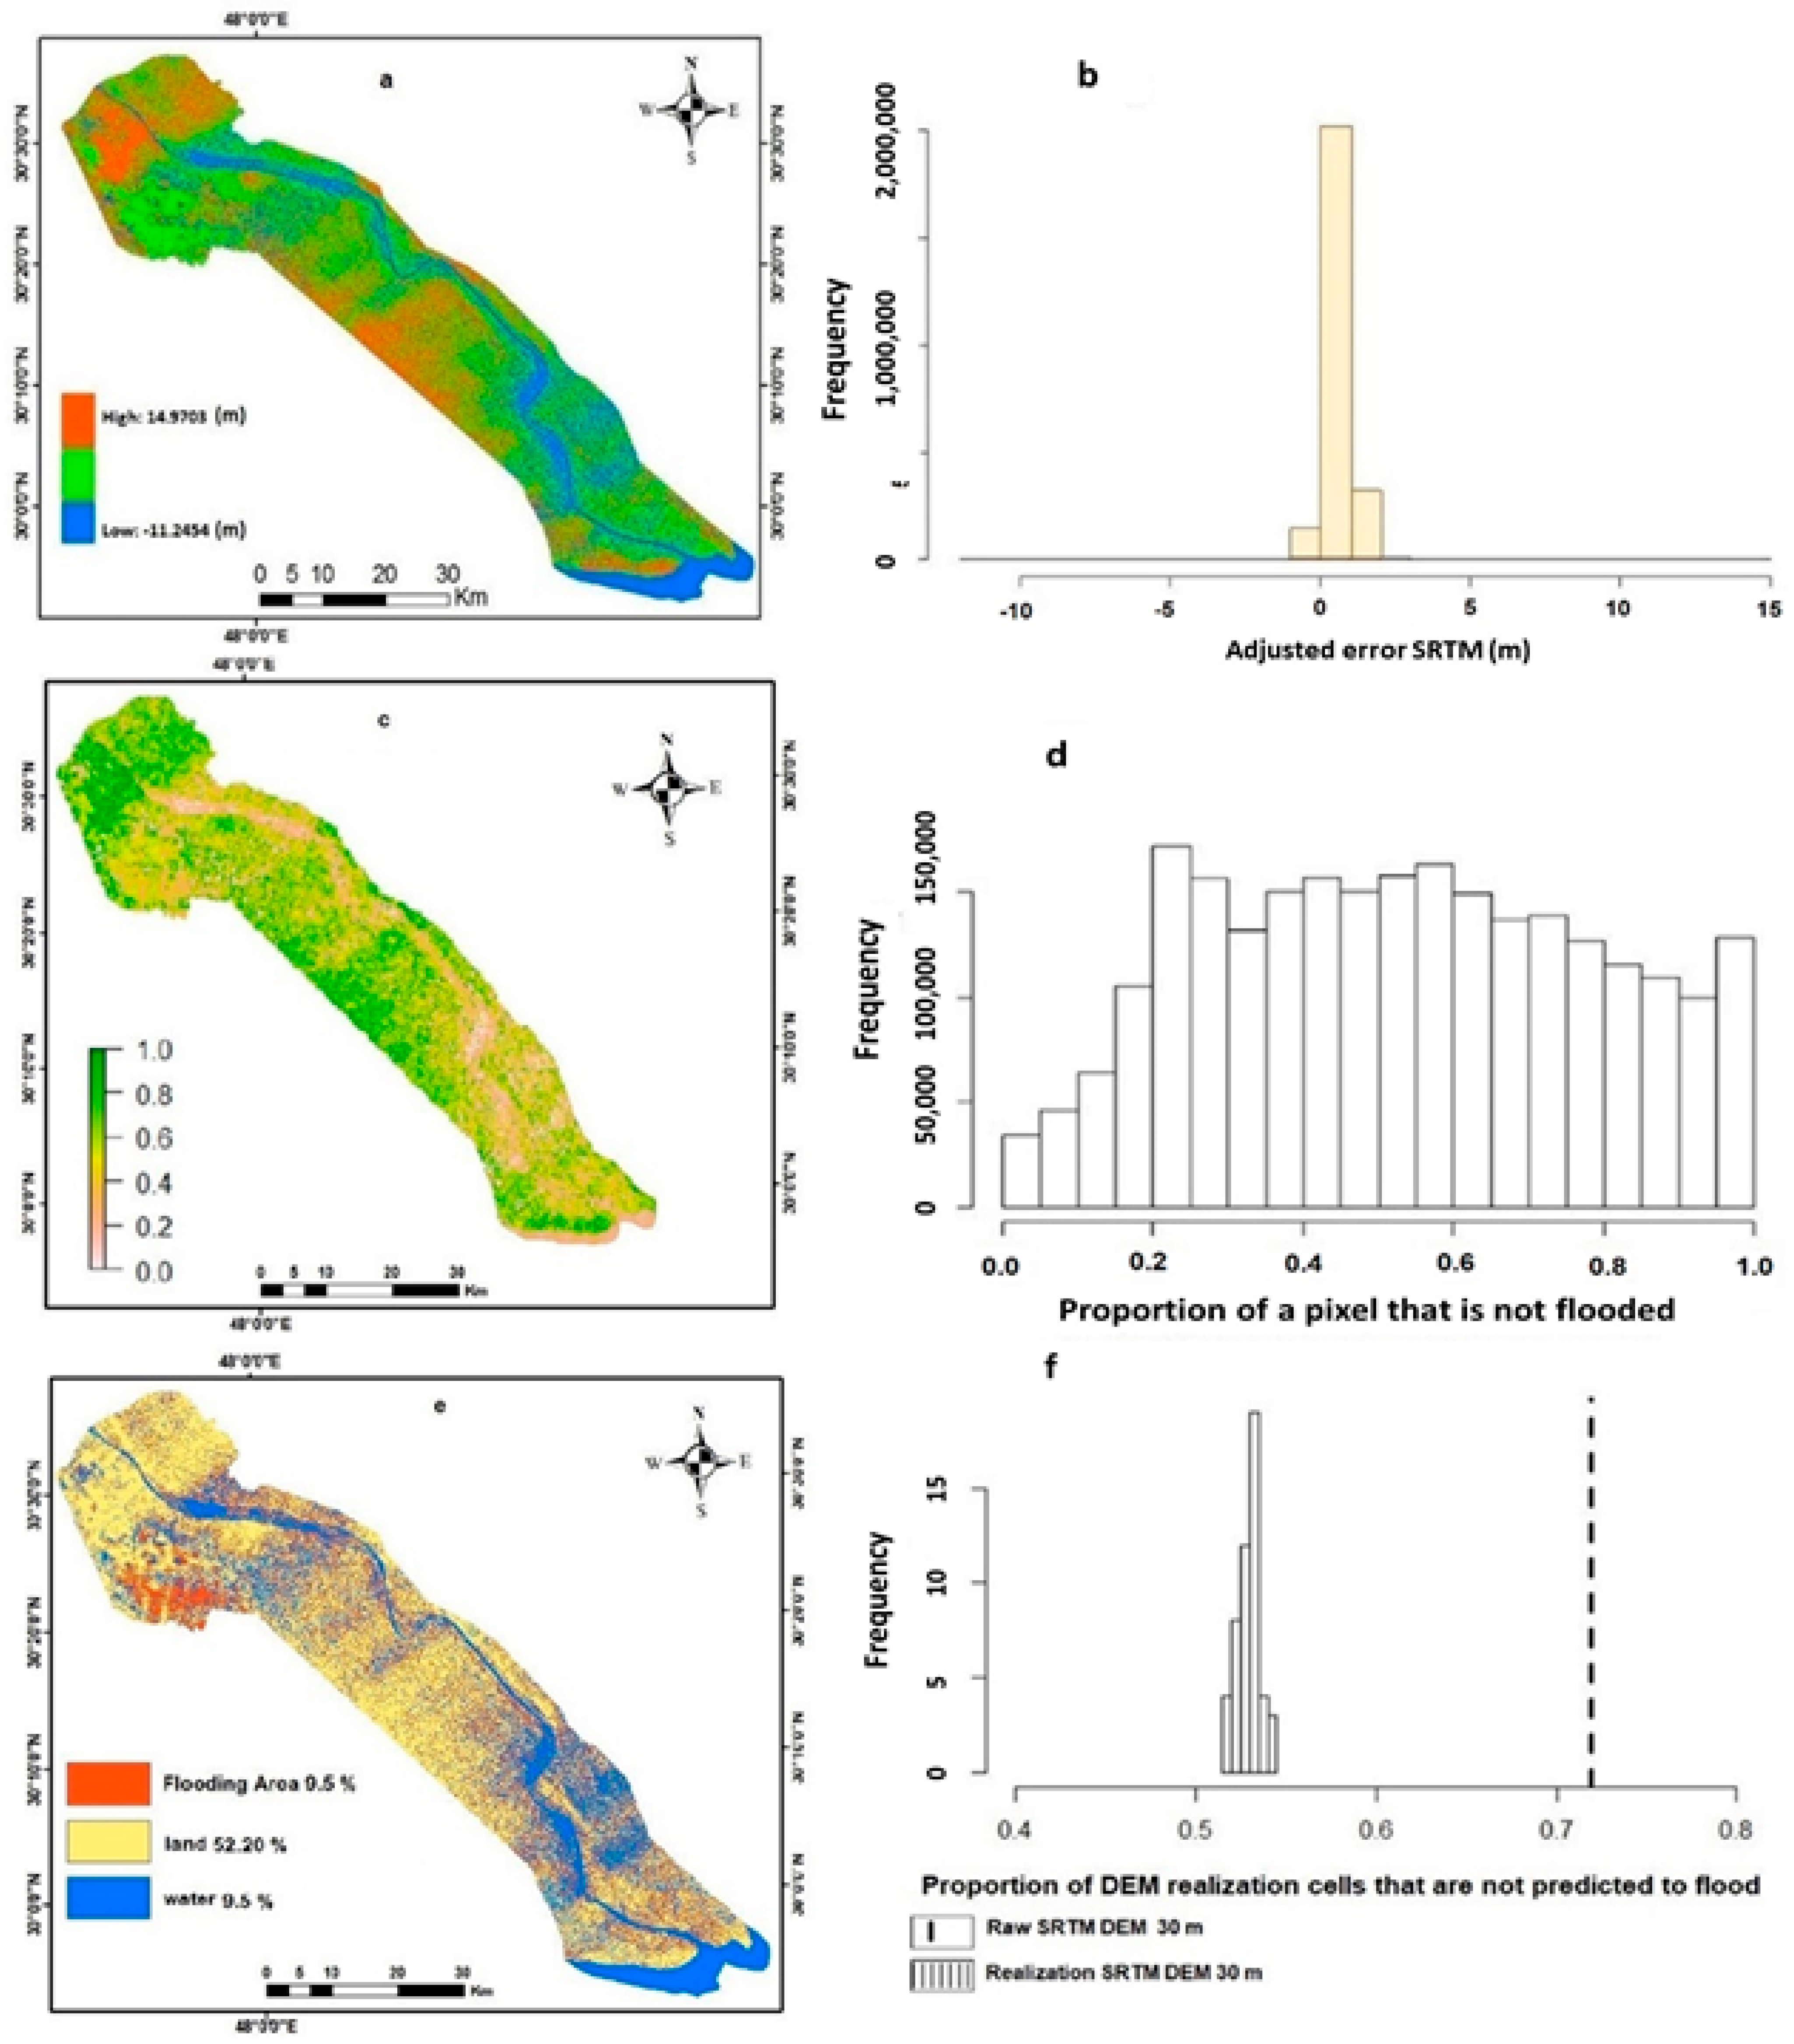
2.4.3. Inundation Modelling
3. Results
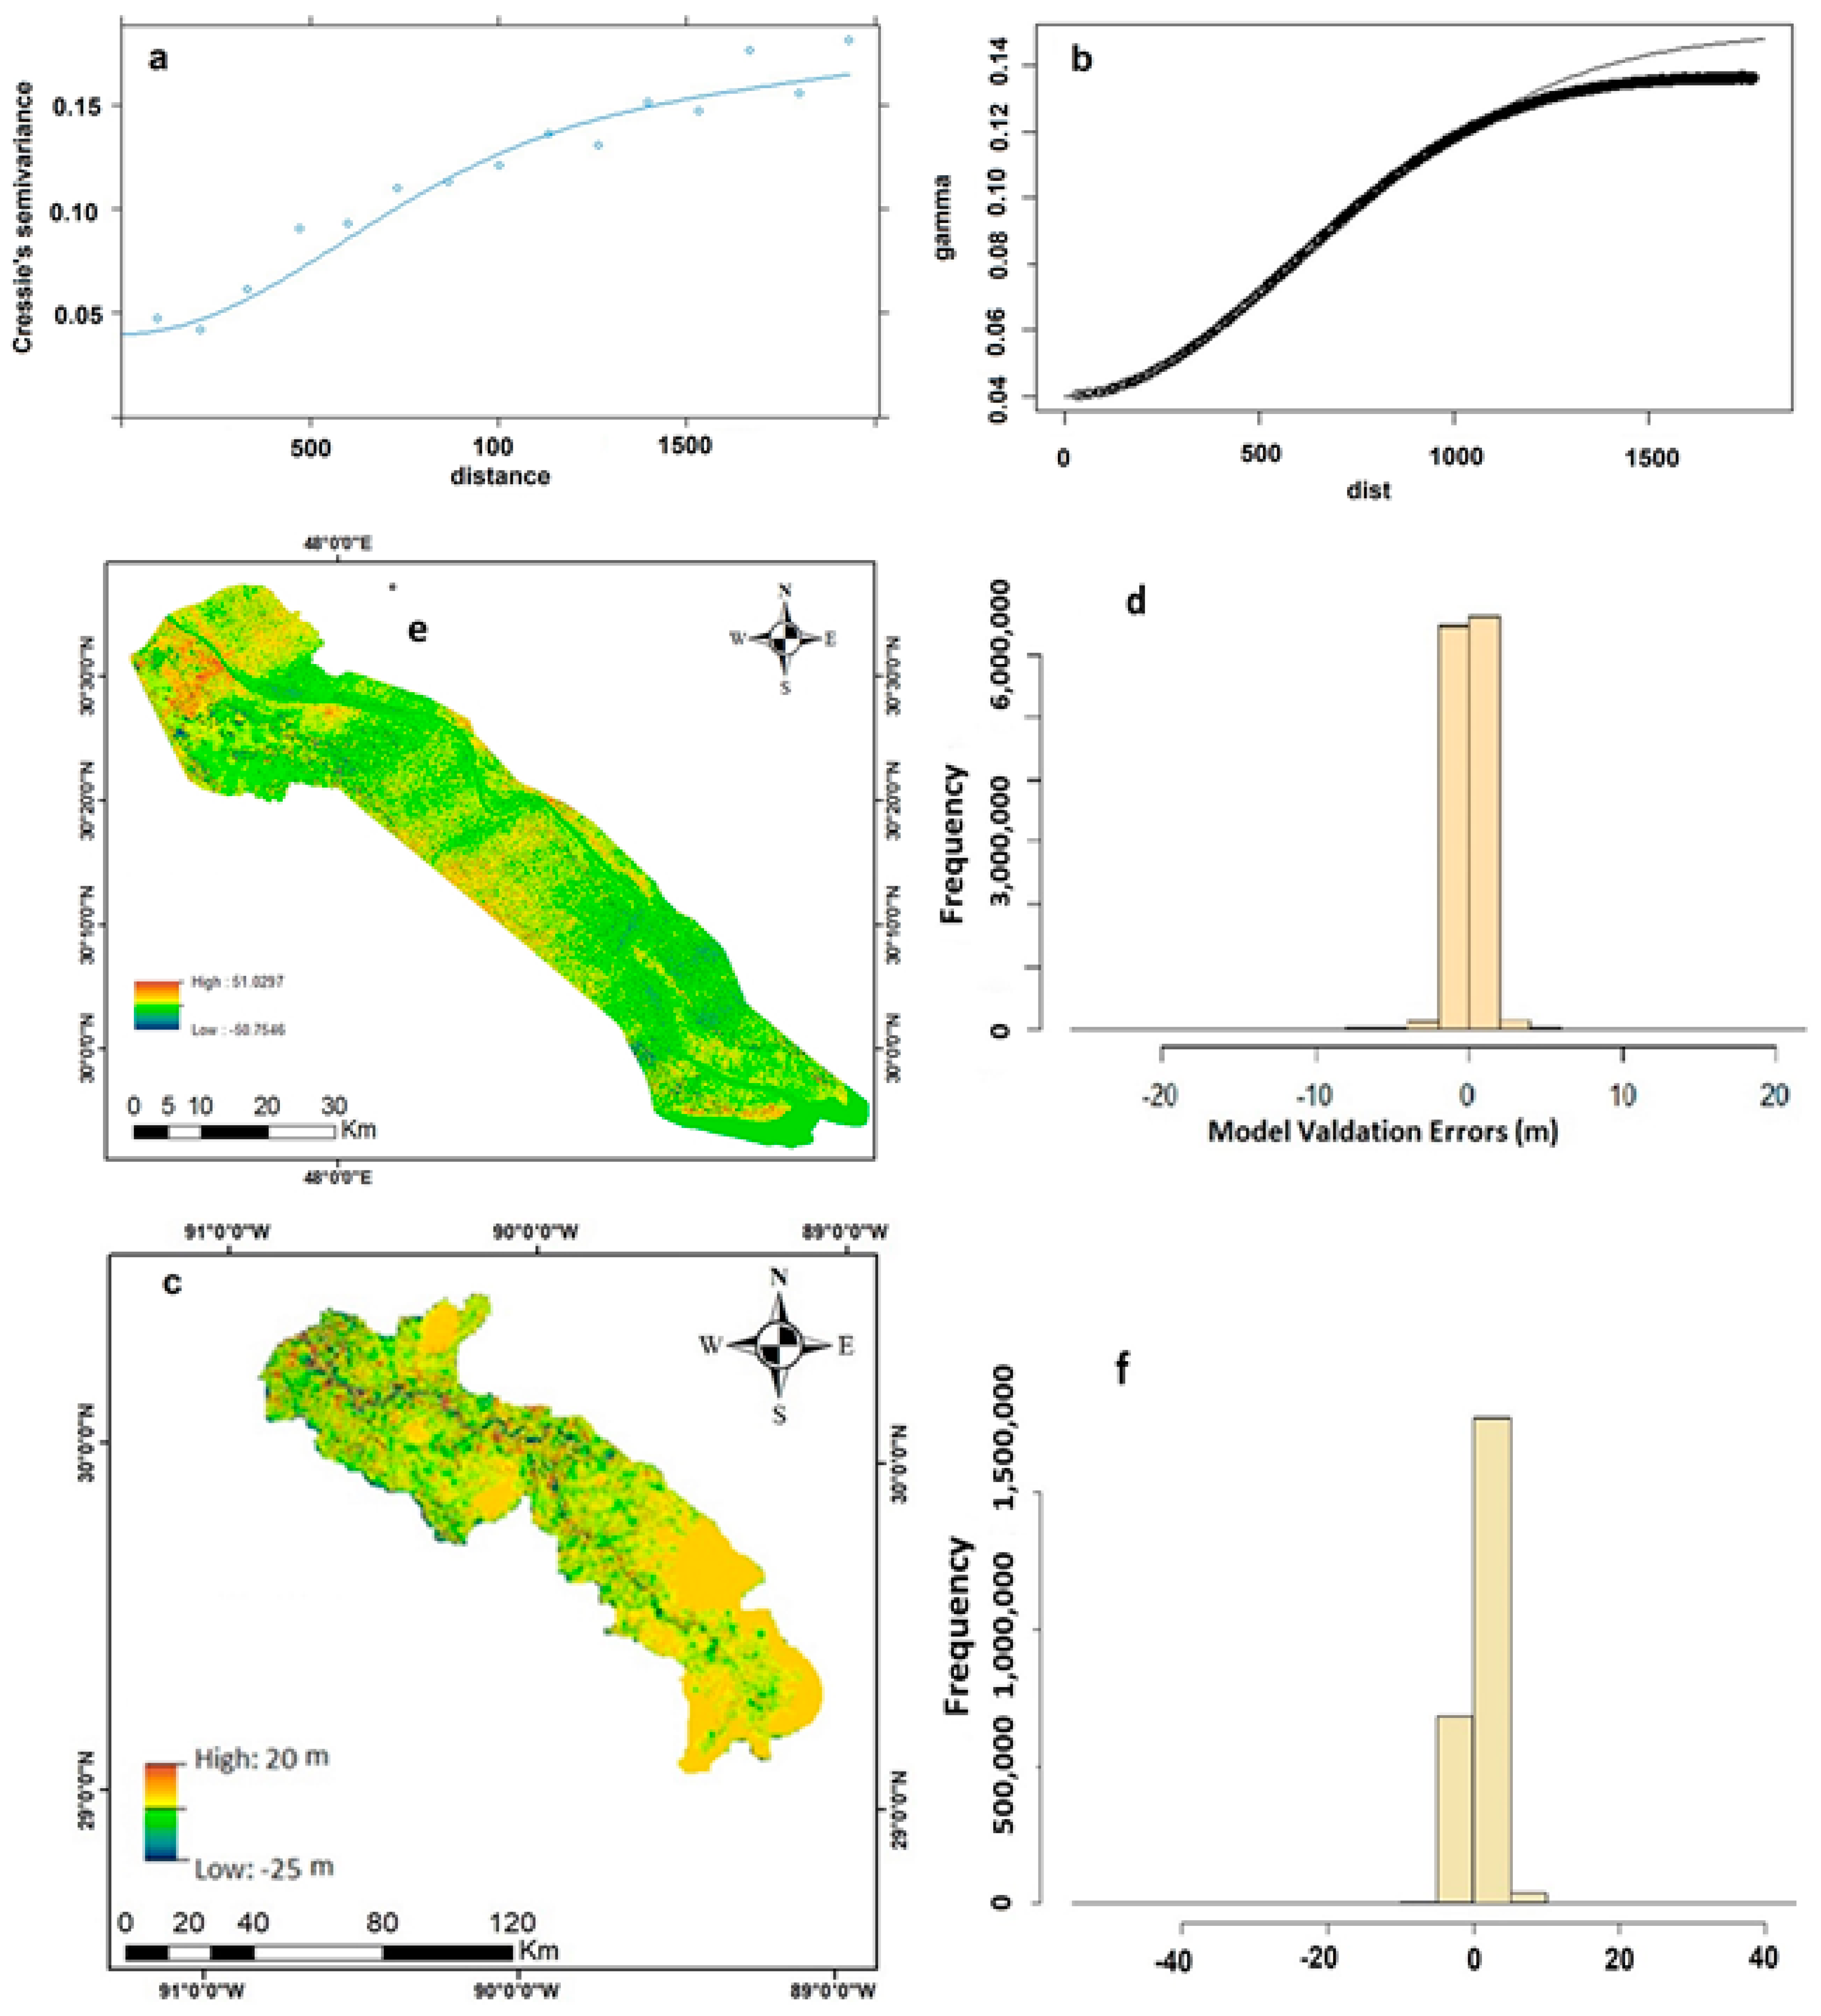
3.1. Regression Kriging-Based Error Modelling
3.2. Realizations
3.3. Inundation Modelling
4. Discussion
- SRTM 30 m is a global DEM product that covers both regions. We assume that, because the sensors and algorithms that produced it are the same, the error properties in both areas should be similar.
- The topography of both regions is similar. Both regions have a low elevation of between 0 to 35 m. Elevation is relatively high on the levees along the river banks and lower away from the rivers. The northwestern parts of both regions are higher than the southeastern, and both end in marine gulfs.
- We can acquire the parameters to explain SRTM error in both regions such as vegetation cover and the slope from SRTM itself and from Landsat imagery.
- We have surface reference elevation data for the MRDR, but we do not have any reference elevation data for the SARR. Geostatistical simulation is computationally expensive, especially over large regions. In this study, a Gaussian convolution filter was applied to the random noise raster, which rapidly generated spatially autocorrelated DEM error realizations.
Limitations
5. Conclusions
Author Contributions
Funding
Data Availability Statement
Acknowledgments
Conflicts of Interest
References
- Hassanzadeh, S.; Kiasatpour, A.; Hosseinibalam, F. Sea-level response to atmospheric forcing along the north coast of Persian Gulf. Meteorol. Atmos. Phys. 2007, 95, 223–237. [Google Scholar] [CrossRef]
- Alothman, A.O.; Bos, M.S.; Fernandes, R.M.S.; Ayhan, M.E. Sea level rise in the north-western part of the Arabian Gulf. J. Geodyn. 2014, 81, 105–110. [Google Scholar] [CrossRef]
- Sultan, S.; Ahmad, F.; Elghribi, N.; Al-Subhi, A. An analysis of Arabian Gulf monthly mean sea level. Cont. Shelf Res. 1995, 15, 1471–1482. [Google Scholar] [CrossRef]
- Wang, H.; Hsieh, Y.P.; Harwell, M.A.; Huang, W. Modeling soil salinity distribution along topographic gradients in tidal salt marshes in Atlantic and Gulf coastal regions. Ecol. Model. 2007, 201, 429–439. [Google Scholar] [CrossRef]
- Hughes, C.E.; Binning, P.; Willgoose, G.R. Characterisation of the hydrology of an estuarine wetland. J. Hydrol. 1998, 211, 34–49. [Google Scholar] [CrossRef]
- Singh, A.; Loveland, T.R.; del Pietro, D.; Parlow, H.; Peduzzi, P.; Torres, S.; Claudio, W. One Planet, Many People: Atlas of Our Changing Environment. United Nations Environment Programme. 2005. Available online: https://wedocs.unep.org/handle/20.500.11822/9194 (accessed on 13 May 2021).
- Brandimarte, L.; Popescu, I.; Neamah, N.K. Analysis of fresh-saline water interface at the Shatt Al-Arab estuary. Int. J. River Basin Manag. 2014, 13, 17–25. [Google Scholar] [CrossRef]
- Al-Bahili, N.K.M.; Al-Maliki, J.C.H.; Alrubaye, A.A. The effect of vegetation on the stream bank erosion of Shatt Al-Arab River, south Iraq. Marsh Bull. 2010, 5, 1–13. [Google Scholar]
- Jabbar, M.T.; Zhou, X. Eco-environmental change detection by using remote sensing and GIS techniques: A case study Basrah province, south part of Iraq. Environ. Earth Sci. 2011, 64, 1397–1407. [Google Scholar] [CrossRef]
- Mahmood, A.A.; Eassa, A.M.; Muayad, H.M.; Israa, Y.S. Assessment of ground water quality at Basrah, Iraq by water quality index (WQI). J. Univ. Babylon 2013, 21, 2531–2543. [Google Scholar]
- Abdullah, A.D.; Masih, I.; van der Zaag, P.; Karim, U.F.; Popescu, I.; Al Suhail, Q. Shatt al Arab River system under escalating pressure: A preliminary exploration of the issues and options for mitigation. Int. J. River Basin Manag. 2015, 13, 215–227. [Google Scholar] [CrossRef]
- Al-Aesawi, Q.; Al-Nasrawi, A.K.M.; Jones, B.G. Short-term Geoinformatics Evaluation in the Shatt Al-Arab Delta (Northwestern Arabian/Persian Gulf). J. Coast. Res. 2020, 36, 498. [Google Scholar] [CrossRef]
- Farr, T.G.; Rosen, P.A.; Caro, E.; Crippen, R.; Duren, R.; Hensley, S.; Kobrick, M.; Paller, M.; Rodriguez, E.; Roth, L.; et al. The Shuttle Radar Topography Mission. Rev. Geophys. 2007, 45. [Google Scholar] [CrossRef] [Green Version]
- Shortridge, A. Shuttle Radar Topography Mission Elevation Data Error and Its Relationship to Land Cover. Cartogr. Geogr. Inf. Sci. 2006, 33, 65–75. [Google Scholar] [CrossRef]
- Rabus, B.; Eineder, M.; Roth, A.; Bamler, R. The shuttle radar topography mission—A new class of digital elevation models acquired by spaceborne radar. ISPRS J. Photogramm. Remote Sens. 2003, 57, 241–262. [Google Scholar] [CrossRef]
- Shortridge, A.; Messina, J. Spatial structure and landscape associations of SRTM error. Remote Sens. Environ. 2011, 115, 1576–1587. [Google Scholar] [CrossRef]
- Titus, J.G.; Richman, C. Maps of lands vulnerable to sea level rise: Modeled elevations along the US Atlantic and Gulf coasts. Clim. Res. 2001, 18, 205–228. [Google Scholar] [CrossRef] [Green Version]
- Ekulp, S.; Strauss, B.H. Global DEM Errors Underpredict Coastal Vulnerability to Sea Level Rise and Flooding. Front. Earth Sci. 2016, 4, 36. [Google Scholar] [CrossRef]
- La Londe, T.; Shortridge, A.; Messina, J. The Influence of Land Cover on Shuttle Radar Topography Mission (SRTM) Elevations in Low-relief Areas. Trans. GIS 2010, 14, 461–479. [Google Scholar] [CrossRef]
- Mcleod, E.; Poulter, B.; Hinkel, J.; Reyes, E.; Salm, R. Sea-level rise impact models and environmental conservation: A review of models and their applications. Ocean Coast. Manag. 2010, 53, 507–517. [Google Scholar] [CrossRef]
- Al-Saaidy, Z. The Potentials and the Agricultural Production in Basrah during (1990–2006) and It’s Developing Procedures in Future. Ph.D. Thesis, University of Basrah, Basrah, Iraq, 2008. [Google Scholar]
- Saad, M.A.H.; Antoine, S.E. Limnological Studies on the River Tigris, Iraq. I. Environmental Characteristics. Int. Rev. Hydrobiol. 1978, 63, 685–704. [Google Scholar] [CrossRef]
- Cressey, G.B. The Shatt al-Arab Basin. Middle East J. 1958, 12, 448–460. Available online: http://0-www-jstor-org.brum.beds.ac.uk/stable/4323054 (accessed on 13 May 2021).
- Barlage, M.; Zeng, X. The impact of fractional vegetation cover and leaf area index on warm season precipitation variability in global ensemble simulations. Ariz. J. Hydrometeorol. 2004, 5, 823–830. [Google Scholar] [CrossRef]
- Jiapaer, G.; Chen, X.; Bao, A. A comparison of methods for estimating fractional vegetation cover in arid regions. Agric. For. Meteorol. 2011, 151, 1698–1710. [Google Scholar] [CrossRef]
- Baret, F.; Weiss, M.; Lacaze, R.; Camacho, F.; Makhmara, H.; Pacholcyzk, P.; Smets, B. GEOV1: LAI and FAPAR essential climate variables and FCOVER global time series capitalizing over existing products. Part1: Principles of development and production. Remote Sens. Environ. 2013, 137, 299–309. [Google Scholar] [CrossRef]
- Zhang, X.; Liao, C.; Li, J.; Sun, Q. Fractional vegetation cover estimation in arid and semi-arid environments using HJ-1 satellite hyperspectral data. Int. J. Appl. Earth Obs. Geoinf. 2013, 21, 506–512. [Google Scholar] [CrossRef]
- Jing, X.; Yao, W.-Q.; Wang, J.-H.; Song, X.-Y. A study on the relationship between dynamic change of vegetation coverage and precipitation in Beijing’s mountainous areas during the last 20 years. Math. Comput. Model. 2011, 54, 1079–1085. [Google Scholar] [CrossRef]
- Wang, X.; Jia, K.; Liang, S.; Li, Q.; Wei, X.; Yao, Y.; Zhang, X.; Tu, Y. Estimating Fractional Vegetation Cover from Landsat-7 ETM+ Reflectance Data Based on a Coupled Radiative Transfer and Crop Growth Model. IEEE Trans. Geosci. Remote Sens. 2017, 55, 5539–5546. [Google Scholar] [CrossRef]
- Hengl, T.; Bajat, B.; Blagojević, D.; Reuter, H.I. Geostatistical modeling of topography using auxiliary maps. Comput. Geosci. 2008, 34, 1886–1899. [Google Scholar] [CrossRef] [Green Version]
- Leon, J.X.; Heuvelink, G.B.M.; Phinn, S.R. Incorporating DEM Uncertainty in Coastal Inundation Mapping. PLoS ONE 2014, 9, e108727. [Google Scholar] [CrossRef]
- Hengl, T.; Heuvelink, G.B.; Stein, A. Comparison of Kriging with External Drift and Regression Kriging. Technical Note, ITC, 2003, Enschede, The Netherlands. Available online: https://webapps.itc.utwente.nl/librarywww/papers_2003/misca/hengl_comparison.pdf (accessed on 13 May 2021).
- Oksanen, J.; Sarjakoski, T. Error propagation of DEM-based surface derivatives. Comput. Geosci. 2005, 31, 1015–1027. [Google Scholar] [CrossRef]
- Bivand, S. Geographically Weighted Regression. CRAN Task View: Analysis of Spatial Data. 2017. Available online: https://CRAN.R-project.org/view=Spatial (accessed on 13 May 2021).
- Hijmans, R.J.; Cameron, S.E.; Parra, J.L.; Jones, P.G.; Jarvis, A. Very high resolution interpolated climate surfaces for global land areas. Int. J. Climatol. 2005, 25, 1965–1978. [Google Scholar] [CrossRef]
- R Core Team. R: A Language and Environment for Statistical Computing. Vienna, Austria: R Foundation for Statistical Computing. 2017. Available online: http://www.R-project.org/ (accessed on 13 May 2021).
- Van de Sande, B.; Lansen, J.; Hoyng, C. Sensitivity of Coastal Flood Risk Assessments to Digital Elevation Models. Water 2012, 4, 568–579. [Google Scholar] [CrossRef]
- Yaseen, B.R.; Al Asaady, K.A.; Kazem, A.A.; Chaichan, M.T. Environmental impacts of salt tide in Shatt al-Arab-Basra/Iraq. IOSR J. Environ. Sci. Toxicol. Food Technol. 2016, 10, 35–43. Available online: https://portal.arid.my/Publications/e0b668ae-f88a-4c.pdf (accessed on 13 May 2021).
- NOAA. Data Integration Visualization Exploration and Reporting (DIVER). National Oceanic and Atmospheric Administration, US Department of Commerce, Silver Spring, Maryland, USA. 2018. Available online: https://www.diver.orr.noaa.gov/ (accessed on 13 May 2021).
- Gesch, D.B.; Oimoen, M.J.; Evans, G.A. Accuracy assessment of the U.S. Geological Survey National Elevation Dataset, and comparison with other large-area elevation datasets: SRTM and ASTER. In Open-File Report; US Geological Survey: Reston, VA, USA, 2014; Volume 1008. [Google Scholar]
- Gesch, D.; Oimoen, M.; Greenlee, S.; Nelson, C.; Steuck, M.; Tyler, D. The national elevation dataset. Photogramm. Eng. Remote Sens. 2002, 68, 5–32. [Google Scholar]
- Strauss, B.H.; Ziemlinski, R.; Weiss, J.L.; Overpeck, J.T. Tidally adjusted estimates of topographic vulnerability to sea level rise and flooding for the contiguous United States. Environ. Res. Lett. 2012, 7, 014033. [Google Scholar] [CrossRef]
- Amal, M.E. The use of diatom indices for the assessment of Shatt Al-Arab river water quality. J. Basrah Res. 2012, 38, 114–124. Available online: https://bit.ly/2NIdnD1 (accessed on 13 May 2021).
- Cuo, L.; Giambelluca, T.W.; Ziegler, A.D. Lumped parameter sensitivity analysis of a distributed hydrological model within tropical and temperate catchments. Hydrol. Process. 2011, 25, 2405–2421. [Google Scholar] [CrossRef]
- Kadhim, A.A.; Shortridge, A.M. Flooded with error: Handling uncertainty in SRTM for the assessment of sea level rise in the Mississippi River delta. Prof. Geogr. 2021. [Google Scholar] [CrossRef]


| Parameter | Estimate | Std. Error | t Value | Pr (>|t|) |
|---|---|---|---|---|
| Intercept | −0.1382 | 0.01884 | −7.337 | 2.36 × 10⁻¹³ |
| SRTM Elevation | 0.8008 | 0.0050 | 159.976 | <2 × 10⁻¹⁶ |
| VCF | 0.0054 | 0.0007 | 7.991 | 1.49 × 10⁻¹⁵ |
| SRTM Slope | −0.0803 | 0.0104 | −7.723 | 1.24 × 10⁻¹⁴ |
Publisher’s Note: MDPI stays neutral with regard to jurisdictional claims in published maps and institutional affiliations. |
© 2021 by the authors. Licensee MDPI, Basel, Switzerland. This article is an open access article distributed under the terms and conditions of the Creative Commons Attribution (CC BY) license (https://creativecommons.org/licenses/by/4.0/).
Share and Cite
Al-Nasrawi, A.K.M.; Kadhim, A.A.; Shortridge, A.M.; Jones, B.G. Accounting for DEM Error in Sea Level Rise Assessment within Riverine Regions; Case Study from the Shatt Al-Arab River Region. Environments 2021, 8, 46. https://0-doi-org.brum.beds.ac.uk/10.3390/environments8050046
Al-Nasrawi AKM, Kadhim AA, Shortridge AM, Jones BG. Accounting for DEM Error in Sea Level Rise Assessment within Riverine Regions; Case Study from the Shatt Al-Arab River Region. Environments. 2021; 8(5):46. https://0-doi-org.brum.beds.ac.uk/10.3390/environments8050046
Chicago/Turabian StyleAl-Nasrawi, Ali K. M., Ameen A. Kadhim, Ashton M. Shortridge, and Brian G. Jones. 2021. "Accounting for DEM Error in Sea Level Rise Assessment within Riverine Regions; Case Study from the Shatt Al-Arab River Region" Environments 8, no. 5: 46. https://0-doi-org.brum.beds.ac.uk/10.3390/environments8050046