Article

Evaluating and Adapting Climate Change Impacts on Rice Production in Indonesia: A Case Study of the Keduang Subwatershed, Central Java

1
Department of Bioenvironmental Systems Engineering, National Taiwan University, Taipei 10617, Taiwan
2
Department of Agronomy, Faculty of Agriculture, Universitas Gadjah Mada, Yogyakarta 55281, Indonesia
3
Department of Agronomy, National Taiwan University, Taipei 10617, Taiwan
*
Author to whom correspondence should be addressed.
Submission received: 28 July 2021 / Revised: 9 October 2021 / Accepted: 26 October 2021 / Published: 29 October 2021

Abstract

:
Predicting the effect of climate change on rice yield is crucial as global food demand rapidly increases with the human population. This study combined simulated daily weather data (MarkSim) and the CERES-Rice crop model from the Decision Support System for Agrotechnology Transfer (DSSAT) software to predict rice production for three planting seasons under four climate change scenarios (RCPs 2.6, 4.5, 6.0, and 8.5) for the years 2021 to 2050 in the Keduang subwatershed, Wonogiri Regency, Central Java, Indonesia. The CERES-Rice model was calibrated and validated for the local rice cultivar (Ciherang) with historical data using GenCalc software. The model evaluation indicated good performance with both calibration (coefficient of determination (R2) = 0.89, Nash–Sutcliffe efficiency (NSE) = 0.88) and validation (R2 = 0.87, NSE = 0.76). Our results suggest that the predicted changing rainfall patterns, rising temperature, and intensifying solar radiation under climate change can reduce the rice yield in all three growing seasons. Under RCP 8.5, the impact on rice yield in the second dry season may decrease by up to 11.77% in the 2050s. Relevant strategies associated with policies based on the results were provided for decision makers. Furthermore, to adapt the impact of climate change on rice production, a dynamic cropping calendar, modernization of irrigation systems, and integrated plant nutrient management should be developed for farming practices based on our results in the study area. Our study is not only the first assessment of the impact of climate change on the study site but also provides solutions under projected rice shortages that threaten regional food security.

1. Introduction

The effects of global climate change, such as varying rainfall intensity, duration, and frequency; extreme weather; increasing temperatures; significant variations in solar radiation; increasing greenhouse gaseous emissions, can have an impact on agricultural, forest, and other natural resources, including water sourced from climate-sensitive water reservoirs [1,2,3,4]. In the agricultural sector, climate change will affect crop growth and yields as well as production due to an increasing number of drought and flood events, which will indirectly affect economic stability, although the impact will vary with region and crop type [5,6,7]. Moreover, developing countries will suffer more than developed countries due to agricultural production strategies driven by economic plans under climate change scenarios. According to reports, the global temperature will increase by 2–3 °C in 2030–2050 [8], and temperature increases of up to 2 °C or higher are expected to reduce the yields of global prime crops, such as rice, maize, and wheat [9]. Furthermore, climate change has led to substantial changes in the dates of planting and harvesting, which has led to changes in the growing season due to variations and uncertainties in rainfall and temperature, thereby impacting food demand [10,11].
Rice, which is the staple food for most people around the world, is produced at approximately 480 MMT annually [12], and is consumed by approximately 557 million people in Asia. It serves as a cornerstone of cultural, social, and economic development [9,12]. However, meeting the food demands of an ever-increasing human population remains challenging [13]. A 10–100% increase in crop production is required for sustaining the global population by 2050 [14]. Moreover, an annual conversion of 2.7–4.9 million hectares (ha) of land to cropland is required to meet the future estimated food production [15]. Indonesia’s population and rice consumption are projected to increase by approximately 31% (2015: 257 million; 2050: 322 million) and 45% [16], respectively, resulting in potential food shortages and affecting food security [17]. Conversely, several factors affect rice production, including management practices such as tillage operations, cultivar type, sowing density, transplantation date, plant density, fertilizer management, chemical application, and water management. Furthermore, environmental factors, such as temperature, precipitation, solar radiation, wind speed, and humidity, directly impact crop growth and yield [18]. Moreover, the climate in Indonesia is predicted to become hotter and more seasonal, with delayed onset of the summer monsoon and reduced rice production by approximately 14% [19] that could further impair food security. Climate change could also cause losses of 12,446 ha of agricultural area and 885,430 t of rice production [20], whereby rice paddy fields recently suffering from drought reached 25,580 to 867,930 ha per year and damaged 4614 to 192,331 ha of land [21].
Climate change will aggravate rice production under climatic variability [22]. Rice growth is sensitive to temperature, where warm daytime temperatures provide ideal conditions, and extreme heat events over 35 °C for even a few hours can impair plant physiology and deteriorate rice quantity and quality [8]. Rice requires substantially more water than other grain crops, namely 450–700 mm during its growing season or 1.9–2.25 mm/day [23]. Rice grows poorly if water-stressed, particularly during the transplanting and reproductive stages [24]. In Indonesia, most rice is grown during the rainy season under rainfed conditions with minimal irrigation where precipitation level and timing are critical. These factors will be more vulnerable under climate change since rainfall will also have significant temporal and spatial variations that affect rice management strategies.
Mitigating potential food security issues by projecting future rice production in Indonesia through a climate and crop simulation model is crucial to anticipate the impact of climate change on rice production. Recently, DSSAT-CERES-Rice with a combined climate model has been widely used to assess the impacts of climate change on future rice production [25,26,27]. In the present study, a combination of top-down and bottom-up approaches adopted from a previous study [26] is proposed by evaluating and predicting the effect of climate change on rice production using a climate and crop model. Climate models will predict the climate in the future, and crop models will simulate crop growth and yield using other predicted future climate input data such as soil properties data, management practices, and agronomic characteristics. This study aimed to evaluate climate change scenarios that impact rice production through several climate change scenarios using a combination of the MarkSim daily weather generator and DSSAT-CERES-Rice for predicting future rice production with different (representative concentration pathways (RCP) 2.6, RCP 4.5, RCP 6.0, and RCP 8.5) scenarios on rice production in Indonesia for the 2021–2050 period. Farmers, researchers, and policymakers can utilize the results of this research to determine optimal rice production management practices for anticipating and adapting to future climate change.

2. Materials and Methods
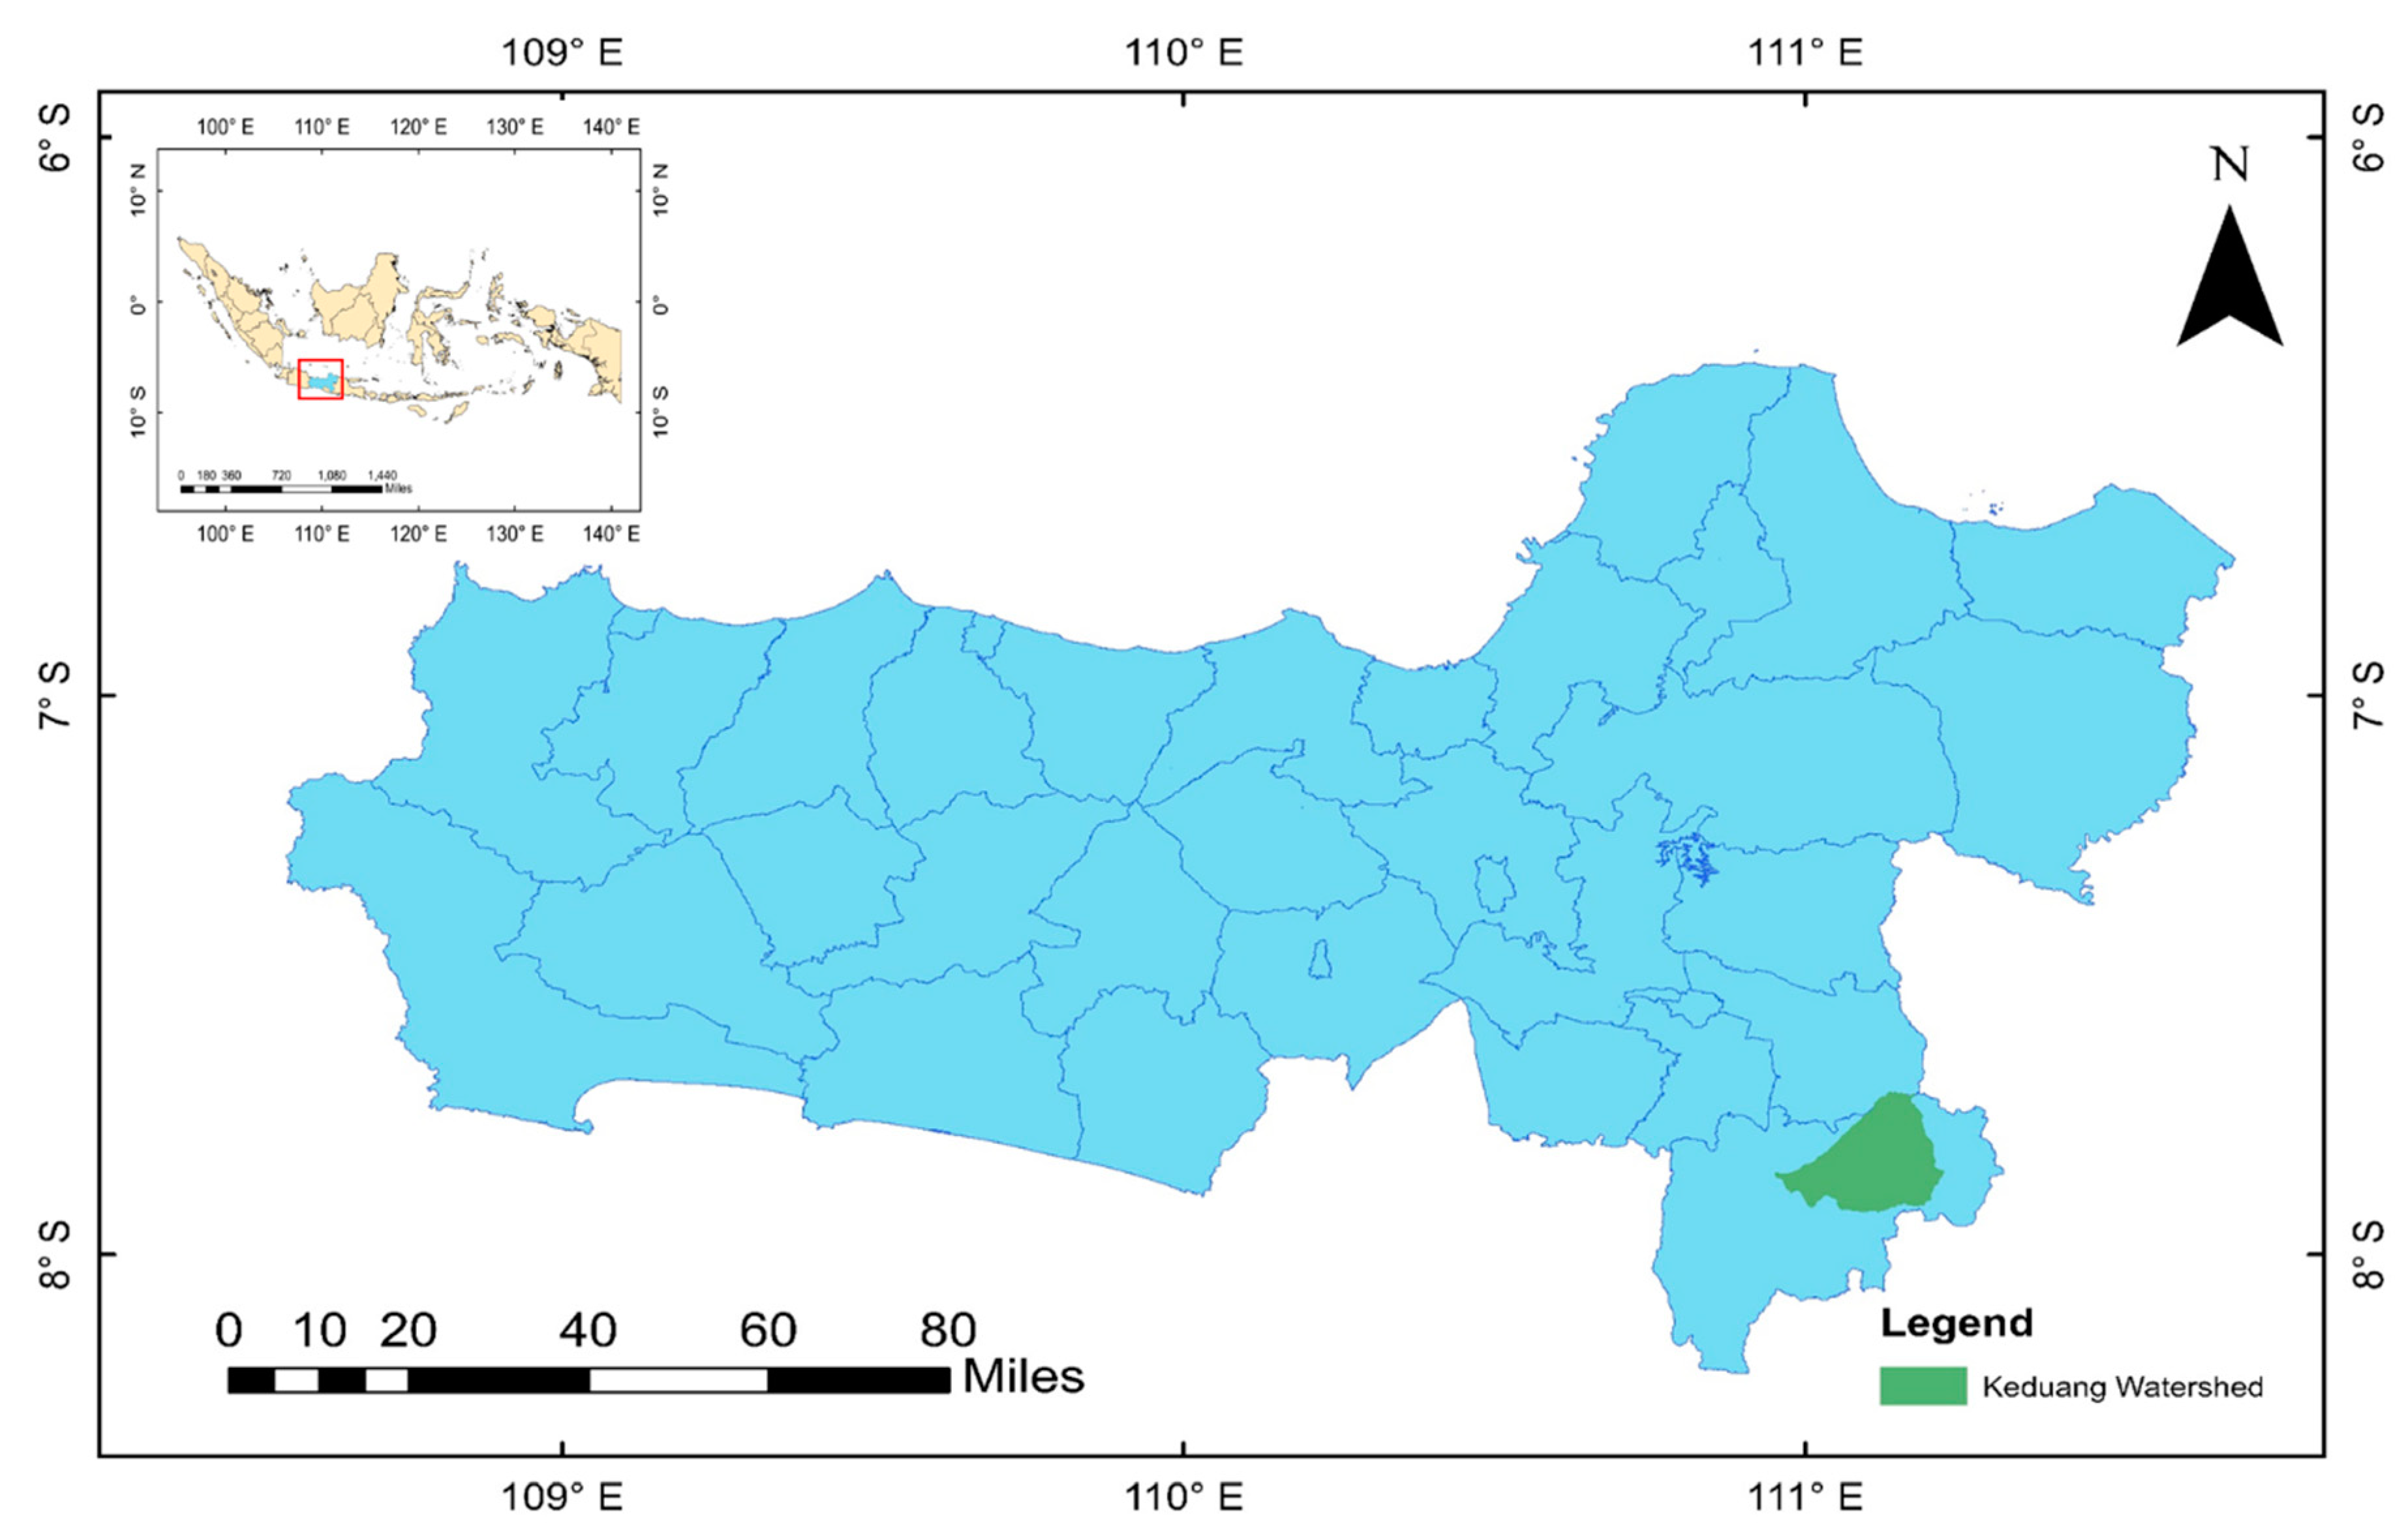
2.1. Study Site

The study area was located in Gemawang, Girimarto District, Wonogiri Regency, Central Java, Indonesia. It is situated within the Keduang watershed (7°42′ S–7°55′ S and 110°58′ E–111°13′ E; Figure 1). Rice in this area is cultivated in terraces, which benefits from the unique steep terrain where almost 30% of land use is terraced paddy fields. The climate characteristics of this area are typically tropical monsoons with a general rainy season throughout the year [28]. The climate is characterized into two seasons: dry season (April until September) and wet season (October until March). There are typically three rice growing periods, a single wet season crop followed by two dry season crops. The total annual rainfall in this area is approximately 2500–3000 mm per year, which is mostly concentrated around the mountainous area, and the humidity is very high. The average annual temperature in the Keduang subwatershed is 27.08 °C, with a maximum and minimum temperature of 35.41 °C and 9.5 °C, respectively.

2.2. Data Collection

The data requirements for simulating the crop model were obtained from several sources. Soil data information, such as soil properties, soil texture, runoff coefficient, and soil organic carbon, were obtained from the Research and Development Technology of Watershed Management programs under the Ministry of Environment and Forestry. Observed meteorological parameters, such as precipitation, Tmax, Tmin, solar radiation, wind speed, and relative humidity, were obtained from the Water Resources Institution under the Ministry of Public Works. Rice yield and management practices, including cultivar use, tillage application, planting management, organic amendment, fertilizer management, chemical application as well as harvesting management, were collected from the Agricultural Department of Wonogiri Regency and interviews with local farmers. All data were used for simulating rice production with a crop simulation model combined with climate models. Additionally, the methodological framework, which utilized a top-down approach for assessing future rice production in three different growing seasons, is presented in Figure 2.

2.3. Climate Change Scenarios

Future climate change scenarios were simulated using the MarkSim weather generator from 2021 to 2050 under several RCPs (RCP 2.6, RCP 4.5, RCP 6.0, and RCP 8.5), which can be accessed at http://gismap.ciat.cgiar.org/MarkSimGCM (accessed on 12 February 2021). Recently, MarkSim has been used to generate future weather data for assessing crop production [29,30,31,32,33,34]. The long-term weather database, which is generated by MarkSim, requires specific locations; monthly average Tmax and Tmin, and precipitation; the average number of precipitation events in each month [33,34]. MarkSim was selected to simulate future climate in the study area based on its specific adaptation to the tropics. The general procedure in MarkSim used interpolated climate surfaces to fit the Markov model for estimating climate data, which was further constructed for the DSSAT crop model to create new CLI and WTG files under a range of GCM’s and scenarios. In this study, we used 17 climate change models (BCC-CSM1-1, BCC-CSM1-1-M, CSIRO-Mk3-6-0, FIO-ESM, GFDL-CM3, GFDL-ESM2G, GFDL-ESM2M, GISS-E2-H, GISS-E2-R, HadGEM2-ES, IPSL-CMSA-LR, IPSL-CMSA-MR, MIROC-ESM, MIROC-ESM-CHEM, MIROCS, MRI-CGCM3, and NorESM1-M), which were assembled for future climate scenarios under different RCPs. The future climate data generated by MarkSim were analyzed using one-way analysis of variance, and means were compared using Tukey’s honestly significant difference tests for comparison, with a probability level of 5%. All statistical analyses were performed using R programming language.

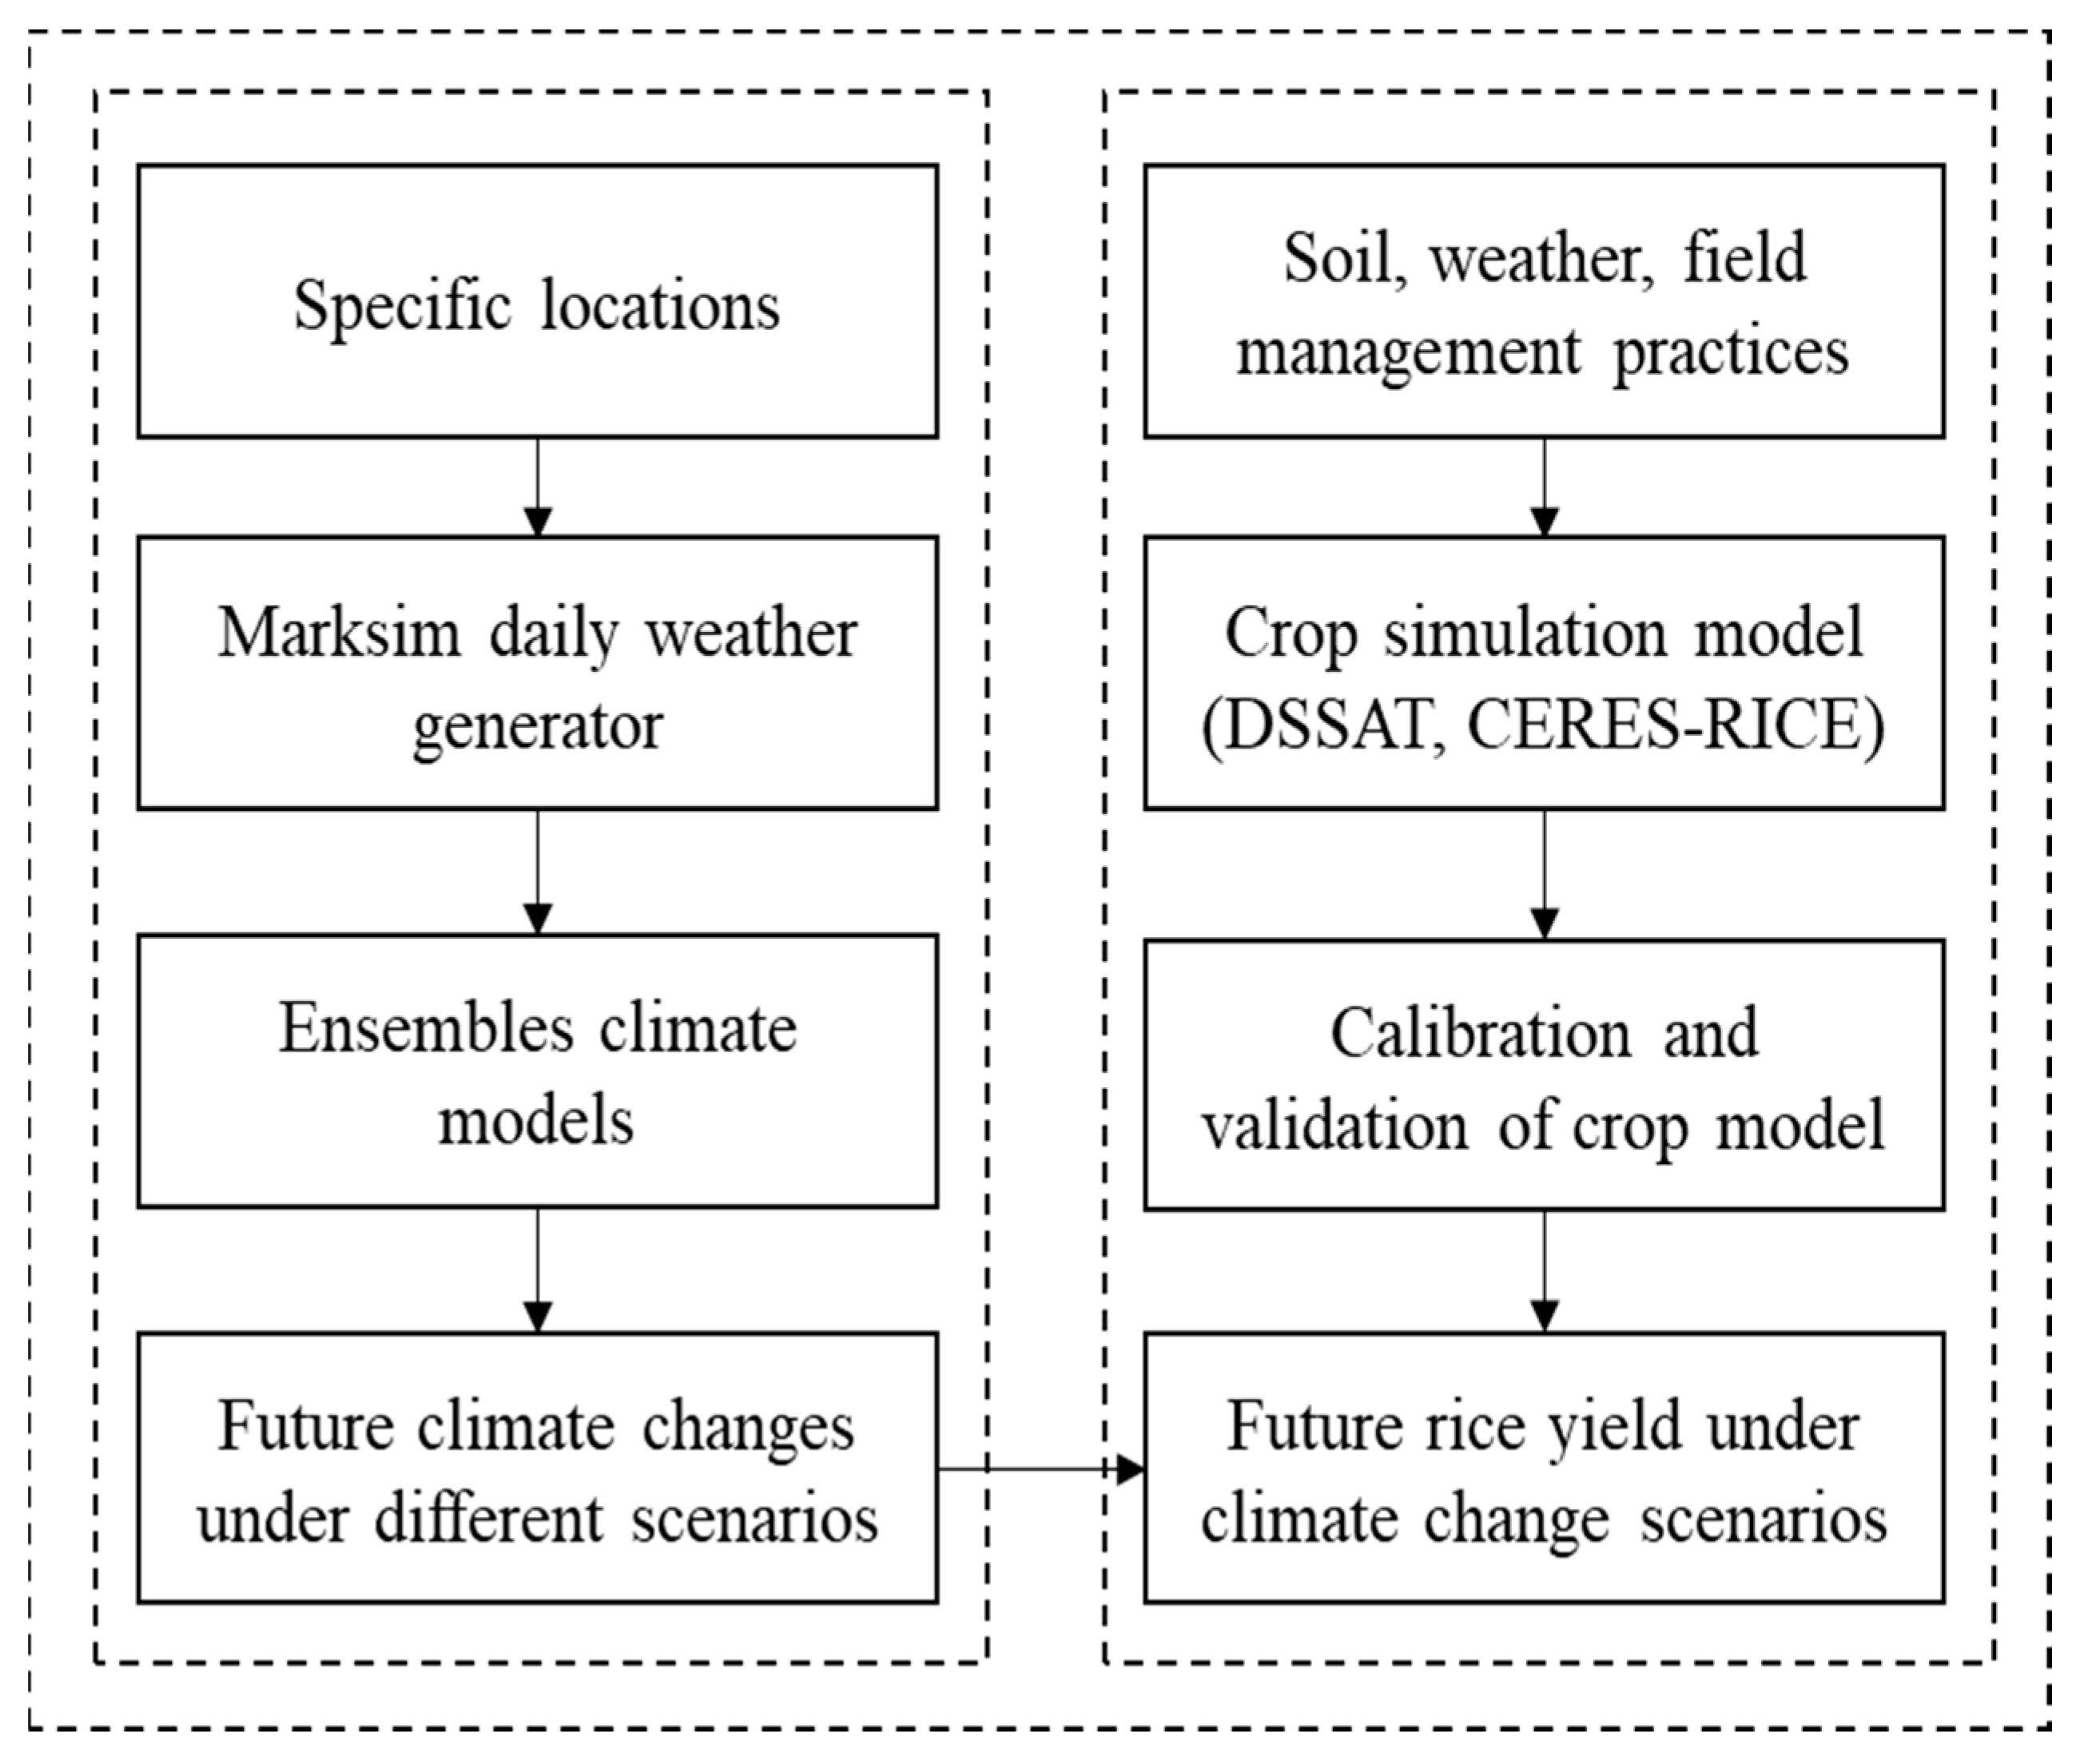
2.4. Crop Simulation Model

We applied DSSAT-CERES-Rice version 4.7 [35,36,37] to assess future rice production under climate change scenarios. The DSSAT-CERES-Rice model was utilized to simulate the growth and yield of crops by using morphological and physical characteristics [26]. Overall, developing a DSSAT model requires four primary data: (1) weather data, including Tmax, Tmin, precipitation, and solar radiation (obtained from the Water Resource Institution under the Ministry of Public Works); (2) soil data, including soil properties, nutrients, and drainage; (3) field management data, obtained from the Agricultural Department of Wonogiri Regency, and interviews with local farmers; (4) rice experiment data, such as rice varieties obtained from the Agricultural Department of the Wonogiri Regency. For weather data, we used the 2007–2017 period to calibrate and validate the DSSAT crop simulation model.

2.5. Calibration and Validation of Crop Simulation Model

Rice yield and its characteristic agronomic data, obtained from the Agricultural Department of Wonogiri Regency, were used for calibrating and validating the DSSAT model. We used the 2007–2012 period for calibration and the 2013–2017 period for validation. Our study focused on the Ciherang rice variety, which grows under three different growth conditions: the wet season, the first dry season, and the second dry season. The GenCalc program was used for estimating the cultivar coefficients of the Ciherang variety to calculate cultivar coefficients (Table 1) [35], which describe the rice growth and development. GenCalc calculates the cultivar coefficient to obtain the minimum root mean square error (RMSE) and normalized root mean square error (RMSEn) between simulated and observed data, in which the final run of GenCalc produces the revised set of cultivar coefficients for the new rice variety [38]. We used the coefficient of determination (R2), RMSE, Nash–Sutcliffe efficiency (NSE), percent bias (PBIAS), and index of agreement (D-index or D-stat) for evaluating the model performance.
R 2 = [ i = 1 n ( P o b s P ¯ o b s ) ( P s i m P ¯ s i m ) i 1 n ( P o b s P ¯ o b s ) 2   i 1 n ( P s i m P ¯ s i m ) 2 ] 2
R M S E = 1 n i = 1 n ( P o b s P s i m ) 2
N S E = 1 i = 1 n ( P o b s P s i m ) 2 i = 1 n ( P o b s P ¯ o b s ) 2
P B I A S = i = 1 n ( P i o b s P i s i m ) × 100 i = 1 n P i o b s
D i n d e x = 1 [ i = 1 n ( p s i m p o b s ) 2 / i = 1 n ( | p s i m p o b s ¯ | ) 2 + ( | p o b s p o b s ¯ | ) 2 ]

3. Results

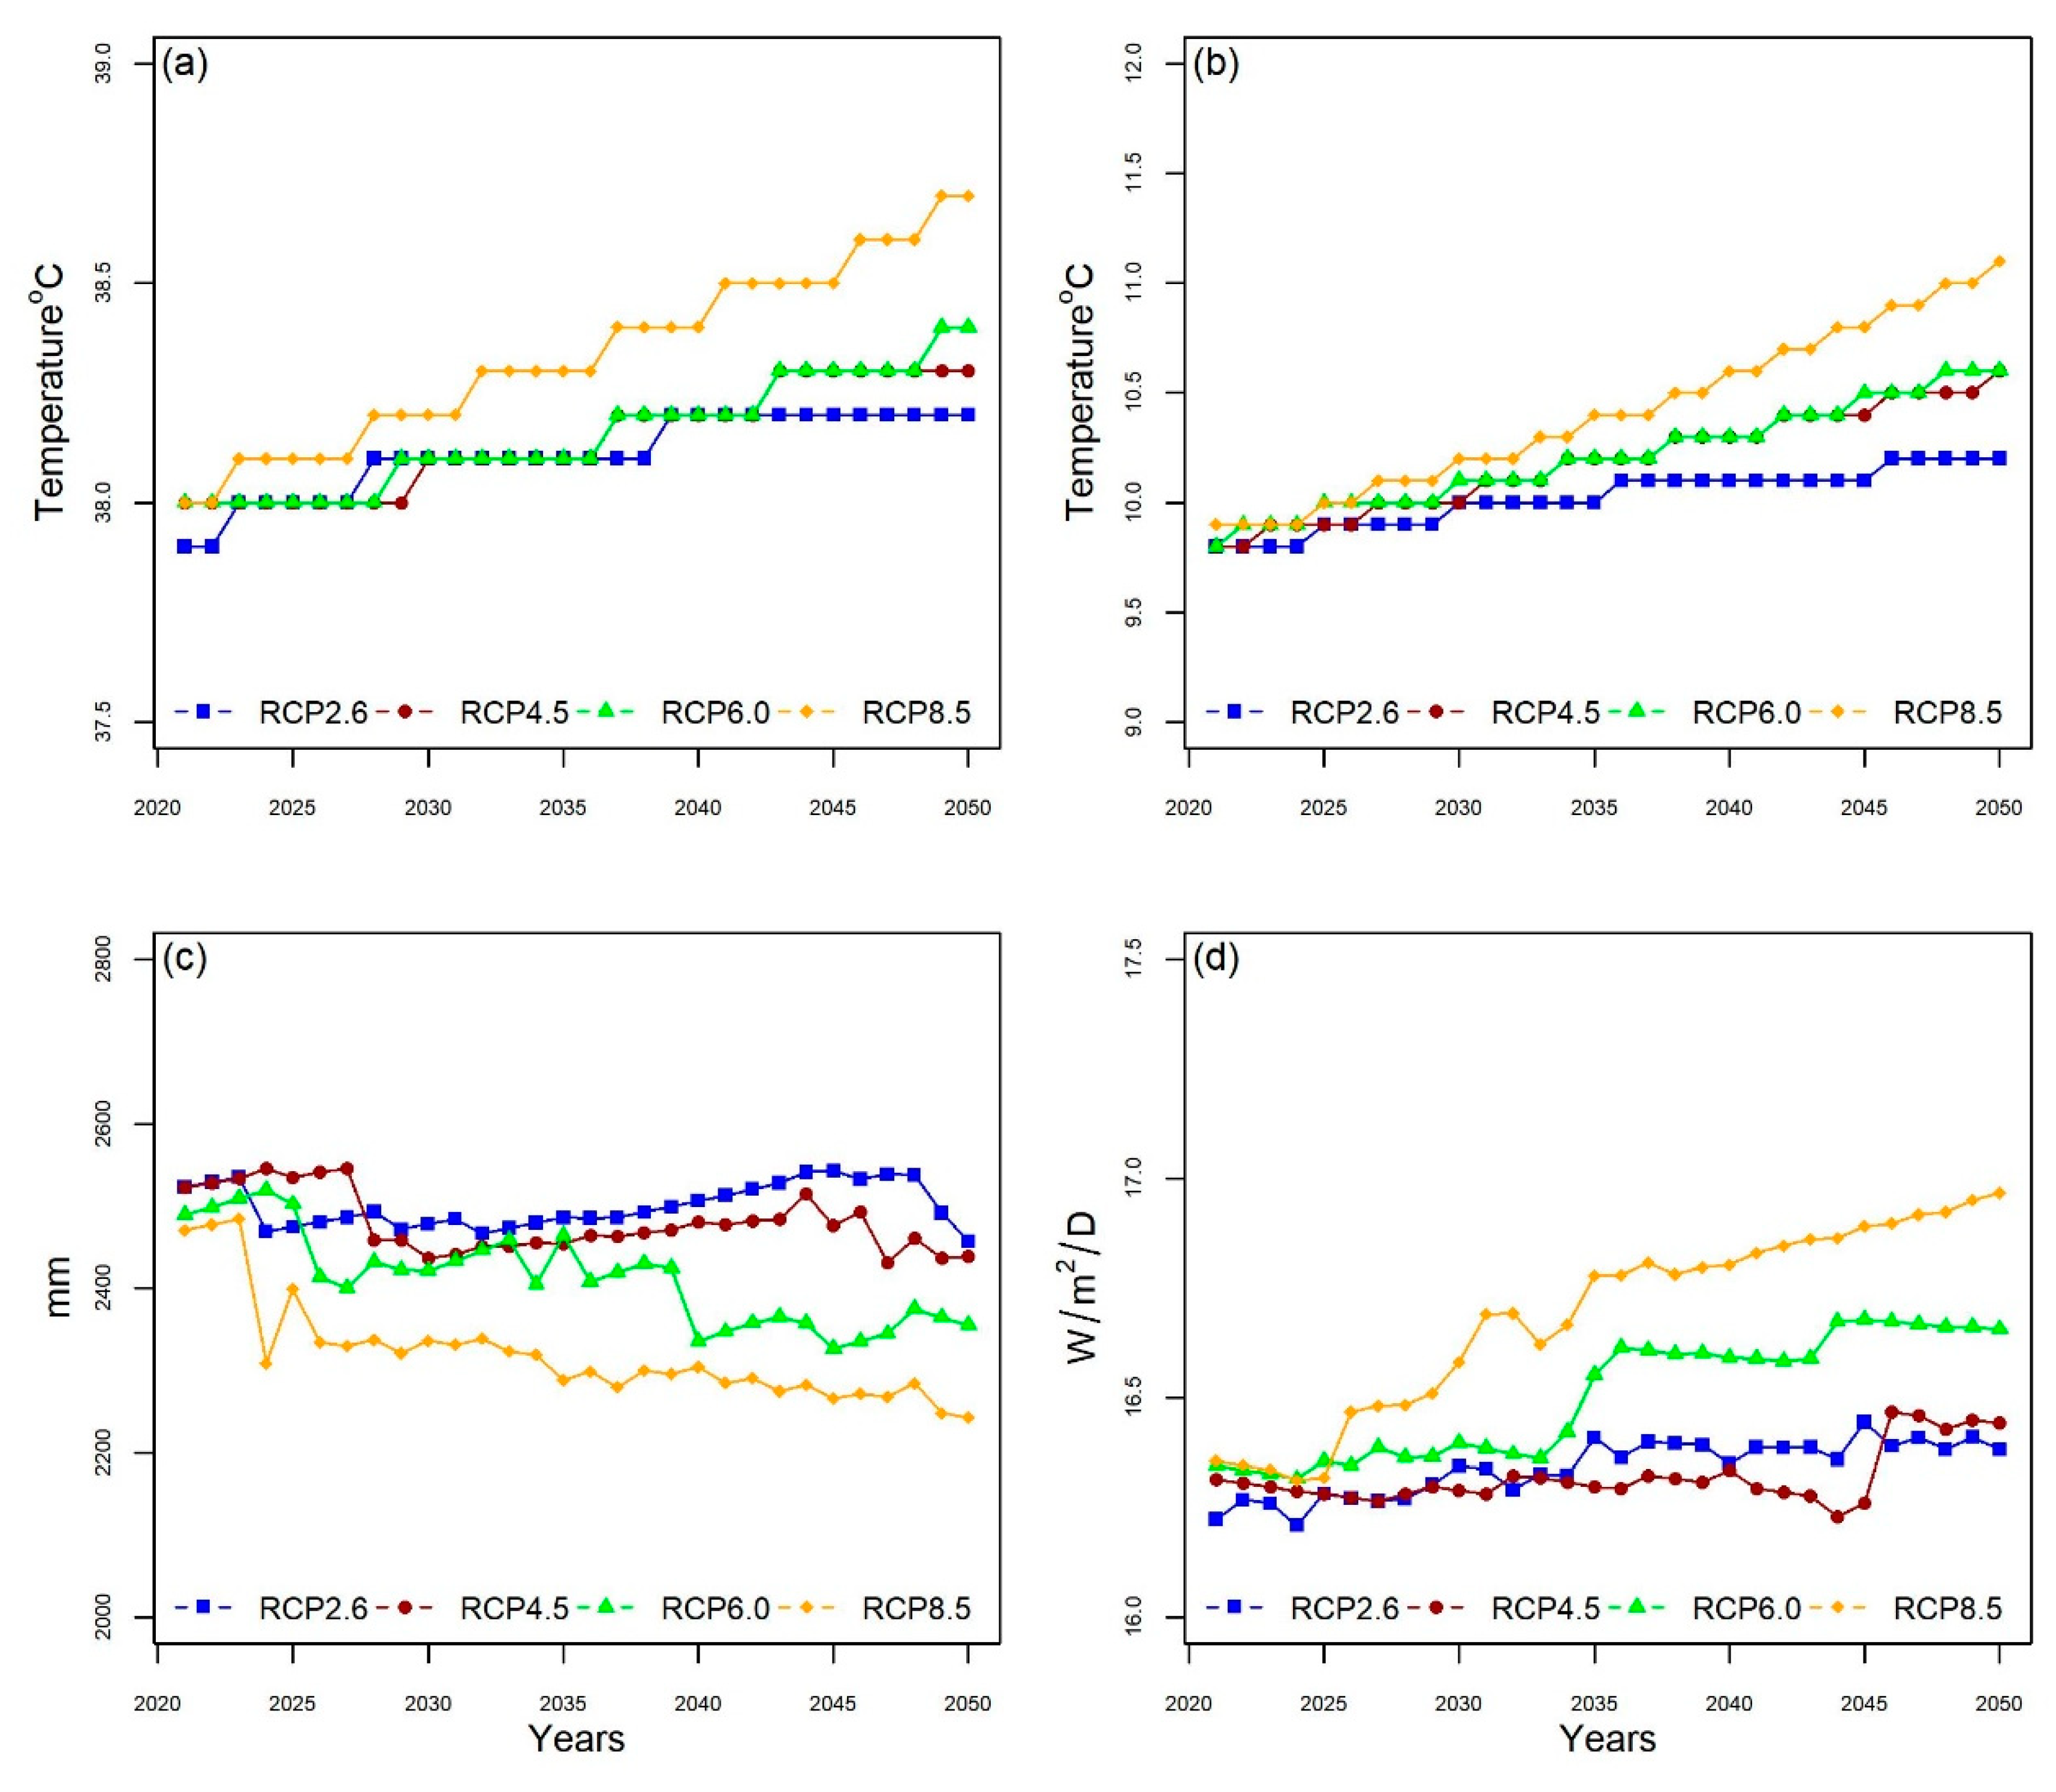
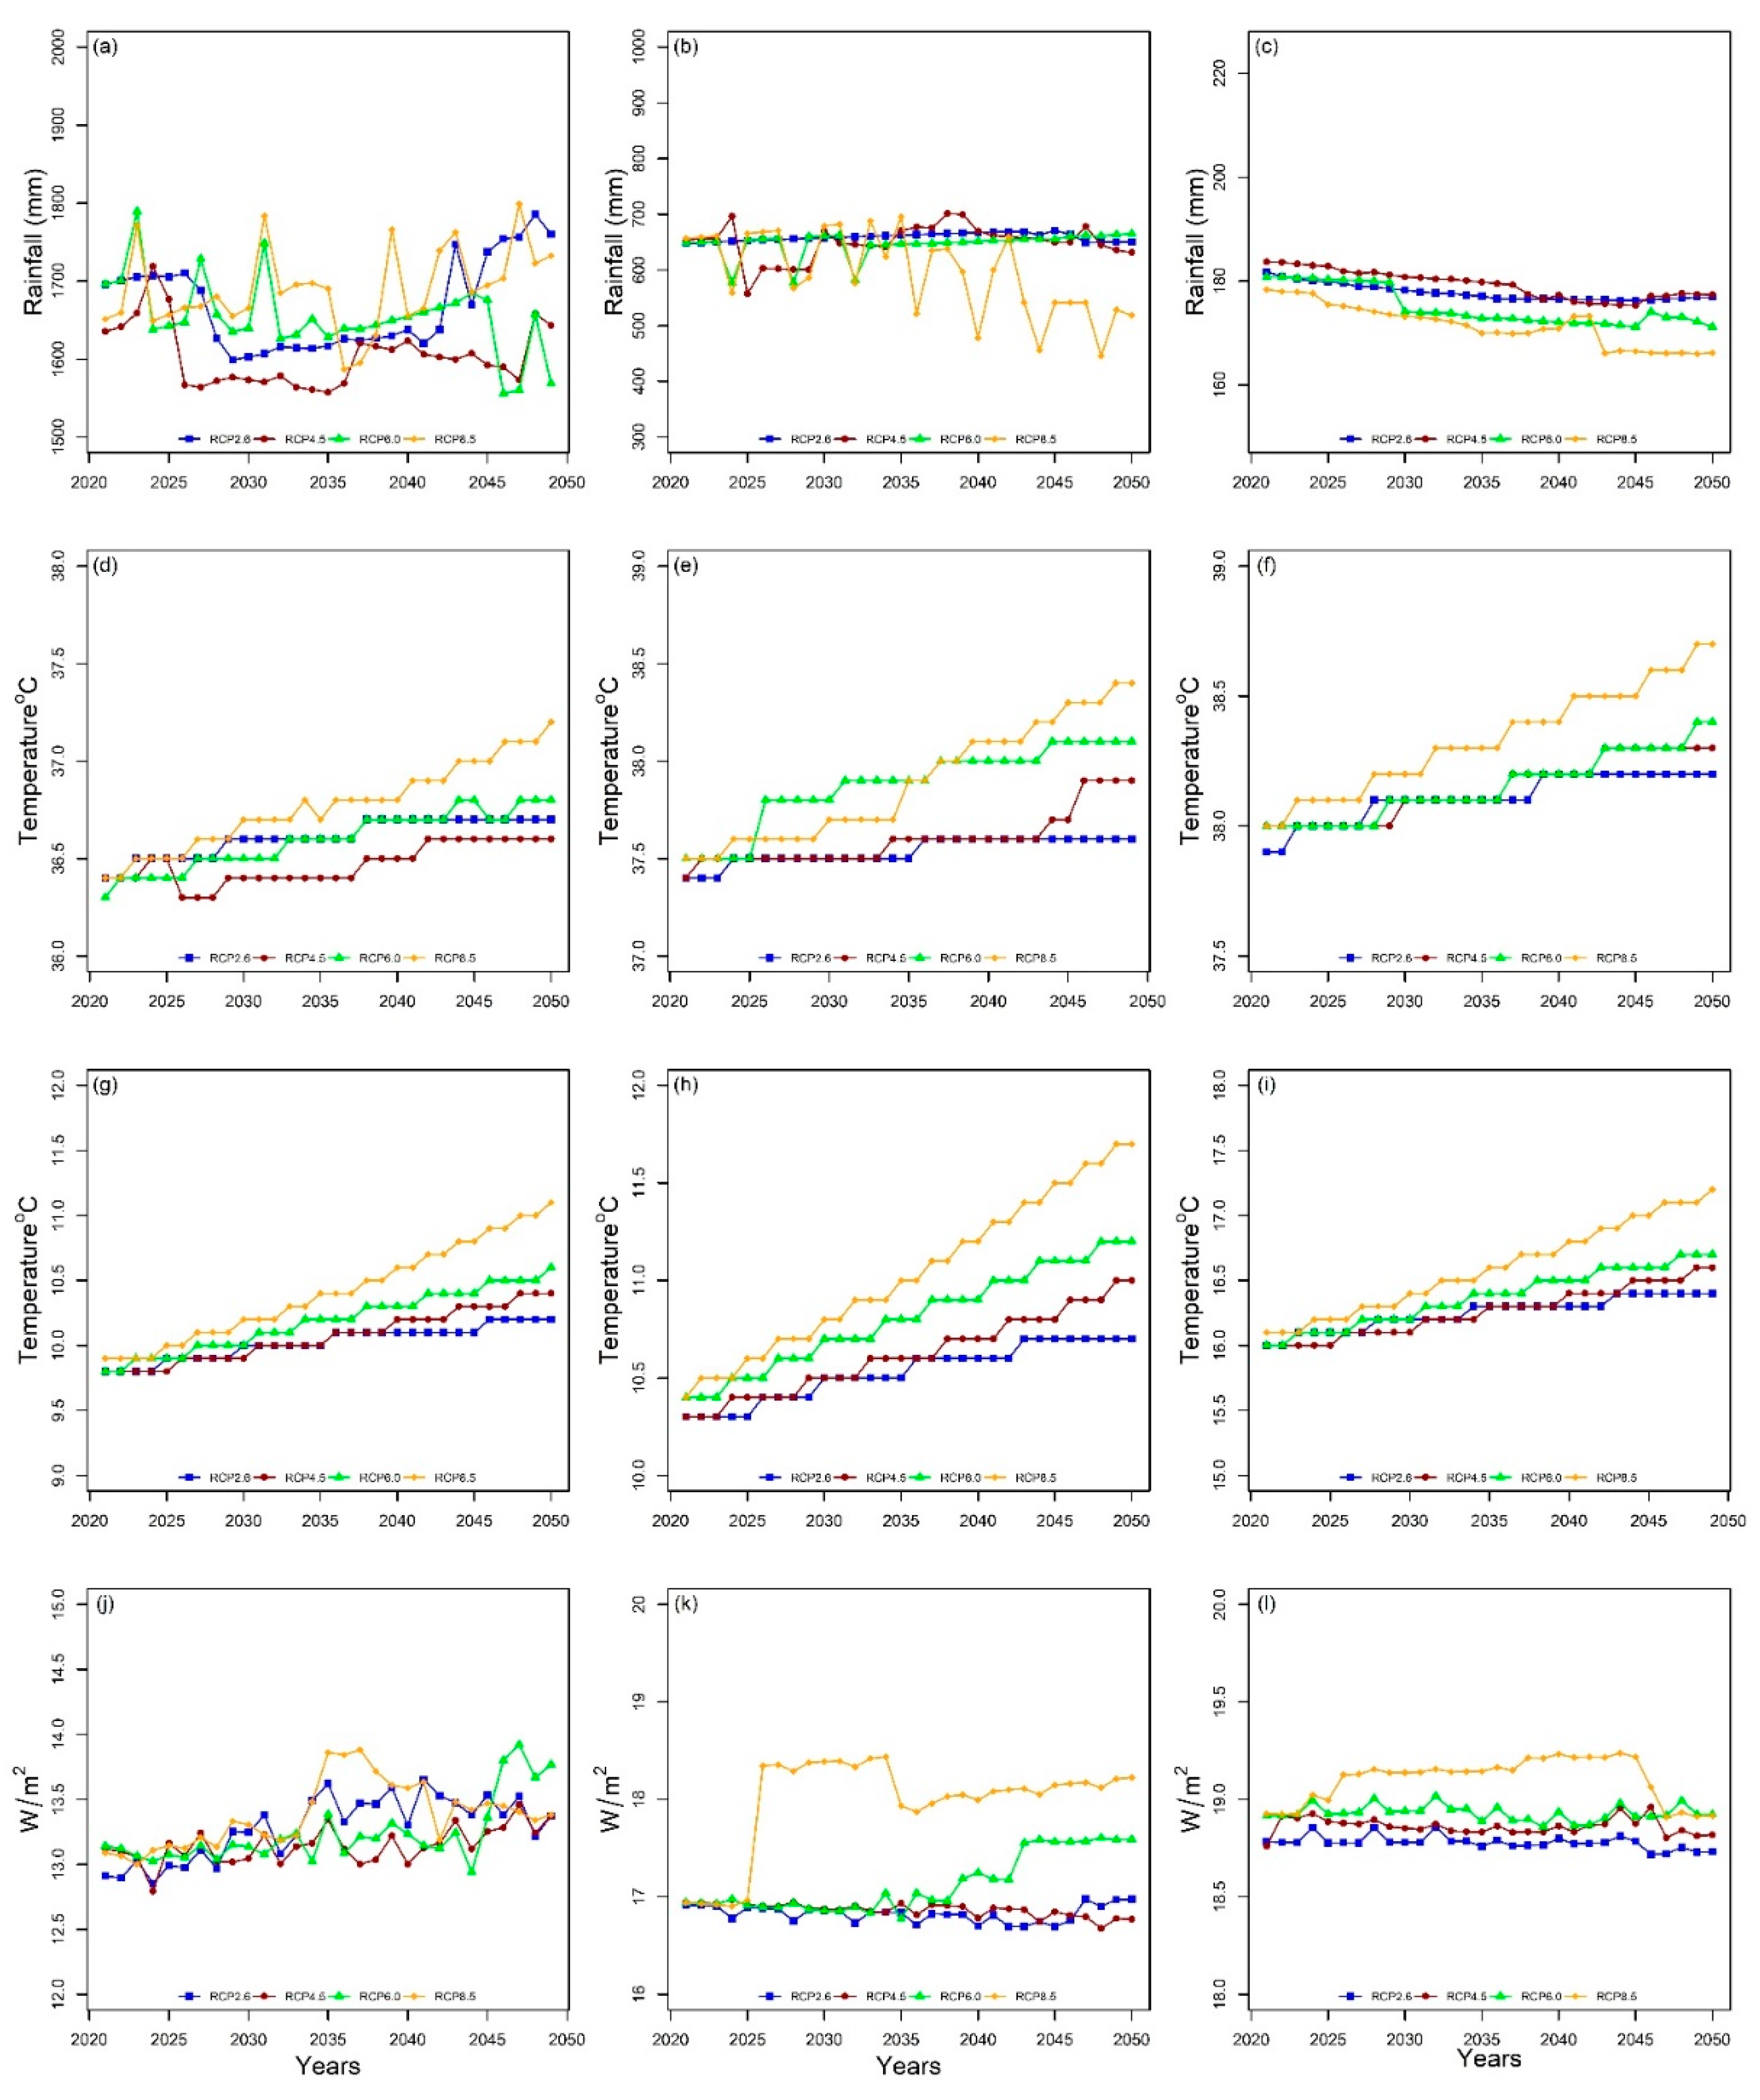
3.1. Future Climate Scenarios

We generated future climate data for RCP 2.6, RCP 4.5, RCP 6.0, and RCP 8.5 using MarkSim@DSSAT weather file generator to predict the crop yield under future climate variability scenarios for our study site. We tested a stringent mitigation scenario (RCP 2.6), two intermediate scenarios (RCP 4.5 and RCP 6.0), and one scenario with very high greenhouse gas emissions (RCP 8.5) representing different levels of emissions. Figure 3 shows the annual mean future climate predictions under these scenarios. The MarkSim weather generator was calibrated from GCMs to match the WorldClim dataset that integrated historical weather data from various databases, including the National Oceanic and Atmospheric Administration, National Climate Data Center, and Global Historical Climatology Network databases, which used stochastic downscaling and climate typing to downscale future climate projections for the IPCC GCM model families using Markov chain regression [33,39].
Future annual Tmax and Tmin in this area are predicted to gradually escalate. For the 2021–2050 period, Tmax is predicted to escalate up to 0.3, 0.4, 0.5, and 0.7 °C, and Tmin is predicted to escalate up to 0.4, 0.7, 0.8, and 1.2 °C under RCP 2.6, RCP 4.5, RCP 6.0, and RCP 8.5, respectively. The annual Tmax and Tmin will vary between 1.3–2.0 °C and 0.6–1.5 °C relative to historical weather data, respectively. The predicted rainfall pattern showed a more significant temporal and spatial variation and is projected to decrease gradually at the end of the 2050s. Rainfall decreased the most under RCP 8.5 scenarios, which gradually decreased from 2021 to 2050. However, future rainfall is predicted to vary widely from 2200 to 2600 mm. Solar radiation will also increase in the future, with the largest incremental change under RCP 8.5. The increase in solar radiation is related to the amount of rainfall: high rainfall periods correspond to low solar radiation.
As mentioned above, the growing season in this area is divided into three seasons: November to February as the wet season, March to June as the first dry season, and July to October as the second dry season. We divided future climate projections into three separate seasons under different scenarios. The highest total rainfall will occur during the wet season due to rainfall starting in the early wet season and will gradually decline the following month. However, the projected rainfall change indicates that precipitation will be more concentrated during the wet season, whereas the dry season tends to be drier. The highest maximum and minimum temperature, as well as the highest solar radiation, all occur during the second dry season. Overall, RCP 8.5 generated all climate variables in comparison with the other scenarios, which corroborate with other studies in which RCP 8.5 reflects the highest greenhouse gas concentrations.

3.2. DSSAT Model Calibration and Validation

We utilized the DSSAT ver. 4.7 model to assess the effect of climate change on future rice yield production. The observed 2007–2012 rice production data were utilized for model calibration and 2013–2017 data for model validation. The DSSAT-CERES-Rice model was calibrated and validated for the rice cultivar (Ciherang) using historical data and GenCalc software. Model calibration determined the genetic coefficient of the rice cultivar (Table 2). Further model details can be found at https://dssat.net/models-overview/ (accessed on 12 February 2021).
The models showed good performance in the calibration and validation periods, respectively: R2 = 0.89 and 0.87 (Table 3), with R2 values of >0.5 considered acceptable [40]; NSE = 0.88 and 0.76, which is within an excellent range; PBIAS values of −0.3 and −1.8 for calibration and validation, respectively, which are excellent; RMSE = 115.52 and 165.85; D-Index = 0.95 and 0.92. The DSSAT-CERES-Rice results were almost identical between the observed and simulated rice yield (Figure 4 and Figure 5). Hence, the DSSAT-CERES-Rice model can be used for estimating future rice production under various climate change scenarios.

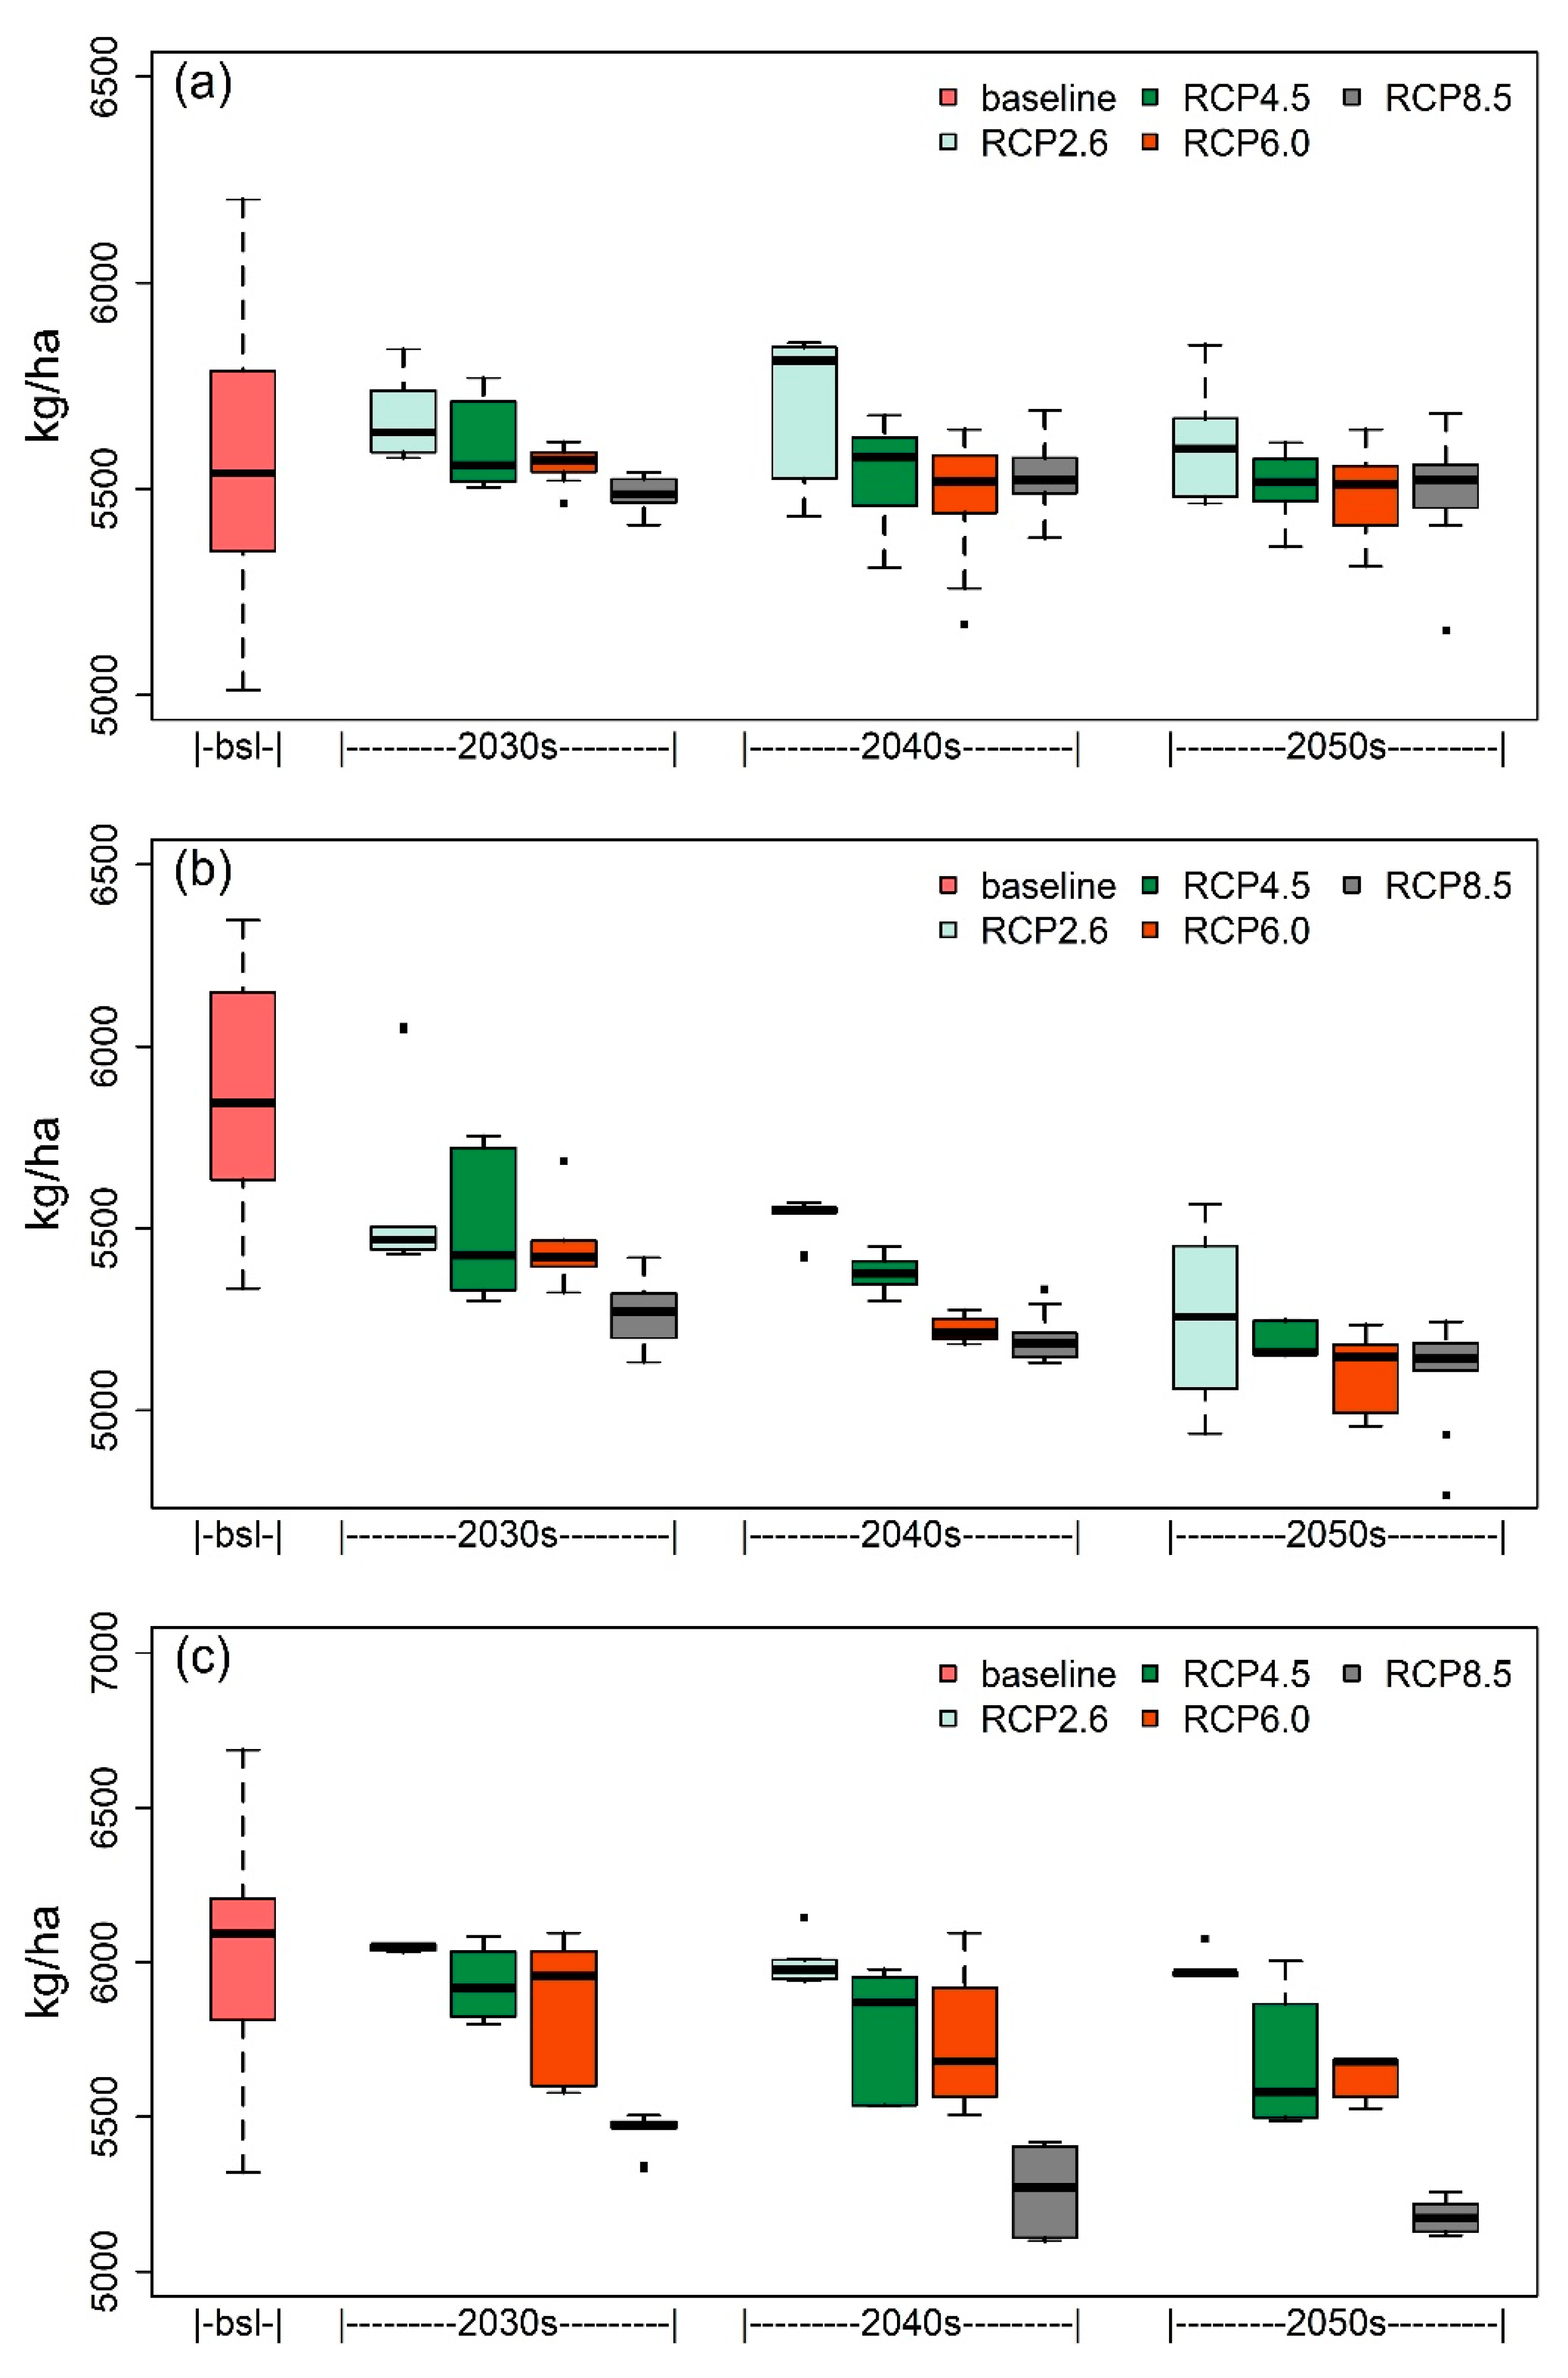
3.3. Future Rice Production

The DSSAT-CERES-Rice model simulated future rice yield using weather data retrieved from MarkSim for all RCPs and the value of rice genotype parameters that were calibrated and validated. For each scenario, we simulated four RCPs for future rice production across three growing seasons, divided into three sections, namely the 2030s (2021–2030), the 2040s (2031–2040), and the 2050s (2041–2050; Figure 6). During the wet season, the average rice production compared to the baseline production decreased slightly by the end of 2050, at 3.81%, 5.84%, 6.62%, and 7.04% for RCP 2.6, RCP 4.5, RCP 6.0, and RCP 8.5, respectively. During the first dry season, the average rice production compared to the baseline production decreased slightly by the end of 2050, at 2.56%, 5.01%, 6.00%, and 7.28% for RCP 2.6, RCP 4.5, RCP 6.0, and RCP 8.5, respectively. During the second dry season, the average rice production compared to the baseline production decreased slightly by the end of 2050, at 2.55%, 3.47%, 4.50%, and 11.77% for RCP 2.6, RCP 4.5, RCP 6.0, and RCP 8.5, respectively.

4. Discussion

The global food demand is rising with increasing global population to levels where the food demand will double by the end of 2050 [41]. Therefore, global agriculture will need to increase rice production, either by increasing the agricultural land area for rice cultivation or by enhancing productivity on existing agricultural lands using appropriate management practices. However, increasing agricultural production will encounter climate change barriers, which directly affect agricultural production by increasing temperature and altering rainfall intensity and frequency. These scenarios can reduce food production by decreasing land production or from crop failure due to drought and flood. Therefore, forecasting future crop production to avoid crop failure by designing and implementing climate change adaptation strategies is crucial for ensuring food security. In this study, we combined the MarkSim daily weather generator with an ensemble output from 17 GCMs and the DSSAT-CERES-Rice model to predict future rice production under different climate change scenarios and determine the probability of adaptive strategies based on climate and crop model results.
The uncertainty of the climate model to produce realistic results can be attributed to the scenario, model, time period, and their predicted number of generations [42]. Several studies have analyzed the uncertainty of climate change on rice production [25,26,43,44,45,46,47,48]. These studies indicated that uncertainty is a major issue for the adaptation of policies and strategies to reduce the impacts of climate change on rice production [25,26,43,44,45,46,47,48]. Uncertainty may arise from various sources, including parameter uncertainty and model uncertainty [46], such as consideration of soil fertility and nutrient uptake in crop models and various SSP-RCP scenarios in climate projections. In this study, because temperature increases were associated with uncertainty in the impact of rainfall on rice production [26], ensemble models with RCP/emission scenarios were employed to eliminate uncertainties associated with climate change projections [43,44]. The ensemble models provide the overall impacts of climate changes in terms of change in rice yields [47]. Moreover, our study generates large projections using 17 GCM models because a large number of GCM projections can be considered a way to overcome certain levels of model uncertainty [49,50]. In our study, the MarkSim results showed that temperatures would increase by 2 °C at the end of the 2050s, as seen in a recent study [51,52]. Increases in the minimum and maximum temperatures have several impacts on rice yield [44]. A large difference between Tmax and Tmin in the study area can lead to vulnerability in rice growth and development; thus, water management is required to prevent crop failure; for example, irrigation water supply may increase rainfed rice yields during the flowering stage [26]. Projected rainfall patterns showed more significant temporal and spatial variation and will decrease gradually by the end of the 2050s. Previous studies reported that future rainfall might increase and decrease in several regions in Indonesia [53], implying that rainfall differs depending on multiple factors, including topography, location, surface sea temperature, and latitude. Similarly, a previous study evaluated the effects of climate change on rainfed rice production in the Songkhram River Basin, Thailand, using the DSSAT-CERES-Rice model, where scenarios under RCP 8.5 showed the largest reduction in rice production [25,26]. Generally, our results suggest that climate change alter in rainfall patterns, temperature increases, and average solar radiation, all of which contribute to reducing rice production across all three growing seasons under different climate scenarios. The results of our study support other relevant studies showing that increasing temperature and changing rainfall frequency and intensity reduce rice production [17]. Moreover, our results corroborate those of previous studies indicating that RCP 8.5 will lead to the largest reduction in rice production.
Natural or social events may also lead to uncertainty in rice production. In this study, there was a significant gap in rice production over the years due to El Nino and La Nina events, which contributed to decreasing rice production due to a lack of water and flooding, significantly influencing crops growth. This is consistent with the findings of previous studies that indicated El Nino and La Nina have negative impacts on rainfall intensity, frequency, and duration as well as rice production, particularly in rainfed ecosystems that are more vulnerable to El Nino [54,55]. El Nino and La Nina are natural events that increase or decrease ocean temperatures, affecting rainfall intensity. El Nino delayed rainfall (leading to less rainfall), whereas La Nina led to higher rainfall. These events increased the variation of the rice production in the baseline period.
The future rice production was assessed based on the ensemble output and the value of rice genetics parameters calibrated and validated through GenCalc software. High rainfall may reduce rice production due to moisture stress [56], severely damaging or even killing rice plants in areas receiving water from precipitation up to 100 mm, according to future rice yield simulations. Further, rainfall frequency affects solar radiation, which is essential for rice growth, especially during the generative stage. Conversely, appropriate drainage management during the wet season is key to reducing moisture stress and avoiding flood events since rainfall intensity is most concentrated in this season [53]. During the first dry season, the decrease in rice production is lower than that during the wet season because during the first dry season, the total rainfall falls within the required water supply range for rice growth. Moreover, the first dry season has the highest number of days without increasing rainfall, although total annual rainfall shows an increasing trend. Increasing the maximum and minimum temperatures may reduce the rice production because they gradually increase during the first dry season until the end of 2050. Overall, the highest reduction in rice production will occur during the second dry season, which supports the results of previous studies [57]. As mentioned above, increasing annual maximum and minimum temperature will be greatest during the second dry season, which directly influences not only growth duration but also growth pattern and rice crop productivity from extreme temperatures (low or high), harming the rice plant. Conversely, solar radiation is an essential driver for biomass production, accumulation, and distribution, but increasing radiation, as well as elevated CO2 concentration, contribute to global climate change [58]. Most crop failure occurs when the plant encounters water stress due to water scarcity and high temperature, especially at the end of the vegetative stage and reproductive stages. Therefore, water availability is a key factor in rice growth, and less water during the early vegetative stage will substantially impact rice growth [59]. Our study showed that the Ciherang variety would face similar problems under climate change scenarios. Thus, policymakers should consider a policy that emphasizes climate adaptation strategies at the farm level to prevent rice shortages, such as irrigation water supply planning during the rice-flowering stage [26]. Moreover, shifting of the rice planting date was studied as an adaptation strategy to reduce the impact of climate change on rice production [60]. Shifting the fertilizer application date was also proposed for rice production under various climate change scenarios [26].
Because climate will be more seasonal and temporal in the future, we have recommended several policies and adaptation strategies that can be encouraged at a farm-scale level in the areas identified in Table 4.
The policies and adaptation strategies to rice production at the farm level help offset negative impacts of climate change and are easily implemented, including shifting planting and transplanting dates, changing the sowing density [61], irrigation management, developing new agricultural areas and using heat-resistant crop varieties [62,63], changing fertilizer application dates, and the dose [26], and reducing tillage and organic amendments [64]. Appropriate adaptation strategies typically differ from one location to another due to regional climate effects, which need to be reviewed [65,66]. Current rice transplanting dates are around the third week of November to the first week of December (wet season), the third week of March to the first week of April (first dry season), and the third week of July to the first week of August (second dry season) [67]. We propose shifting the planting date earlier in the year for all three growing seasons (the fourth week of October to the first week of November for the wet season, the fourth week of February to the first week of March for the first dry season, and the fourth week of June to the first week of July for second dry season), which will coincide with the start of the rainy season in early October. The patterns of future rainfall are predicted to begin earlier; forwarding the planting date will help prevent flooding during the wet season and potential water deficits in the dry season. Therefore, shifting the planting date is important for avoiding crop failure under spatially and temporally variable rainfall patterns. Moreover, implementing appropriate fertilizer management practices, such as improving application frequency and dosage, the number of split doses, number of fertilizers applied per split, and color charts for increasing rice yield per unit area, has become an important factor in increasing rice production [68]. For instance, using N fertilizer that fails to appropriately balance P and K levels negatively affects rice yield, soil quality, and the surrounding environment, as well as increasing the incidence of crop lodging, weed competition, and pest attacks [68,69]. Implementing plant nutrient management (IPNM) [70] may help increase nutrient efficiency in these areas by judiciously manipulating nutrient distribution to preserve and enhance soil fecundity for long-term, sustainable rice productivity [71]. Examples include using fertilizer nutrients as a supplement for nutrients supplied by different organic sources available at farms. Saptutyningsih et al. (2020) reported that farmers with high social capital were willing to adopt adaptation procedures in Indonesia [72]. In addition, educating farmers to adopt adaptation strategies [73] will help bridge the climate change knowledge gap between farmers and researchers [74]. Furthermore, to achieve sustainable agriculture in this area, several strategies can be applied, such as reforestation [75], soil and water conservation practices [76], agroforestry [77], permaculture [78], and crop rotation [79], which can contribute to environmental conservation for better ecosystems and diversity, and the existence of natural resources as life support. Additionally, the development of crop weather insurance is important to protect farmers’ economies. Finally, the dynamic cropping calendar, modernization of irrigation systems, and integrated plant nutrient management plan based on the above adaptation strategies under various climate change scenarios will be helpful for the adaptation of the negative impacts of climate change on rice production.

5. Conclusions

We used combination of the MarkSim daily weather generator and DSSAT-CERES-Rice model to predict future rice yield under different scenarios, which used an ensemble of 17 global climate models under four different RCPs. The projected future climate scenarios under different RCPs consistently showed increasing maximum and minimum temperatures, changing rainfall patterns and variability, and intensifying solar radiation, with RCP 8.5 showing the largest incremental change. Therefore, we proposed the DSSAT-CERES-Rice model, which was successfully calibrated and validated by using historically observed data. It is suitable for simulating future production of the Ciherang rice variety under climate change scenarios. The future rice production decreased for all three growing seasons under all climate change scenarios, with the second dry season showing the greatest reduction of up to 11.77% under RCP 8.5 during the 2050s. Decreased rice production during the wet season mostly occurs due to moisture stress from high rain frequency and intensity. During the first and second dry seasons, we found that increasing temperatures, which reduce rainfall frequency and intensity, as well as intensifying solar radiation, were the major factors that led to the reduction in future rice production. Collectively, based on our results, we proposed policies and strategies for local adaptation to climate change impacts on rice production, which should be validated and developed for farming practices. The impacts of climate change may differ across the world. Therefore, the adaptation to climate changes depends on various climate zones across the world. To reduce uncertainty and enhance the assessment of policies and strategies for reducing the climate change impacts on crop production regionally and locally, it is essential to select appropriate data, models, and parameters.

Author Contributions

A.A. and Y.-P.L. conceived and designed the study framework. The first manuscript draft was written by A.A. and Y.-P.L. A.A., Y.-P.L. and H.-S.L. substantially revised the draft. All authors read the manuscript and contributed to the revisions of the manuscript. The submitted version of the manuscript has been approved by all authors. All authors have read and agreed to the published version of the manuscript.

Funding

National Taiwan University (Nos.NTUCC-107L892608, NTUCC-108L892608) and, Ministry of Science and Technology, R.O.C (110-2321-B-002-017 and 109-2811-M-002-655).

Institutional Review Board Statement

Not applicable.

Informed Consent Statement

Not applicable.

Data Availability Statement

All data used in this study can be found in figures and tables.

Acknowledgments

We would like to thank the Research and Development Technology of Watershed Management under the Ministry of Environment and Forestry Indonesia, the Water Resources Institution under the Ministry of Public Works Indonesia, the Agricultural Department of Wonogiri Regency, Hussnain Mukhtar, Rainer Ferdinand Wunderlich, who have helped in this study.

Conflicts of Interest

The authors declare no conflict of interest.

References

  1. Cai, W.; Santoso, A.; Wang, G.; Yeh, S.-W.; An, S.-I.; Cobb, K.M.; Collins, M.; Guilyardi, E.; Jin, F.-F.; Kug, J.-S. ENSO and greenhouse warming. Nat. Clim. Chang. 2015, 5, 849–859. [Google Scholar] [CrossRef]
  2. Zhai, P.; Zhou, B.; Chen, Y. A review of climate change attribution studies. J. Meteorol. Res. 2018, 32, 671–692. [Google Scholar] [CrossRef]
  3. Marques, É.T.; Gunkel, G.; Sobral, M.C. Management of tropical river basins and reservoirs under water stress: Experiences from Northeast Brazil. Environments 2019, 6, 62. [Google Scholar] [CrossRef] [Green Version]
  4. Wild, M. Solar Radiationsurfacesolar radiationVersus Climate Changesolar radiationversus climate change. In Encyclopedia of Sustainability Science and Technology; Meyers, R.A., Ed.; Springer: New York, NY, USA, 2012; pp. 9731–9740. ISBN 978-1-4419-0851-3. [Google Scholar]
  5. Lehtonen, H.; Liu, X.; Purola, T. Balancing climate change mitigation and adaptation with socio-economic goals at farms in northern Europe. In Climate Change Adaptation and Food Supply Chain Management; Paloviita, A., Järvelä, M., Eds.; Routledge, Taylor & Francis Group: London, UK, 2015; Chapter 11; pp. 132–146. [Google Scholar] [CrossRef]
  6. Nelson, G.C.; Valin, H.; Sands, R.D.; Havlík, P.; Ahammad, H.; Deryng, D.; Elliott, J.; Fujimori, S.; Hasegawa, T.; Heyhoe, E. Climate change effects on agriculture: Economic responses to biophysical shocks. Proc. Natl. Acad. Sci. USA 2014, 111, 3274–3279. [Google Scholar] [CrossRef] [Green Version]
  7. Wassmann, R.; Jagadish, S.V.K.; Heuer, S.; Ismail, A.; Redona, E.; Serraj, R.; Singh, R.K.; Howell, G.; Pathak, H.; Sumfleth, K. Climate change affecting rice production: The physiological and agronomic basis for possible adaptation strategies. Adv. Agron. 2009, 101, 59–122. [Google Scholar]
  8. Hatfield, J.L.; Prueger, J.H. Temperature extremes: Effect on plant growth and development. Weather Clim. Extrem. 2015, 10, 4–10. [Google Scholar] [CrossRef] [Green Version]
  9. Pachauri, R.K.; Allen, M.R.; Barros, V.R.; Broome, J.; Cramer, W.; Christ, R.; Church, J.A.; Clarke, L.; Dahe, Q.; Dasgupta, P. Climate Change 2014: Synthesis Report. Contribution of Working Groups I, II and III to the Fifth Assessment Report of the Intergovernmental Panel on Climate Change; IPCC: Geneva, Switzerland, 2014; ISBN 9291691437. [Google Scholar]
  10. Morgounov, A.; Sonder, K.; Abugalieva, A.; Bhadauria, V.; Cuthbert, R.D.; Shamanin, V.; Zelenskiy, Y.; DePauw, R.M. Effect of climate change on spring wheat yields in North America and Eurasia in 1981-2015 and implications for breeding. PLoS ONE 2018, 13, e0204932. [Google Scholar] [CrossRef]
  11. Gentilucci, M.; D’Aprile, F. Variations in trends of temperature and its influence on tree growth in the Tuscan Apennines. Arab. J. Geosci. 2021, 14, 1–20. [Google Scholar] [CrossRef]
  12. Muthayya, S.; Sugimoto, J.D.; Montgomery, S.; Maberly, G.F. An overview of global rice production, supply, trade, and consumption. Ann. N. Y. Acad. Sci. 2014, 1324, 7–14. [Google Scholar] [CrossRef]
  13. Lal, R. Food security in a changing climate. Ecohydrol. Hydrobiol. 2013, 13, 8–21. [Google Scholar] [CrossRef]
  14. Tilman, D.; Balzer, C.; Hill, J.; Befort, B.L. Global food demand and the sustainable intensification of agriculture. Proc. Natl. Acad. Sci. USA 2011, 108, 20260–20264. [Google Scholar] [CrossRef] [Green Version]
  15. Hoang, L.; Ngoc, T.A.; Maskey, S. A robust parameter approach for estimating CERES-Rice model parameters for the Vietnam Mekong Delta. Field Crop. Res. 2016, 196, 98–111. [Google Scholar] [CrossRef]
  16. Gunning-Trant, C.; Sheng, Y.; Hamshere, P.; Gleeson, T.; Moir, B. What Indonesia Wants Analysis of Indonesia’s Food Demand to 2050; ABARES Res. Rep No. 15.9; Australian Bureau of Agricultural Research Economics: Canberra, Australia, 2015. [Google Scholar]
  17. Yuliawan, T.; Handoko, I. The Effect of Temperature Rise to Rice Crop Yield in Indonesia uses Shierary Rice Model with Geographical Information System (GIS) Feature. Procedia Environ. Sci. 2016, 33, 214–220. [Google Scholar] [CrossRef] [Green Version]
  18. Halder, D.; Kheroar, S.; Srivastava, R.K.; Panda, R.K. Assessment of future climate variability and potential adaptation strategies on yield of peanut and Kharif rice in eastern India. Theor. Appl. Climatol. 2020, 140, 823–838. [Google Scholar] [CrossRef]
  19. Food Security Council. Atlas of Indonesia: Food Securit; Ministry of Agriculture and World Food Programe: Jakarta, Indonesia, 2015; Volume 1, pp. 1–196. [Google Scholar]
  20. Förster, H.; Sterzel, T.; Pape, C.A.; Moneo-Lain, M.; Niemeyer, I.; Boer, R.; Kropp, J.P. Sea-level rise in Indonesia: On adaptation priorities in the agricultural sector. Reg. Environ. Chang. 2011, 11, 893–904. [Google Scholar] [CrossRef]
  21. Bappenas. Indonesia Adaptation Strategy: Improving Capacity to Adapt; Ministry of National Dev.Planning: Jakarta, Indonesia, 2011; Volume 1, pp. 1–39. [Google Scholar]
  22. Barnwal, P.; Kotani, K. Climatic impacts across agricultural crop yield distributions: An application of quantile regression on rice crops in Andhra Pradesh, India. Ecol. Econ. 2013, 87, 95–109. [Google Scholar] [CrossRef]
  23. Food and Agriculture Organization of The United Nations. Resources. In Guidelines: Land Evaluation for Irrigated Agriculture; Soils Bulletin 55; Food & Agriculture Organization: Rome, Italy, 1985. [Google Scholar]
  24. Zaman, N.K.; Abdullah, M.Y.; Othman, S.; Zaman, N.K. Growth and physiological performance of aerobic and lowland rice as affected by water stress at selected growth stages. Rice Sci. 2018, 25, 82–93. [Google Scholar] [CrossRef]
  25. Shrestha, S.; Chapagain, R.; Babel, M.S. Quantifying the impact of climate change on crop yield and water footprint of rice in the Nam Oon Irrigation Project, Thailand. Sci. Total Environ. 2017, 599, 689–699. [Google Scholar] [CrossRef]
  26. Boonwichai, S.; Shrestha, S.; Babel, M.S.; Weesakul, S.; Datta, A. Evaluation of climate change impacts and adaptation strategies on rainfed rice production in Songkhram River Basin, Thailand. Sci. Total Environ. 2019, 652, 189–201. [Google Scholar] [CrossRef] [PubMed]
  27. Alejo, L.A. Assessing the impacts of climate change on aerobic rice production using the DSSAT-CERES-Rice model. J. Water Clim. Chang. 2021, 12, 696–708. [Google Scholar] [CrossRef]
  28. Ansari, A.; Kato, T.; Fitriah, A. Simulating Streamflow Through The SWAT Model in The Keduang Sub-Watershed, Wonogiri Regency, Indonesia. agriTECH 2019, 39, 60–69. [Google Scholar]
  29. Mavromatis, T.; Hansen, J.W. Interannual variability characteristics and simulated crop response of four stochastic weather generators. Agric. For. Meteorol. 2001, 109, 283–296. [Google Scholar] [CrossRef]
  30. Jones, P.G.; Thornton, P.K. The potential impacts of climate change on maize production in Africa and Latin America in 2055. Glob. Environ. Chang. 2003, 13, 51–59. [Google Scholar] [CrossRef]
  31. Thornton, P.K.; Jones, P.G.; Alagarswamy, G.; Andresen, J. Spatial variation of crop yield response to climate change in East Africa. Glob. Environ. Chang. 2009, 19, 54–65. [Google Scholar] [CrossRef]
  32. Claessens, L.; Antle, J.M.; Stoorvogel, J.J.; Valdivia, R.O.; Thornton, P.K.; Herrero, M. A method for evaluating climate change adaptation strategies for small-scale farmers using survey, experimental and modeled data. Agric. Syst. 2012, 111, 85–95. [Google Scholar] [CrossRef] [Green Version]
  33. Jones, P.G.; Thornton, P.K. Generating downscaled weather data from a suite of climate models for agricultural modelling applications. Agric. Syst. 2013, 114, 1–5. [Google Scholar] [CrossRef]
  34. Van Wart, J.; Grassini, P.; Yang, H.; Claessens, L.; Jarvis, A.; Cassman, K.G. Creating long-term weather data from thin air for crop simulation modeling. Agric. For. Meteorol. 2015, 209–210, 49–58. [Google Scholar] [CrossRef]
  35. Hoogenboom, G.; Porter, C.H.; Shelia, V.; Boote, K.J.; Singh, U.; White, J.W.; Hunt, L.A.; Ogoshi, R.; Lizaso, J.I.; Koo, J.; et al. Decision Support System for Agrotechnology Transfer (DSSAT); Version 4.7.5; DSSAT Foundation: Gainesville, FL, USA, 2019; Available online: https://DSSAT.net (accessed on 25 October 2021).
  36. Jones, J.W.; Hoogenboom, G.; Porter, C.H.; Boote, K.J.; Batchelor, W.D.; Hunt, L.A.; Wilkens, P.W.; Singh, U.; Gijsman, A.J.; Ritchie, J.T. The DSSAT cropping system model. Eur. J. Agron. 2003, 18, 235–265. [Google Scholar] [CrossRef]
  37. Hoogenboom, G.; Porter, C.H.; Boote, K.J.; Shelia, V.; Wilkens, P.W.; Singh, U.; White, J.W.; Asseng, S.; Lizaso, J.I.; Moreno, L.P. The DSSAT crop modeling ecosystem. Adv. Crop Model Sustain. Agric. 2019, 173–216. [Google Scholar] [CrossRef]
  38. Buddhaboon, C.; Jintrawet, A.; Hoogenboom, G. Methodology to estimate rice genetic coefficients for the CSM-CERES-Rice model using GENCALC and GLUE genetic coefficient estimators. J. Agric. Sci. 2018, 156, 482–492. [Google Scholar] [CrossRef]
  39. Trotochaud, J.; Flanagan, D.C.; Engel, B.A. A simple technique for obtaining future climate data inputs for natural resource models. Appl. Eng. Agric. 2016, 32, 371–381. [Google Scholar]
  40. Moriasi, D.N.; Arnold, J.G.; Van Liew, M.W.; Bingner, R.L.; Harmel, R.D.; Veith, T.L. Model evaluation guidelines for systematic quantification of accuracy in watershed simulations. Trans. ASABE 2007, 50, 885–900. [Google Scholar] [CrossRef]
  41. Tomlinson, I. Doubling food production to feed the 9 billion: A critical perspective on a key discourse of food security in the UK. J. Rural Stud. 2013, 29, 81–90. [Google Scholar] [CrossRef]
  42. Choudhary, J.S.; Mali, S.S.; Mukherjee, D.; Kumari, A.; Moanaro, L.; Rao, M.S.; Das, B.; Singh, A.K.; Bhatt, B.P. Spatio-temporal temperature variations in MarkSim multimodel data and their impact on voltinism of fruit fly, Bactrocera species on mango. Sci. Rep. 2019, 9, 1–12. [Google Scholar] [CrossRef] [PubMed] [Green Version]
  43. Bregaglio, S.; Hossard, L.; Cappelli, G.; Resmond, R.; Bocchi, S.; Barbier, J.-M.; Ruget, F.; Delmotte, S. Identifying trends and associated uncertainties in potential rice production under climate change in Mediterranean areas. Agric. For. Meteorol. 2017, 237, 219–232. [Google Scholar] [CrossRef]
  44. Prabnakorn, S.; Maskey, S.; Suryadi, F.X.; de Fraiture, C. Rice yield in response to climate trends and drought index in the Mun River Basin, Thailand. Sci. Total Environ. 2018, 621, 108–119. [Google Scholar] [CrossRef]
  45. Boonwichai, S.; Shrestha, S.; Babel, M.S.; Weesakul, S.; Datta, A. Climate change impacts on irrigation water requirement, crop water productivity and rice yield in the Songkhram River Basin, Thailand. J. Clean. Prod. 2018, 198, 1157–1164. [Google Scholar] [CrossRef]
  46. Van Oort, P.A.J.; Zwart, S.J. Impacts of climate change on rice production in Africa and causes of simulated yield changes. Glob. Chang. Biol. 2018, 24, 1029–1045. [Google Scholar] [CrossRef] [Green Version]
  47. Gupta, R.; Mishra, A. Climate change induced impact and uncertainty of rice yield of agro-ecological zones of India. Agric. Syst. 2019, 173, 1–11. [Google Scholar] [CrossRef]
  48. Sloat, L.L.; Davis, S.J.; Gerber, J.S.; Moore, F.C.; Ray, D.K.; West, P.C.; Mueller, N.D. Climate adaptation by crop migration. Nat. Commun. 2020, 11, 1–9. [Google Scholar] [CrossRef] [Green Version]
  49. Moss, R.H.; Edmonds, J.A.; Hibbard, K.A.; Manning, M.R.; Rose, S.K.; Van Vuuren, D.P.; Carter, T.R.; Emori, S.; Kainuma, M.; Kram, T. The next generation of scenarios for climate change research and assessment. Nature 2010, 463, 747–756. [Google Scholar] [CrossRef]
  50. Masutomi, Y.; Takahashi, K.; Harasawa, H.; Matsuoka, Y. Impact assessment of climate change on rice production in Asia in comprehensive consideration of process/parameter uncertainty in general circulation models. Agric. Ecosyst. Environ. 2009, 131, 281–291. [Google Scholar] [CrossRef]
  51. Gosling, S.N.; Dunn, R.; Carrol, F.; Christidis, N.; Fullwood, J.; de Gusmao, D.; Golding, N.; Good, L.; Hall, T.; Kendon, L.; et al. Climate: Observations, Projections and Impacts; MetOffice. Nottingham ePrints: Nottingham, UK, 2011; Volume 1, pp. 1–147. [Google Scholar]
  52. Ministry of Foreign Affairs of the Netherlands. Climate Change Profile: Indonesia; Ministry of Foreign Affairs of the Netherlands: The Hague, The Netherlands, 2018; Volume 14. [Google Scholar]
  53. Boer, R.; Faqih, A.; Naylor, R.L.; Battisti, D.S.; Vimont, D.J.; Falcon, W.P.; Burke, M.B. Current and Future Rainfall Variability in Indonesia; An Integrated Assessment of Climate Change Impacts, Adaptation and Vulnerability in Watershed Areas and Communities in Southeast Asia. Report from AIACC Project No AS21; Int. START Secr: Washington, DC, USA, 2004; Volume 104, p. 47. [Google Scholar]
  54. King, A.D.; van Oldenborgh, G.J.; Karoly, D.J. 22. Climate change and el niño increase likelihood of indonesian heat and drought. Bull. Am. Meteorol. Soc. 2016, 97, S113–S117. [Google Scholar] [CrossRef]
  55. Setiawan, A.M.; Lee, W.S.; Rhee, J. Spatio-temporal characteristics of Indonesian drought related to El Niño events and its predictability using the multi-model ensemble. Int. J. Climatol. 2017, 37, 4700–4719. [Google Scholar] [CrossRef]
  56. Das, H.P.; Adamenko, T.I.; Anaman, K.A.; Gommes, R.G.; Johnson, G. Agrometeorology Related to Extreme Events; Technical Note 201; WMO, No 943; WMO: Geneva, Switzerland, 2003; p. 152. ISBN 9263109435. [Google Scholar]
  57. Candradijaya, A.; Kusmana, C.; Syaukat, Y.; Syaufina, L.; Faqih, A. Climate change impact on rice yield and adaptation response of local farmers in Sumedang District, West Java, Indonesia. Int. J. Ecosyst. 2014, 4, 212–223. [Google Scholar]
  58. Zhang, H.; Zhou, G.; Liu, D.L.; Wang, B.; Xiao, D.; He, L. Climate-associated rice yield change in the Northeast China Plain: A simulation analysis based on CMIP5 multi-model ensemble projection. Sci. Total Environ. 2019, 666, 126–138. [Google Scholar] [CrossRef]
  59. Turral, H.; Burke, J.; Faurès, J.-M. Climate Change, Water and Food Security; FAO Water Report No. 36; Food and Agriculture Organization of the United Nations: Rome, Italy, 2011; ISBN 9251067953. Available online: http://0-go-nature-com.brum.beds.ac.uk/FSSnjq (accessed on 25 October 2021).
  60. Dharmarathna, W.; Herath, S.; Weerakoon, S.B. Changing the planting date as a climate change adaptation strategy for rice production in Kurunegala district, Sri Lanka. Sustain. Sci. 2014, 9, 103–111. [Google Scholar] [CrossRef]
  61. Parry, M.L. Assessment of Potential Effects and Adaptations for Climate Change in Europe: Summary and Conclusions; Jackson Environment Institute, University of East Anglia: Norwich, UK, 2000. [Google Scholar]
  62. Babel, M.S.; Turyatunga, E. Evaluation of climate change impacts and adaptation measures for maize cultivation in the western Uganda agro-ecological zone. Theor. Appl. Climatol. 2015, 119, 239–254. [Google Scholar] [CrossRef]
  63. Rosenzweig, C.; Tubiello, F.N. Adaptation and mitigation strategies in agriculture: An analysis of potential synergies. Mitig. Adapt. Strateg. Glob. Chang. 2007, 12, 855–873. [Google Scholar] [CrossRef] [Green Version]
  64. Chopin, P.; Sierra, J. Reduced tillage and organic amendments can offset the negative impact of climate change on soil carbon: A regional modelling study in the Caribbean. Soil Tillage Res. 2019, 192, 113–120. [Google Scholar] [CrossRef]
  65. Bryan, E.; Deressa, T.T.; Gbetibouo, G.A.; Ringler, C. Adaptation to climate change in Ethiopia and South Africa: Options and constraints. Environ. Sci. Policy 2009, 12, 413–426. [Google Scholar] [CrossRef]
  66. Tao, F.; Zhang, Z. Adaptation of maize production to climate change in North China Plain: Quantify the relative contributions of adaptation options. Eur. J. Agron. 2010, 33, 103–116. [Google Scholar] [CrossRef]
  67. Apriyana, Y.; Surmaini, E.; Estiningtyas, W.; Pramudia, A.; Ramadhani, F.; Suciantini, S.; Susanti, E.; Purnamayani, R.; Syahbuddin, H. The Integrated Cropping Calendar Information System: A Coping Mechanism to Climate Variability for Sustainable Agriculture in Indonesia. Sustainability 2021, 13, 6495. [Google Scholar] [CrossRef]
  68. Guo, J.; Hu, X.; Gao, L.; Xie, K.; Ling, N.; Shen, Q.; Hu, S.; Guo, S. The rice production practices of high yield and high nitrogen use efficiency in Jiangsu, China. Sci. Rep. 2017, 7, 1–10. [Google Scholar] [CrossRef] [PubMed]
  69. Li, Z.; Zhang, R.; Xia, S.; Wang, L.; Liu, C.; Zhang, R.; Fan, Z.; Chen, F.; Liu, Y. Interactions between N, P and K fertilizers affect the environment and the yield and quality of satsumas. Glob. Ecol. Conserv. 2019, 19, e00663. [Google Scholar] [CrossRef]
  70. Alley, M.M.; Vanlauwe, B. The Role of Fertilizers in Integrated Plant Nutrient Management. In International Fertilizer Industry Association, 1st ed.; IFA: Paris, France; TSBF-CIAT: Nairobi, Kenya, 2009; ISBN 2952313946. [Google Scholar]
  71. Chauhan, B.S.; Jabran, K.; Mahajan, G. Rice Production Worldwide; Springer: Berlin, Germany, 2017; Volume 247. [Google Scholar]
  72. Saptutyningsih, E.; Diswandi, D.; Jaung, W. Does social capital matter in climate change adaptation? A lesson from agricultural sector in Yogyakarta, Indonesia. Land Use Policy 2020, 95, 104189. [Google Scholar] [CrossRef]
  73. Akrofi, M.M.; Antwi, S.H.; Gumbo, J.R. Students in climate action: A study of some influential factors and implications of knowledge gaps in Africa. Environments 2019, 6, 12. [Google Scholar] [CrossRef] [Green Version]
  74. Roesch-McNally, G.E. US Inland Pacific Northwest wheat farmers’ perceived risks: Motivating intentions to adapt to climate change? Environments 2018, 5, 49. [Google Scholar] [CrossRef] [Green Version]
  75. Ota, L.; Herbohn, J.; Gregorio, N.; Harrison, S. Reforestation and smallholder livelihoods in the humid tropics. Land Use Policy 2020, 92, 104455. [Google Scholar] [CrossRef]
  76. Sharma, S.; Dhaliwal, S.S. Conservation agriculture based practices enhanced micronutrients transformation in earthworm cast soil under rice-wheat cropping system. Ecol. Eng. 2021, 163, 106195. [Google Scholar] [CrossRef]
  77. Li, M.; Li, H.; Fu, Q.; Liu, D.; Yu, L.; Li, T. Approach for optimizing the water-land-food-energy nexus in agroforestry systems under climate change. Agric. Syst. 2021, 192, 103201. [Google Scholar] [CrossRef]
  78. Suh, J. Theory and reality of integrated rice—Duck farming in Asian developing countries: A systematic review and SWOT analysis. Agric. Syst. 2014, 125, 74–81. [Google Scholar] [CrossRef]
  79. Chen, S.; Liu, S.; Zheng, X.; Yin, M.; Chu, G.; Xu, C.; Yan, J.; Chen, L.; Wang, D.; Zhang, X. Effect of various crop rotations on rice yield and nitrogen use efficiency in paddy–upland systems in southeastern China. Crop J. 2018, 6, 576–588. [Google Scholar] [CrossRef]
Figure 1. The study site for the rice production areas is Gemawang, Girimarto District, Wonogiri Regency, Central Java, Indonesia.
Environments 08 00117 g001
Figure 2. The methodological framework for assessing future rice yield.
Environments 08 00117 g002
Figure 3. Future climate predictions under different scenarios for (a) maximum temperature, (b) minimum temperature, (c) annual rainfall, and (d) solar radiation.
Environments 08 00117 g003
Figure 4. Future climate predictions under different scenarios in the wet season (left column), the first dry season (middle column), and the second dry season (right column). (a) Maximum temperature in the wet season, (b) minimum temperature in the wet season, (c) annual rainfall in the wet season, (d) solar radiation in the wet season, (e) maximum temperature in the first dry season, (f) minimum temperature in the first dry season, (g) annual rainfall in the first dry season, (h) solar radiation in the first dry season, (i) maximum temperature in the second dry season, (j) minimum temperature in the second dry season, (k) annual rainfall in the second dry season, and (l) solar radiation in the second dry season.
Environments 08 00117 g004
Figure 5. (a) Calibration and (b) validation of DSSAT-CERES-Rice.
Environments 08 00117 g005
Figure 6. Future rice production under climate change scenarios in three different growing seasons: (a) wet season, (b) first dry season, and (c) second dry season.
Environments 08 00117 g006
Table 1. The value ranges of rice genotype parameters for calibration [15,35,38].
ParameterDefinitionRange
Phenology genetic coefficients
P1The time from seedling to emergence in °C (more than 9 °C from base temperature), during which rice will not respond to changes in photoperiod. (unit: GDD)100–900
P2OCrucial photoperiod or the longest day length when peak development occurs (unit: h)10–14
P2RThe sensitive extent of each hour increase in photoperiod (>P2O) to delay phasic development causing panicle initiation. (unit: GDD)20–600
P5The time from the beginning of grain filling to physiological maturity, which is >9 °C from the base temperature (unit: GDD)100–900
Growth genetic coefficients
G1The potential maximum spikelet number coefficient per g of main culm dry weight (unit: spikelets per g of main culm)35–80
G2The weight of a single grain under suitable growing conditions (unit: g)0.02–0.04
G3Scalar vegetative growth coefficient for tillering coefficients relative to IR640.6–1.2
G4The coefficient of temperature scalar. The value is equal to 1 for varieties grown in normal conditions, >1 for varieties grown in warmer conditions, and <1 for varieties grown in cold conditions. 0.6–1.2
Table 2. The genetic coefficient for Ciherang rice variety.
ParameterValue
P1388.3
P2R137.7
P5408.3
P2O12.31
G174.2
G20.027
G31.198
G41
Table 3. DSSAT model performance for the Ciherang rice variety.
PeriodYearRice Yield (kg/ha)R2NSEPBIASRMSE (kg/ha)D-Index
ObservationSimulation
Calibration2007–20125665.395650.940.890.88−0.3115.520.97
Validation2013–20175949.406007.730.870.76−1.8165.850.95
Table 4. Recommended policies and adaptation strategies.
PoliciesAdaptation Strategies
Preserving the balance of ecosystems and diversity and the existence of natural resources as a life support
  • Reforestation
  • Soil and water conservation practices
  • Agroforestry
  • Permaculture
  • Crop rotation
Applying appropriate technologies
  • Dynamic crop calendar
  • Use heat-resistant crop varieties
  • Reduce tillage
  • Increase fertilizer efficiency through appropriate application date and dose
  • Implement plant nutrient management
  • Organic amendments
Modernization of irrigation systems
  • Excavation of ponds
  • Retention of rainwater in canals
  • Extension of irrigation area
  • Evolution of irrigation price policy
Crop weather insurance
  • Development of a farming protection system from failure due to climate change
Publisher’s Note: MDPI stays neutral with regard to jurisdictional claims in published maps and institutional affiliations.

