Proceeding Paper

Development of an IoT System for the Generation of a Database of Residential Water End-Use Consumption Time Series †

by
Anna Di Mauro
*,
Armando Di Nardo
,
Giovanni Francesco Santonastaso
and
Salvatore Venticinque
Dipartimento di Ingegneria, Università degli Studi della Campania Luigi Vanvitelli, 81031 Aversa, Italy
*
Author to whom correspondence should be addressed.
Presented at the 4th EWaS International Conference: Valuing the Water, Carbon, Ecological Footprints of Human Activities, Online, 24–27 June 2020.
Published: 13 August 2020

Abstract

:
Disaggregation techniques are useful to separate data aggregated into single end-use categories, and they are becoming of great interest in the water sector due to the technological innovation in metering systems that has made water consumption data available. However, in order to apply disaggregation methods, high-resolution data at the end-use level are needed. To face this problem, the paper presents an Internet of Things water end-use monitoring system that is able to read real-time end-use consumption in a residential apartment equipped as a pilot site. Moreover, the paper describes preliminary consideration of the dataset and the potentiality of end-use consumption measures to apply disaggregation techniques and profile users’ behaviors.

1. Introduction

Advancement in metering and data communication technologies has promoted the use of high-resolution smart meters in several domains. In the field of water, the possibility to record water consumption at the household level through smart water meters (SWMs) represents a key role for a smart management of water distribution networks [1]. In fact, household water usage data can support water utilities in decision-making processes with innovative involvement in demand forecasting, leak detection, water network modeling, users’ awareness, etc. [2].
However, the household level is not enough to understand the way water is used in domestic environments. Both traditional and SWMs detect water usage at the household level and do not provide real-time water end-use consumption data that would enable understanding users’ behaviors and support water utilities to design demand-side management strategies, [3,4].
As reported in [5,6], promoting a more efficient water use by making customers aware of their consumption can improve water conservation attitudes, management policy, and water services infrastructure planning activities. Therefore, user profiling has gained importance in the field of recommendation systems and customer relationship management [7], and various profiling techniques have evolved thanks to the advance of data mining and machine learning technologies. As a result, a comprehensive variety of artificial intelligence techniques have been used for user profiling in several sectors, such as content-based methods [8], classification, clustering algorithm [9], and genetic algorithm [10], among others.
Despite metering evolution, existing water big data are not sufficient to benefit from this approach in the water sector. In fact, SWMs generally installed at the water mains provide aggregate data of water usage that need to be disaggregated to get single end-use categories. Machine learning techniques, such as i.e., disaggregation, require high-resolution data generally generated synthetically due to the lack of low cost and non-intrusive sensing infrastructure able to be installed on water fixtures (i.e., shower, toilet, tap, etc.).
To this purpose, in order to obtain a database at end-use level, an Internet of Things (IoT) water end-use monitoring system able to read real-time water end-use consumption in a residential apartment [11] was developed. The paper describes briefly the IoT solution already developed and its installation on the water fixtures of a real apartment used as a pilot site. Moreover, it presents the progress in data collection and the database produced after 8 months of operations with some preliminary considerations on collected data. Finally, the paper shows the potentiality of applying disaggregation techniques on a database of real water end-use consumption in order to identify how the data of single end-use categories could be used to profile users and to analyze residential water usage. The application is still ongoing, and this paper, starting from the authors’ previous work [11], represents an advance of this study with a particular focus on the relevance of disaggregated data for user profiling.

2. Materials and Methods

In the last decade, several water end-use studies, such as [12,13,14], highlighted the importance of end-use data for several purpose, as:
  • Understanding the average and peak end-use water consumption volumes of different fixtures (shower, toilet, etc.) at hourly, daily, and monthly levels of resolution to improve planning processes;
  • Evaluating daily water end-use patterns to identify trends and peaks in water consumption throughout time;
  • Providing updated information on demand per capita that are not evaluable with traditional methods, which do not take into account social changes over time;
  • Examining peak day demand to understand the types of household practices that drive peak usage; and
  • Evaluating the seasonal impact of water usage.
In the water sector, disaggregation algorithms and user profiling are mostly performed using end-use data obtained through measurement collected with specific experimental testing and/or research projects that are rarely shared for privacy policy [15,16,17]. Otherwise, data are also produced using a stochastic simulation model for synthetically generating high-resolution time series of water use at the end-use level [18,19].
Taking into account the main aspects that have emerged on the topic, the application presented in this paper aims to show how the availability of real water end-use consumption can contribute to fill the gap in domestic data, producing significant information about users’ behaviors. Furthermore, the generated repository could provide fixtures’ signatures that are useful for applying a disaggregation technique and calibrating a synthetic model. In fact, as reported in [20], a disaggregation algorithm need end-use information to be tested and improved; as well, synthetic simulation models need single event trace to characterize end-use fixtures in residential environments.
Therefore, an open repository of real end-use water demand could be of great interest to improve the water fixtures signature used to train synthetic models and to apply innovative machine learning techniques to disaggregate household data [21].
To face the limited availability of open data at the end-use level, this paper contributes to all the setting steps for deployment and releases an open repository of water end-use consumption.

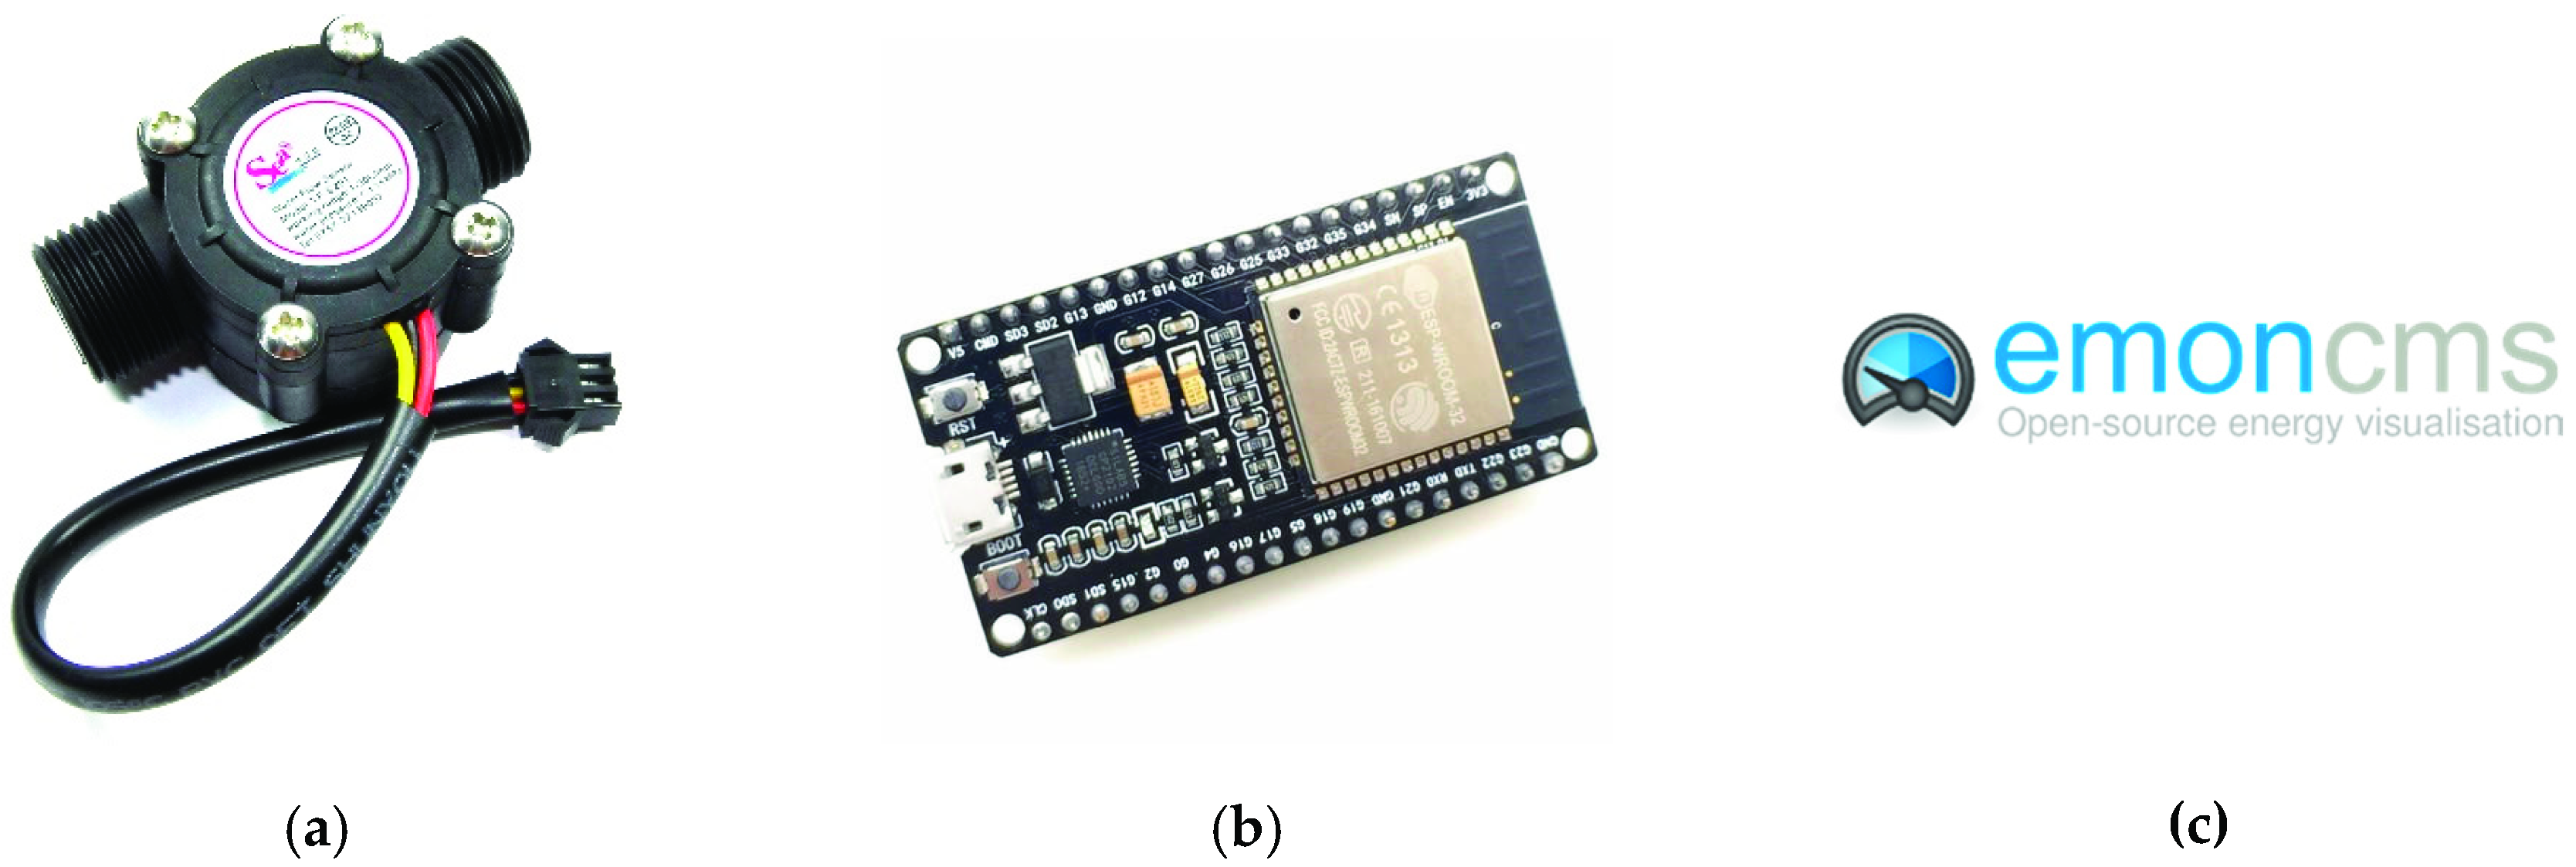
2.1. IoT Monitoring System Architecture

The design of the IoT water end-use monitoring system is made up of a flow sensor, a micro-controller, and a Content Management System (CMS), which carry out a data collection platform and integrate basic processing and visualization commands, as shown in Figure 1 [11].
The sensor YF-S201 allows for the measurement of the quantity of water passing through it, counting the electrical pulses emitted for each revolution. The electrical signal is sent to the microcontroller ESP-32, which is a low-power system on chip with both Wi-Fi and Bluetooth communication interfaces. The ESP32 has been programmed to read the output pulses coming from the YF-S201 and to upload data detected to the EmonCMS open-source platform able to store, visualize, and monitor the data.
The metering system has a direct connection to the Internet through the Wi-Fi home gateway. Water end-use consumption is detected in real time, processed, and uploaded to a remote server of the University of Naples “Luigi Vanvitelli” via HTTP.

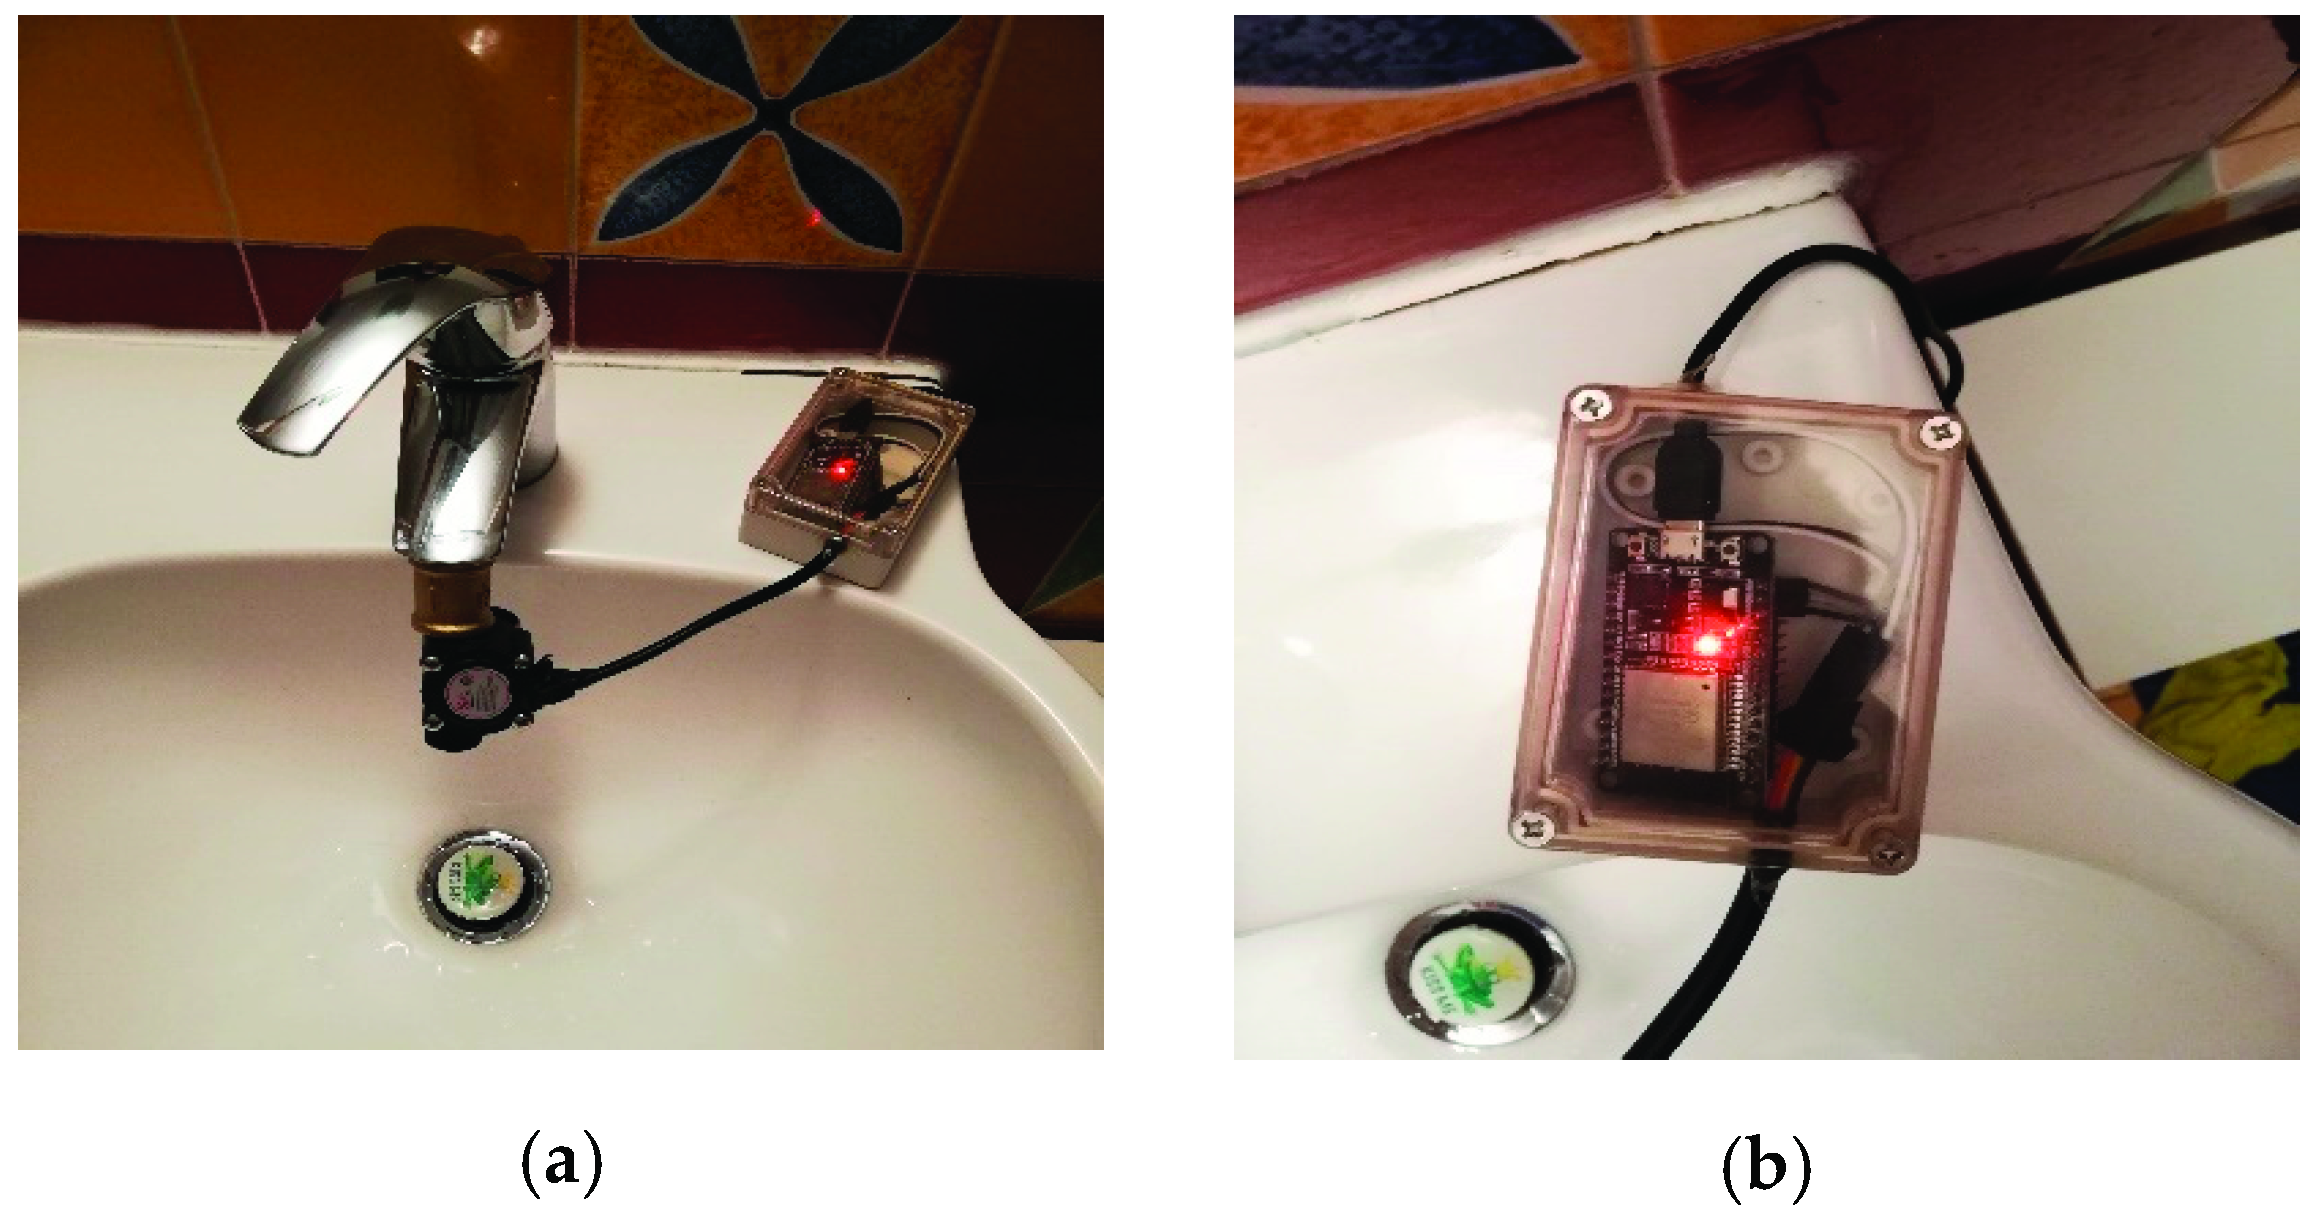
2.2. Case Study Setup

The case study is settled in a residential apartment sited in Naples, Italy. The apartment has 1 inhabitant and has 7 fixtures: kitchen faucet, toilet, shower, washbasin, bidet, washing machine, and dishwasher. The IoT system developed was installed on all the fixtures in the apartment except for the toilet and dishwasher due to space constraints, as shown in Figure 2
The system is programmed with an interrupt service routine to count the YF-S201 pulses in a time slot of 1 s. When the water flow is 0 for more than 5 s, the micro-controller switches to stand-by mode and wakes up at the next pulse. During the stand-by mode, a value of water flow equal to 0 is sent to the CMS every 5 min.
To detect water consumption from the flush toilet and dishwasher, an open source app configured to send to the EmonCMS flush toilet cistern capacity value and dishwasher water use per cycle was used. It was installed on the user’s smartphone and allows defining button shortcuts to manually invoke HTTP hyperlinks.

2.3. Data Collection

Data collection started from 1st March and is still ongoing. To date, the dataset includes 8 months of measurements, from 1st March to 30th October 2019 (data reported in this paper).
The choice of one inhabitant is related to better understand use overlap and limitations of the method that can be improved for the application in more complex configurations (i.e., different kinds of buildings with different numbers of occupants).
The database contains 35 weeks with 245 days of high-resolution end-use data, which was collected for each fixture, with around 400,000 data. Water consumption is expressed in milliliters per second and has 1 s resolution. Each meter is identified on the EmonCMS platform as a Key node, called a feed, which is able to hoard the water flow of each specific fixture. Every row in each of the dataset files represents a single meter reading once every second with an associated unix timestamp. This integer timestamp is the amount of seconds since 1970-01-01 00:00:00 (UTC). As described in Section 2.2, the time series of data are stored through the platform EmonCMS that allows some preliminary real-time visualization of the date as instantaneous, daily, and total end-use consumption per fixture.
Furthermore, a raw time series of end-use consumption, for every feed, can be downloaded in csv format for different time ranges and intervals. The database realized will be made available in the near future for the scientific community.

3. Results

In this section, some outputs that can be obtained using a database of real water end-use consumption are shown and discussed. The direct output of the application consists of high-resolution end-use time series of water use for each fixture of a residential apartment.
A preliminary analysis of data exhibits valuable information about users’ consumption behaviors. Statistical evaluation and summary measures are used to analyze the data collected for different fixtures. Water use distribution across months, weeks, and days is evaluated. Each time series has been processed to identify single usages of the related fixture, filtering anomalies and outliers. The usage, as a single event, is characterized by the amount of water consumed, the duration of use, and by the hour and the day of the week on which that event occurred.
Afterward, a statistical analysis on the resulting dataset has been carried on in order to investigate the users’ behavior.
The heterogeneity of consumption behaviors given by the end-use statistic allows some considerations:
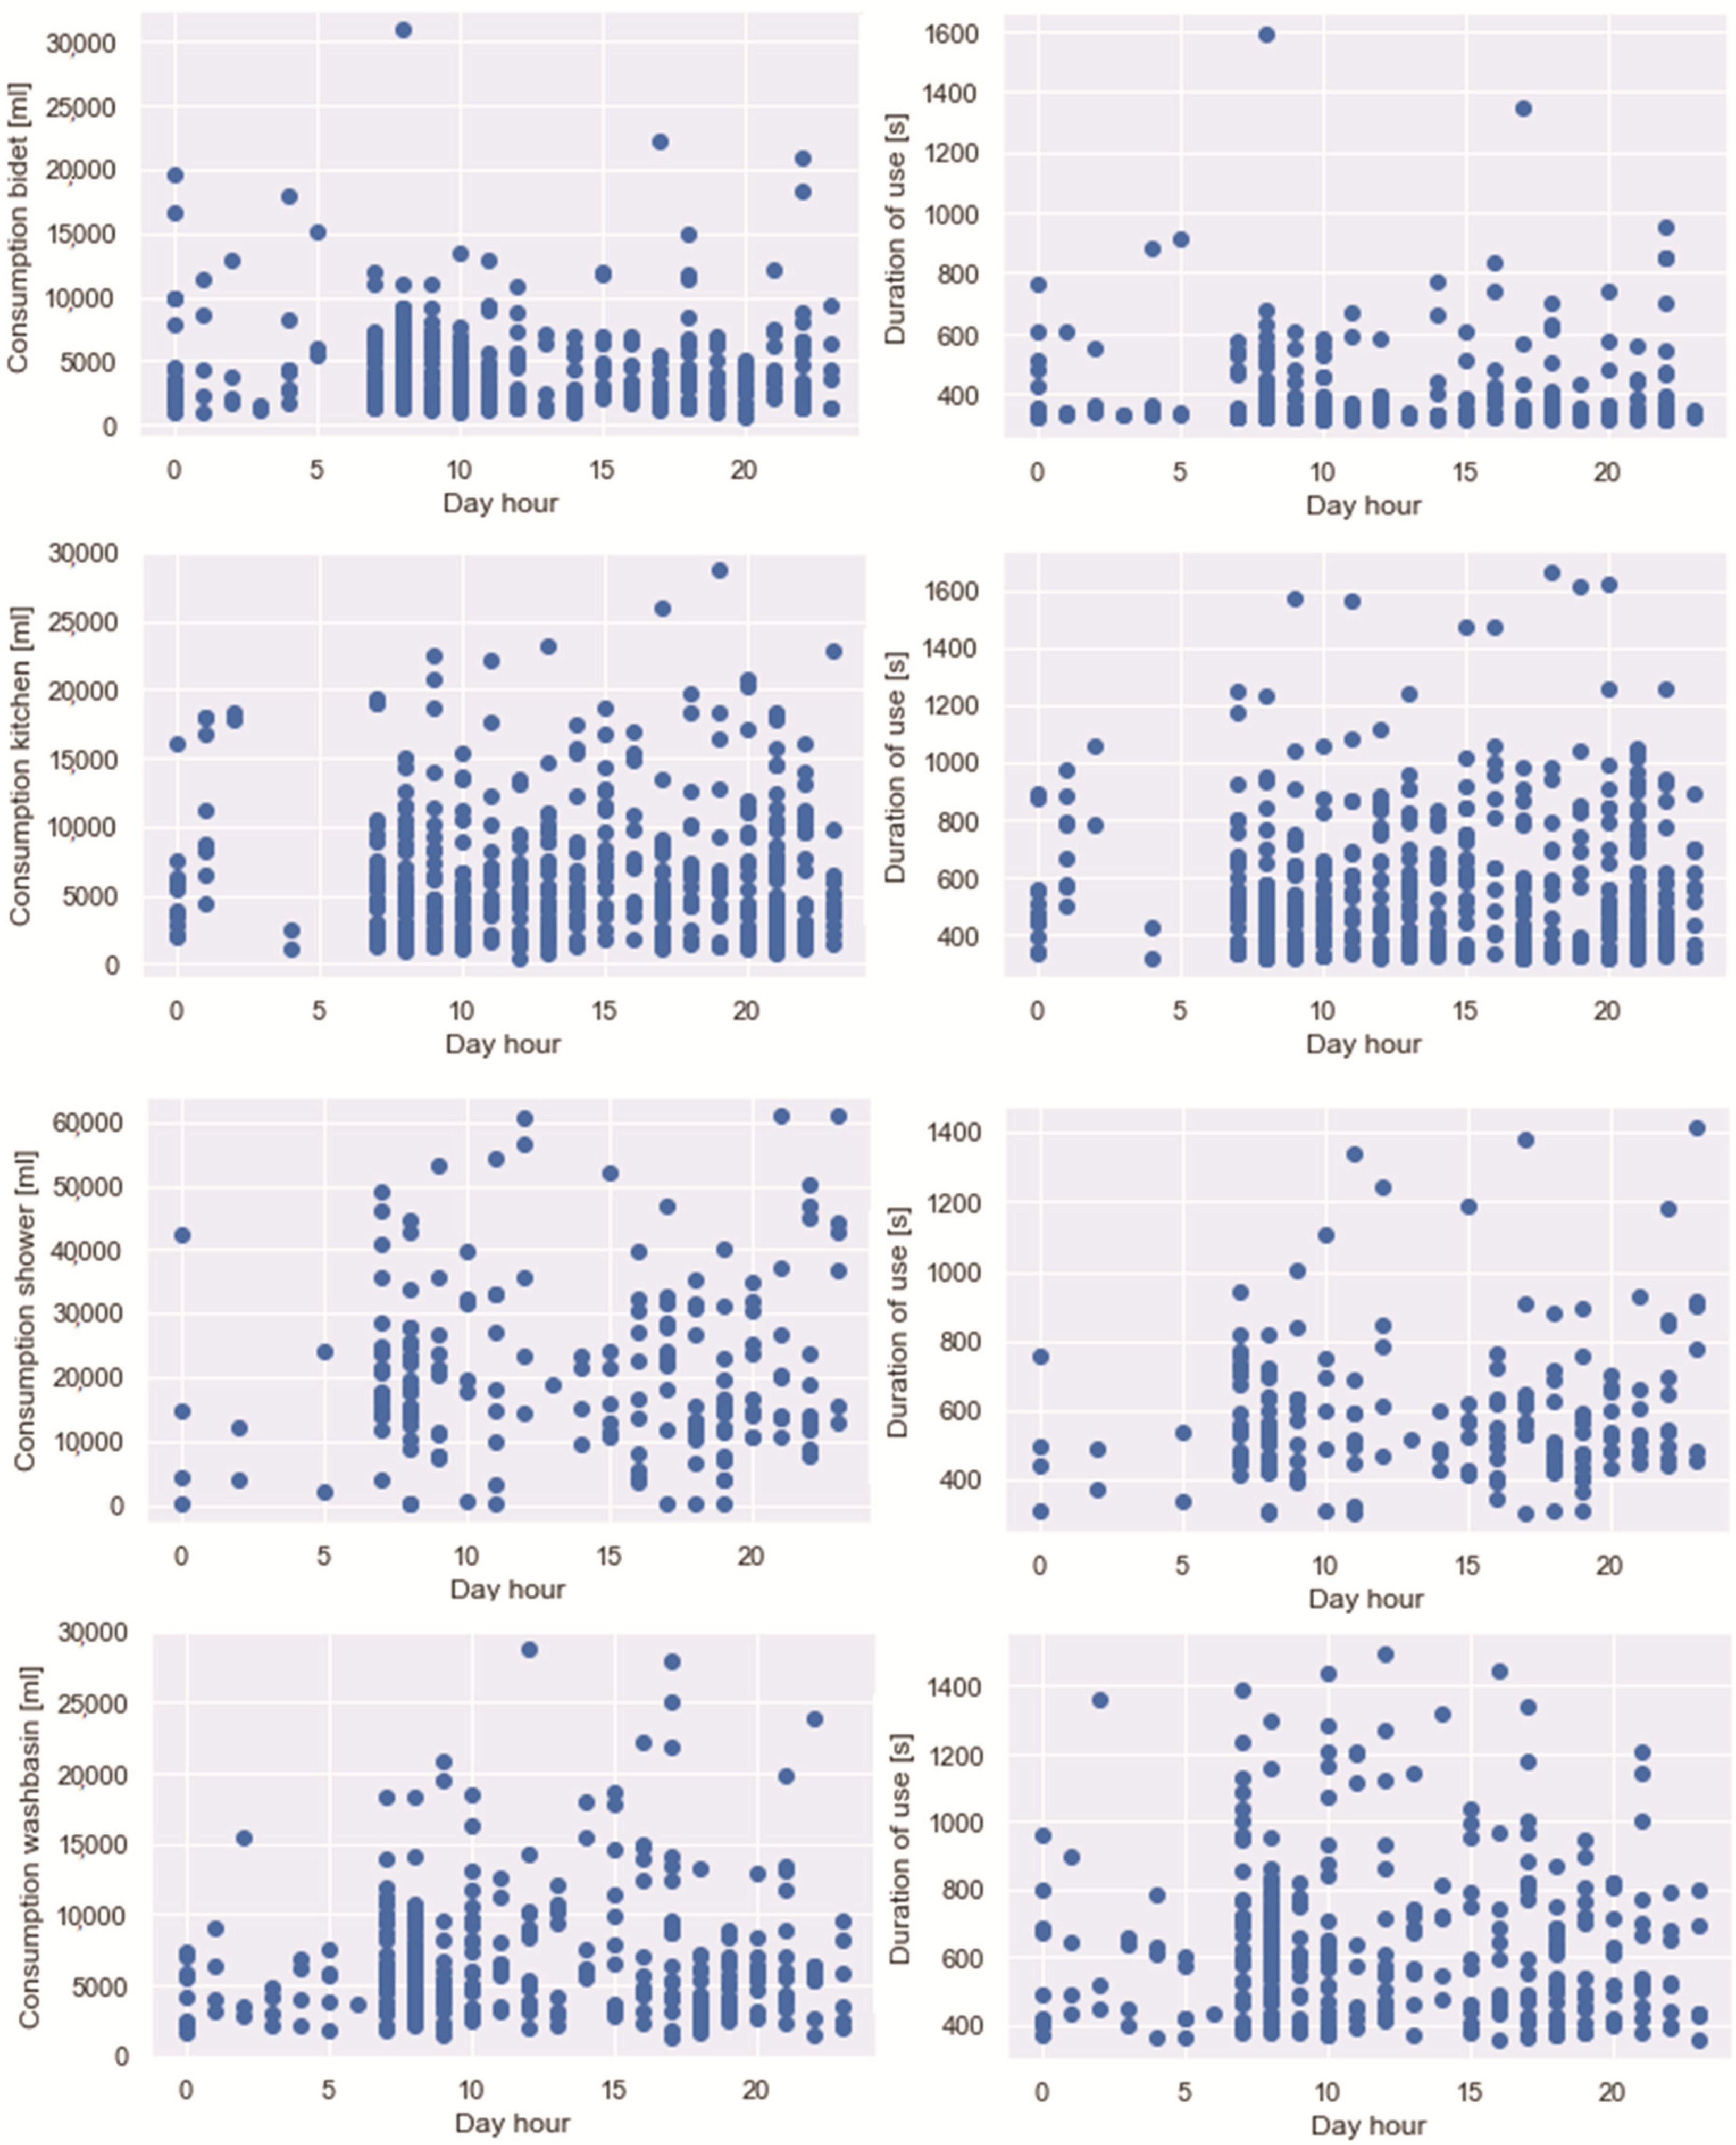
  • Figure 3 shows the water end-use consumption and the duration that characterize usage events during day hours, which is evaluated across the entire period of observation. The first analysis of data allowed estimating the mean and the standard deviation of water consumption and duration of use per fixtures evaluated on all the events detected during 8 months of monitoring, as shown in Table 1:
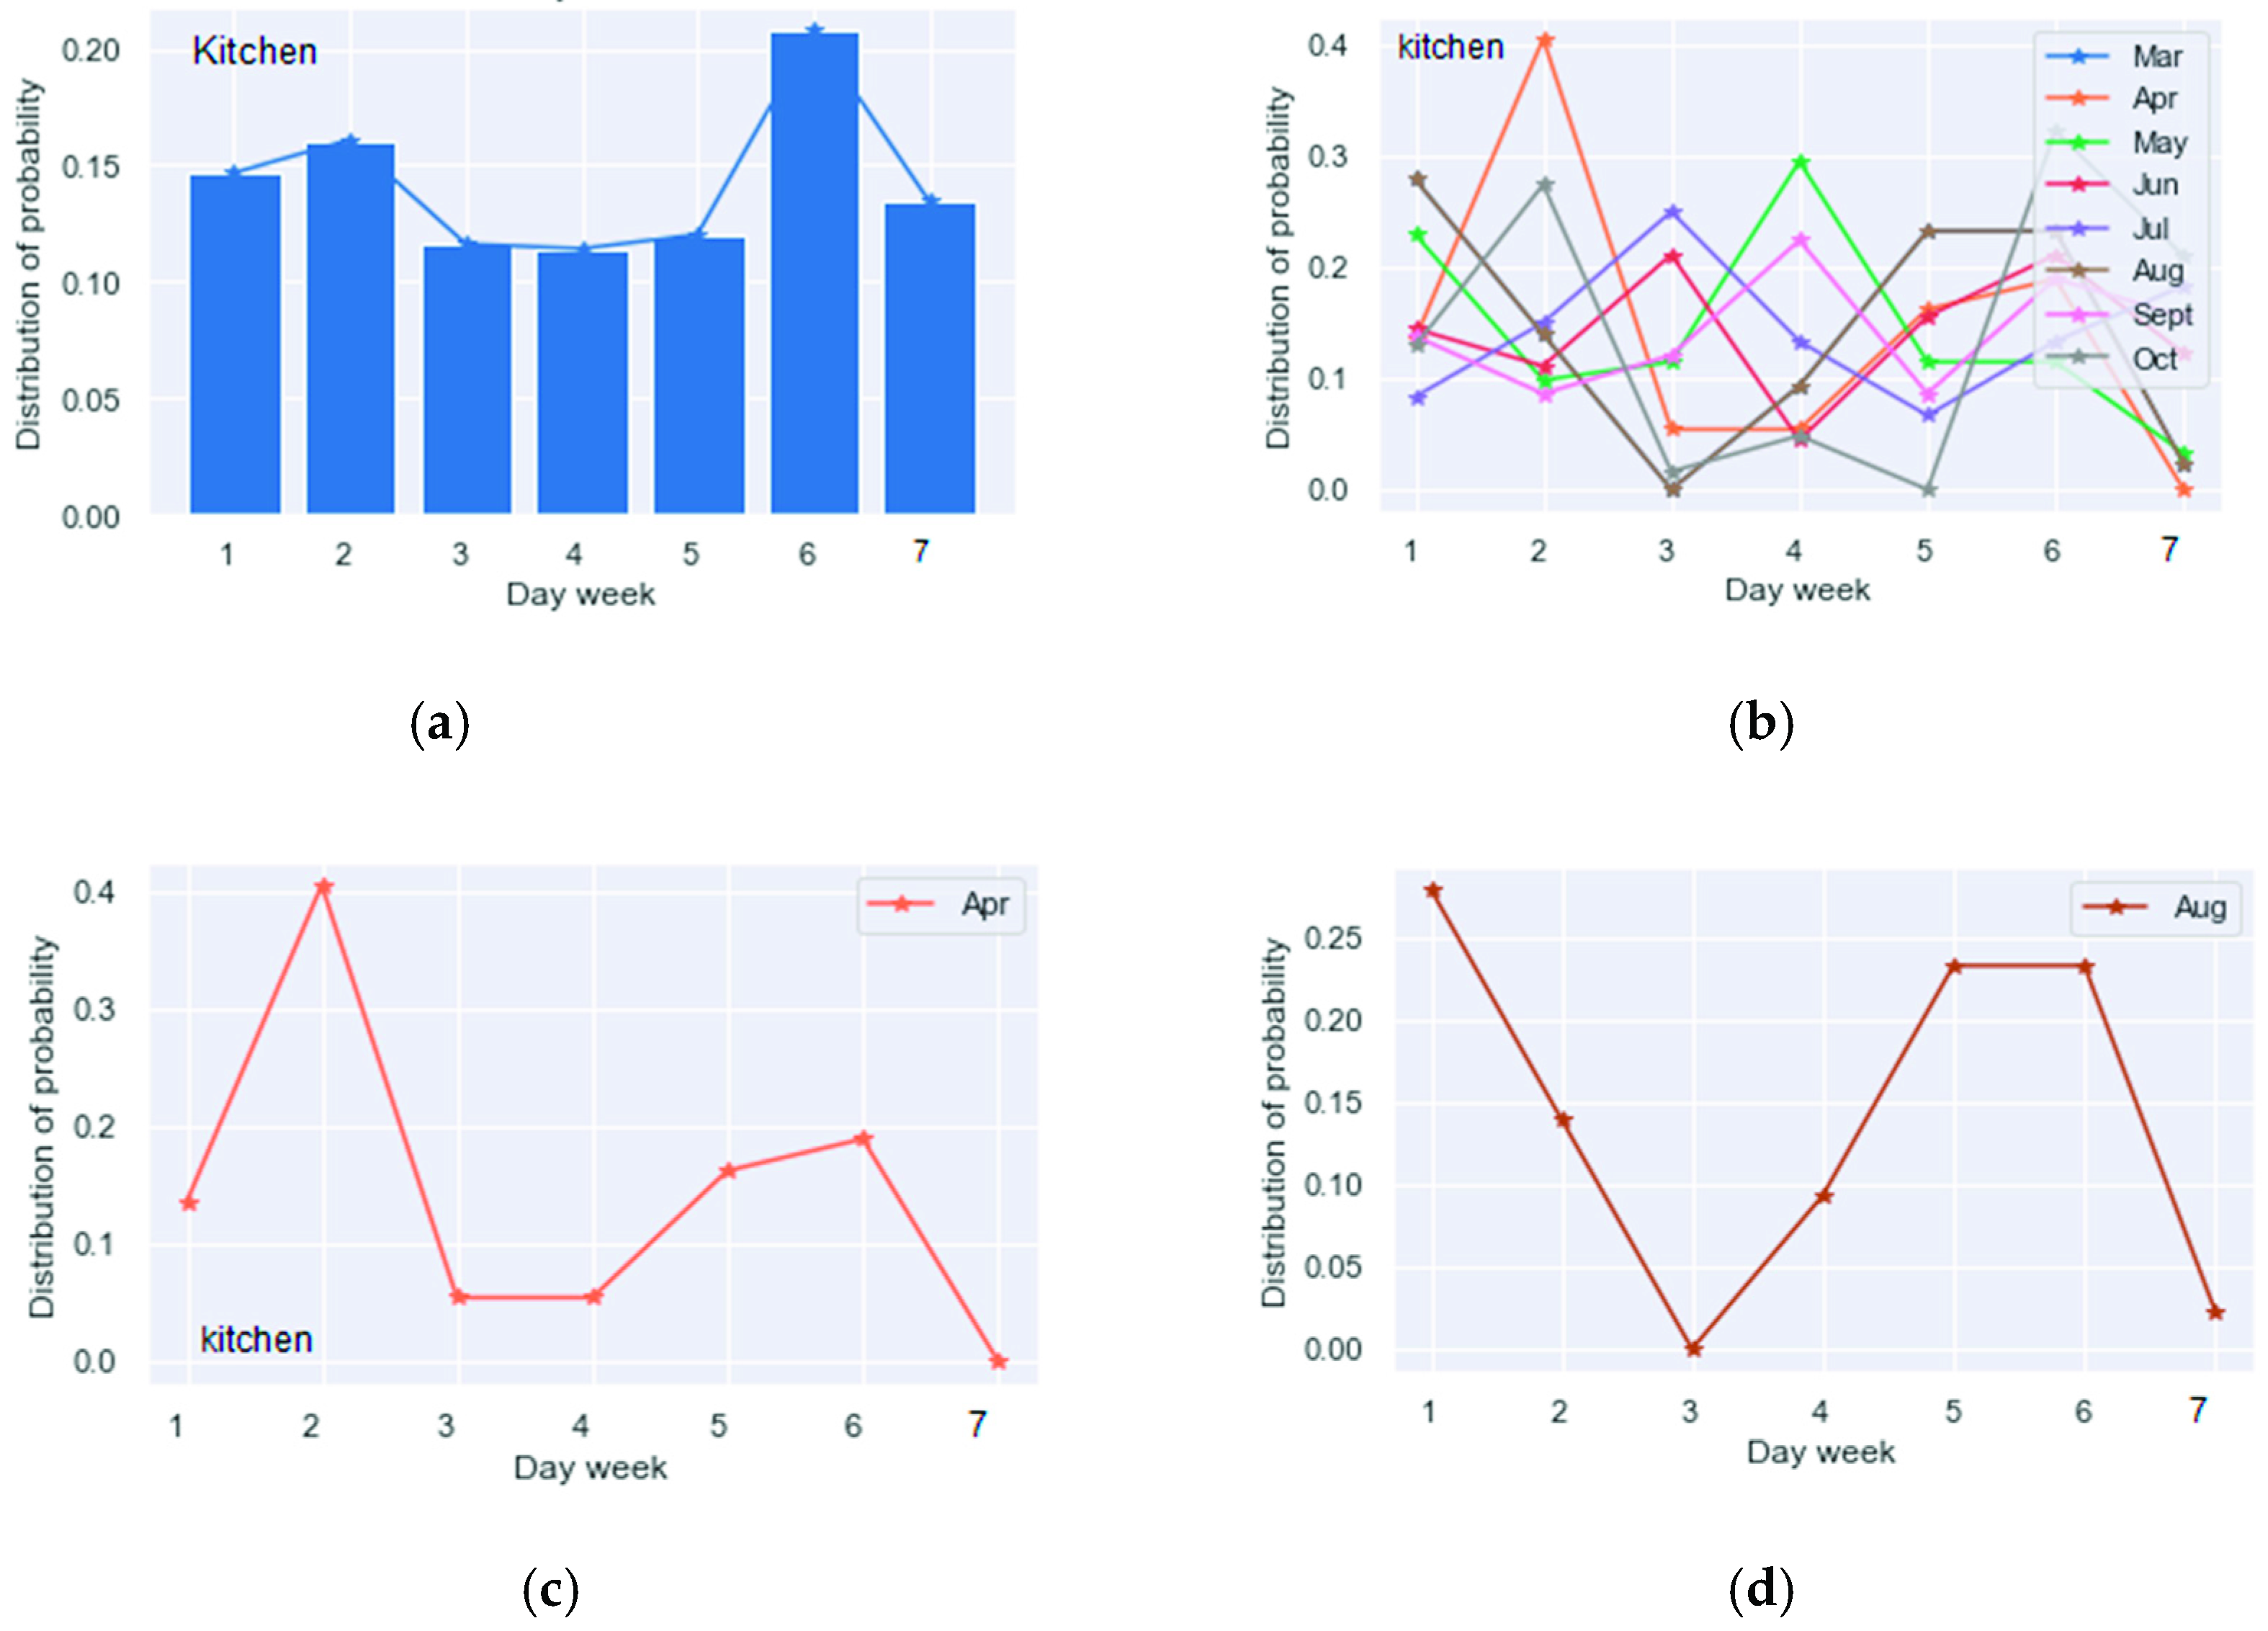
  • Figure 4 shows the distribution of probability related to the use of a fixture during weekdays. Specifically, in the case study, the distribution of probability expresses how often the event occurs on a particular day (that is, the ratio between the numbers of events that occurred on that day and the total number of events). In this case, the kitchen was illustrated. Figure 4a represents the average distribution of probability evaluated in the period of observation. It is relevant to observe in Figure 4b a significant change of such distribution relating to the user’s habits each month. It is obviously affected by climate/seasonal variability, different timings of use due to changes in personal practices, etc. To remark on this aspect, Figure 4c,d shows the variation of the distribution during April and August. It can be observed that the density is higher during the week beginning in April and moving toward the weekend in August.
  • Figure 5 shows the number of uses during day hours for different fixtures evaluated on the entire dataset of consumption. The results highlight how uses are concentrated between 07:00 and 10:00 in the morning and after 20:00 in the evening, reflecting the profile of the user who is an employee and is generally at work during the day. Moreover, also in this case, the evaluation of the same trend within a single month allows the deepest knowledge of the user’s behaviors variability. In fact, using a kitchen faucet as an example, Figure 6 illustrates the changeability of the trend, taking into account the number of uses during April and August.
  • Figure 6 indicates how habits clearly affect the use of water in a domestic environment. The figure represents the number of uses during day hours in a working month (April) and in a non-working month (August), revealing a more frequent use during the day hours in the working month, August.
The first analysis, even if evaluated on a limited sample that will be improved with the ongoing data collection and the enlargement to more users, can be considered reliable due to users’ regular habits and routines, which allow identifying users’ behaviors at different time resolutions. In fact, in this paper, the authors presented some preliminary outcomes, focusing the attention on the main fixtures used (bidet, washbasin, kitchen faucet, and shower) in order to underline how end-use data can improve users’ profiling. However, data collection includes all fixtures present in the pilot site that will be presented in detail in future works. Nevertheless, even if the proposed analysis was developed for one customer and an effective comparison can be made after an extension of the investigation to several pilot sites, the first analysis of end-use consumption related to the seven fixtures of the case study allow some consideration on the quantity of water used. In fact, data detection shows daily medium water consumption per person to be around 0.16 m3. This value is lower than the Italian daily water consumption census by the Italian National Institute of Statistics ISTAT equal to 0.22 m3 (value of the statistical report year 2015–2018) [22].
Preliminary results on the main fixtures monitored show the heterogeneity of the different fixtures’ signature during daily and monthly use. Moreover, they highlight how water data at the end-use level are of great interest and can offer opportunities for water conservation, designing water tariffs, promoting more sustainable uses of resource, characterizing water demand during peak hours, and improving side management and demand forecasting.

4. Conclusions

The paper presents an IoT monitoring system for the generation of a database of water end-use consumption time series. The system realized can automatically detect, collect, and store high-resolution water end-use data in real time. End-use monitoring, in a single-family residential apartment, is still ongoing, and here, we present the database obtained after 8 months, from 1st March to 30th October 2019.
Starting from the authors’ previous work [11], the paper represents an update of the case study realized, showing first analysis on the generated repository. The aim of the application is to test the IoT monitoring system on a starting case with one customer to understand the intrusiveness of the system during daily use, use overlap, and the limitations of the method that can be improved for the application in more complex configurations. Moreover, in the scientific community, there is still a limited availability of open water consumption datasets, and the ones available represent American, Canadian or Australian signatures, so the repository is the first representing Italian water flow traces into a registry of end-use events.
Preliminary results show how disaggregated water consumption can improve understanding customer water usage in domestic environments and how single end-use categories are crucial to identify customers’ behaviors, which is essential for user profiling. In addition, the data collected are potentially eligible as numerical benchmarks for training and testing end-use disaggregation algorithms and the signatures of water-consuming fixtures, and their associated statistics can be used for synthetic simulation models as well. Further developments of the case study will be related to the installation of a high-resolution smart meter to detect water consumption at the household level, to the improvement of a new release of the battery-powered sensor, and to the extension of the methods to more complex configurations.

Author Contributions

A.D.M., A.D.N. and S.V. designed the research and developed the paper. G.F.S. contributed to state of the art analysis. A.D.M. and S.V. carried out the model implementation. A.D.M. collected the data and performed the analysis. A.D.N. and S.V. supervised the research. All authors reviewed the manuscript and contributed to the final version. All authors have read and agree to the published version of the manuscript.

Funding

This research received no external funding.

Conflicts of Interest

The authors declare no conflict of interest.

References

  1. Swan, L.G.; Ugursal, V.I. Modeling of end-use energy consumption in the residential sector: A review of modeling techniques. Renew. Sust. Energy Rev. 2009, 13, 1819–1835. [Google Scholar] [CrossRef]
  2. Rathnayaka, K.; Malano, H.; Maheepala, S.; Nawarathna, B.; George, B.; Arora, M. Review of residential urban water end-use modelling. In Proceedings of the MODSIM 2011—19th International Congress on Modelling and Simulation—Sustaining Our Future: Understanding and Living with Uncertainty, Perth, Australia, 12–16 December 2011; pp. 3321–3327. [Google Scholar]
  3. Gato-Trinidad, S.; Jayasuriya, N.; Roberts, P. Understanding urban residential end uses of water. Water Sci. Technol. 2011, 64, 36–42. [Google Scholar] [CrossRef] [PubMed]
  4. Liu, A.; Giurco, D.; Mukheibir, P. Urban water conservation through customised water and end-use information. J. Clean. Prod. 2016, 112, 3164–3175. [Google Scholar] [CrossRef]
  5. Cary, J.W. Influencing attitudes and changing consumers’ household water consumption behaviour. Water Sci. Technol. Water Supply 2008, 8, 325–330. [Google Scholar] [CrossRef]
  6. Beal, C.D.; Stewart, R.A.; Fielding, K. A novel mixed method smart metering approach to reconciling differences between perceived and actual residential end use water consumption. J. Clean. Prod. 2013, 60, 116–128. [Google Scholar] [CrossRef]
  7. Kanoje, S.; Girase, S.; Mukhopadhyay, D. User Profiling Trends, Techniques and Applications. Int. J. Adv. Found. Res. Comput. 2014, 1, 2348–4853. [Google Scholar]
  8. Cufoglu, A. User Profiling—A Short Review. Int. J. Comput. Appl. 2014, 108, 1–9. [Google Scholar] [CrossRef]
  9. Godoy, D.; Amandi, A. A conceptual clustering approach for user profiling in personal information agents. AI Commun. 2006, 19, 207–227. [Google Scholar]
  10. Yannibelli, V.; Godoy, D.; Amandi, A. A genetic algorithm approach to recognise students’ learning styles. Interact. Learn. Environ. 2006, 14, 55–78. [Google Scholar] [CrossRef]
  11. Di Mauro, A.; Di Nardo, A.; Santonastaso, G.F.; Venticinque, S. An IoT system for monitoring and data collection of residential water end-use consumption. In Proceedings of the Proceedings—International Conference on Computer Communications and Networks ICCCN, Valencia, Spain, 29 July–1 August 2019. [Google Scholar]
  12. Beal, C.D.; Stewart, R.A. Identifying Residential Water End Uses Underpinning Peak Day and Peak Hour Demand. J. Water Resour. Plan. Manag. 2013, 140, 04014008. [Google Scholar] [CrossRef]
  13. Willis, R.M.; Stewart, R.A.; Giurco, D.P.; Talebpour, M.R.; Mousavinejad, A. End use water consumption in households: Impact of socio-demographic factors and efficient devices. J. Clean. Prod. 2013, 60, 107–115. [Google Scholar] [CrossRef]
  14. Fu, Y.; Wu, W. Behaviour interventions for water end use: An integrated model. In Proceedings of the 20th International Conference on Automation and Computing: Future Automation, Computing and Manufacturing ICAC, Savannah, GA, USA, 7–10 December 2014. [Google Scholar]
  15. Froehlich, J.E.; Larson, E.; Campbell, T.; Haggerty, C.; Fogarty, J.; Patel, S.N. HydroSense: Infrastructure-mediated single-point sensing of whole-home water activity. In Proceedings of the 11th International Conference on Ubiquitous Computing, Orlando, FL, USA, 30 September–3 October 2009. [Google Scholar]
  16. Beal, C.D.; Stewart, R.A.; Huang, T.; Rey, E. SEQ residential end use study. Smart Water Syst. Metering 2011, 38, 80–84. [Google Scholar]
  17. Suero, F.J.; Mayer, P.W.; Rosenberg, D.E. Estimating and Verifying United States Households’ Potential to Conserve Water. J. Water Resour. Plan. Manag. 2012, 138, 299–306. [Google Scholar] [CrossRef]
  18. Blokker, E.J.M.; Pieterse-Quirijns, E.J.; Vreeburg, J.H.G.; van Dijk, J.C. Simulating nonresidential water demand with a stochastic end-use model. J. Water Resour. Plan. Manag. 2011, 137, 511–520. [Google Scholar] [CrossRef]
  19. Cominola, A.; Giuliani, M.; Castelleti, A.; Abdallah, A.M.; Rosenberg, D.E. Developing a stochastic simulation model for the generation of residential water end-use demand time series. In Proceedings of the 8th International Congress on Environmental Modelling and Software, Toulouse, France, 10–14 July 2016. [Google Scholar]
  20. Carboni, D.; Gluhak, A.; McCann, J.A.; Beach, T.H. Contextualising water use in residential settings: A survey of non-intrusive techniques and approaches. Sensors (Switzerland) 2016, 1, 738. [Google Scholar] [CrossRef]
  21. Nguyen, K.; Zhang, H.; Stewart, R.A. Development of an intelligent model to categorise residential water end use events. J. Hydro-Environment Res. 2013, 7, 182–201. [Google Scholar] [CrossRef]
  22. Istituto Nazionale di Statistica ISTAT. 2020. Available online: https://www.istat.it/ (accessed on 12 February 2020).
Figure 1. Component of the IoT monitoring system: (a) Flowsensor YF-S201; (b) Microcontroller ESP-32; (c) Content Management System (CMS) represented by the open source platform Emoncms for data management and collection.
Environsciproc 02 00020 g001
Figure 2. Example of IoT system installation on the fixtures such as: (a) meter installed on washbasin; (b) detail of the microcontroller box.
Environsciproc 02 00020 g002
Figure 3. The figures show for different fixtures the water consumption (left column) and duration (right column) average during day hours evaluated on 8 months of detection.
Environsciproc 02 00020 g003
Figure 4. The figure shows the distribution of probability related to the specific fixture (kitchen) during weekdays, in detail: (a) Distribution of probability average evaluated on the entire period of observation; (b) Distribution of probability for each month of detection; (c) Detail of the distribution of April; (d) Detail of the distribution of August.
Environsciproc 02 00020 g004
Figure 5. Number of uses during day hours for different fixtures evaluated across 8 months of measurements.
Environsciproc 02 00020 g005
Figure 6. Number of uses during day hours for a kitchen faucet evaluated during April and August.
Environsciproc 02 00020 g006
Table 1. Mean and standard deviation of water consumption and duration of use for fixture.
BidetKitchenShowerWashbasin
Mean/SDMean/SDMean/SDMean/SD
Water consumption per event [l]4.5/3.56.3/4.921.2/13.44.4/3.9
Duration per event [m]6.4/2.29.4/4.09.8/3.38.7/3.5
Publisher’s Note: MDPI stays neutral with regard to jurisdictional claims in published maps and institutional affiliations.

