The Effect of Green Walls on Humidity, Air Temperature, Co2 and Well-Being of People †


Abstract
:1. Introduction
2. Site
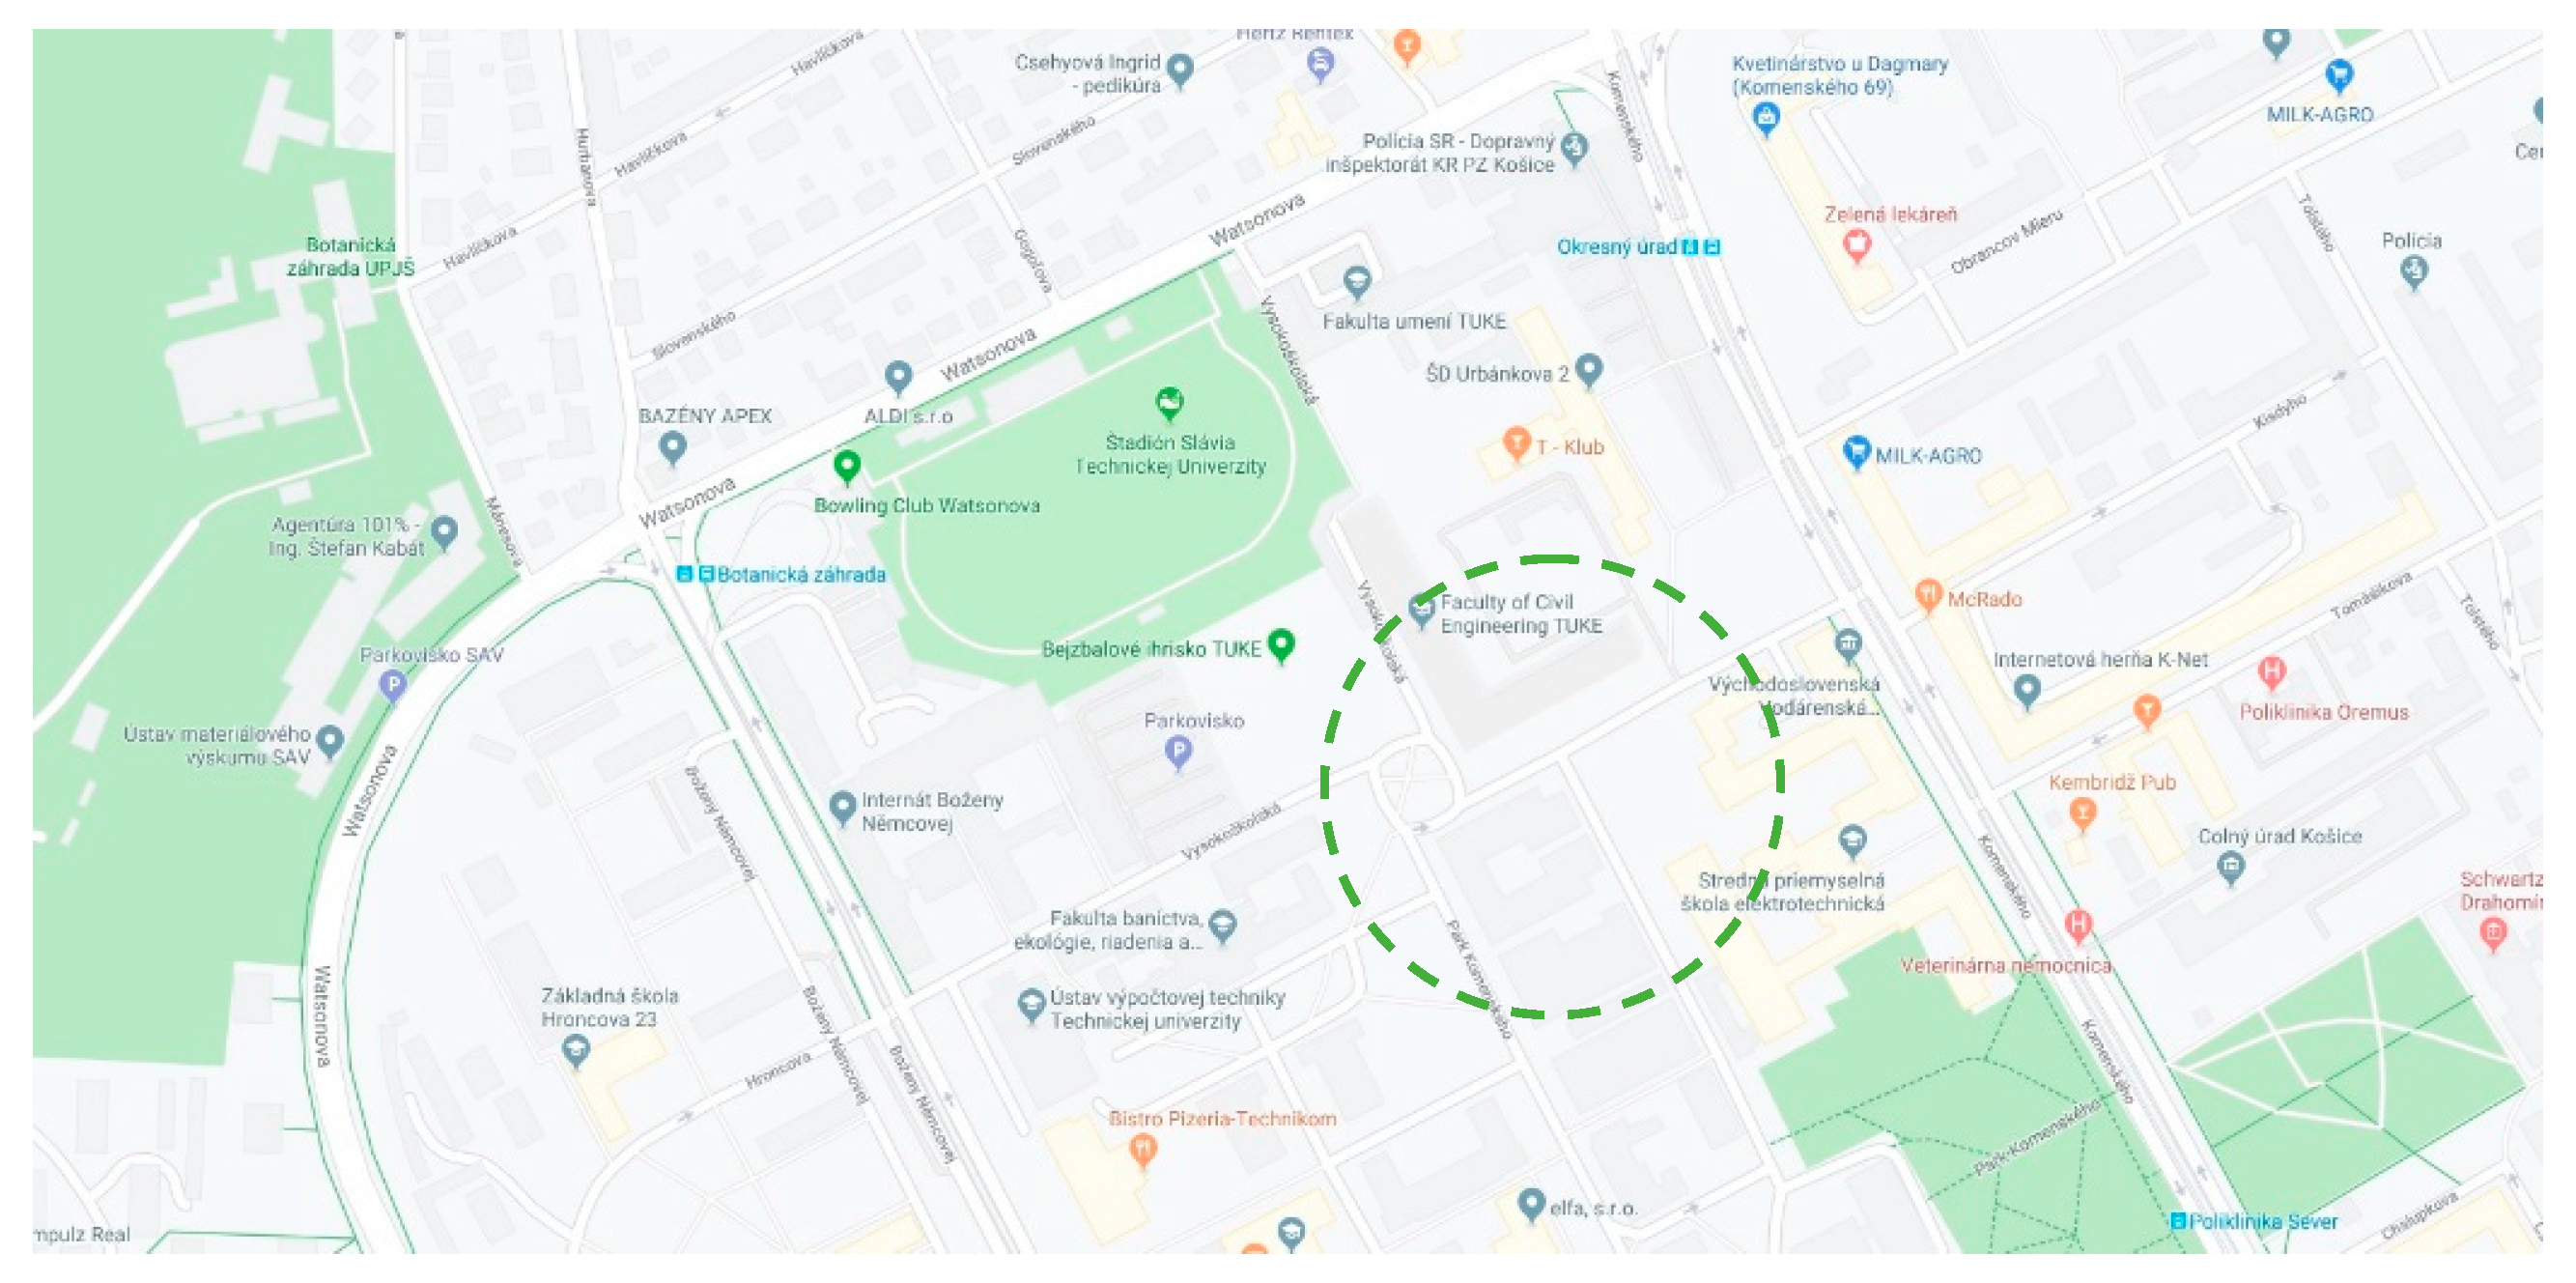
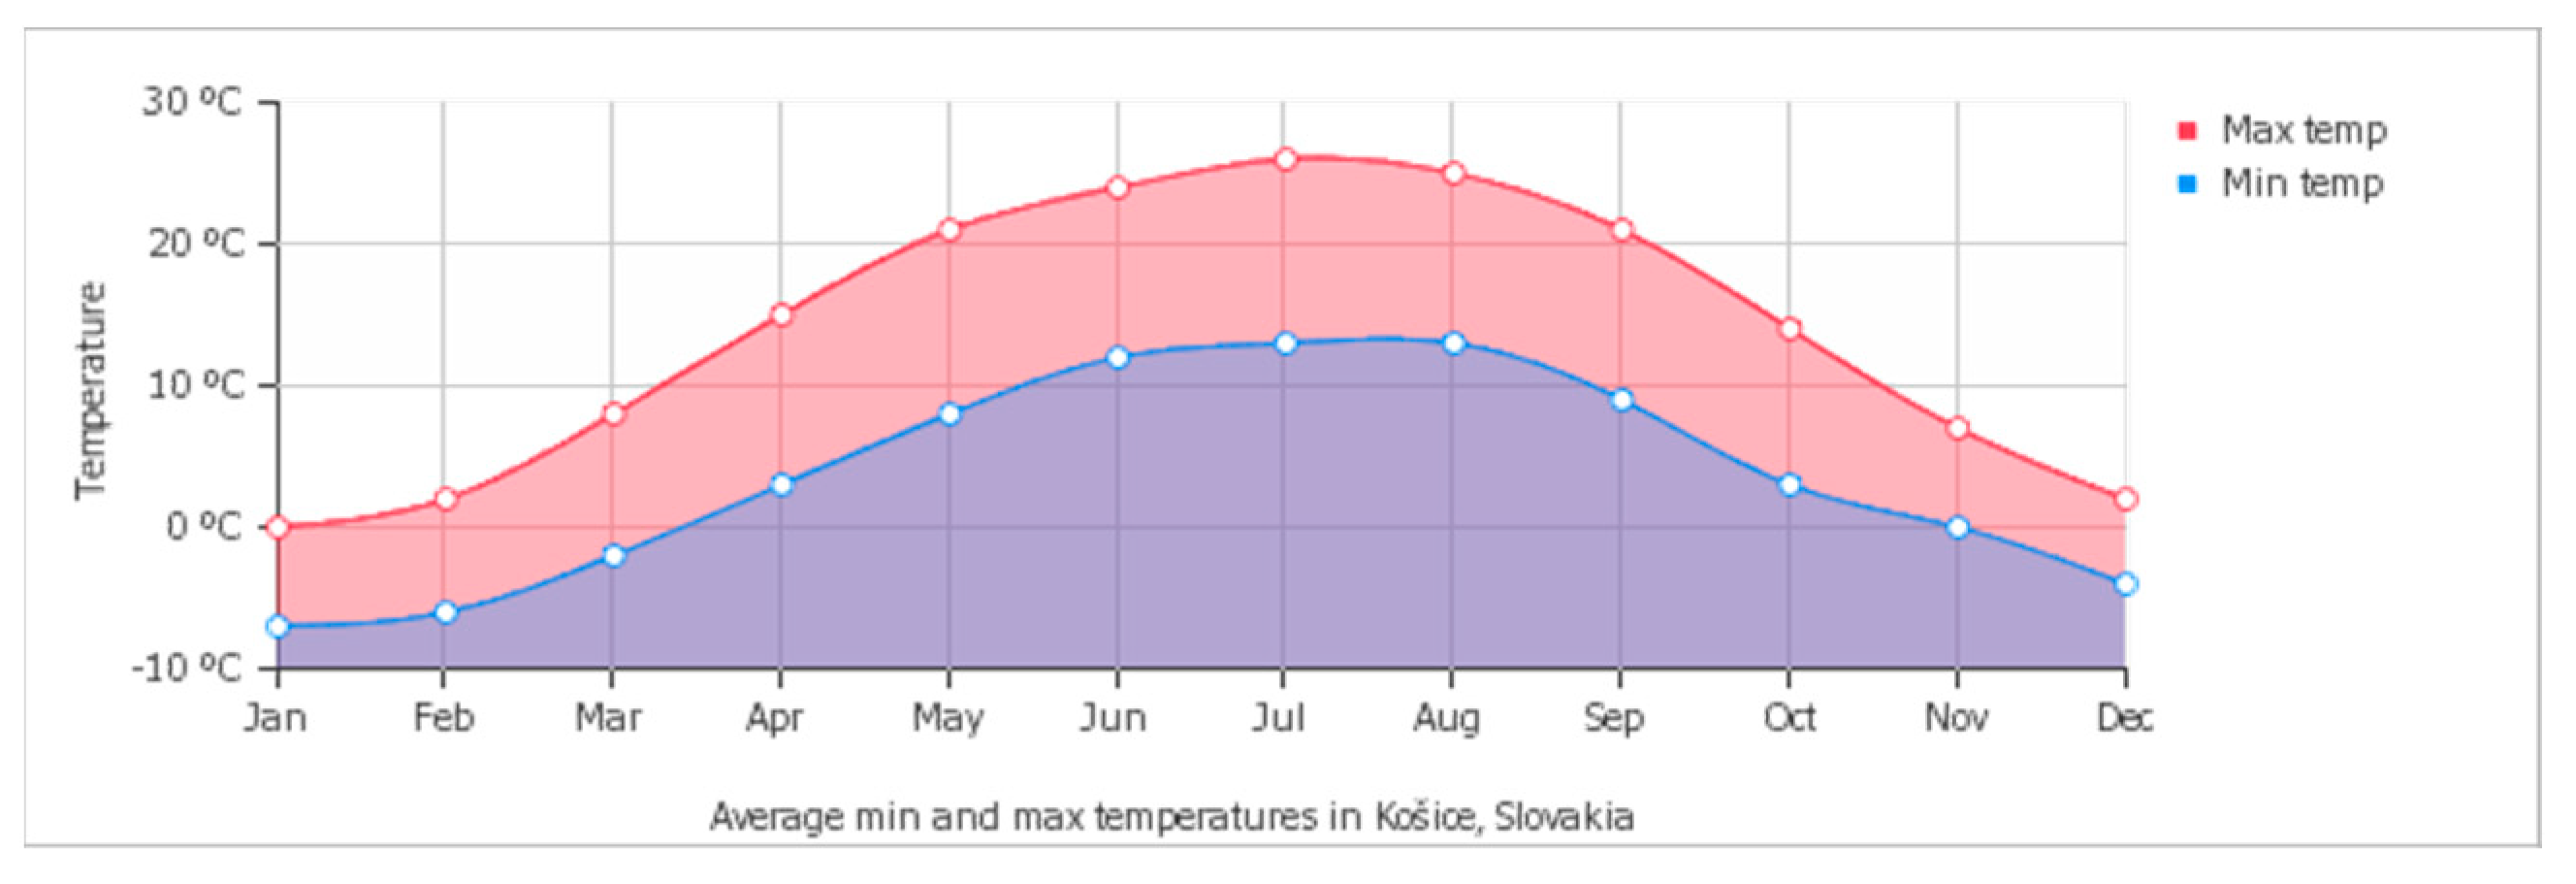
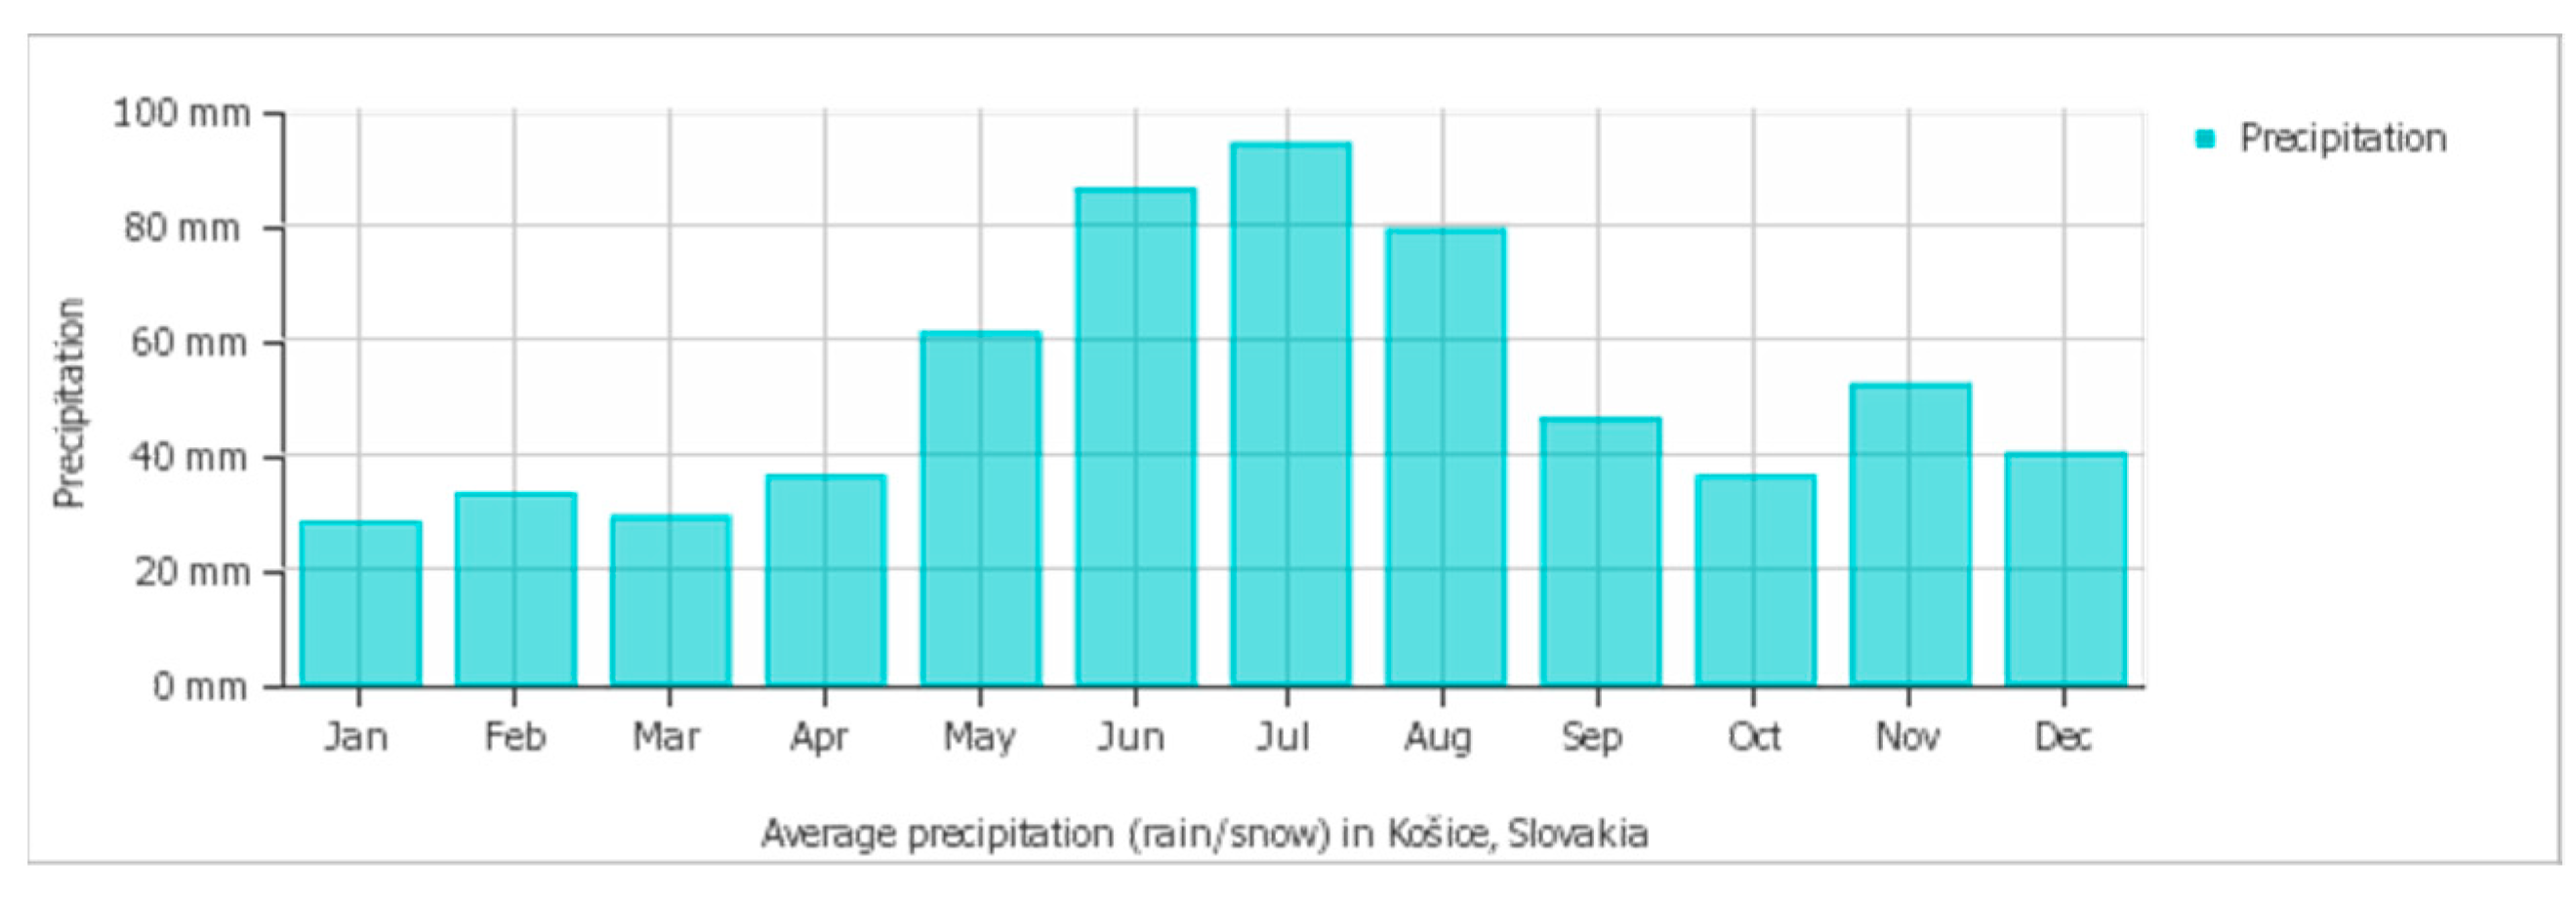
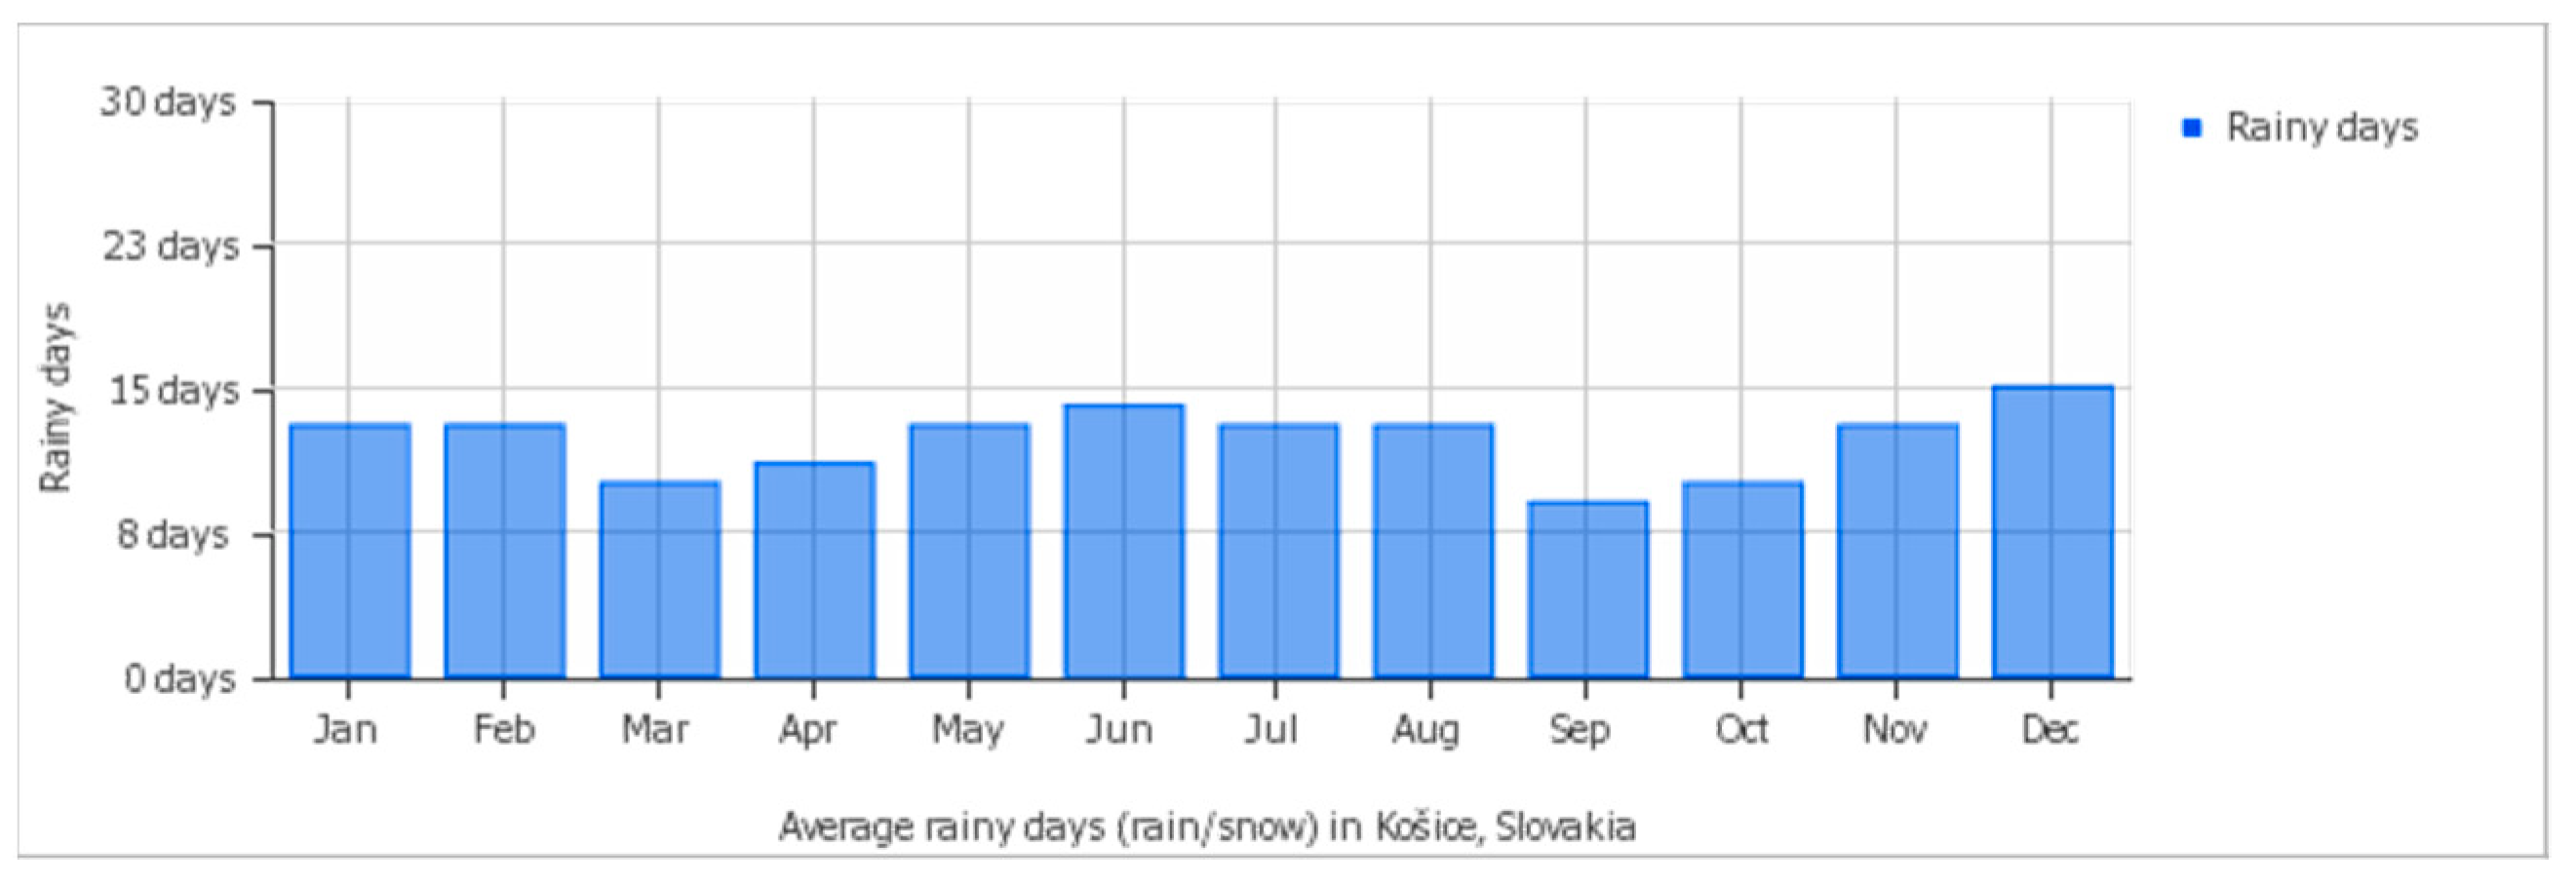
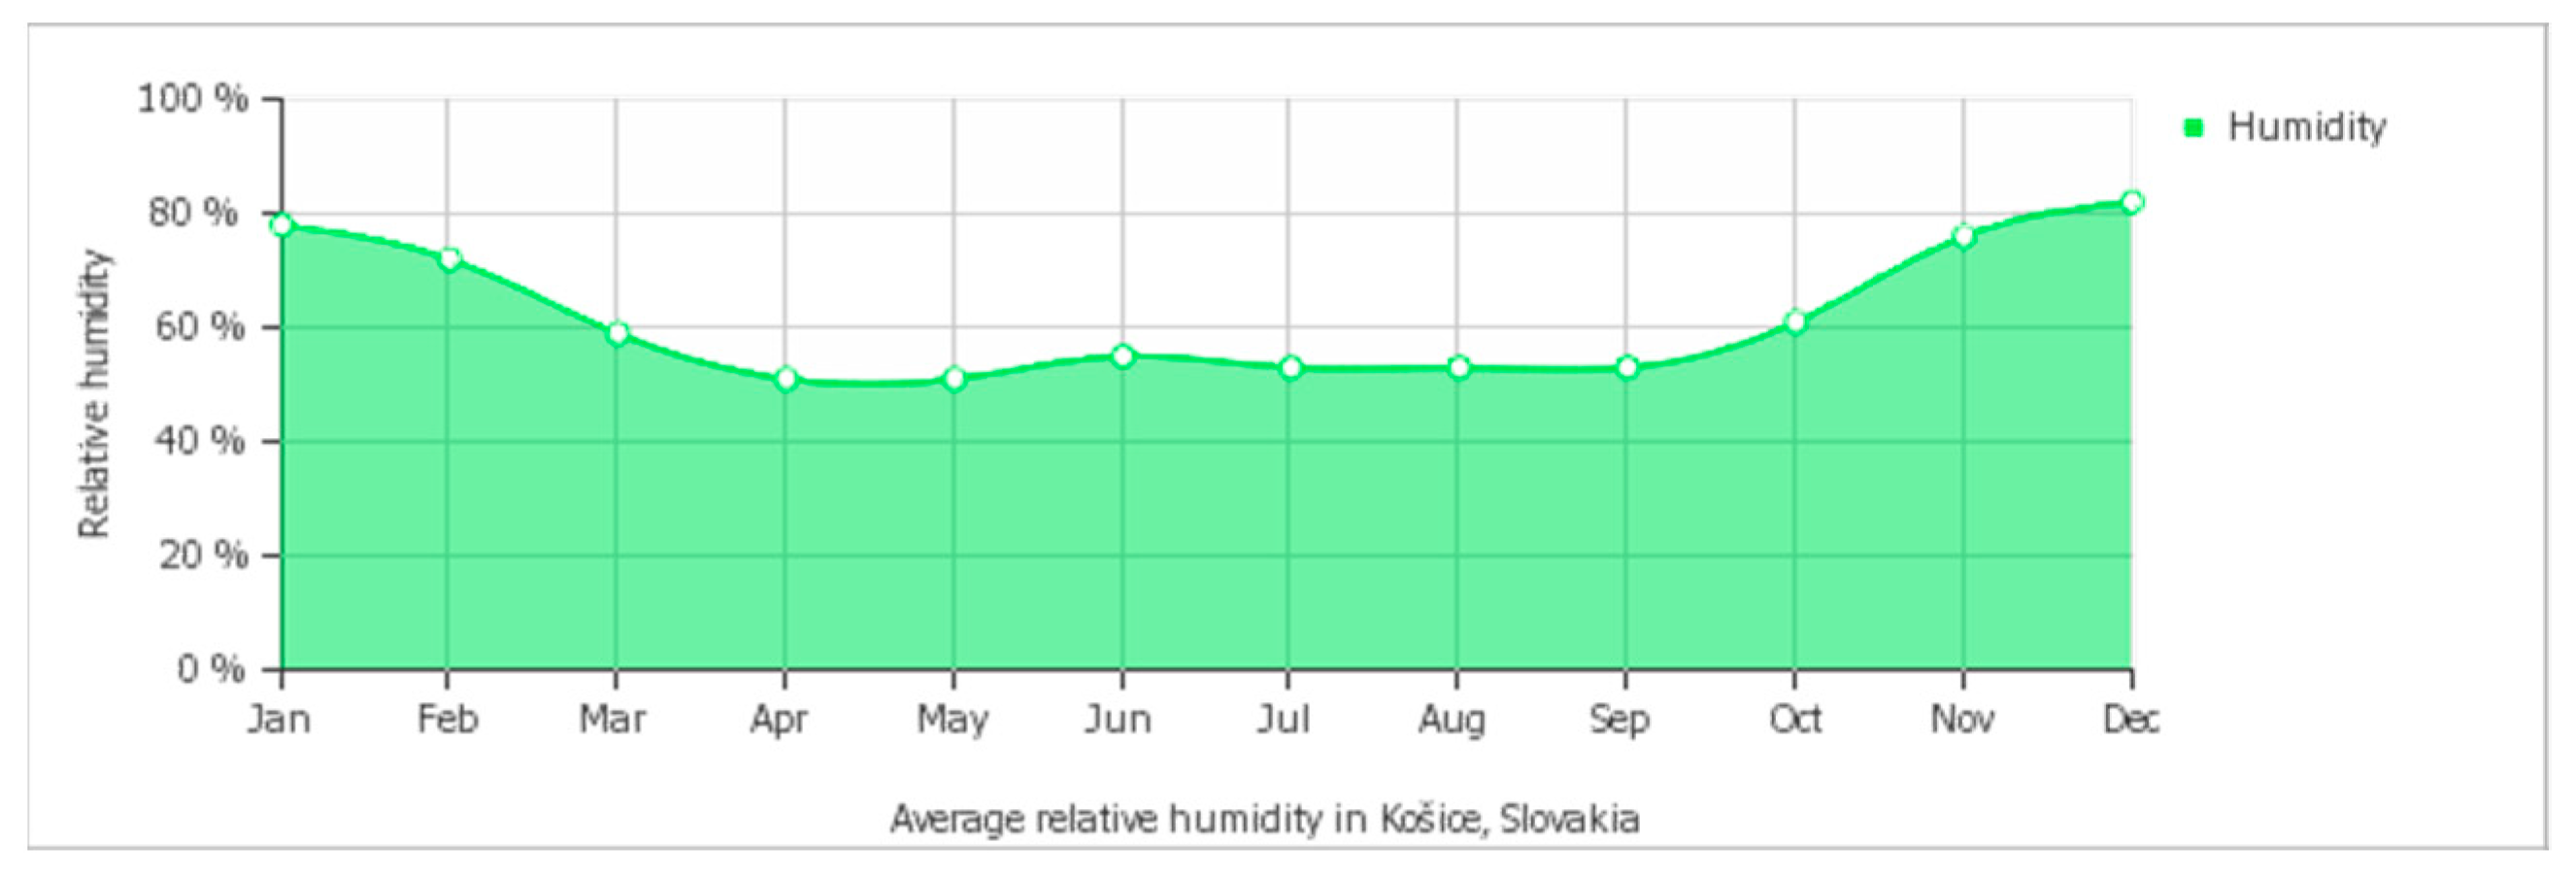
2.1. Košice
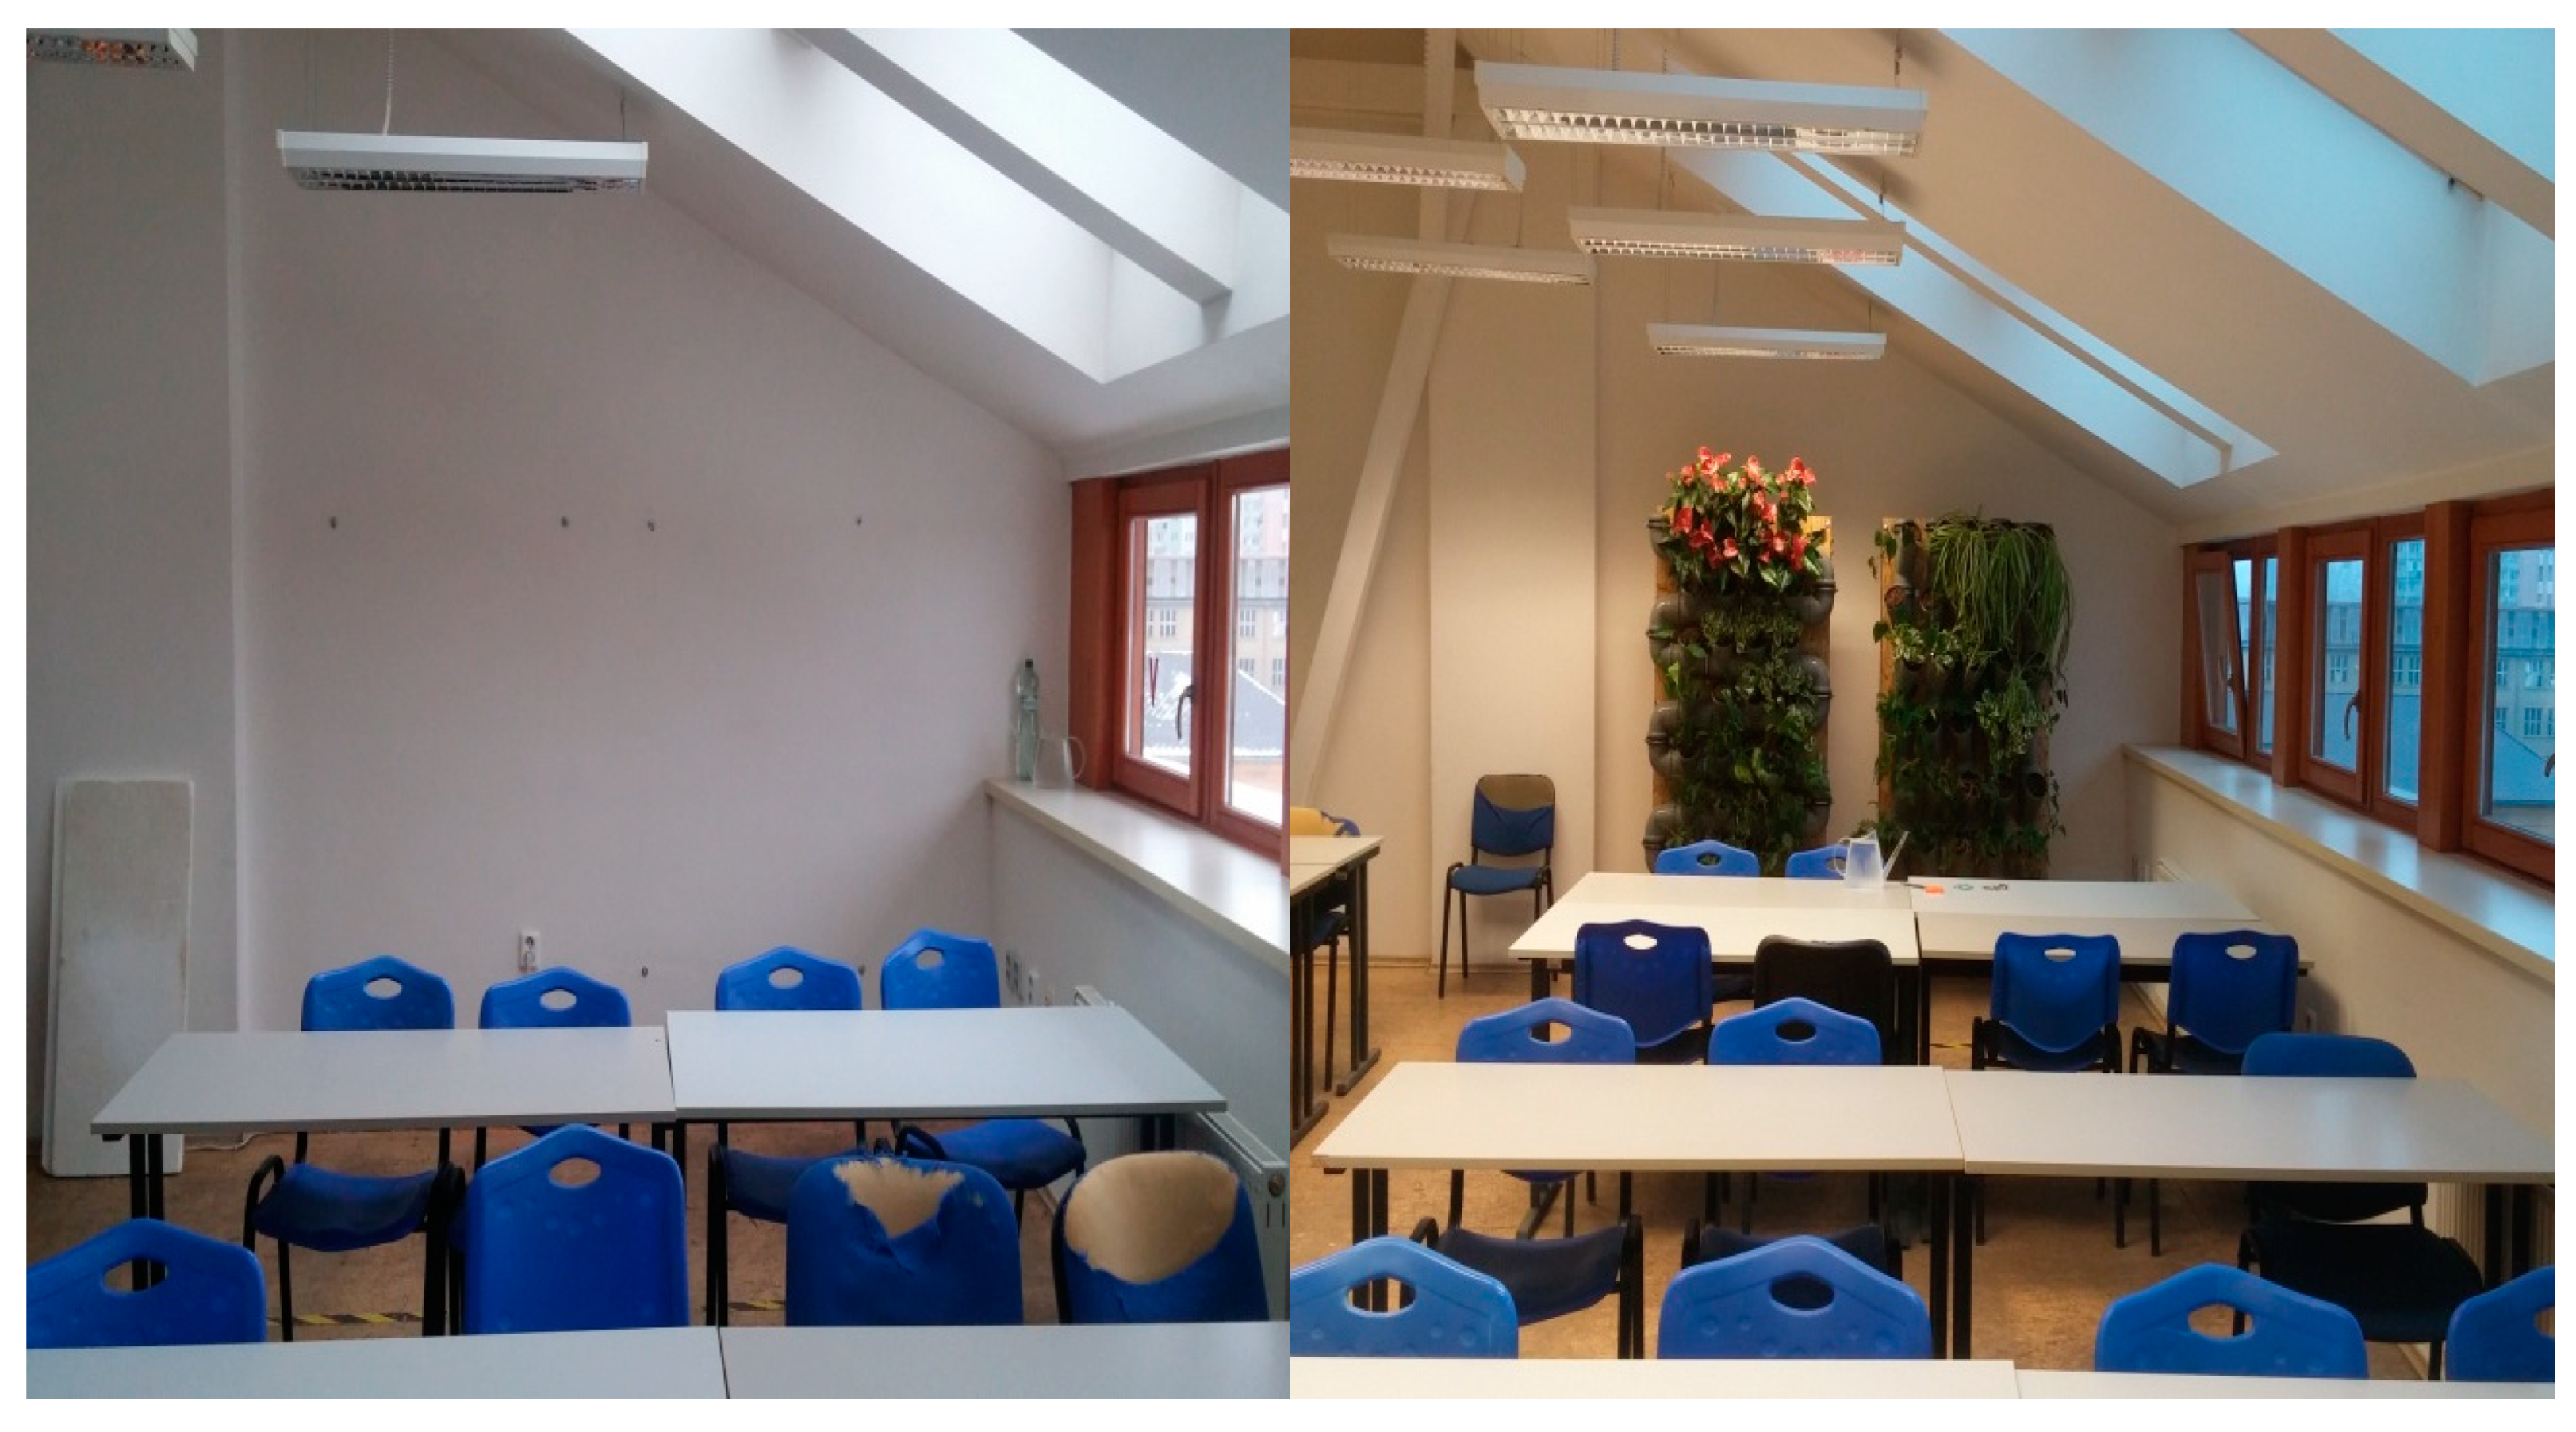
2.2. Classroom
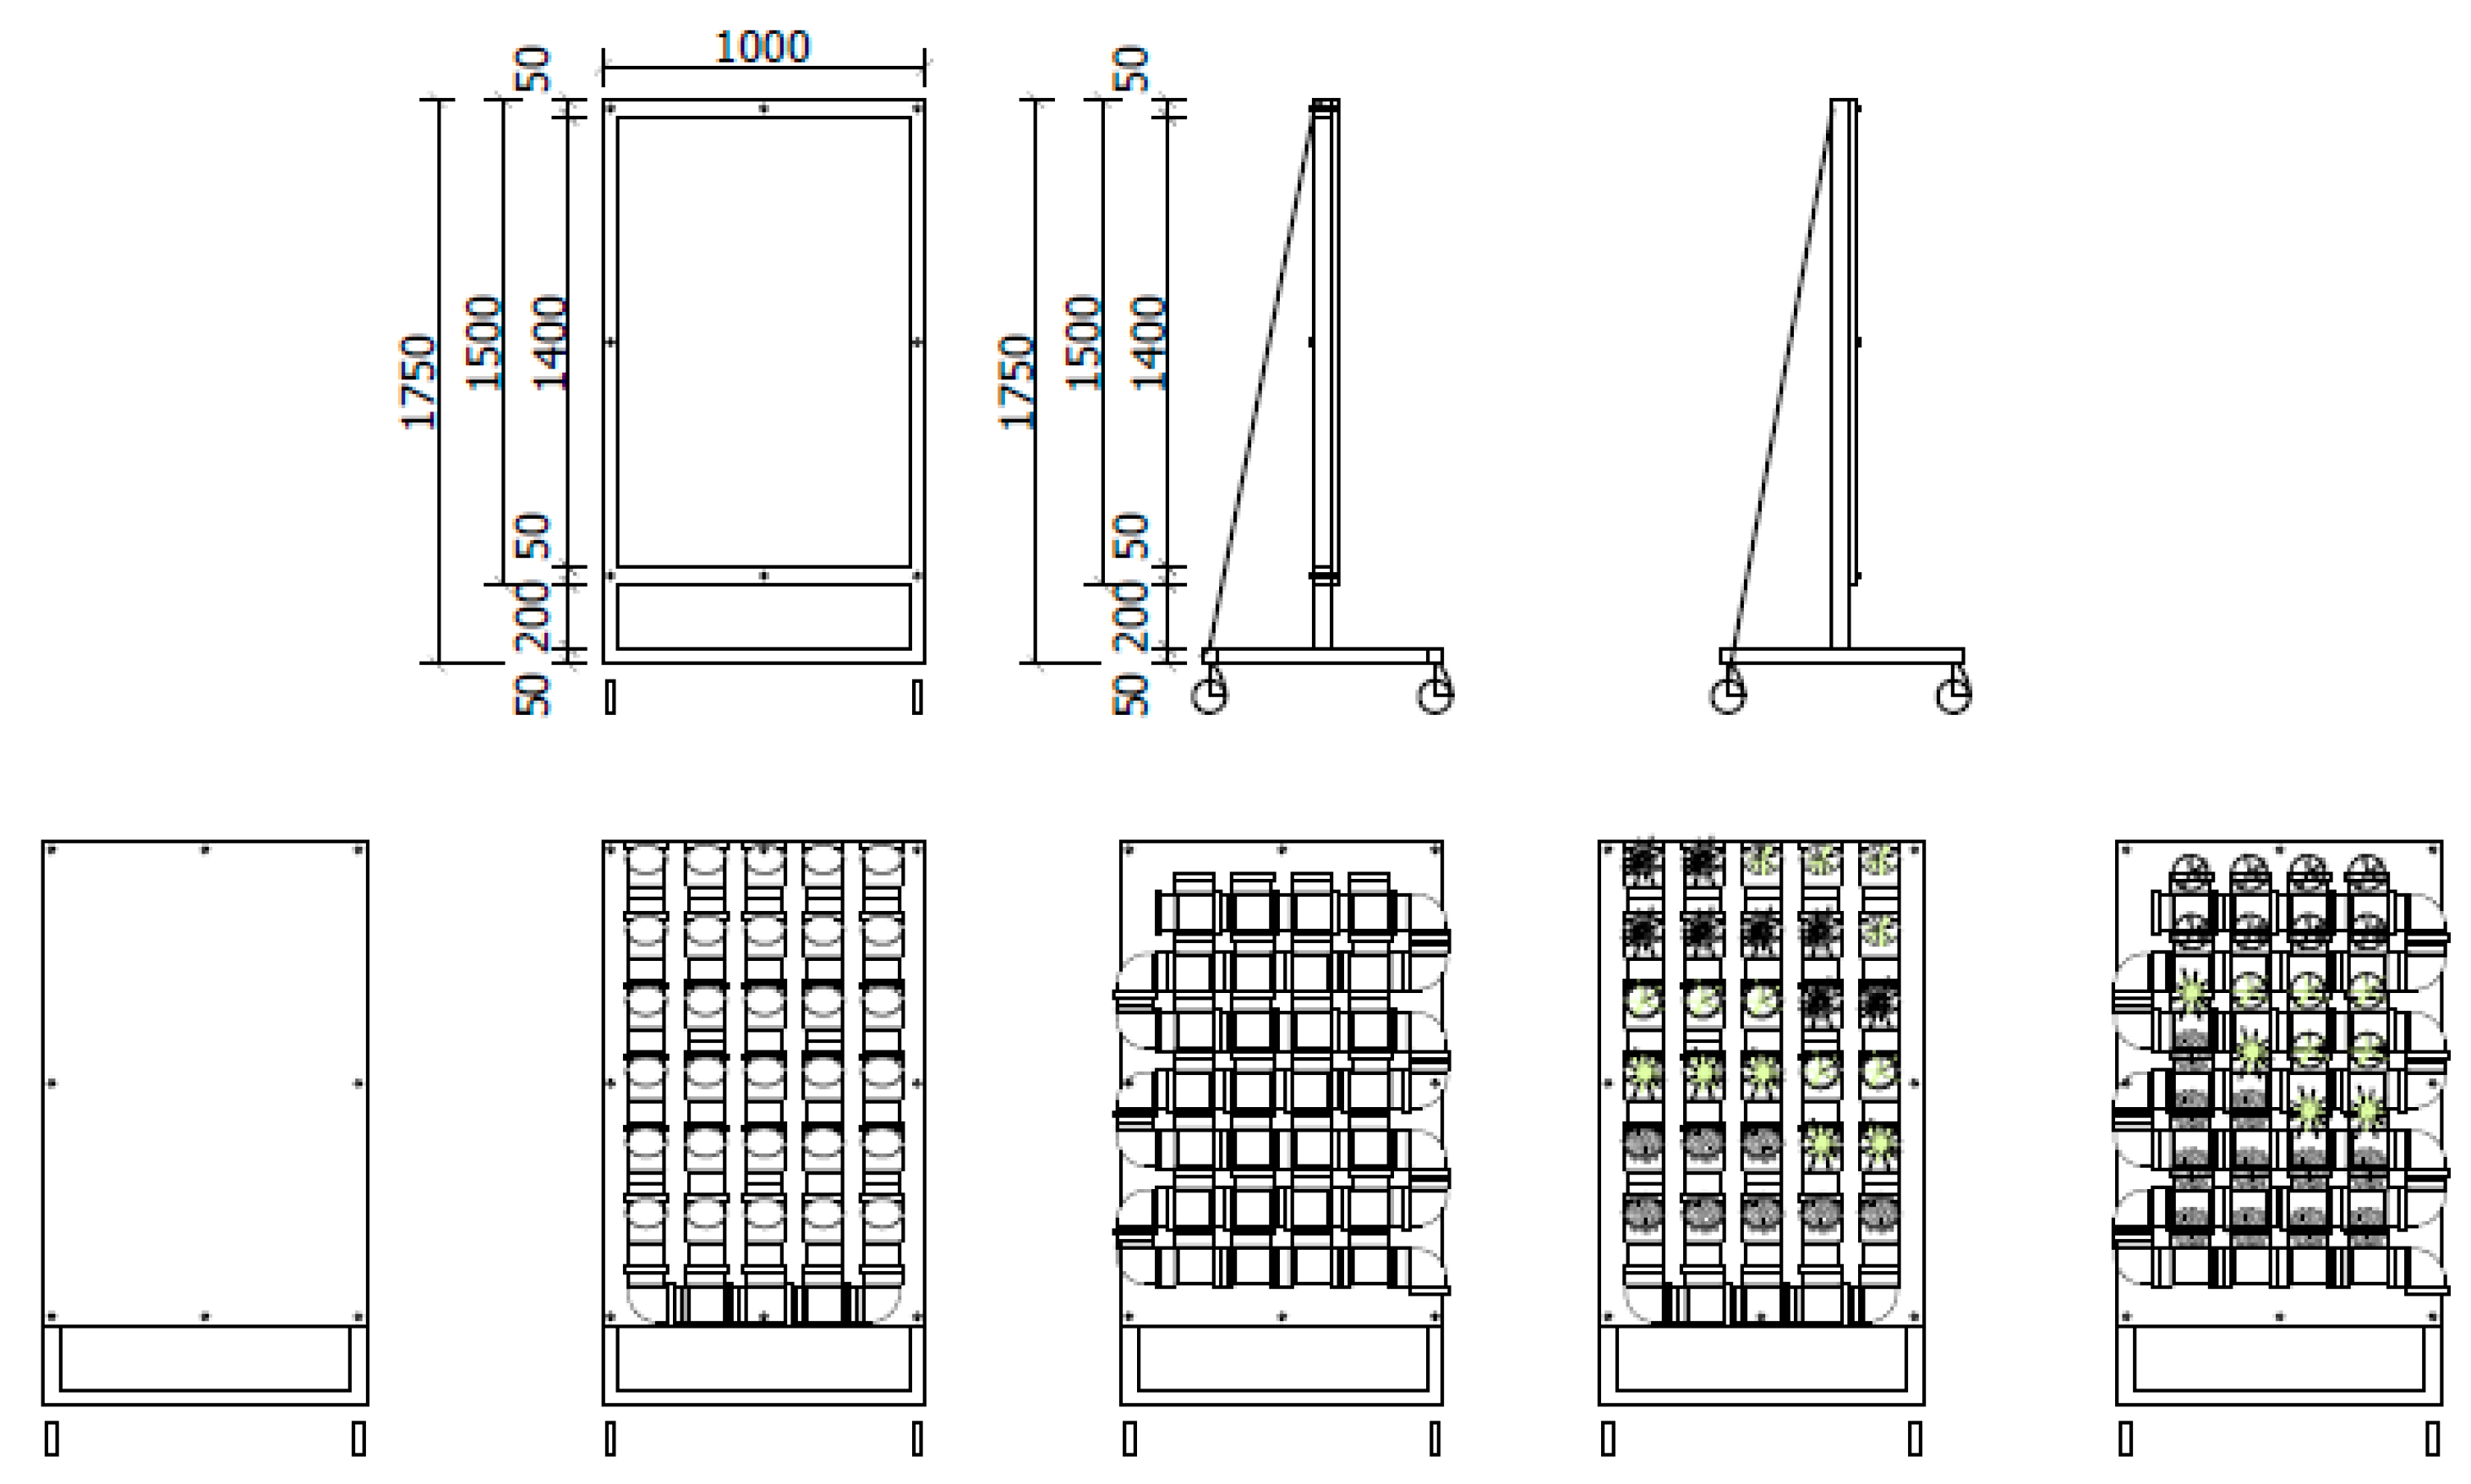
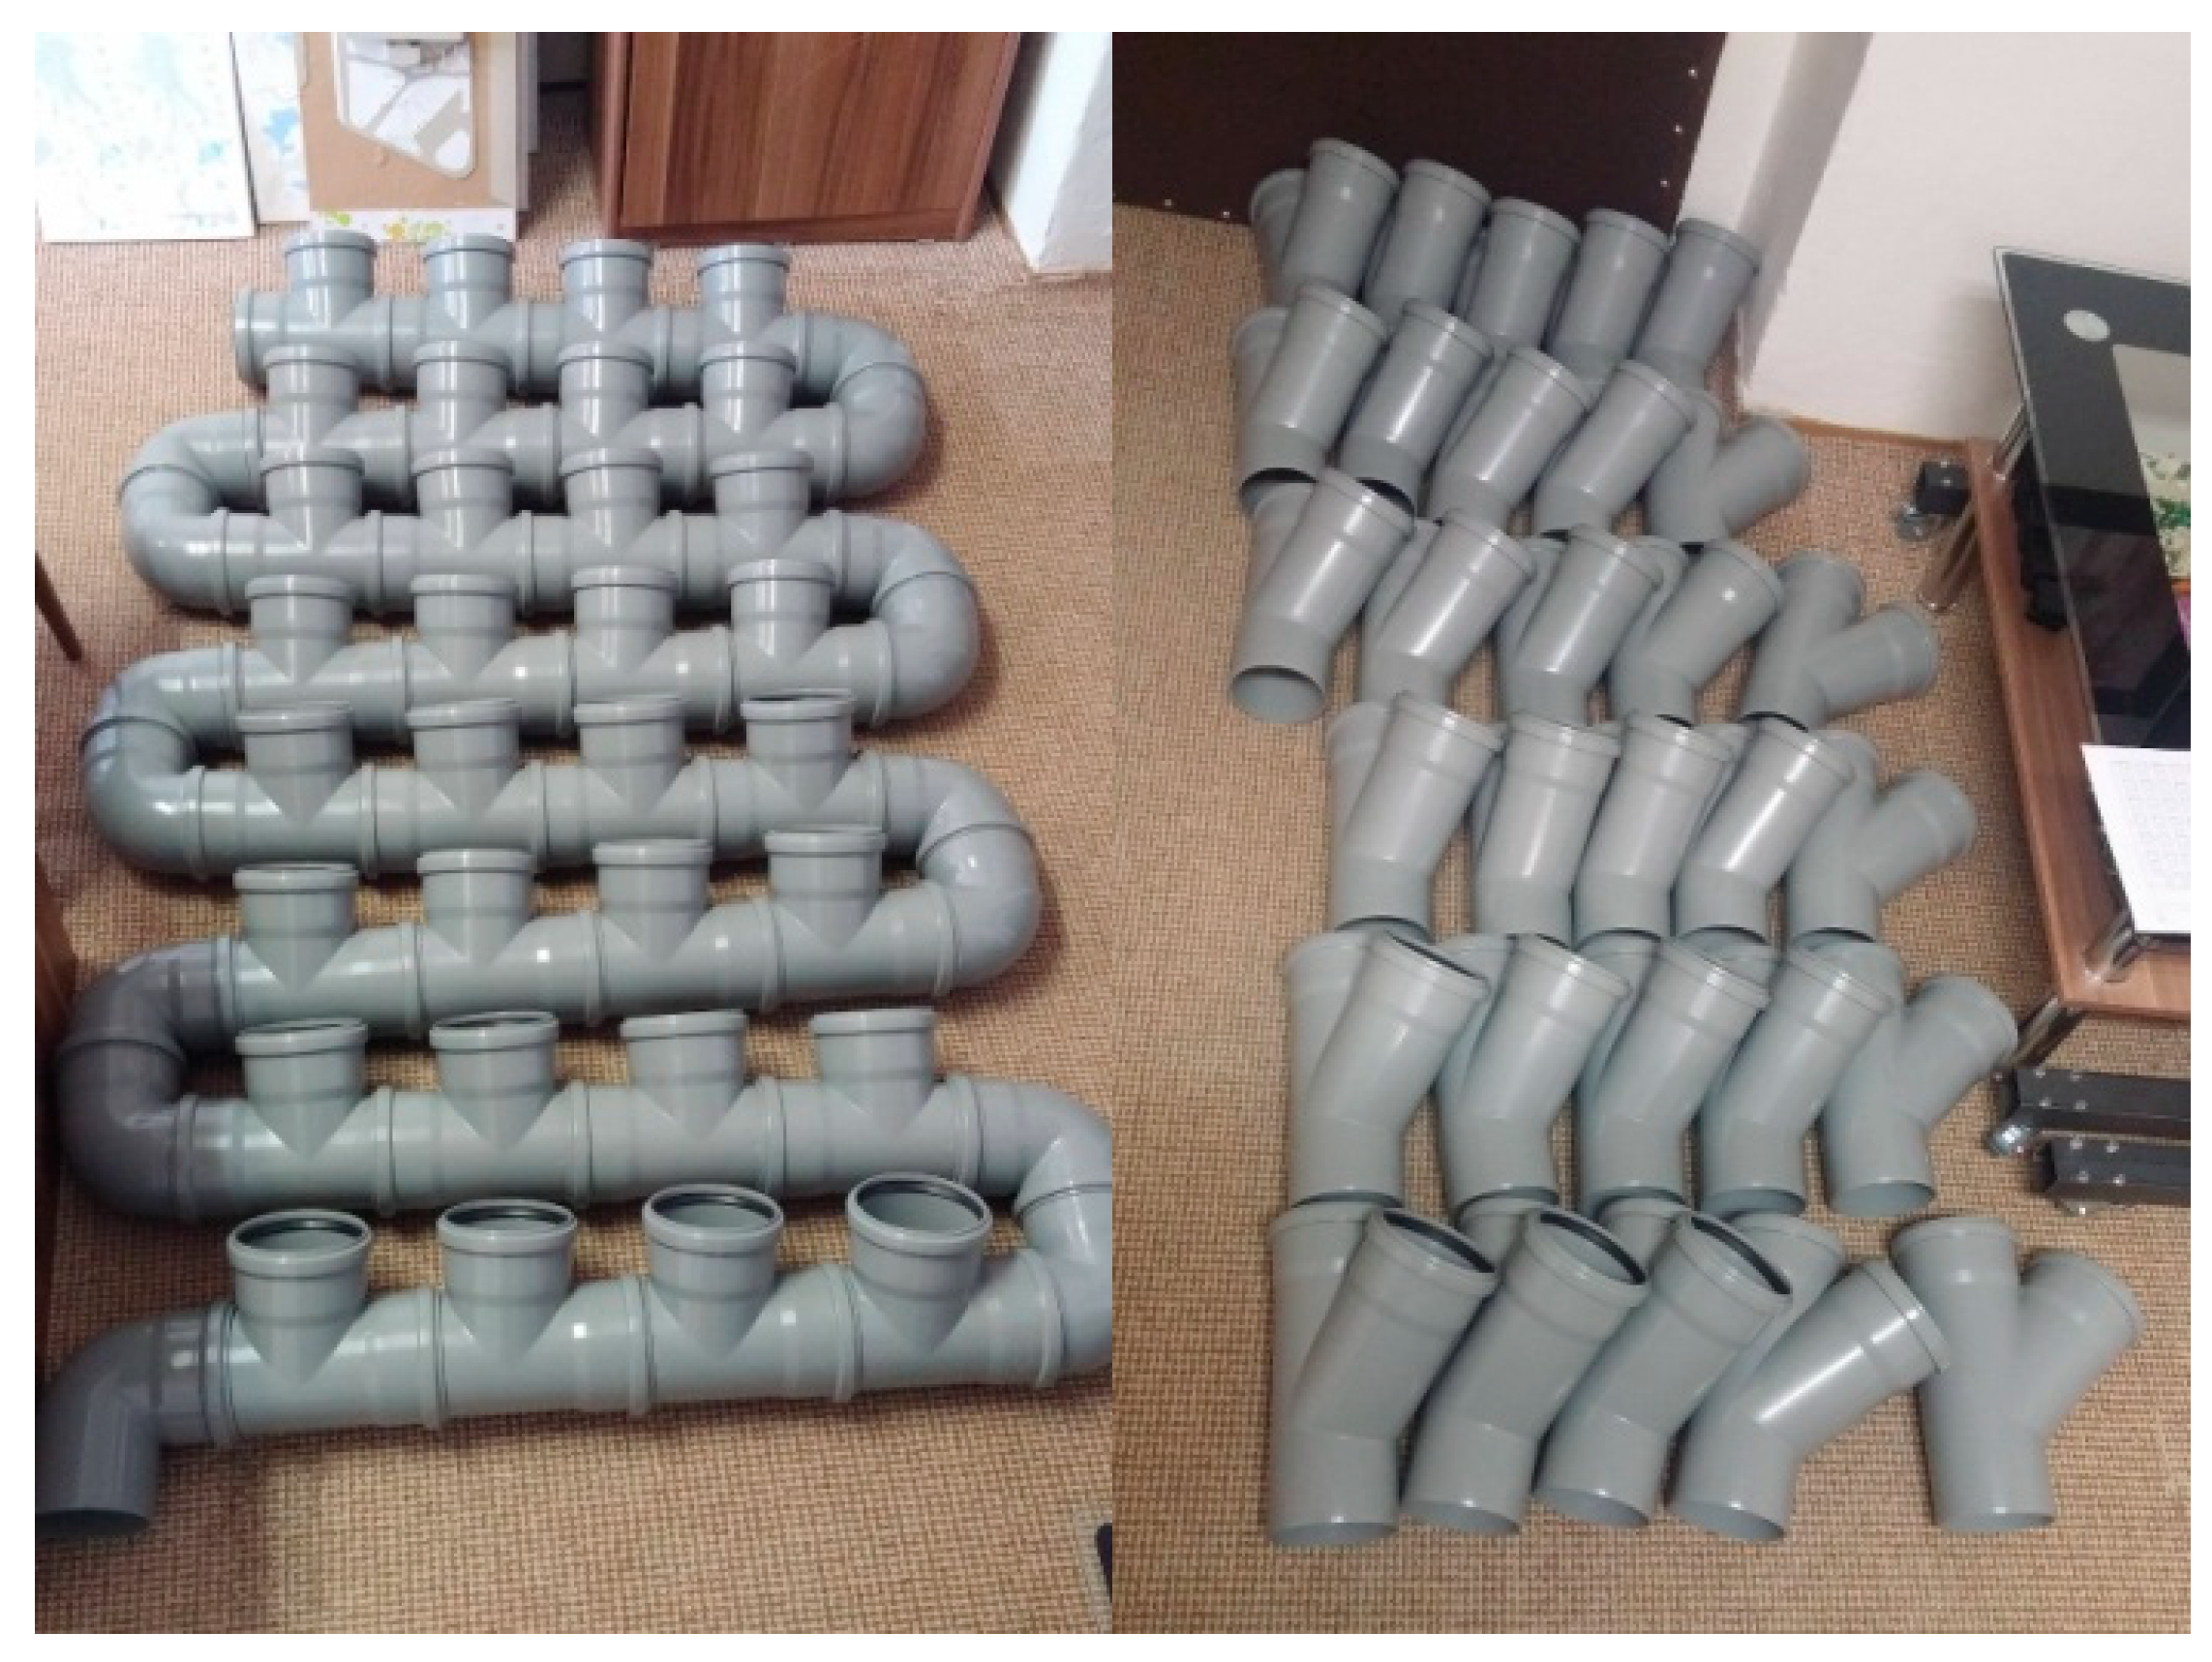
2.3. Green Wall
3. Experiment with 20 Respondents
3.1. Effect on Well-Being
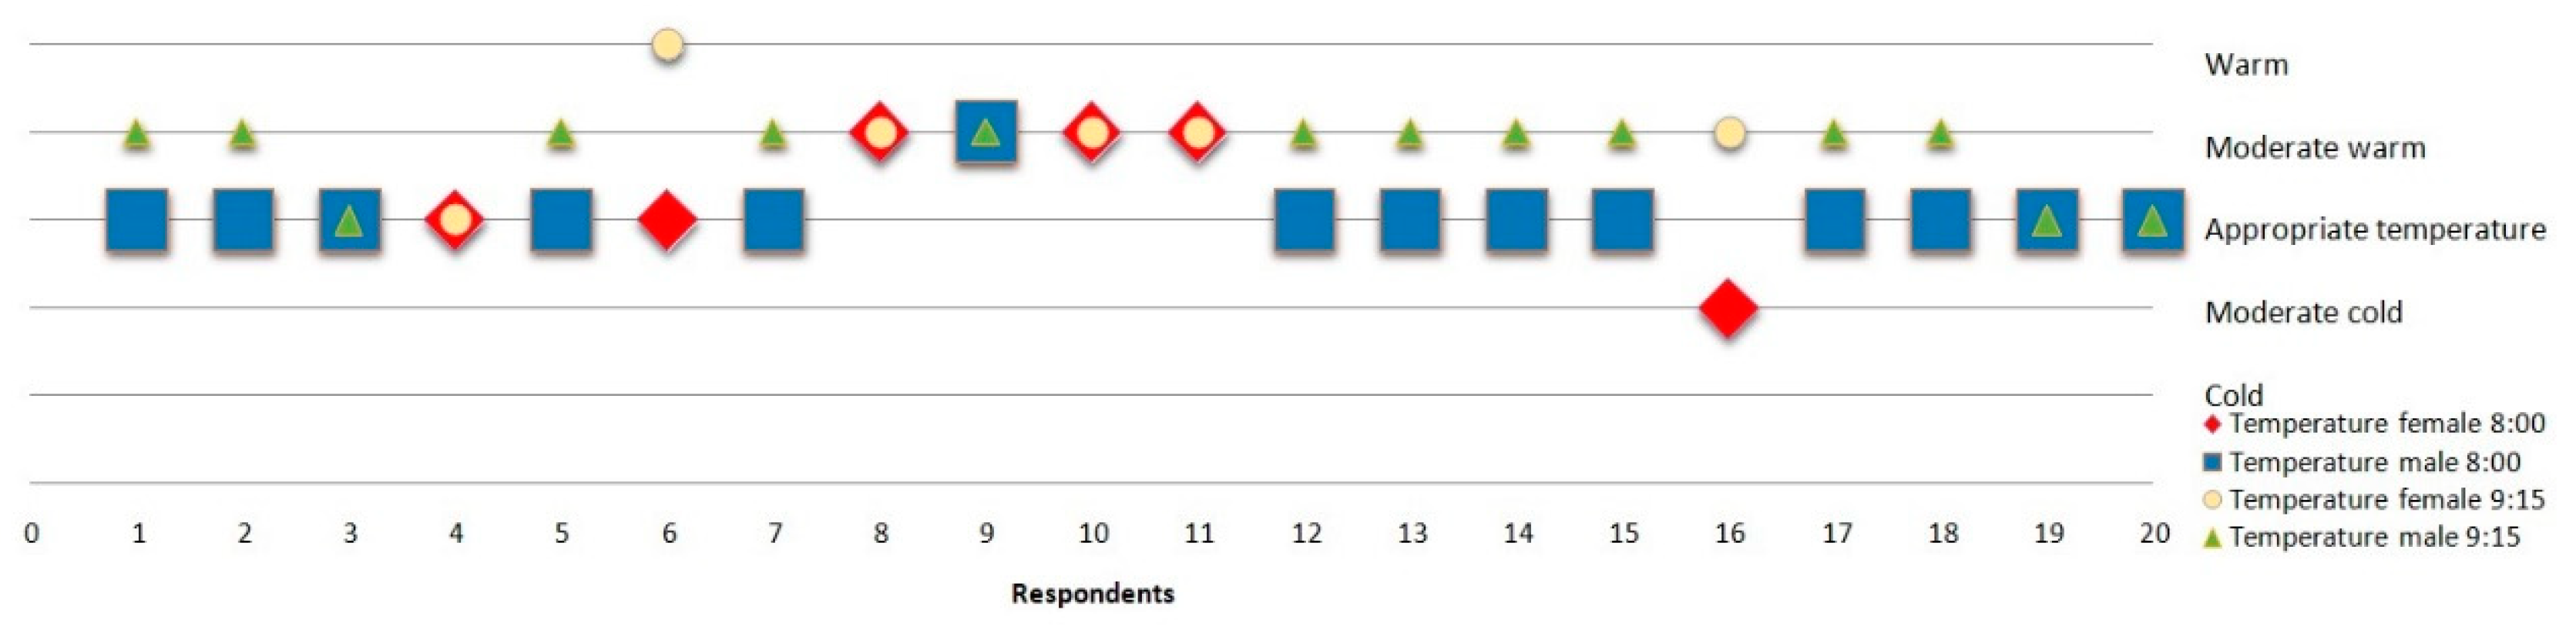
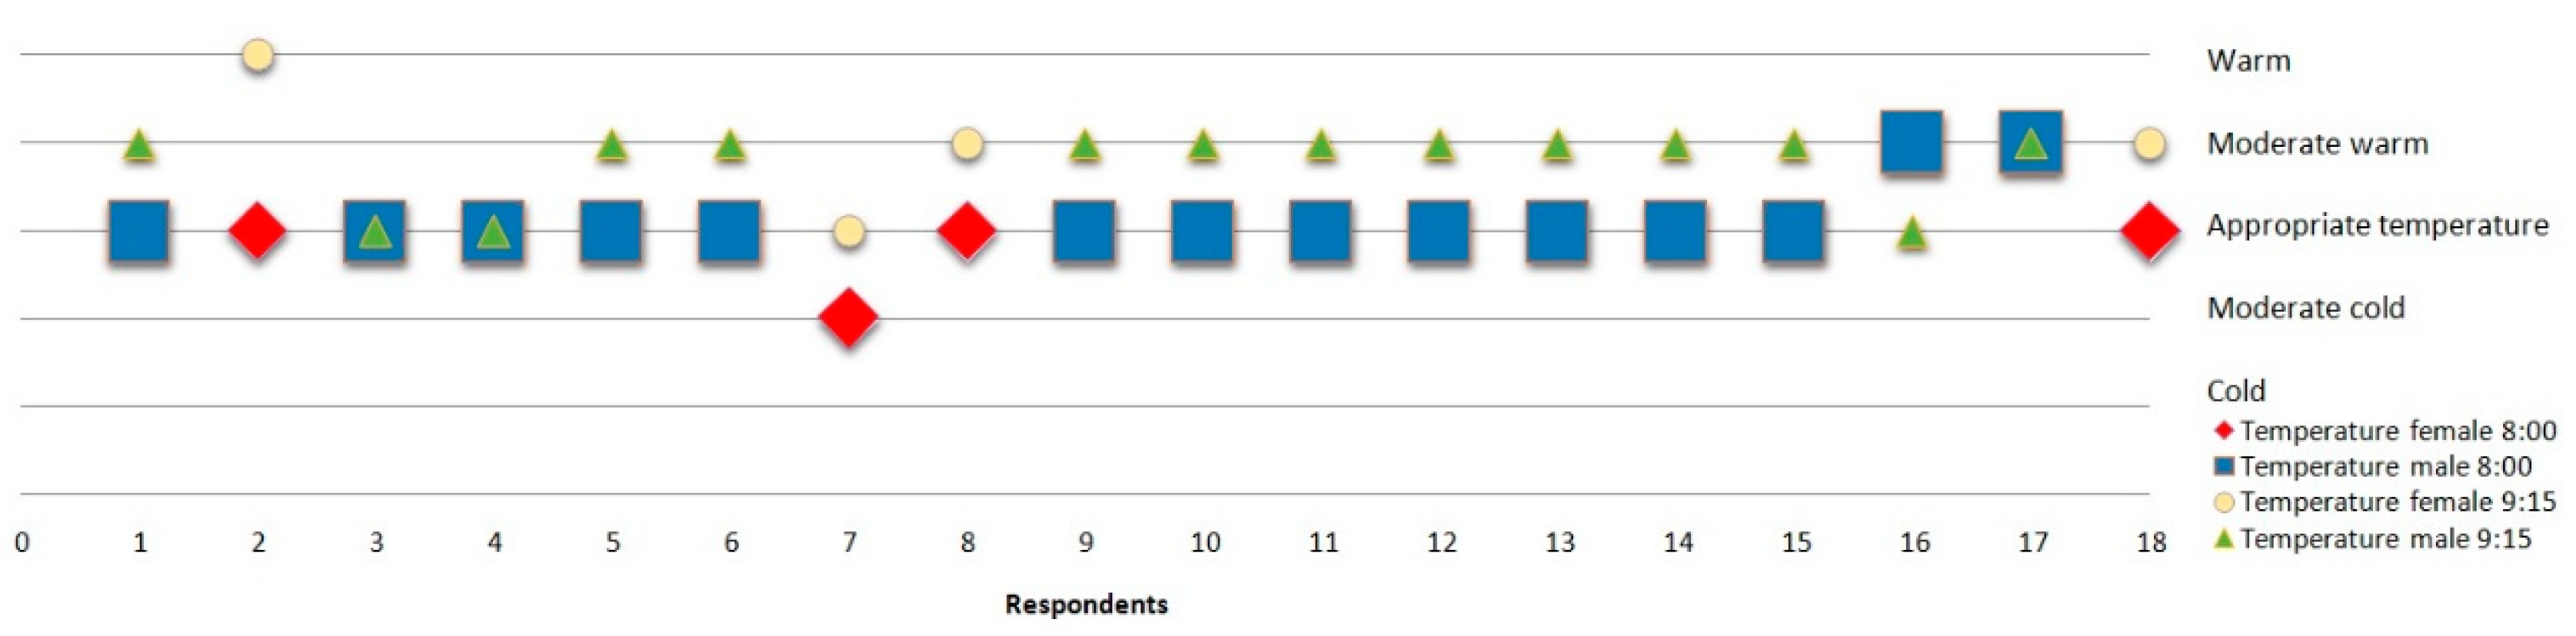
3.1.1. Effect on Respondents, Change in Temperature
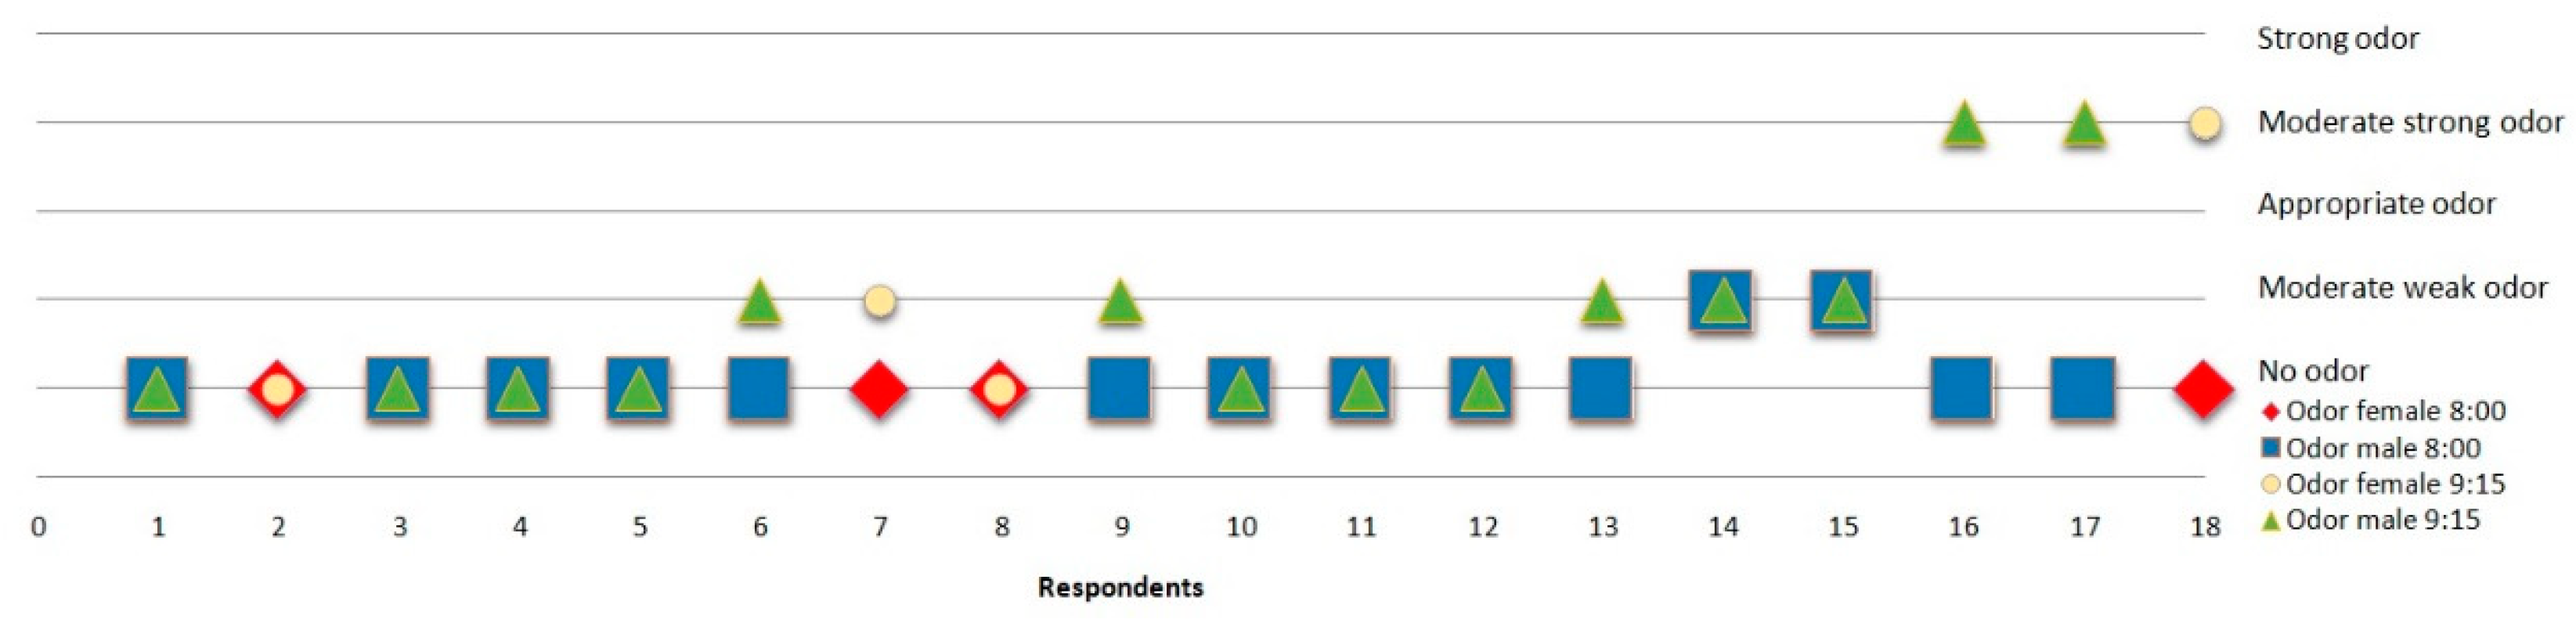
3.1.2. Effect on Respondents, Change in Odor
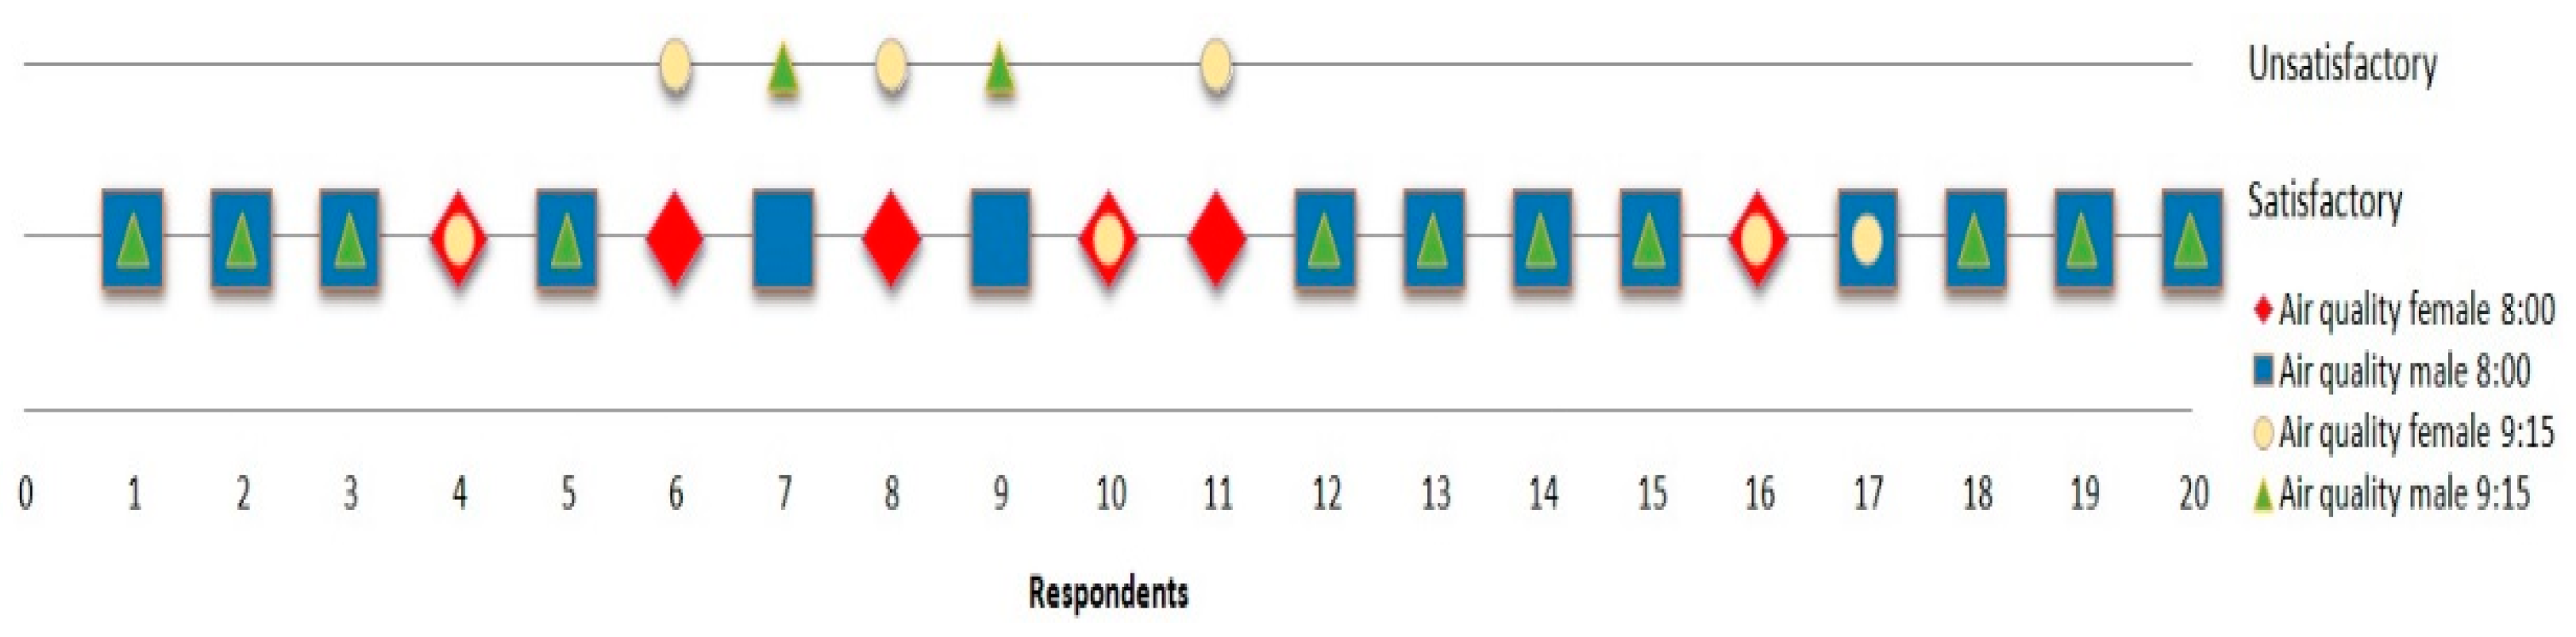
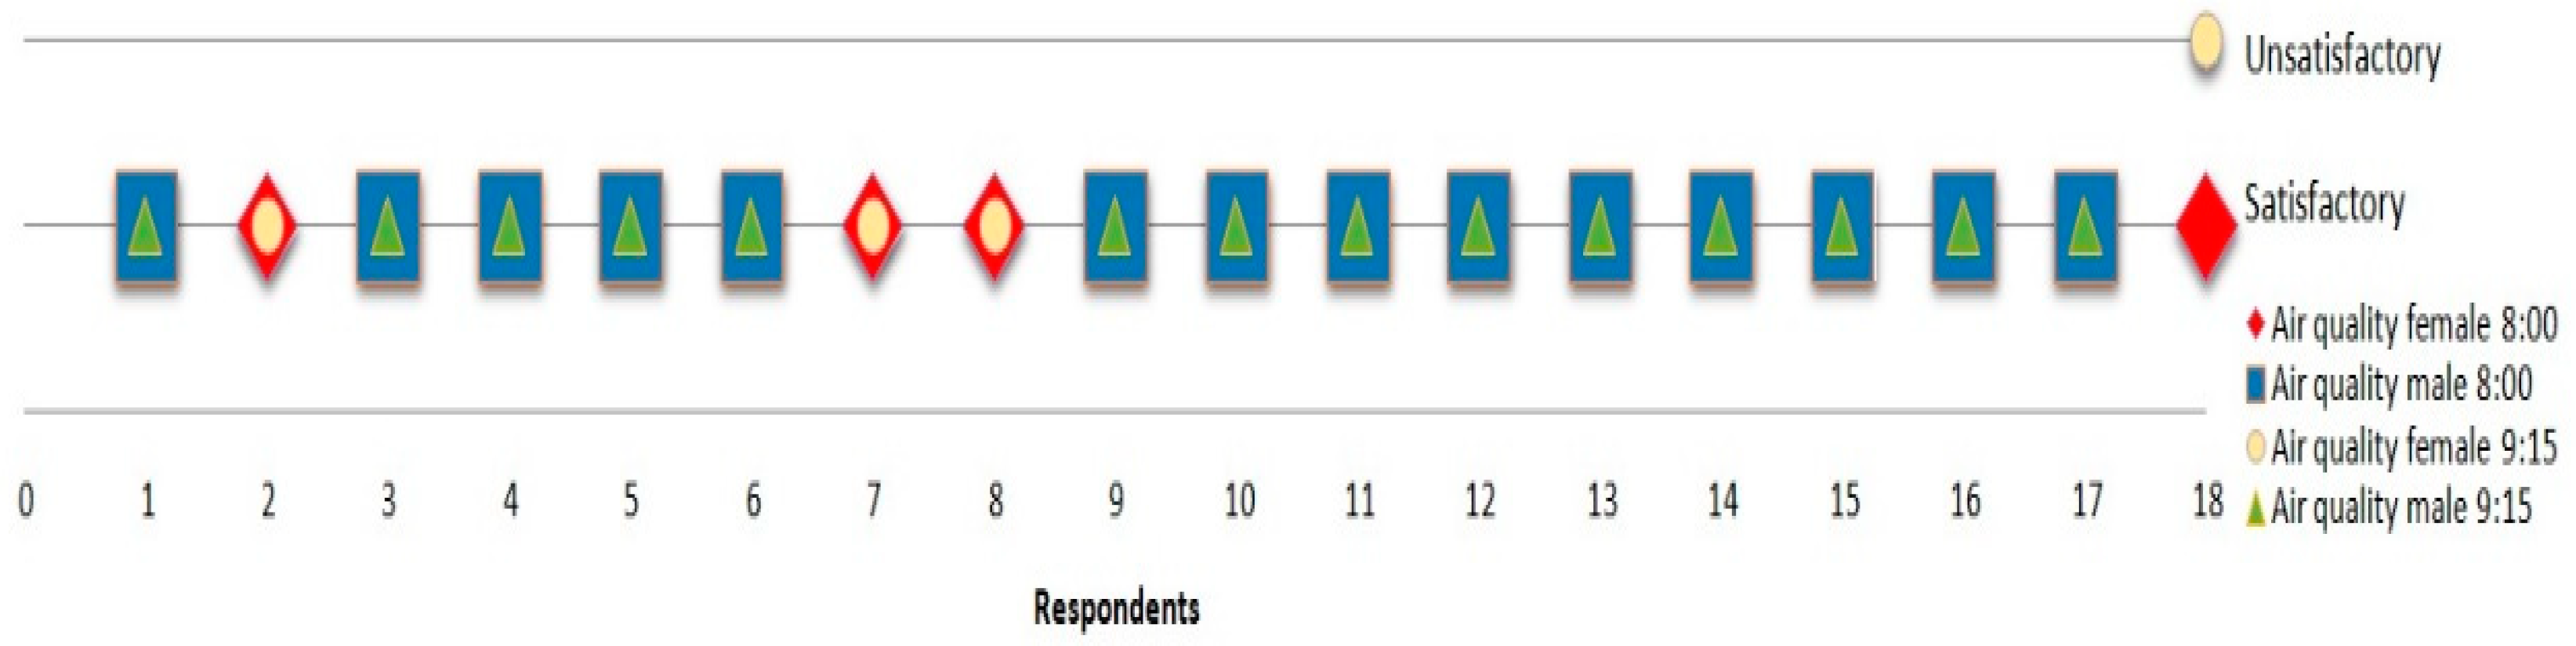
3.1.3. Effect on Respondents, Change in Air Quality
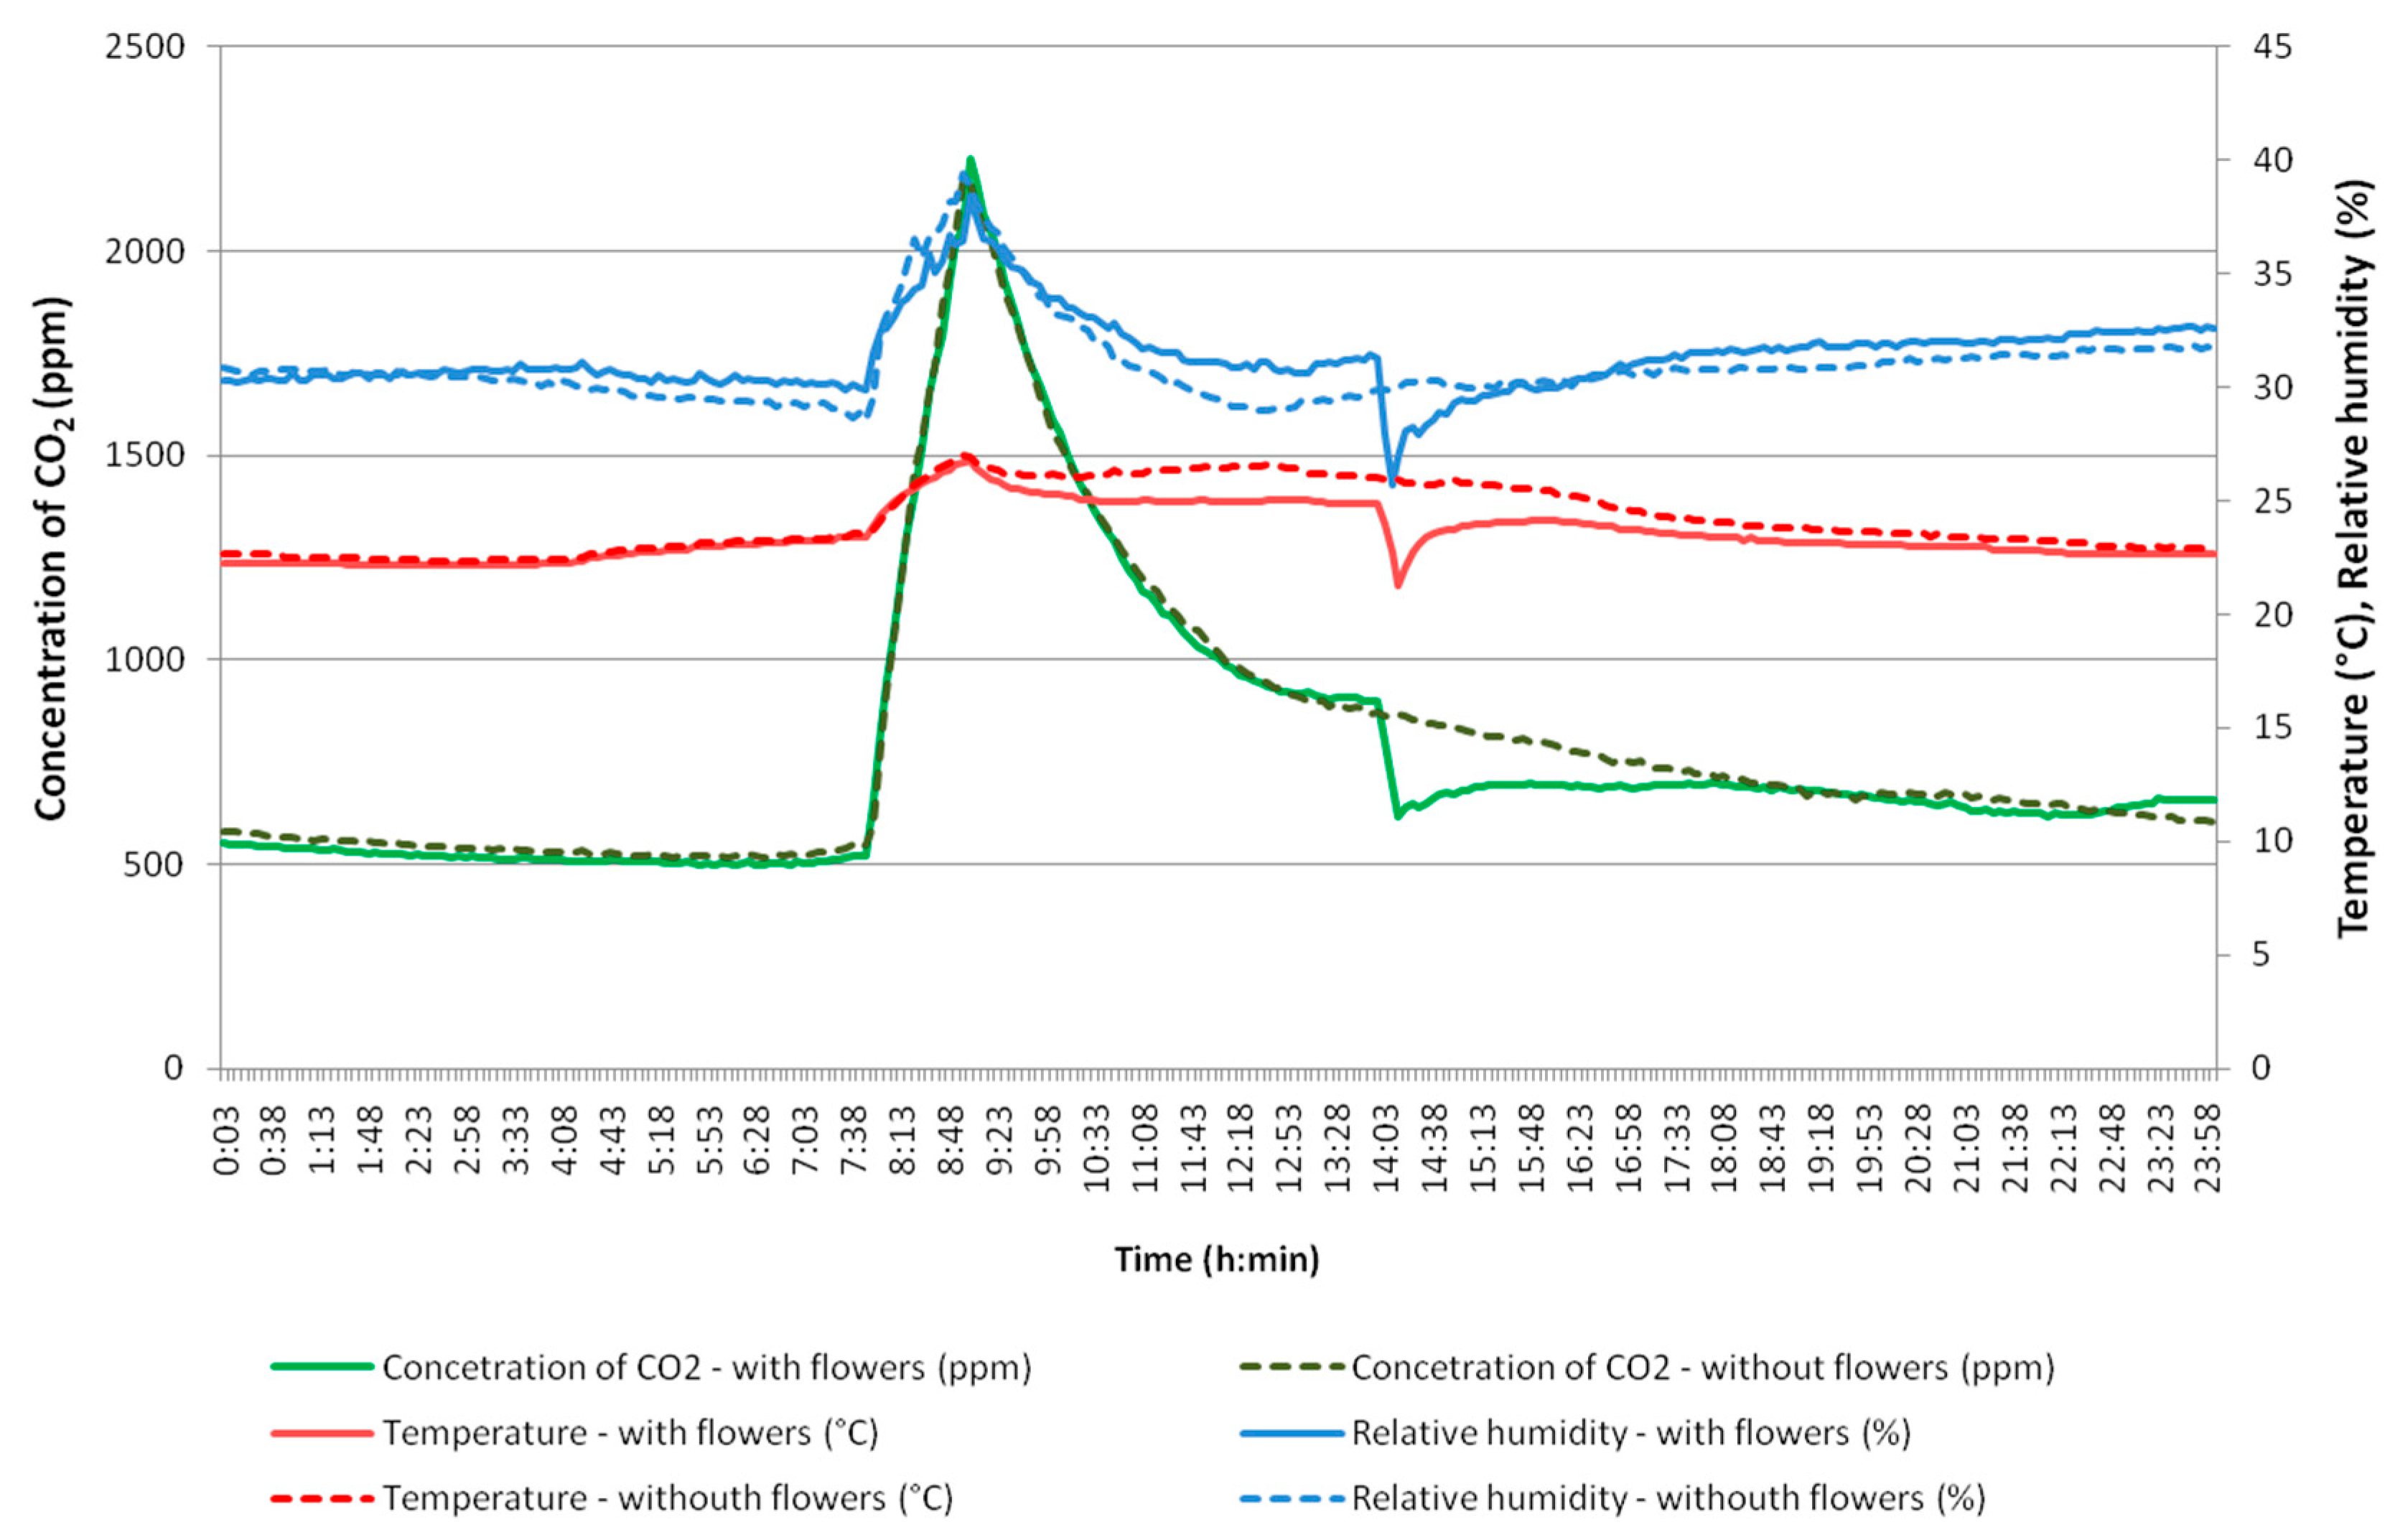
3.2. Change in Relative Humidity
3.3. Change in Air Temperature
3.4. Change in CO2
4. Conclusions
Author Contributions
Funding
Acknowledgments
Conflicts of Interest
References
- Benvenuti, S.; Malandrin, V.; Pardossi, A. Germination ecology of wild living walls for sustainable verticalgarden in urban environment. Sci. Hortic. 2016, 203, 185–191. [Google Scholar] [CrossRef]
- Hoyle, H.; Hitchmough, J.; Jorgensen, A. All about the ‘wow factor’? The relationships between aesthetics, restorative effect and perceived biodiversity in designed urban planting. Landsc. Urban Plan. 2017, 164, 109–123. [Google Scholar] [CrossRef]
- Francis, R.A.; Lorimer, J. Urban reconciliation ecology: The potential of living roofs and walls. J. Environ. Manag. 2011, 92, 1429–1437. [Google Scholar] [CrossRef] [PubMed]
- Climate: Average Monthly Weather in Kosice, Slovakia, 2018. Available online: www.weather-and-climate.com/average-monthly-Rainfall-Temperature-Sunshine,Kosice,Slovakia (accessed on 1 January 2020).
- Missouri Botanical Garden. Dryopteris Erythrosora ‘Brilliance’. Available online: www.missouribotanicalgarden.org/PlantFinder/PlantFinderDetails.aspx?kempercode=e149 (accessed on 1 January 2020).
- Missouri Botanical Garden. Scindapsus Aureus. Available online: www.missouribotanicalgarden.org/PlantFinder/PlantFinderDetails.aspx?kempercode=b594 (accessed on 1 January 2020).
- Missouri Botanical Garden. Aglaonema ‘Silver Queen’. Available online: www.missouribotanicalgarden.org/PlantFinder/PlantFinderDetails.aspx?taxonid=243522&isprofile=0&hf=1 (accessed on 1 January 2020).
- Missouri Botanical Garden. Philodendron Hederaceum. Available online: www.missouribotanicalgarden.org/PlantFinder/PlantFinderDetails.aspx?kempercode=b611 (accessed on 1 January 2020).
- Missouri Botanical Garden. Chlorophytum Comosum ‘Variegatum’. Available online: www.missouribotanicalgarden.org/PlantFinder/PlantFinderDetails.aspx?kempercode=b547 (accessed on 1 January 2020).
- Missouri Botanical Garden. Anthurium Andraeanum. Available online: www.missouribotanicalgarden.org/PlantFinder/PlantFinderDetails.aspx?taxonid=276219&isprofile=0&hf=1 (accessed on 1 January 2020).
- Merriam-Webster. 2017. Questionnaire. Available online: www.merriam-webster.com/dictionary/questionnaire (accessed on 1 January 2020).
- Chaumillon, R.; Romeas, T.; Paillard, C.; Bernardin, D.; Giraudet, G.; Bouchard, J.F.; Fauberta, J. Enhancing data visualisation to capture the simulator sickness phenomenon: On the usefulness of radar charts. Data Brief 2017, 13, 301–305. [Google Scholar] [CrossRef] [PubMed]
- Malys, L.; Musya, M.; Inard, C. A hydrothermal model to assess the impact of green walls on urban microclimate and building energy consumption. Build. Environ. 2014, 73, 187–197. [Google Scholar] [CrossRef]
- Otteléa, M.; Perini, K.; Fraaij, A.L.A.; Haas, E.M.; Raiteri, R. Comparative life cycle analysis for green facades and living wall systems. Energy Build. 2011, 43, 3419–3429. [Google Scholar] [CrossRef]
- Medl, A.; Mayr, S.; Rauch, H.P.; Weihs, P.; Florinetha, F. Microclimatic conditions of ‘Green Walls’, a new restorationtechnique for steep slopes based on a steel grid construction. Ecol. Eng. 2017, 101, 39–45. [Google Scholar] [CrossRef]


| Material | Object | Area | Real Area m2 | Total Area m2 | Percentage % |
|---|---|---|---|---|---|
| Engineered wood | OSB board | Floor | 59.2 | 59.2 | 24.6 |
| Plaster | Wall | Ceiling | 61.2 | 106.0 | 44.0 |
| North wall | 17.5 | ||||
| East wall | 9.8 | ||||
| South wall | 17.5 | ||||
| Glass | Glass wall + Entrance door | West wall | 36.2 | 56.9 | 23.6 |
| Windows | East wall | 20.7 | |||
| Steel | Heaters | East wall | 4.5 | 4.5 | 1.8 |
| Wood | Glass wall + Entrance door | West wall | 4.1 | 6.4 | 2.7 |
| Windows | 2.3 | ||||
| Plants | Green wall | 7.9 * | 3.3 | 7.9 * | 3.3 |
| TOTAL | 236.0 | 240.9 | 100 | ||
Publisher’s Note: MDPI stays neutral with regard to jurisdictional claims in published maps and institutional affiliations. |
© 2020 by the authors. Licensee MDPI, Basel, Switzerland. This article is an open access article distributed under the terms and conditions of the Creative Commons Attribution (CC BY) license (https://creativecommons.org/licenses/by/4.0/).
Share and Cite
Poórová, Z.; Turcovská, A.; Kapalo, P.; Vranayová, Z. The Effect of Green Walls on Humidity, Air Temperature, Co2 and Well-Being of People. Environ. Sci. Proc. 2020, 2, 56. https://0-doi-org.brum.beds.ac.uk/10.3390/environsciproc2020002056
Poórová Z, Turcovská A, Kapalo P, Vranayová Z. The Effect of Green Walls on Humidity, Air Temperature, Co2 and Well-Being of People. Environmental Sciences Proceedings. 2020; 2(1):56. https://0-doi-org.brum.beds.ac.uk/10.3390/environsciproc2020002056
Chicago/Turabian StylePoórová, Zuzana, Adriana Turcovská, Peter Kapalo, and Zuzana Vranayová. 2020. "The Effect of Green Walls on Humidity, Air Temperature, Co2 and Well-Being of People" Environmental Sciences Proceedings 2, no. 1: 56. https://0-doi-org.brum.beds.ac.uk/10.3390/environsciproc2020002056