
Spatially Refined Time-Varying Reproduction Numbers of COVID-19 by Health District in Georgia, USA, March–December 2020


 , , ,
, , ,
Abstract
:1. Introduction
2. Materials and Methods
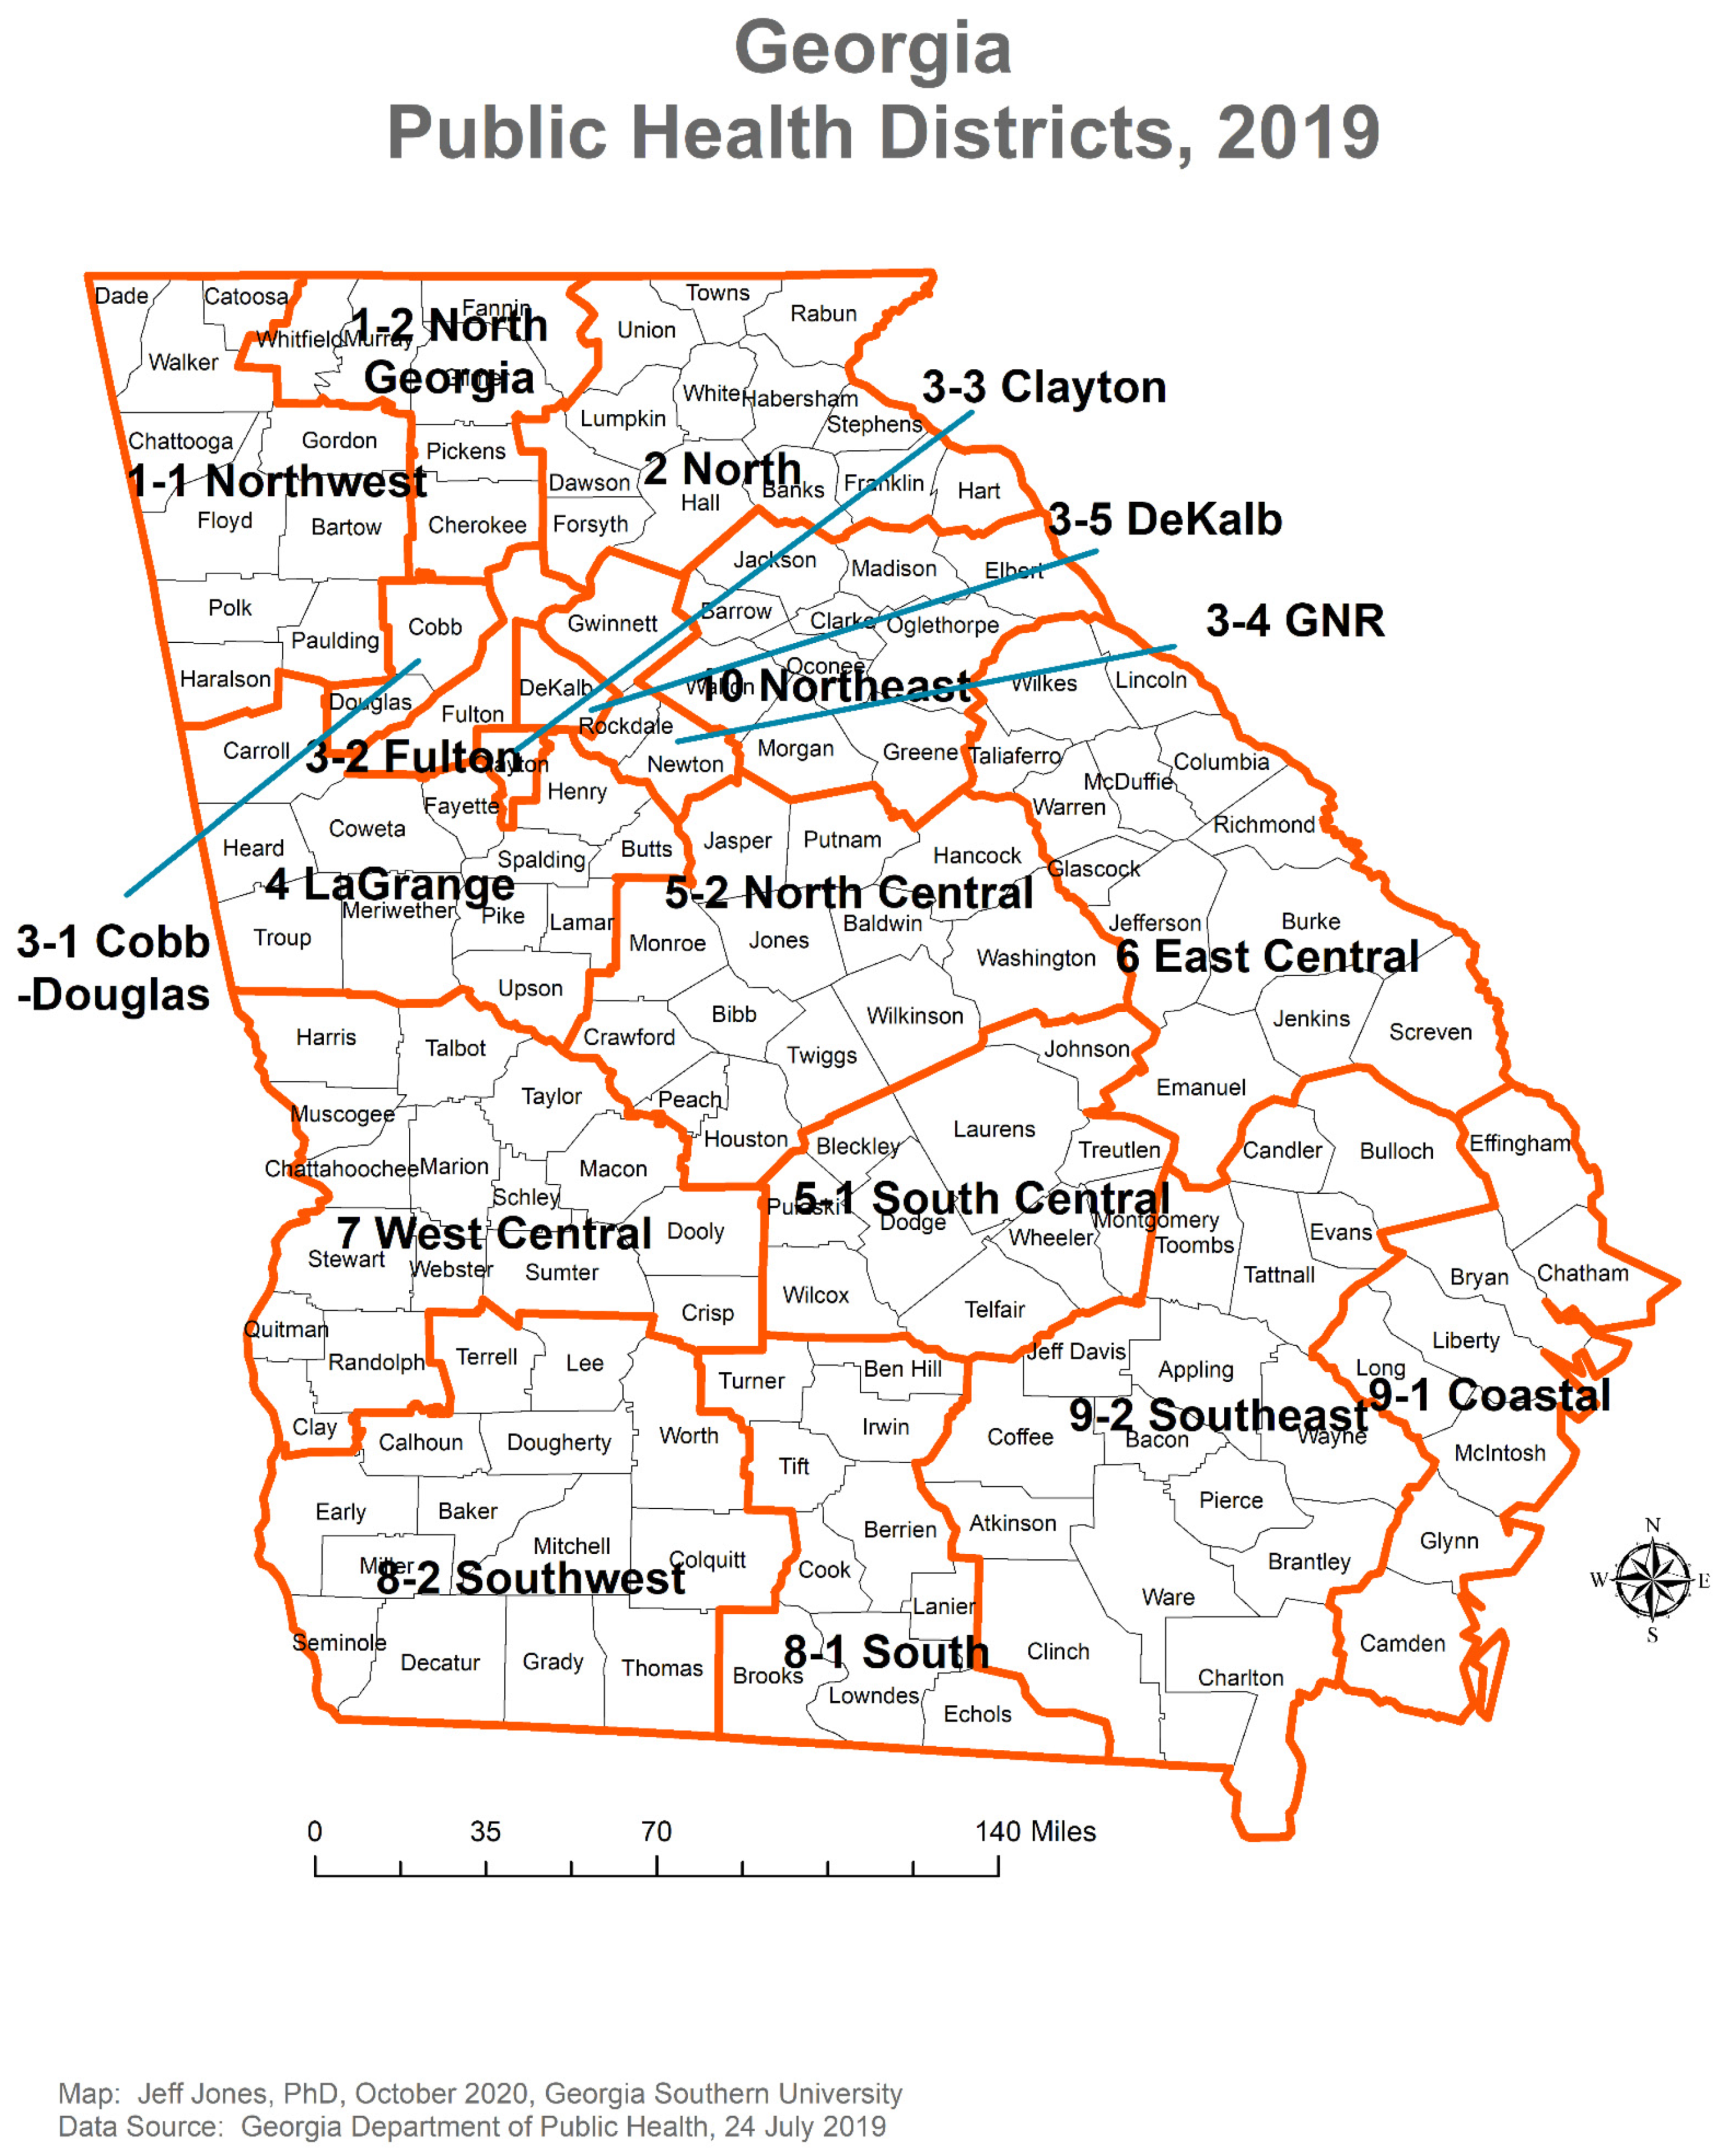
2.1. Data Acquisition
2.2. Statistical Analysis
2.3. Ethics
3. Results
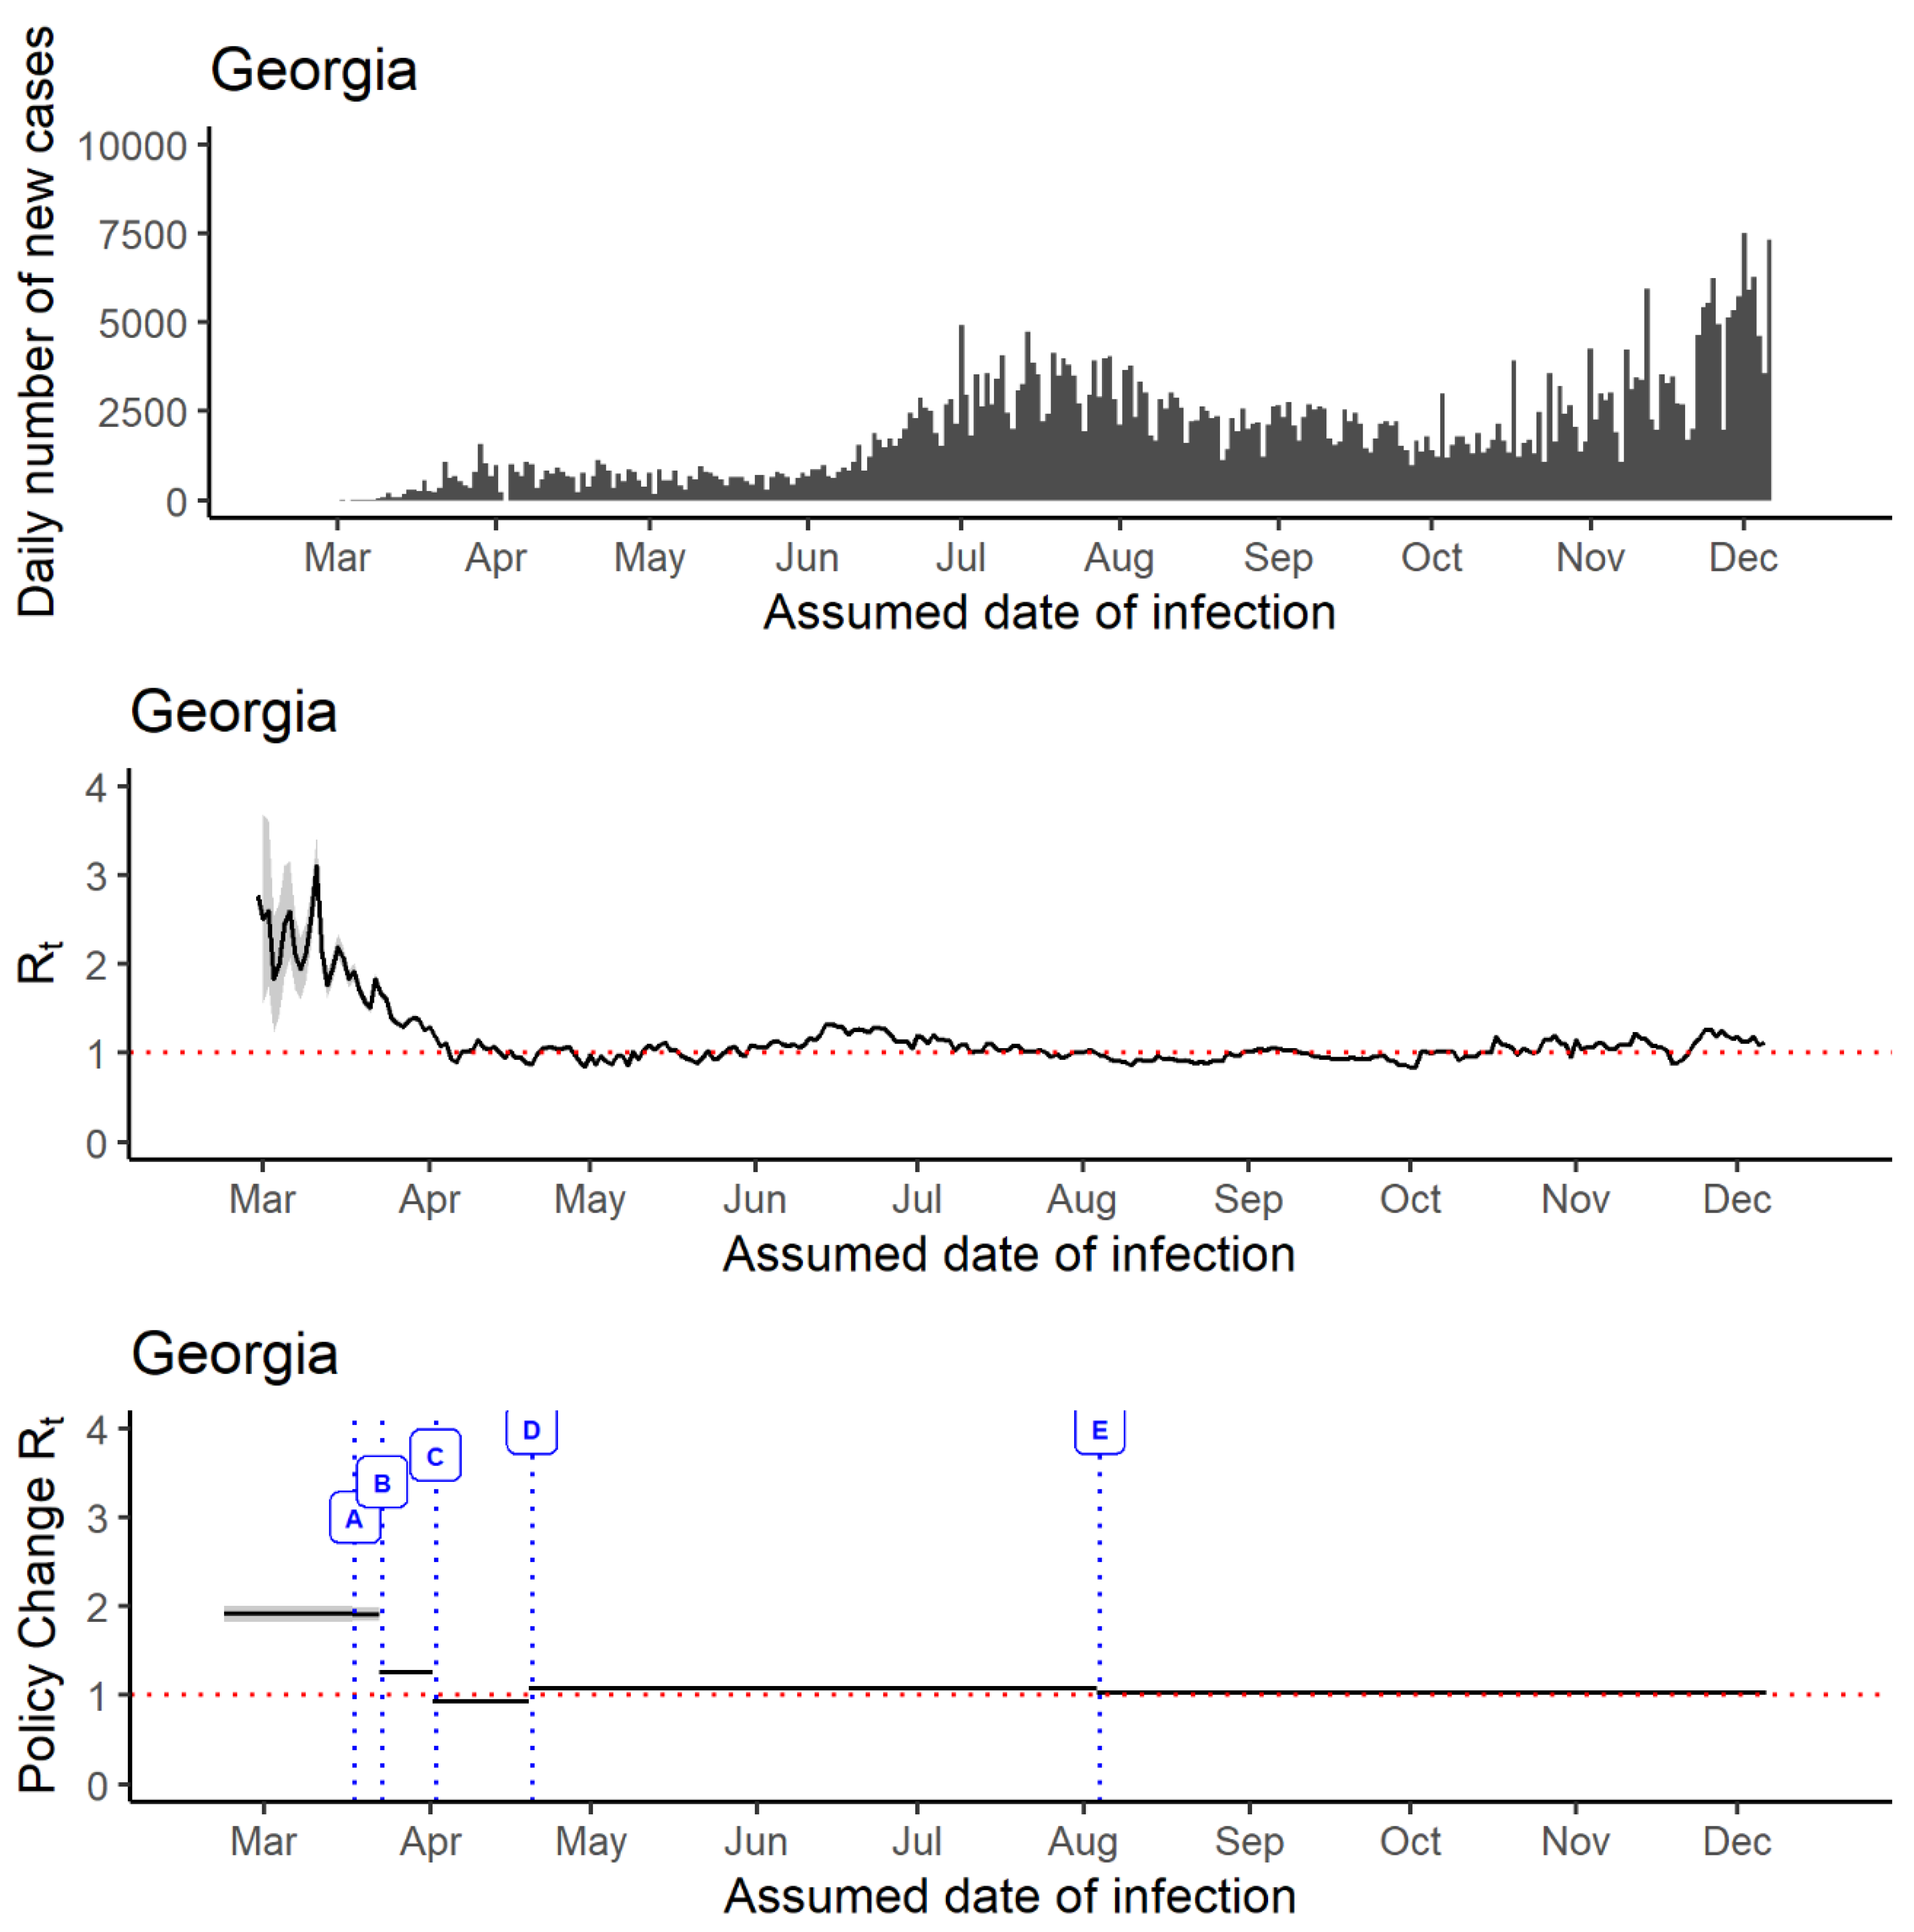
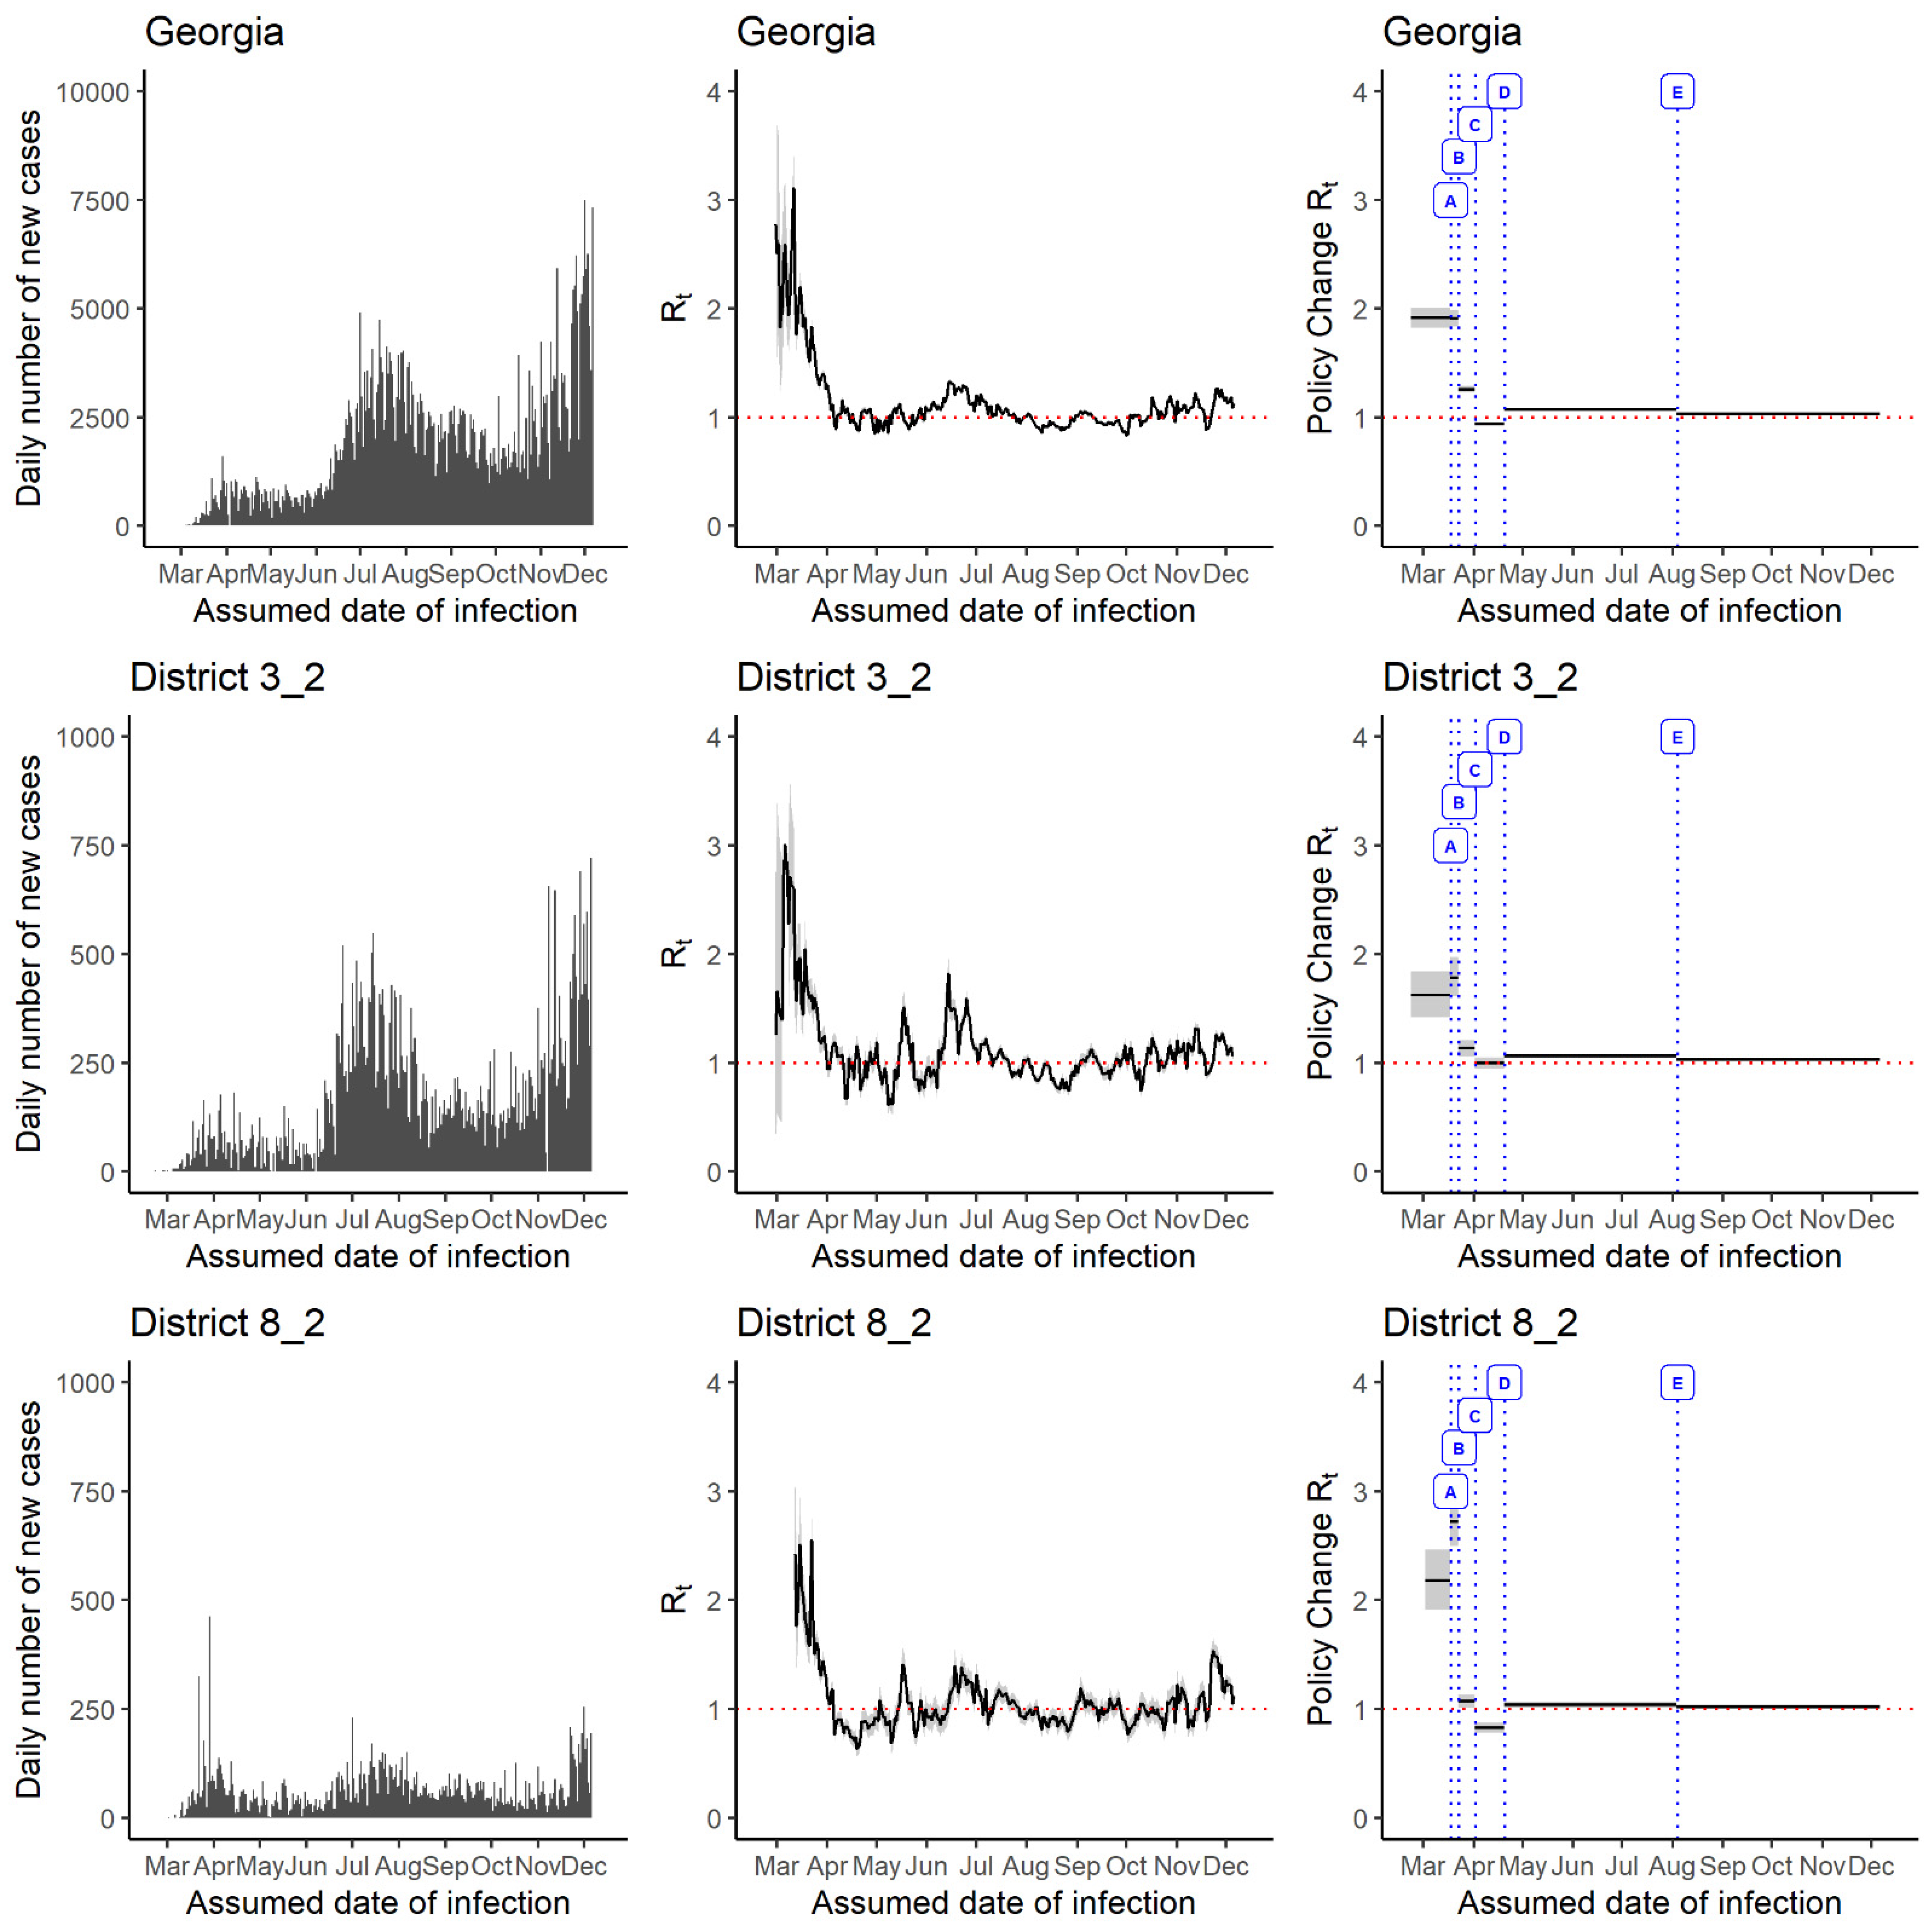
3.1. Rt Estimates
3.2. Comparison between Districts That Experienced Early and Late Arrival of Highest Rt Magnitude
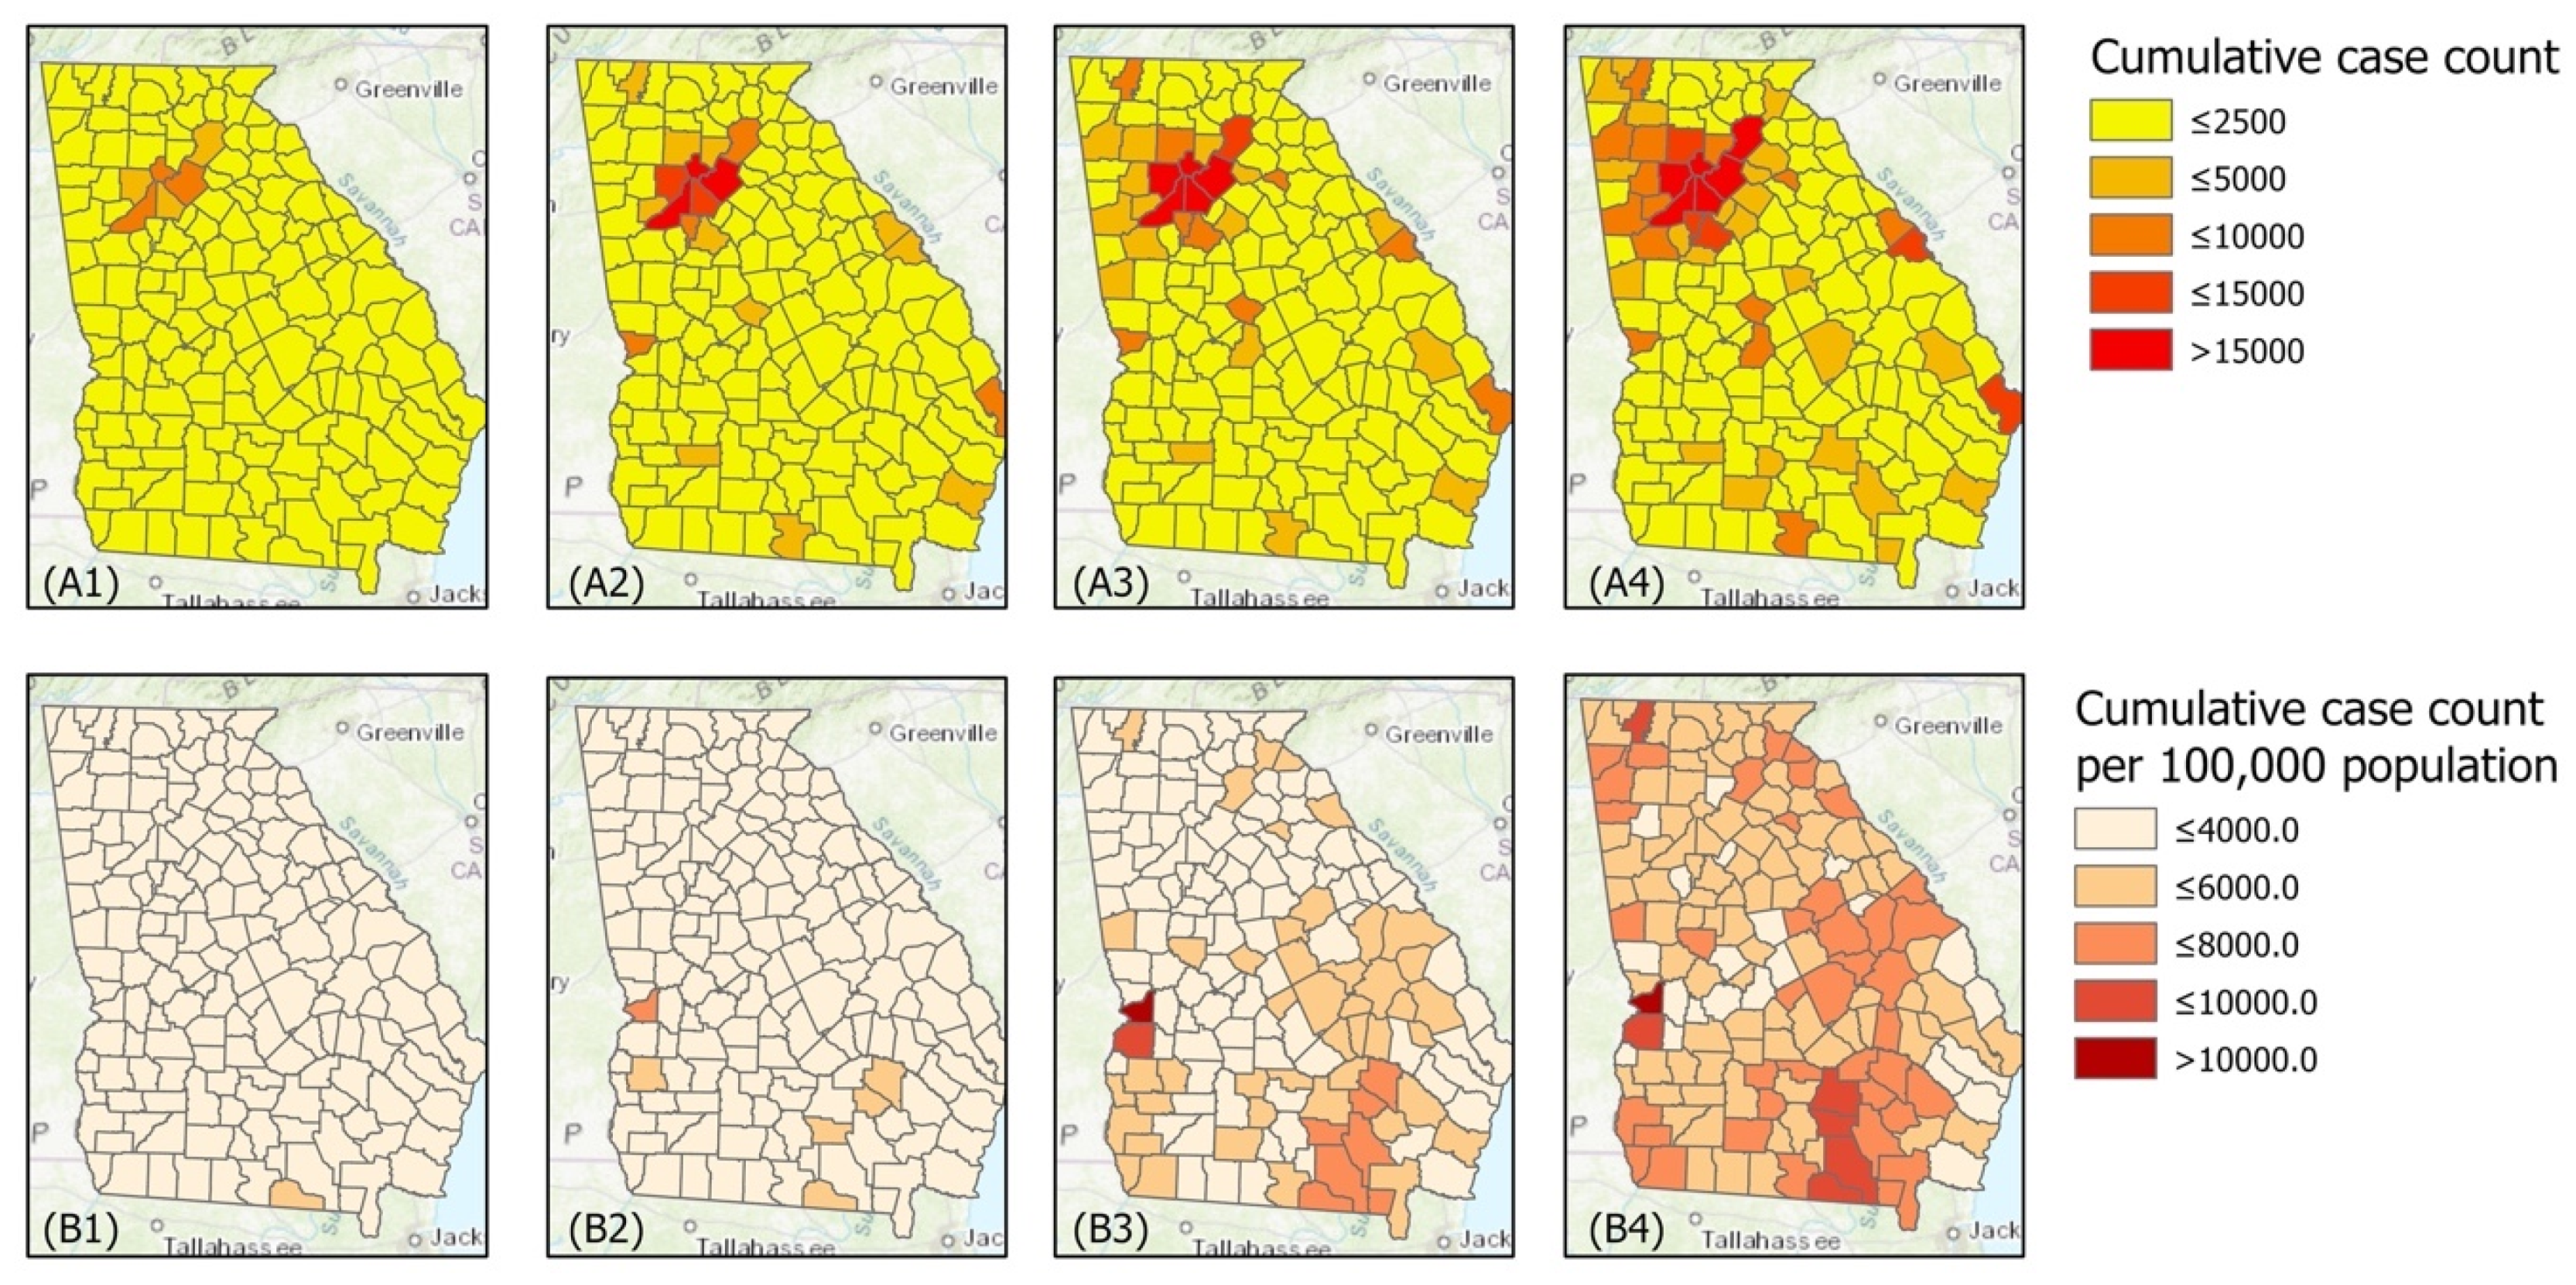
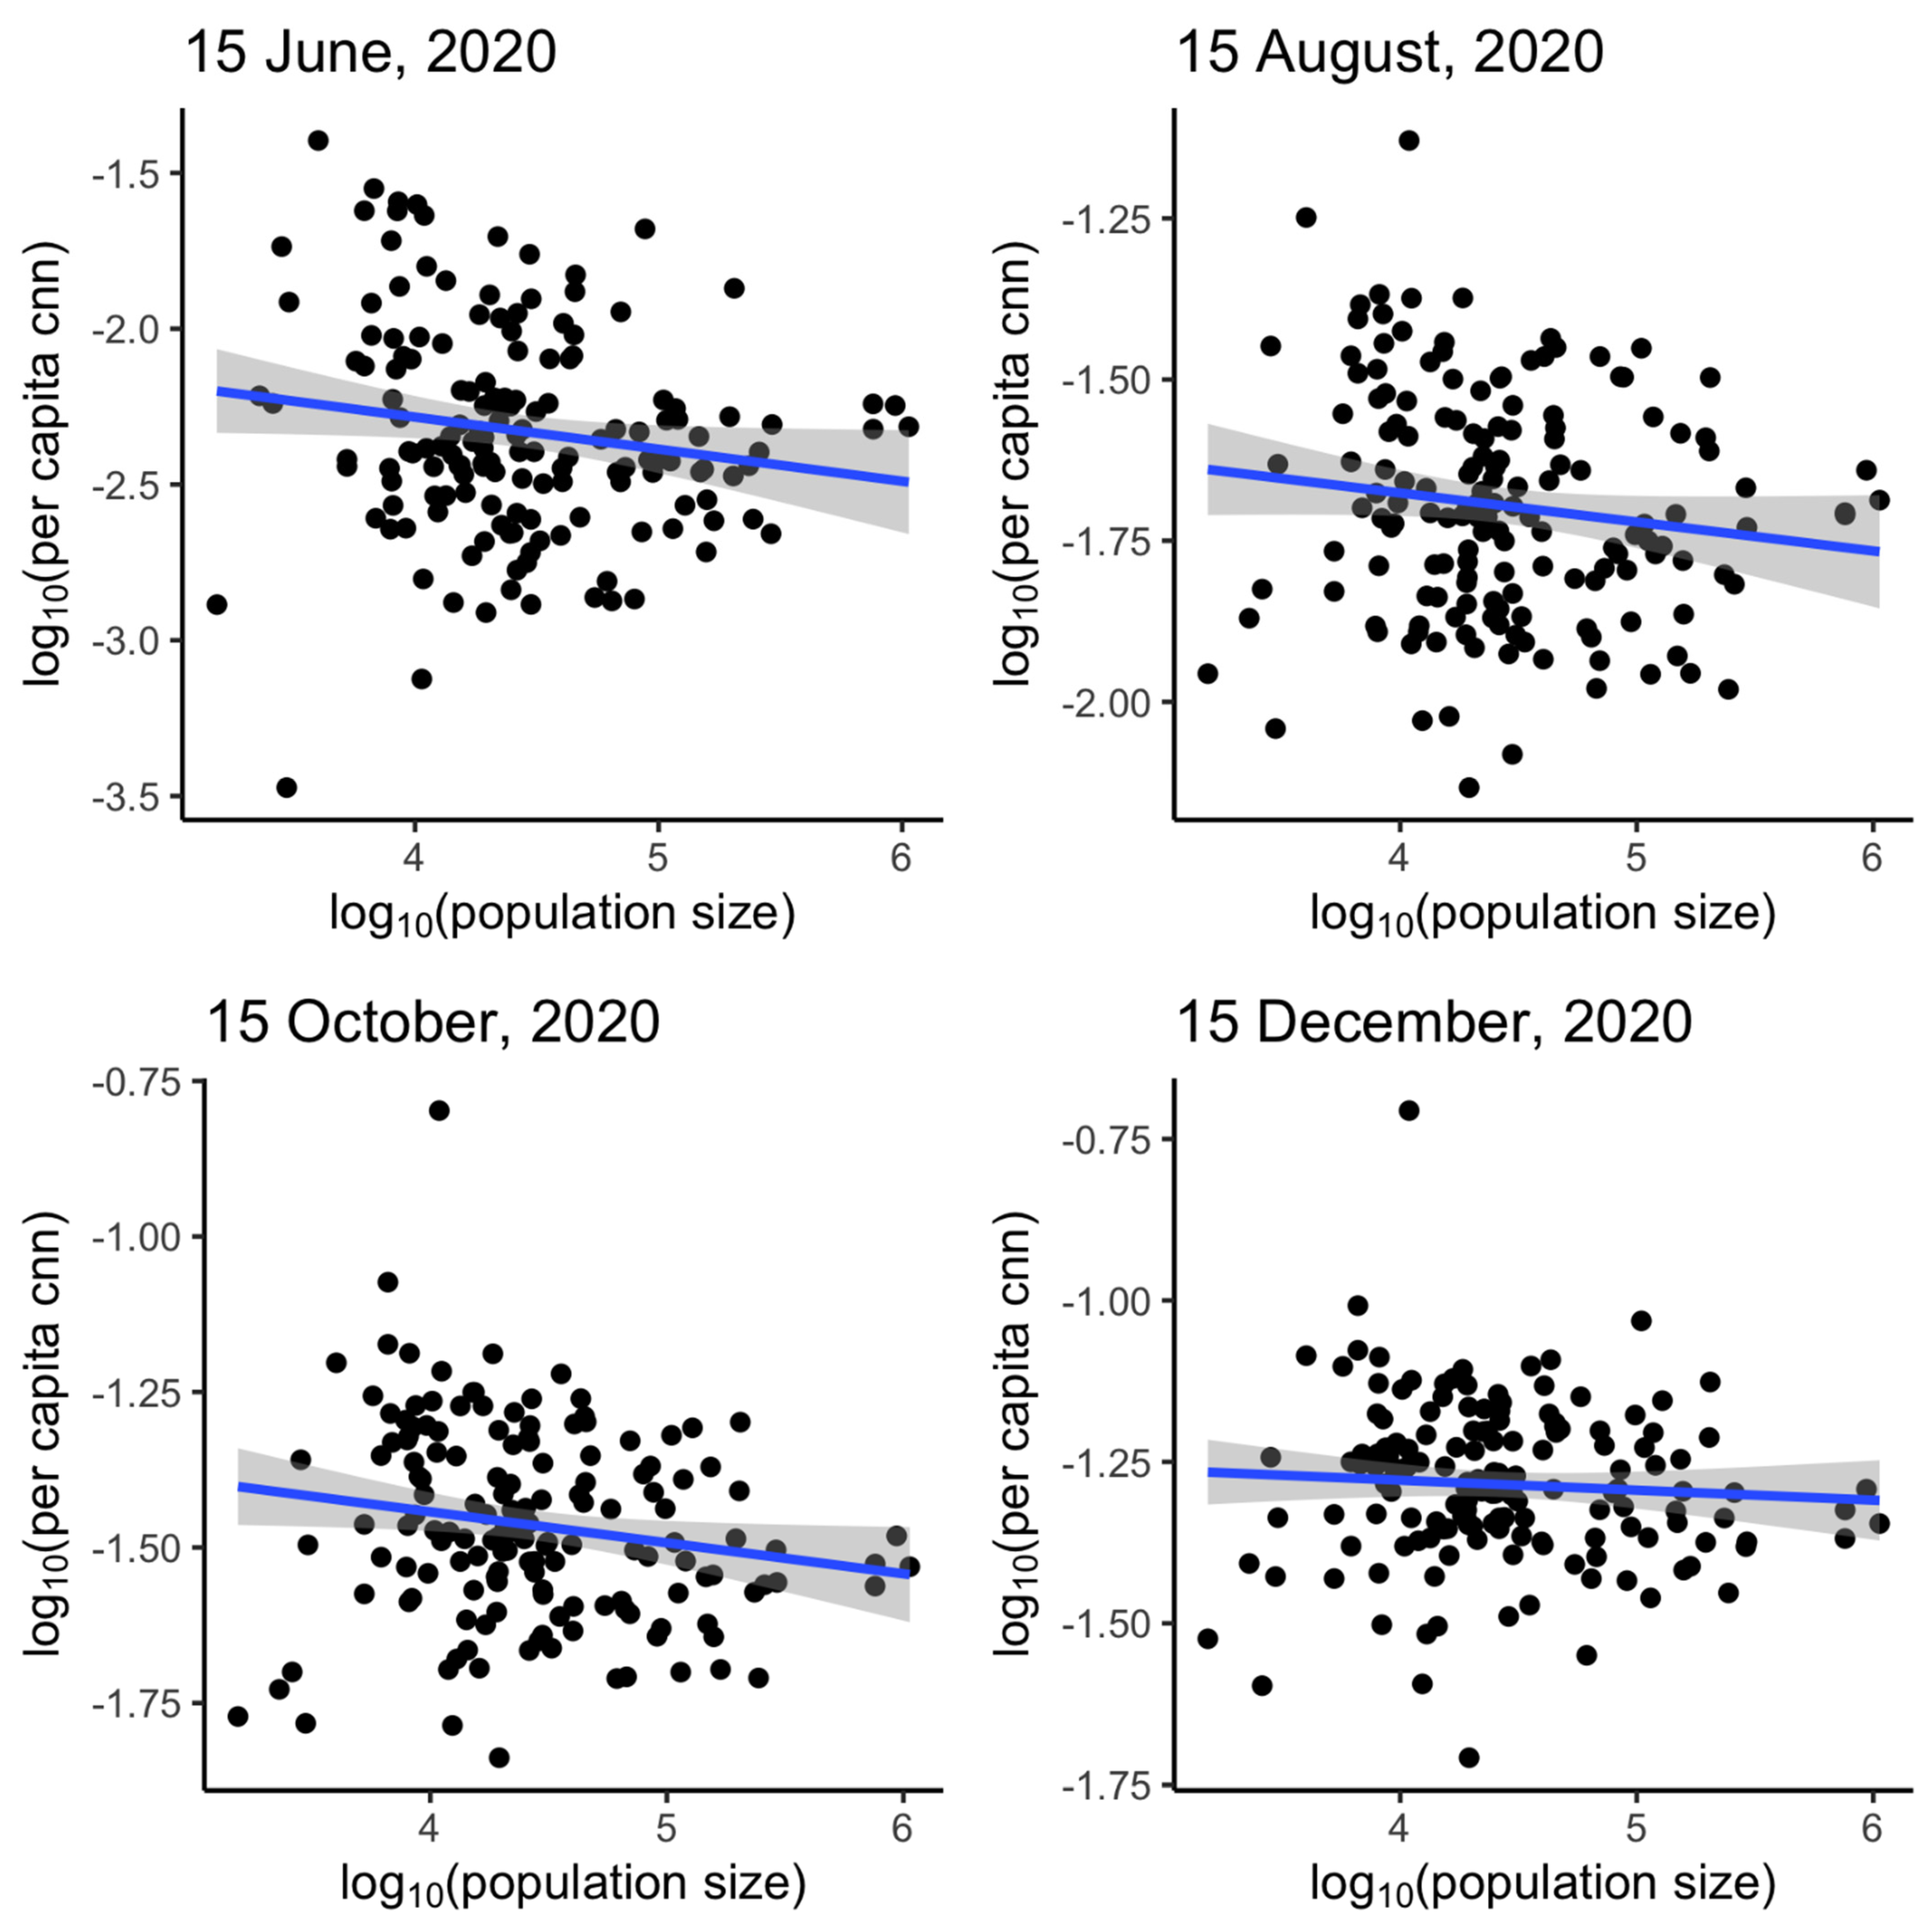
3.3. Power-Law Relationship between Cumulative Case Count and Population Size
4. Discussion
4.1. Significance of Our Findings in the Context of Recent Literature
4.2. Limitations
5. Conclusions
Supplementary Materials
Author Contributions
Funding
Institutional Review Board Statement
Informed Consent Statement
Data Availability Statement
Conflicts of Interest
Appendix A. Handling of Negative Incident Case Count Data
Appendix B. The Instantaneous Reproduction Number Rt (‘EpiEstim’ Package)
References
- Johns Hopkins University & Medicine Coronavirus Resource Center. Available online: https://0-coronavirus-jhu-edu.brum.beds.ac.uk/ (accessed on 12 November 2020).
- Stokes, E.K.; Zambrano, L.D.; Anderson, K.N.; Marder, E.P.; Raz, K.M.; El Burai Felix, S.; Tie, Y.; Fullerton, K.E. Coronavirus Disease 2019 Case Surveillance—United States, January 22–May 30, 2020. MMWR Morb. Mortal. Wkly Rep. 2020, 69, 759–765. [Google Scholar] [CrossRef]
- Shiau, S.; Krause, K.D.; Valera, P.; Swaminathan, S.; Halkitis, P.N. The Burden of COVID-19 in People Living with HIV: A Syndemic Perspective. AIDS Behav. 2020, 24, 2244–2249. [Google Scholar] [CrossRef]
- Talevi, D.; Socci, V.; Carai, M.; Carnaghi, G.; Faleri, S.; Trebbi, E.; di Bernardo, A.; Capelli, F.; Pacitti, F. Mental health outcomes of the CoViD-19 pandemic. Riv. Psichiatr. 2020, 55, 137–144. [Google Scholar] [CrossRef]
- Zhang, S.X.; Wang, Y.; Rauch, A.; Wei, F. Unprecedented disruption of lives and work: Health, distress and life satisfaction of working adults in China one month into the COVID-19 outbreak. Psychiatry Res. 2020, 288, 112958. [Google Scholar] [CrossRef]
- Palmer, K.; Monaco, A.; Kivipelto, M.; Onder, G.; Maggi, S.; Michel, J.P.; Prieto, R.; Sykara, G.; Donde, S. The potential long-term impact of the COVID-19 outbreak on patients with non-communicable diseases in Europe: Consequences for healthy ageing. Aging Clin. Exp. Res. 2020, 32, 1189–1194. [Google Scholar] [CrossRef] [PubMed]
- Zu, Z.Y.; Jiang, M.D.; Xu, P.P.; Chen, W.; Ni, Q.Q.; Lu, G.M.; Zhang, L.J. Coronavirus disease 2019 (COVID-19): A perspective from China. Radiology 2020, 296, E15–E25. [Google Scholar] [CrossRef] [PubMed] [Green Version]
- Centers for Disease Control and Prevention. Underlying Medical Conditions Associated with High Risk for Severe COVID-19: Information for Healthcare Providers. Available online: https://www.cdc.gov/coronavirus/2019-ncov/hcp/clinical-care/underlyingconditions.html (accessed on 10 April 2021).
- Guo, Y.-R.; Cao, Q.-D.; Hong, Z.-S.; Tan, Y.-Y.; Chen, S.-D.; Jin, H.-J.; Tan, K.-S.; Wang, D.-Y.; Yan, Y. The origin, transmission and clinical therapies on coronavirus disease 2019 (COVID-19) outbreak–an update on the status. Mil. Med. Res. 2020, 7, 1–10. [Google Scholar] [CrossRef] [PubMed] [Green Version]
- Guan, W.-J.; Ni, Z.-Y.; Hu, Y.; Liang, W.-H.; Ou, C.-Q.; He, J.-X.; Liu, L.; Shan, H.; Lei, C.-L.; Hui, D.S. Clinical characteristics of coronavirus disease 2019 in China. N. Engl. J. Med. 2020, 382, 1708–1720. [Google Scholar] [CrossRef] [PubMed]
- Bai, Y.; Yao, L.; Wei, T.; Tian, F.; Jin, D.-Y.; Chen, L.; Wang, M. Presumed asymptomatic carrier transmission of COVID-19. JAMA 2020, 323, 1406–1407. [Google Scholar] [CrossRef] [Green Version]
- Wang, D.; Hu, B.; Hu, C.; Zhu, F.; Liu, X.; Zhang, J.; Wang, B.; Xiang, H.; Cheng, Z.; Xiong, Y. Clinical characteristics of 138 hospitalized patients with 2019 novel coronavirus–infected pneumonia in Wuhan, China. JAMA 2020, 323, 1061–1069. [Google Scholar] [CrossRef]
- United States Census Bureau. Georgia. Available online: https://data.census.gov/cedsci/profile?g=0400000US13 (accessed on 7 April 2021).
- World Population Review. Georgia Population 2021. Available online: https://worldpopulationreview.com/states/georgia-population (accessed on 7 April 2021).
- Nicola, M.; Alsafi, Z.; Sohrabi, C.; Kerwan, A.; Al-Jabir, A.; Iosifidis, C.; Agha, M.; Agha, R. The socio-economic implications of the coronavirus pandemic (COVID-19): A review. Int. J. Surg. 2020, 78, 185–193. [Google Scholar] [CrossRef]
- Walmsley, T.L.; Rose, A.; Wei, D. Impacts on the U.S. macroeconomy of mandatory business closures in response to the COVID-19 Pandemic. Appl. Econ. Lett. 2020, 1–8. [Google Scholar] [CrossRef]
- Sharif, A.; Aloui, C.; Yarovaya, L. COVID-19 pandemic, oil prices, stock market, geopolitical risk and policy uncertainty nexus in the US economy: Fresh evidence from the wavelet-based approach. Int. Rev. Financ. Anal. 2020, 70, 101496. [Google Scholar] [CrossRef]
- Georgia Department of Public Health. Public Health Districts. Available online: https://dph.georgia.gov/about-dph/contact-dph/public-health-districts (accessed on 13 August 2020).
- Georgia Department of Public Health. Georgia Department of Public Health Daily Status Report. Available online: https://dph.georgia.gov/covid-19-daily-status-report (accessed on 19 November 2020).
- Governor Brian, P. Kemp Office of the Governor. 2020 Executive Orders. Available online: https://gov.georgia.gov/executive-action/executive-orders/2020-executive-orders (accessed on 13 August 2020).
- Shepherd, K. Teachers Returned to a Georgia School District Last Week. 260 Employees Have Already Gone Home to Quarantine. Available online: https://www.washingtonpost.com/nation/2020/08/04/school-outbreaks-reopening-georgia/ (accessed on 25 March 2021).
- Fulton County Service Updates. Available online: https://fultoncountyga.gov/ (accessed on 25 June 2020).
- WSBTV.com News Staff. County-by-County: Plans for Returning to School This Fall. Available online: https://www.wsbtv.com/news/local/county-by-county-plans-returning-school-this-fall/QJAYLUB4TFBPBCJCIMVZXUQGFY/ (accessed on 25 March 2021).
- City of Calhoun GA. The State of Georgia Executive Order. Available online: https://drive.google.com/file/d/1tyde7wEj2mFU4yVBIPl-yIBGTFmscbRV/view (accessed on 24 June 2020).
- Joint Executive Order of the Mayor of the City of Albany and the Chairman of the Dougherty County Commission Related to COVID-19. Available online: http://dougherty.ga.us/filestorage/1800/379008/379647/RevisedOrder_032520.pdf (accessed on 24 June 2020).
- Early County News. Gov. Kemp Signs New COVID-19 Executive Order. Available online: https://www.earlycountynews.com/articles/gov-kemp-signs-new-covid-19-executive-order/ (accessed on 24 June 2020).
- Joint Declaration of a State of Emergency and Emergency Executive Order of the Chairman of the Grady County Board of Commissioners, Mayor of the City of Cairo, and Mayor of the City of Whigham. Available online: https://www.cairogachamber.com/ (accessed on 24 June 2020).
- First Amendment to the Executive Order of the Board of Commissioner of Lee County, Georgia Related to Emergency Responses to Corona Virus Pandemic. Available online: http://www.lee.ga.us/publicnotice/files/COVID_Executive_Order_Amendment_032420.pdf (accessed on 24 June 2020).
- Mitchell EMC. An Important update on COVID-19. Available online: https://mitchellemc.com/ (accessed on 24 June 2020).
- Board of Commissioners of Seminole County. Georgia City Council of Iron City, Georgia Emergency Declaration Order. Available online: http://seminolecountyga.com/SeminoleCountyEmergencyDeclarationOrderMarch252020.pdf (accessed on 24 June 2020).
- The State of Georgia Executive Order. Available online: http://www.terrellcountygeorgia.com/EXECUTIVE_ORDER_CORONA_VIRUS.pdf (accessed on 24 June 2020).
- Worth County GA. Covid-19 Response Information. Available online: https://worthga.com/ (accessed on 24 June 2020).
- New York Times/Covid-19 Data. Available online: https://github.com/nytimes/covid-19-data (accessed on 11 January 2021).
- 11 Alive Staff. Coronavirus in Georgia, Latest Numbers for 2 October 2020. Available online: https://www.11alive.com/article/news/health/coronavirus/coronavirus-numbers/coronavirus-numbers-georgia-oct-5-2020/85-2fc7f6a0-fe3f-4037-b922-2ab653dc04fd (accessed on 21 February 2020).
- The United States Census Bureau. County Population Totals 2010–2019. Available online: https://www.census.gov/data/tables/time-series/demo/popest/2010s-counties-total.html (accessed on 11 January 2021).
- Cori, A.; Ferguson, N.M.; Fraser, C.; Cauchemez, S. A new framework and software to estimate time-varying reproduction numbers during epidemics. Am. J. Epidemiol. 2013, 178, 1505–1512. [Google Scholar] [CrossRef] [PubMed] [Green Version]
- Gostic, K.M.; McGough, L.; Baskerville, E.B.; Abbott, S.; Joshi, K.; Tedijanto, C.; Kahn, R.; Niehus, R.; Hay, J.A.; De Salazar, P.M.; et al. Practical considerations for measuring the effective reproductive number, Rt. PLoS Comput. Biol. 2020, 16, e1008409. [Google Scholar] [CrossRef] [PubMed]
- You, C.; Deng, Y.; Hu, W.; Sun, J.; Lin, Q.; Zhou, F.; Pang, C.H.; Zhang, Y.; Chen, Z.; Zhou, X.H. Estimation of the time-varying reproduction number of COVID-19 outbreak in China. Int. J. Hyg. Environ. Health 2020, 228, 113555. [Google Scholar] [CrossRef] [PubMed]
- Chowell, G.; Bettencourt, L.M.; Johnson, N.; Alonso, W.J.; Viboud, C. The 1918-1919 influenza pandemic in England and Wales: Spatial patterns in transmissibility and mortality impact. Proc. Biol. Sci. 2008, 275, 501–509. [Google Scholar] [CrossRef] [PubMed] [Green Version]
- Centers for Disease Control and Prevention. CDC COVID Data Tracker: Maps, Charts, and Data Provided by the CDC. Available online: https://covid.cdc.gov/covid-data-tracker/#cases_casesinlast7days (accessed on 10 March 2021).
- Lau, M.S.Y.; Grenfell, B.; Thomas, M.; Bryan, M.; Nelson, K.; Lopman, B. Characterizing superspreading events and age-specific infectiousness of SARS-CoV-2 transmission in Georgia, USA. Proc. Natl. Acad. Sci. USA 2020, 117, 22430–22435. [Google Scholar] [CrossRef]
- Liu, Y.; Gayle, A.A.; Wilder-Smith, A.; Rocklov, J. The reproductive number of COVID-19 is higher compared to SARS coronavirus. J. Travel. Med. 2020, 27. [Google Scholar] [CrossRef] [PubMed] [Green Version]
- Choi, S.; Ki, M. Estimating the reproductive number and the outbreak size of COVID-19 in Korea. Epidemiol. Health 2020, 42, e2020011. [Google Scholar] [CrossRef]
- Kucharski, A.J.; Russell, T.W.; Diamond, C.; Liu, Y.; Edmunds, J.; Funk, S.; Eggo, R.M.; Centre for Mathematical Modelling of Infectious Diseases COVID-19 Working Group. Early dynamics of transmission and control of COVID-19: A mathematical modelling study. Lancet Infect. Dis. 2020, 20, 553–558. [Google Scholar] [CrossRef] [Green Version]
- Fung, I.C.-H.; Zhou, X.; Cheung, C.-N.; Ofori, S.K.; Muniz-Rodriguez, K.; Cheung, C.-H.; Lai, P.-Y.; Liu, M.; Chowell, G. Assessing Early Heterogeneity in Doubling Times of the COVID-19 Epidemic across Prefectures in Mainland China, January–February, 2020. Epidemiologia 2021, 2, 95–113. [Google Scholar] [CrossRef]
- Politis, M.D.; Hua, X.; Ogwara, C.A.; Davies, M.R.; Adebile, T.; Sherman, M.P.; Zhou, X.; Chowell, G.; Spaulding, A.C.; Fung, I.C.H. Spatially refined time-varying reproduction numbers of SARS-CoV-2 in Arkansas and Kentucky, March–November 2020. 2021; Unpublished Work. [Google Scholar]
- Auger, K.A.; Shah, S.S.; Richardson, T.; Hartley, D.; Hall, M.; Warniment, A.; Timmons, K.; Bosse, D.; Ferris, S.A.; Brady, P.W. Association between statewide school closure and COVID-19 incidence and mortality in the US. JAMA 2020, 324, 859–870. [Google Scholar] [CrossRef] [PubMed]
- Courtemanche, C.; Garuccio, J.; Le, A.; Pinkston, J.; Yelowitz, A. Strong Social Distancing Measures In The United States Reduced The COVID-19 Growth Rate: Study evaluates the impact of social distancing measures on the growth rate of confirmed COVID-19 cases across the United States. Health Aff. 2020, 39, 1237–1246. [Google Scholar] [CrossRef] [PubMed]
- Singh, S.; Shaikh, M.; Hauck, K.; Miraldo, M. Impacts of introducing and lifting nonpharmaceutical interventions on COVID-19 daily growth rate and compliance in the United States. Proc. Natl. Acad. Sci. USA 2021, 118, e2021359118. [Google Scholar] [CrossRef] [PubMed]
- Leidner, A.J.; Barry, V.; Bowen, V.B.; Silver, R.; Musial, T.; Kang, G.J.; Ritchey, M.D.; Fletcher, K.; Barrios, L.; Pevzner, E. Opening of large institutions of higher education and county-level COVID-19 incidence—United States, 6 July–17 September 2020. Morb. Mortal. Wkly. Rep. 2021, 70, 14. [Google Scholar] [CrossRef]
- McFee, D.R.B. COVID-19 Laboratory Testing/CDC Guidelines. Dis. Mon. 2020. [Google Scholar] [CrossRef]
- Centers for Disease Control and Prevention. COVID-19 Pandemic Planning Scenarios. Available online: https://www.cdc.gov/coronavirus/2019-ncov/hcp/planning-scenarios.html (accessed on 12 November 2020).


| Date | Implemented Measure(s) | |
|---|---|---|
| Georgia [20] | ||
| 14 March 2020 | Declaration of public health State of Emergency. | |
| 16 March 2020 | School closures to mitigate the spread of COVID-19. | |
| 20 March 2020 | Reducing regulations to assist the state’s response to the spread of COVID-19. | |
| 23 March 2020 | Executive order requiring individuals with increased risk of complications from COVID-19 to isolate, quarantine, or shelter in place; no gatherings involving ten or more individuals should take place; if there are gatherings, people are required to stand or sit 6 feet apart. The order will expire on 6 April 2020. Expanding temporary licensing of certain medical professions to assist the states’ response to the spread of COVID-19. | |
| 24 March 2020 | Reduced regulations to assist the states’ response to the spread of COVID-19. | |
| 2 April 2020 | Statewide shelter-in-place executive order. Executive order to limit physical interactions, including shelter-in-place if diagnosed with underlying conditions, closure of bars, and no gatherings involving ten or more individuals should take place. | |
| 8 April 2020 | Renewal of public health state of emergency. Renewed for 30 days (until 13 May 2020). | |
| 15 April 2020 | Statewide testing for all symptomatic individuals (referral is still needed). | |
| 20 April 2020 | Provision of flexibility for healthcare practices, moving certain businesses to minimum operations, and providing for emergency response. | |
| 23 April 2020 | Reviving a healthy Georgia. Wearing of face masks, sanitation practices following the guidelines published by the Centers for Disease Control and Prevention, and no gatherings of persons except cohabiting persons. | |
| 27 April 2020 | Businesses in the state will start opening following social distancing and prevention measures. | |
| 30 April 2020 | The public health state of emergency was issued on 14 March and renewed on 8 April to assist with the state’s COVID-19 response. Shelter in place was mandated for vulnerable individuals. | |
| 12 May 2020 | Residents and visitors must practice social distancing and refrain from gathering. Wearing of face coverings. Renewal of public health state of emergency until 30 October 2020. | |
| 5 August 2020 | Schools began reopening for both in-person and virtual instruction [21]. | |
| Health district 3-2 | ||
| Fulton County [22] | 15 June 2020 17 August 2020 | Fulton County reopening measures and service changes. Schools reopen for virtual instruction only [23]. |
| Health district 8-2 | ||
| Baker County [20] | 23 March 2020 | Executive order requiring individuals with increased risk of complications from COVID-19 to isolate, quarantine, or shelter in place. No gatherings involving 10 or more individuals should take place, if gatherings require standing or sitting 6 feet apart; order expiring 6 April 2020. Expanding temporary licensing of certain medical professions to assist the states’ response to the spread of COVID-19. |
| 5 August 2020 | Schools began reopening for both in-person and virtual instruction [21]. | |
| Calhoun County [24] | 11 June 2020 | Gatherings of 25 or more persons were banned unless social distancing measures are in place (increased from 10). Bars reopen with strict guidelines. Overnight camps allowed with restrictions. Restrictions for businesses that have been allowed to reopen. |
| 12 August 2020 | Schools reopened the in-person mode of instruction with virtual options [23]. | |
| Colquitt County [20] | 23 March 2020 | Executive order requiring individuals with increased risk of complications from COVID-19 to isolate, quarantine, or shelter in place. No gatherings involving 10 or more individuals should take place, if gatherings require standing or sitting 6 feet apart; order expiring 6 April 2020. Expanding temporary licensing of certain medical professions to assist the states’ response to the spread of COVID-19. |
| 5 August 2020 | Schools began reopening for both in-person and virtual instruction [21]. | |
| Decatur County [20] | 23 March 2020 | Executive order requiring individuals with increased risk of complications from COVID-19 to isolate, quarantine, or shelter in place. No gatherings involving 10 or more individuals should take place, if gatherings require standing or sitting 6feet apart; order expiring 6 April 2020. Expanding temporary licensing of certain medical professions to assist the states’ response to the spread of COVID-19. |
| 17 August 2020 | Schools reopen for virtual instruction only [23]. | |
| Dougherty County [25] | 25 March 2020 | Statewide Shelter-In Place Order. Public or private gatherings. Indoor or outdoor gatherings of 10 persons or less may be permitted while maintaining 6 feet distance. Food serving establishments cease offering dine-in services, may continue offering food to customers via delivery, drive-through, or take-out. Public buildings, parks, and facilities restrictions. |
| 5 August 2020 | Schools began reopening for both in-person and virtual instruction [21]. | |
| Early County [26] | 16 June 2020 | Shelter in place order no longer required for residents and visitors of Georgia who are 65 or older unless they meet certain criteria. Gatherings of more than 50 people were banned unless 6 feet distance is maintained. No longer party maximum for the number of people who can sit together at a restaurant. |
| 5 August 2020 | Schools began reopening for both in-person and virtual instruction [21]. | |
| Grady County [27] | 28 March 2020 | Executive order requiring individuals with increased risk of complications from COVID-19 to isolate, quarantine, or shelter in place. No gatherings involving 10 or more individuals should take place, if gatherings require standing or sitting 6 feet apart; order expiring 6 April 2020. Countywide curfew between 10:00 p.m. until 5:00 a.m. |
| 5 August 2020 | Schools began reopening for both in-person and virtual instruction [21]. | |
| Lee County [28] | 24 March 2020 | Voluntary stay safe at home. Prohibition of gatherings involving more than 10 persons at one time. Recreation and entertainment facilities closed except for facilities where less than 10 persons, including employees, are present at one time. Mandatory curfew between 10:00 p.m. and 6:00 a.m. |
| 5 August 2020 | Schools began reopening for both in-person and virtual instruction [21]. | |
| Miller County [20] | 23 March 2020 | Executive order requiring individuals with increased risk of complications from COVID-19 to isolate, quarantine, or shelter in place. No gatherings involving 10 or more individuals should take place, if gatherings require standing or sitting 6 feet apart; order expiring 6 April 2020. Expanding temporary licensing of certain medical professions to assist the states’ response to the spread of COVID-19. |
| 5 August 2020 | Schools began reopening for both in-person and virtual instruction [21]. | |
| Mitchell County [29] | 23 March 2020 | Prohibition of private or public gatherings of more than 10 individuals. Social distancing measures must be in place for gathering with over 10 individuals. Closure of indoor recreational facilities and business requiring sustained physical contact. Countywide shelter in place for persons with underlying conditions likely to increase the spread of COVID-19. |
| 5 August 2020 | Schools began reopening for both in-person and virtual instruction [21]. | |
| Seminole County [30] | 25 March 2020 | Declaration of state of emergency. Activation of county emergency operations plan and adoption of emergency management ordinances. No gatherings involving 10 or more individuals should take place if gatherings require standing or sitting 6 feet apart. |
| 5 August 2020 | Schools began reopening for both in-person and virtual instruction [21]. | |
| Terell County [31] | 2 April 2020 | Closures of nonessential businesses providing body care not supervised under a licensed medical professional. Closure of indoor and outdoor recreation, fitness, and entertainment facilities. Prohibition of gatherings involving more than 10 persons at one time. Social distancing and sanitation practices. |
| 5 August 2020 | Schools began reopening for both in-person and virtual instruction [21]. | |
| Thomas County [20] | 23 March 2020 | Executive order requiring individuals with increased risk of complications from COVID-19 to isolate, quarantine, or shelter in place. No gatherings involving 10 or more individuals should take place if gatherings require standing or sitting 6 feet apart. |
| 5 August 2020 | Schools began reopening for both in-person and virtual instruction [21]. | |
| Worth County [32] | 24 March 2020 | Executive order requiring individuals with increased risk of complications from COVID-19 to isolate, quarantine, or shelter in place. No gatherings involving 10 or more individuals should take place if gatherings require standing or sitting 6 feet apart; order expiring 6 April 2020. |
| 5 August 2020 | Schools began reopening for both in-person and virtual instruction [21]. |
| 15 December 2020 (7-Day Sliding Window) | |||
|---|---|---|---|
| Location | First Reported Case (dd-mm-yy) | Median Rt (2.5%, 97.5% Quantiles) | Mean Rt (Standard Deviation) |
| Georgia | 2-Mar-20 | 1.13 (1.13, 1.14) | 1.13 (0.00) |
| District 1-1 (Northwest Georgia Health District) | 6-Mar-20 | 1.15 (1.11, 1.19) | 1.15 (0.02) |
| District 1-2 (North Georgia Health District) | 8-Mar-20 | 1.13 (1.09, 1.18) | 1.13 (0.02) |
| District 2 (North Health District) | 16-Mar-20 | 1.17 (1.13, 1.21) | 1.17 (0.02) |
| District 3-1 (Douglas Health District) | 7-Mar-20 | 1.12 (1.11, 1.16) | 1.12 (0.02) |
| District 3-2 (Fulton Board of Health) | 2-Mar-20 | 1.07 (1.06, 1.11) | 1.07 (0.02) |
| District 3-3 (Clayton County Health District) | 15-Mar-20 | 1.11 (1.09, 1.19) | 1.12 (0.04) |
| District 3-4 (East Metro Health District) | 7-Mar-20 | 1.13 (1.12, 1.16) | 1.13 (0.02) |
| District 3-5 (Dekalb Health District) | 9-Mar-20 | 1.08 (1.06, 1.12) | 1.08 (0.02) |
| District 4 (District 4 Health District) | 9-Mar-20 | 1.11 (1.07, 1.14) | 1.11 (0.02) |
| District 5-1 (South Central Health District) | 19-Mar-20 | 1.25 (1.14, 1.37) | 1.25 (0.06) |
| District 5-2 (North Central Health District) | 18-Mar-20 | 1.17 (1.12, 1.23) | 1.17 (0.03) |
| District 6 (East Central Health District) | 17-Mar-20 | 1.12 (1.07, 1.16) | 1.12 (0.02) |
| District 7 (West Central Health District) | 20-Mar-20 | 1.14 (1.08, 1.21) | 1.14 (0.04) |
| District 8-1 (South Health District) | 11-Mar-20 | 1.14 (1.12, 1.21) | 1.14 (0.03) |
| District 8-2 (Southwest Health District) | 11-Mar-20 | 1.12 (1.10, 1.19) | 1.12 (0.03) |
| District 9-1 (Coastal Health District) | 19-Mar-20 | 1.10 (1.08, 1.17) | 1.10 (0.03) |
| District 9-2 (Southeast Health District) | 10-Mar-20 | 1.14 (1.12, 1.21) | 1.14 (0.03) |
| District 10 (Northeast Health District) | 15-Mar-20 | 1.17 (1.12, 1.21) | 1.17 (0.02) |
| 15 June | 15 August | 15 October | 15 December | |
|---|---|---|---|---|
| Georgia | −0.1029 (−0.2022, −0.0036) | −0.0450 (−0.0973, 0.0073) | −0.0498 (−0.0953, −0.0043) | −0.0154 (−0.0525, 0.0216) |
Publisher’s Note: MDPI stays neutral with regard to jurisdictional claims in published maps and institutional affiliations. |
© 2021 by the authors. Licensee MDPI, Basel, Switzerland. This article is an open access article distributed under the terms and conditions of the Creative Commons Attribution (CC BY) license (https://creativecommons.org/licenses/by/4.0/).
Share and Cite
Ogwara, C.A.; Mallhi, A.K.; Hua, X.; Muniz-Rodriguez, K.; Schwind, J.S.; Zhou, X.; Jones, J.A.; Chopak-Foss, J.; Chowell, G.; Fung, I.C.-H. Spatially Refined Time-Varying Reproduction Numbers of COVID-19 by Health District in Georgia, USA, March–December 2020. Epidemiologia 2021, 2, 179-197. https://0-doi-org.brum.beds.ac.uk/10.3390/epidemiologia2020014
Ogwara CA, Mallhi AK, Hua X, Muniz-Rodriguez K, Schwind JS, Zhou X, Jones JA, Chopak-Foss J, Chowell G, Fung IC-H. Spatially Refined Time-Varying Reproduction Numbers of COVID-19 by Health District in Georgia, USA, March–December 2020. Epidemiologia. 2021; 2(2):179-197. https://0-doi-org.brum.beds.ac.uk/10.3390/epidemiologia2020014
Chicago/Turabian StyleOgwara, Chigozie A., Arshpreet Kaur Mallhi, Xinyi Hua, Kamalich Muniz-Rodriguez, Jessica S. Schwind, Xiaolu Zhou, Jeffery A. Jones, Joanne Chopak-Foss, Gerardo Chowell, and Isaac Chun-Hai Fung. 2021. "Spatially Refined Time-Varying Reproduction Numbers of COVID-19 by Health District in Georgia, USA, March–December 2020" Epidemiologia 2, no. 2: 179-197. https://0-doi-org.brum.beds.ac.uk/10.3390/epidemiologia2020014