Predicting the Potential Distribution of Paeonia veitchii (Paeoniaceae) in China by Incorporating Climate Change into a Maxent Model

Jiangsu Key Laboratory of Crop Genetics and Physiology, College of Horticulture and Plant Protection, Yangzhou University, Yangzhou 225009, China
*
Author to whom correspondence should be addressed.
Forests 2019, 10(2), 190; https://0-doi-org.brum.beds.ac.uk/10.3390/f10020190
Submission received: 14 January 2019
/
Revised: 14 February 2019
/
Accepted: 19 February 2019
/
Published: 20 February 2019
(This article belongs to the Special Issue Geographic Information Systems and Their Applications in Forests)
Abstract
:A detailed understanding of species distribution is usually a prerequisite for the rehabilitation and utilization of species in an ecosystem. Paeonia veitchii (Paeoniaceae), which is an endemic species of China, is an ornamental and medicinal plant that features high economic and ecological values. With the decrease of its population in recent decades, it has become a locally endangered species. In present study, we modeled the potential distribution of P. veitchii under current and future conditions, and evaluated the importance of the factors that shape its distribution. The results revealed a highly and moderately suitable habitat for P. veitchii that encompassed ca. 605,114 km2. The central area lies in northwest Sichuan Province. Elevation, temperature seasonality, annual mean precipitation, and precipitation seasonality were identified as the most important factors shaping the distribution of P. veitchii. Under the scenario with a low concentration of greenhouse gas emissions (RCP 2.6), we predicted an overall expansion of the potential distribution by 2050, followed by a slight contraction in 2070. However, with the scenario featuring intense greenhouse gas emissions (RCP 8.5), the range of suitable habitat should increase with the increasing intensity of global warming. The information that was obtained in the present study can provide background information related to the long-term conservation of this species.
1. Introduction
Climate serves as one of the major factors that influence the geographical distribution of plant species as well as vegetation pattern and structure [1,2,3]. The 5th Assessment Report of the Intergovernmental Panel on Climate Change (IPCC) pointed out that the global climate has experienced a growing warming trend since the very beginning of the 20th century. Specifically, the average surface temperatures have increased by 0.85 °C worldwide from the late 1800 s to 2012; meanwhile, greenhouse gas emissions have dramatically increased. Levels of CO2, CH4, and N2O in the atmosphere have reached their highest concentrations in the last 800,000 years [3].
Climate change may lead to an increase in both temperatures and precipitation, which in turn can lead to increased plant growth rates. In addition, changes in the spatiotemporal climatic patterns have a major effect on plant recruitment, plant phenology, soil properties, plant diseases, pest management, and the properties of forest ecosystems [2,4,5]. If the effects of climate change on the future distribution of habitats for individual species can be predicted across the landscape, then this would help land managers to mitigate any potential threats to the habitats of those species [6]. This can guide the development of strategies that are related to resource development and use, and might include the preparation of germplasm and its storage [7,8].
Species distribution modeling (SDM) can definitely help researchers to determine the ecological requirements of various species and predict the potential range of species based on ecology and biogeography; this is especially true when limited data are available [9]. At present, the most frequently used ecological models in the prediction of the distribution of various species are bioclimatic modeling (BIOCLIM) [10], domain environmental envelope (DOMAIN) [11], ecological niche factor analysis (ENFA) [12], Generalized Additive Model (GAM) [13], genetic algorithm for rule-set production (GARP) [14], and maximum entropy (Maxent) [15]. Among those models, Maxent modeling has been widely employed, because it performs well with either incomplete data or presence-only data [15]. Maxent modeling has been widely applied to plant and animal conservation [8,15], endangered species management [16], invasive species control [6,17], and in the regionalization of agriculture [4,6,16].
The Chinese have cultivated Paeonia, a monotypic genus in the Paeoniaceae, since the days of the Han Dynasty [18]. Known as the “king of flowers” and “flowers of richness and honor”, this genus represents the most popular garden plant in temperate regions of China [18,19]. Many wild peony species have been unsustainably harvested. Hong et al. [18] used past investigations and field surveys to review the conditions that affect wild peony species. Two species, P. ostii and P. cathayana, were found with populations of single isolated individuals. Several species, P. decomposita, P. qiui, P. rockii, and P. rotundiloba, have experienced excessive collection pressures. In addition, P. jishanensis and P. ludlowii are vulnerable due to human disturbance or urbanization. Without the rational delimitation of peony species and inadequate ecological and biological information, it will be impossible to work out a scientifically sound conservation strategy and practical conservation measures [18,20].
P. veitchii, an endemic species of China that occurs naturally in Gansu, Ningxia, Qinghai, Shaanxi, and Sichuan, in western China [21]. The root has been used in traditional medicines to treat convulsions [18]. The seeds contain unsaturated fatty acids, especially α-linolenic acid, an edible oil with promising health benefits [18]. In addition, it has served as the germplasm resource of cultivating a new variety of P. lactiflora. Previous studies have mainly focused on the extraction and analysis of chemical components [22], pollen fertility [23], and photosynthetic physiology [24]. However, little is known regarding the distribution of its habitat and the ecological factors that shape its suitable habitat. Whether the changing climate will affect the suitable habitat of P. veitchii is a crucial issue given the ecological and economic significance of the species, and enhancing our powers of prediction would contribute to management planning.
Based on an extensive collection of geo-referenced occurrence records of P. veitchii and high-resolution environmental data for current and future climate scenarios, Maxent modeling was utilized to evaluate the distribution and habitat of P. veitchii in China. The aims of this research were to: (1) determine the key factors influencing its distribution; (2) predicting its potential distribution under current and future (2050s and 2070s) climate scenarios by incorporating the topographic and bioclimatic data; and, (3) projecting and quantifying the suitable habitat shift under 2050s and 2070s climate scenarios. The results will offer a theoretical basis and reference for protecting, introducing, and cultivating wild P. veitchii resources.
2. Materials and Methods
A flowchart was prepared to summarize the full workflow and it serves as the basis of the analyses (Figure 1). In brief, first the data were summarized and environmental variables were selected. Next, Maxent modeling was completed, followed by predicting the current and future conditions. Lastly, the resulting data comprehensively evaluated.
2.1. Distribution Data for P. veitchii
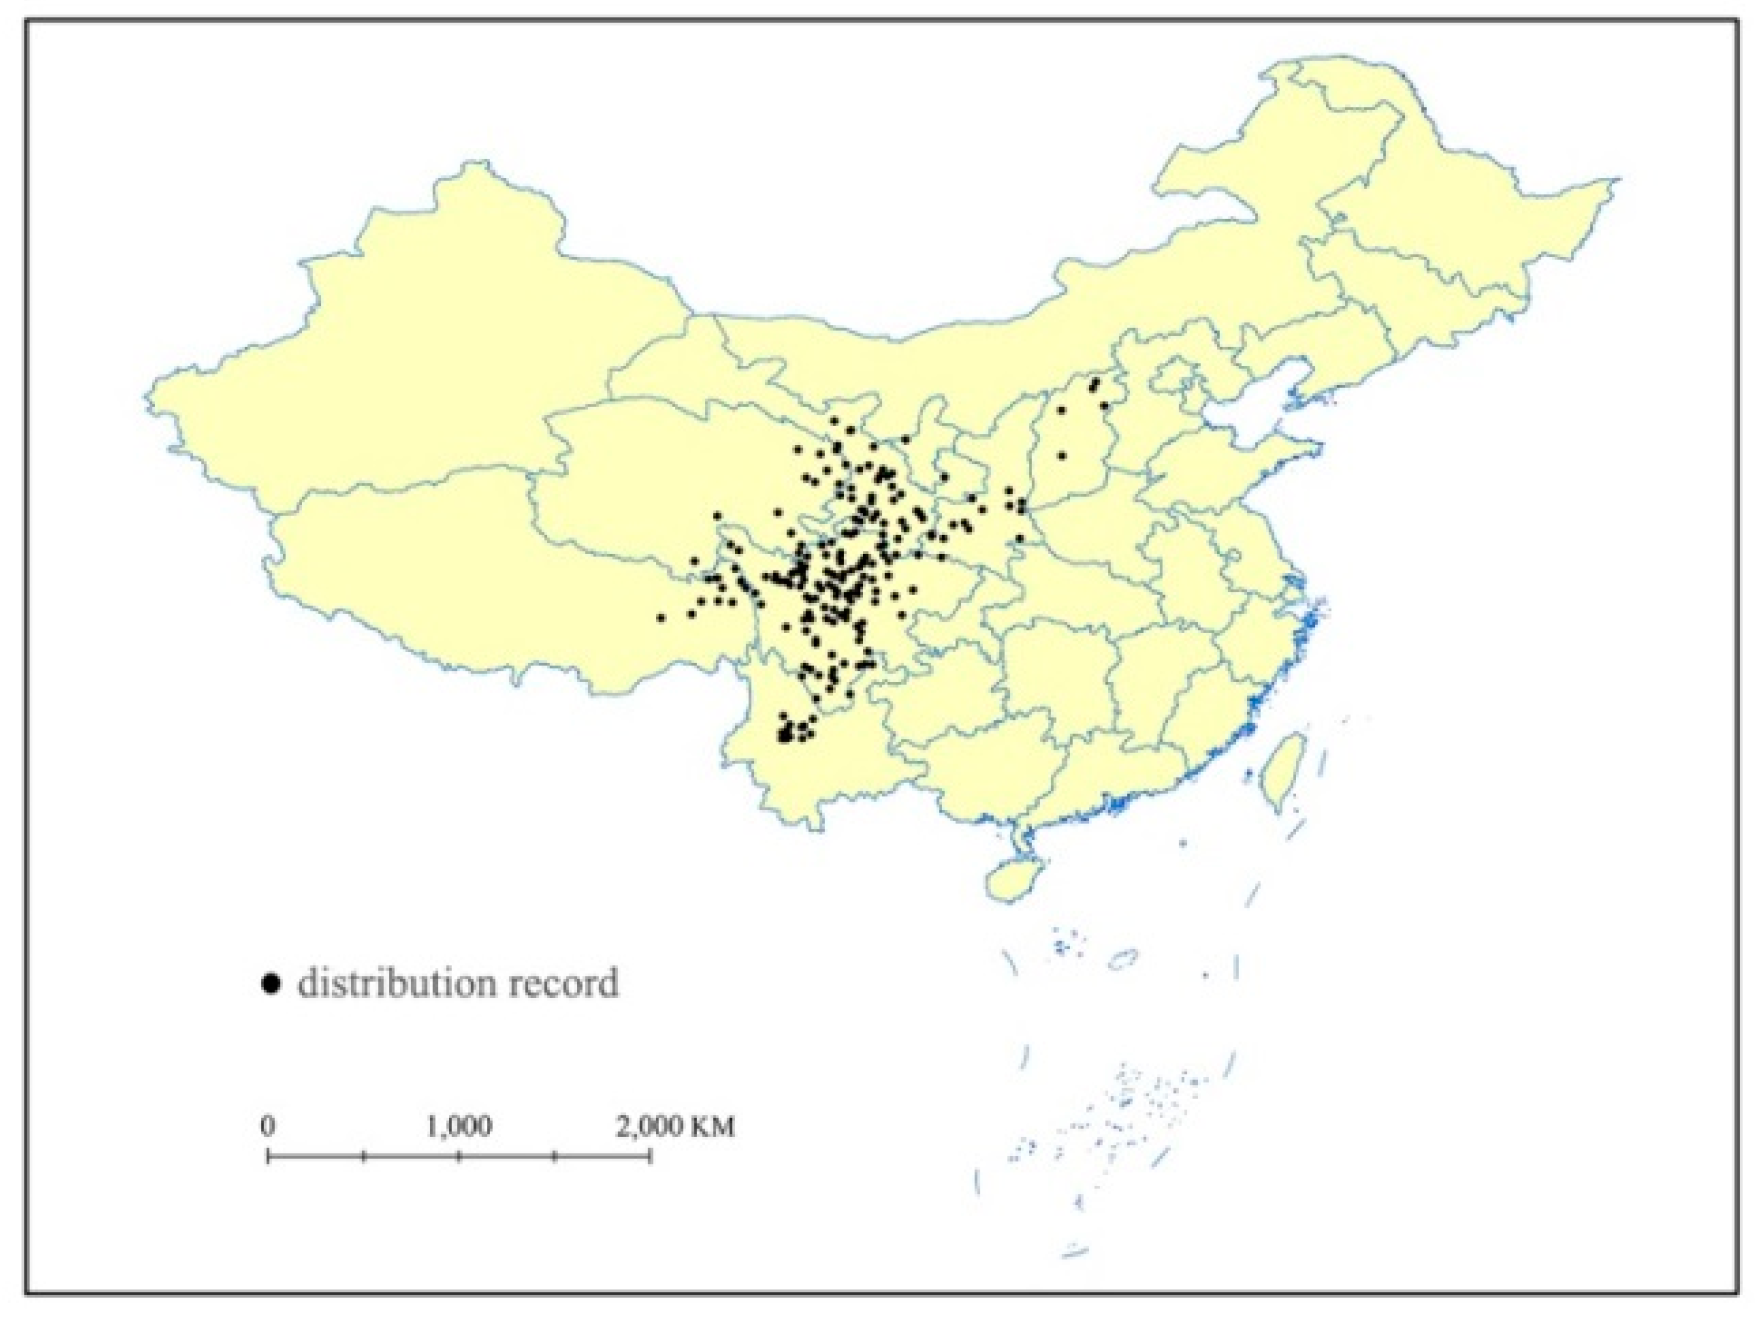
Our previous field survey data, the Global Biodiversity Information Facility (GBIF; http://www.gbif.org/), and the Chinese Virtual Herbarium (CVH; http://www.cvh.org.cn/) have provided species point locality data. Google Earth (http://ditu.google.cn) has been applied to assign longitude and latitude data to any records lacking geo-coordinates. Duplicate points were deleted and the remaining data points were spatially filtered; hence, only one point would occur within each 10 km × 10 km grid cell. A total of 212 known occurrences of P. veitchii were documented while using ArcGIS 10.2 (Esri, Redlands, CA, USA) (Figure 2).
2.2. Environmental Variables
Thirty environmental variables were chosen that might affect the distribution of P. veitchii. Those included 19 bioclimatic variables with 30 s spatial resolution (also referred to as 1 km2 spatial resolution) obtained from the World Climate Database (www.worldclim.org) [25]. In addition, elevation (ELE) data were obtained from the international scientific data service platform of the Chinese Academy of Sciences (http://datemirro.csdb.cn), while growing degree days (GDD), soil pH (SpH), and soil organic carbon (SC) data from the Center for Sustainability and the Global Environment (http://www.sage.wisc.edu/atlas/index.php) [26]. Ground-frost frequency (FRS), wet-day frequency (WET), and vapor pressure (VAP) were obtained from the IPCC database (http://www.sage.wisc.edu/atlas/index.php) and Global ultraviolet-B radiation (UVB 1–4) from the gIUV database (http://www.ufz.de/gliv/) [27]. These environmental variables were transferred into ASCII format by using ArcGIS Conversion Tools and were then used to overlap with a 1: 4,000,000 scale map of China that was obtained from the National Fundamental Geographic Information System website (http://nfgis.nsdi.gov.cn/) and used to extract environmental data.
Representative concentration pathways (RCPs) were defined in the 5th Assessment Report of the IPCC in 2014. They defined four RCPs as the possible trajectories for greenhouse gas emissions [28]. Climate modeling often uses these pathways to describe four possible climates, which are defined as dependent on the volume of the greenhouse gas emissions in the near future worldwide [29]. The four RCPs, including RCP 2.6, RCP 4.5, RCP 6.0, and RCP 8.5, are named after the potential radiative forcing value in 2100 relative to the pre-industrial values (+2.6, +4.5, +6.0, and +8.5 W/m2, respectively) [30]. The present study employed four climate change year/RCP-scenario combinations from BCC-CSM1.1 climate change modeling data, where 2050 and 2070 use average emissions for the years 2041 to 2060 and 2061 to 2080, respectively. RCP 2.6–2050, RCP 2.6–2070, RCP 8.5–2050, and RCP 8.5–2070 are the four combinations. BCC-CSM1.1 serves as one of the most widely used models for the simulation of the response of global climate to increased greenhouse gas emissions [31]. The World Climate Database (http://www.worldclim.org/) was used to download the four future climate datasets [25]. Eleven parameters (four UV-B radiation parameters and ELE, FRS, GDD, SC, SpH, VAP, WET) were kept unchanged to analyze the SDM projection in future climate conditions.
The 30 selected variables that are discussed above were preprocessed to 30″ × 30″ spatial resolution; however, many environmental variables were spatially correlated. The strong correlation between some of these environmental variables may cause over-fitting and the incorrect precision of the model [32]. Therefore, the Spearman’s correlation coefficient was used for the examination of the correlation and removed the highly correlated environmental factors (Spearman’s correlation coefficient >0.75). As a result, only 17 out of the original 30 environmental variables were evaluated (Table 1).
2.3. Model Simulation
Based on the occurrence data of P. veitchii and the environmental parameters that were utilized, the maximum entrophy method was adopted for the analysis of SDM for the current climate conditions [33]. To estimate the capacity of the model, 25% of the data was used for testing, while 75% of the location point data was used for training. Species distribution modeling was performed utilizing the 17 factors that are discussed above along with data about the occurrence of P. veitchii; the algorithm ran 1000 iterations of the processes or continued until convergence was reached (threshold 0.00001). A threshold-independent receiver-operating characteristic (ROC) analysis was carried out to evaluate the performance of Maxent and then calculate the area under receiver-operating characteristic curve (AUC) values. The Jackknife test was used to assess the significance of these variables. There is a range of the value of the final potential species distribution map, which was reclassified into four branches of potential habitat: ‘high’ (>0.6), ‘moderate’ (0.4–0.6), and ‘low’ potential habitat (0.2–0.4), as well as ‘not potential habitat’ (<0.2).
Maxent was used to the four future climate scenarios, as outlined above, so that the future habitat area suitable for the species could be predicted after modeling the current habitat suitable for P. veitchii, based on the existing climate data. Maxent software was used to calculate the SDM projections. The regions that were predicted to become unsuitable, suitable, or predicted to experience very limited changes in terms of suitability were identified by cross-checking the suitable habitat areas in the future against the current distribution area of P. veitchii. Moreover, the areas of each type of habitat were identified and illustrated.
2.4. Shift of the Distribution Center of Suitable Habitat
The centroids of both the current and future suitable areas were calculated and then compared using the SDM toolbox, a GIS toolkit that is based on Python software [34]. The SDM toolbox (e.g., current and future SDMs) was applied to calculate the distributional changes of these two binary SDMs [34], and the primary shifts in the distribution of P. veitchii were analyzed. In the analysis, the distribution of the species was reduced to a single centroid point. The direction and magnitude of the predicted change through time were created. To examine the distributional shifts, the movements of the centroid of various SDMs were tracked.
3. Results
3.1. Prediction of Suitable Habitat Areas for P. veitchii and Model Accuracy
By applying the maximum entropy principle of Maxent, the maximum possible AUC training value was 0.958, indicating that the Maxent model can accurately predict the locations of potential suitable habitat of P. veitchii. The resulting potential suitable habitat that was identified included eastern Tibet, eastern Qinghai, southern Ningxia, northern Yunnan, southern to central Gansu, western Shaanxi, southwestern Shanxi, and western Sichuan (Figure 3A). Among them, the most suitable habitat areas are mainly scattered in the Gannan Tibetan Autonomous Prefecture (AP) in Southern Gansu, Aba Tibetan and Qiang APs in Northern Sichuan, Liangshan Yi AP in Southern Sichuan, and in Ganzi Tibetan and Bai APs in Central Yunnan. The current habitats with moderate and high suitability cover ca. 605,114 km2 and the current habitats with low suitability encompass ca. 432,666 km2.
3.2. Key Environmental Factors Influencing the Habitat Distribution
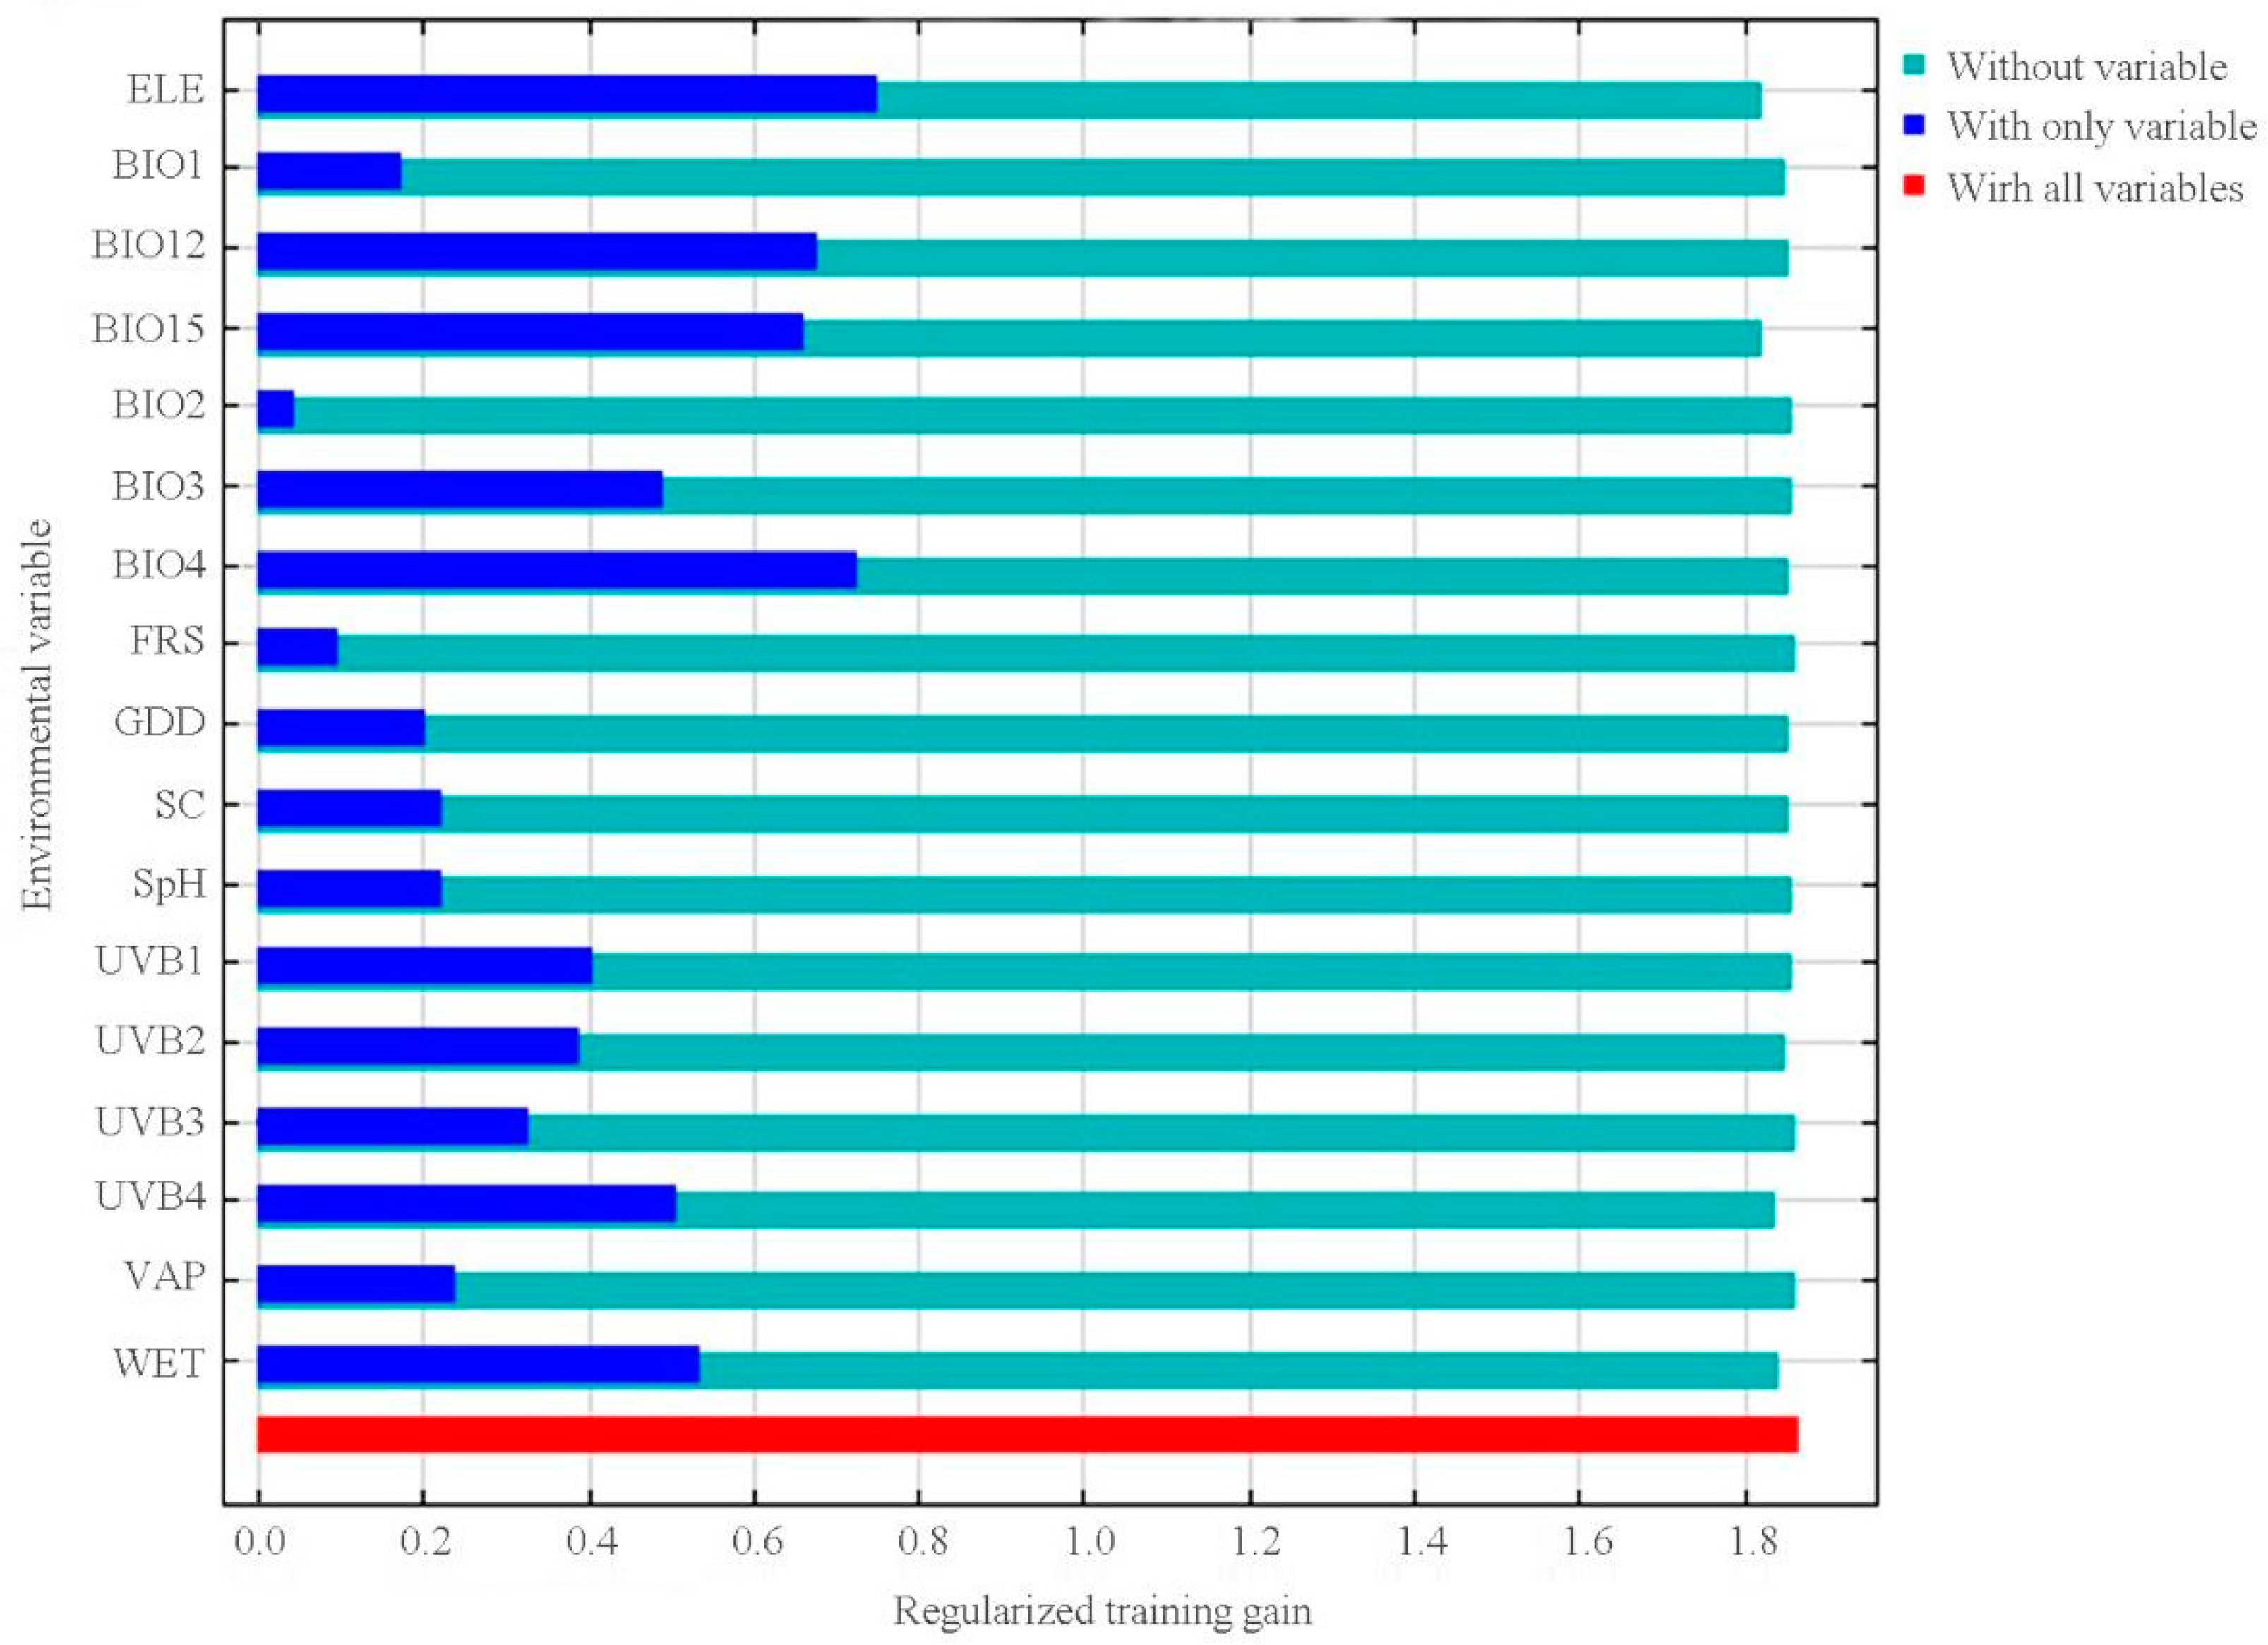
Figure 4 shows the Jackknife test results that are related to the contribution of each variable to the model. Among the 17 variables in the model, ELE (23.9% of variation), air temperature seasonality (BIO4, 18.7% of variation), annual precipitation (BIO12, 18.0% of variation), and precipitation seasonality (BIO15, 15.6% of variation) contributed the greatest weight when used separately. The cumulative contributions of these four environmental variables increased up to 76.2% (Table 1). The other variables, including annual mean temperature (BIO1), UVB, GDD, WET, SC, isothermality (BIO3), FRS, and Mean diurnal range (BIO2) demonstrated low contributions in weight, which implies their limited impact on the distribution of suitable habitat for P. veitchii (Table 1).
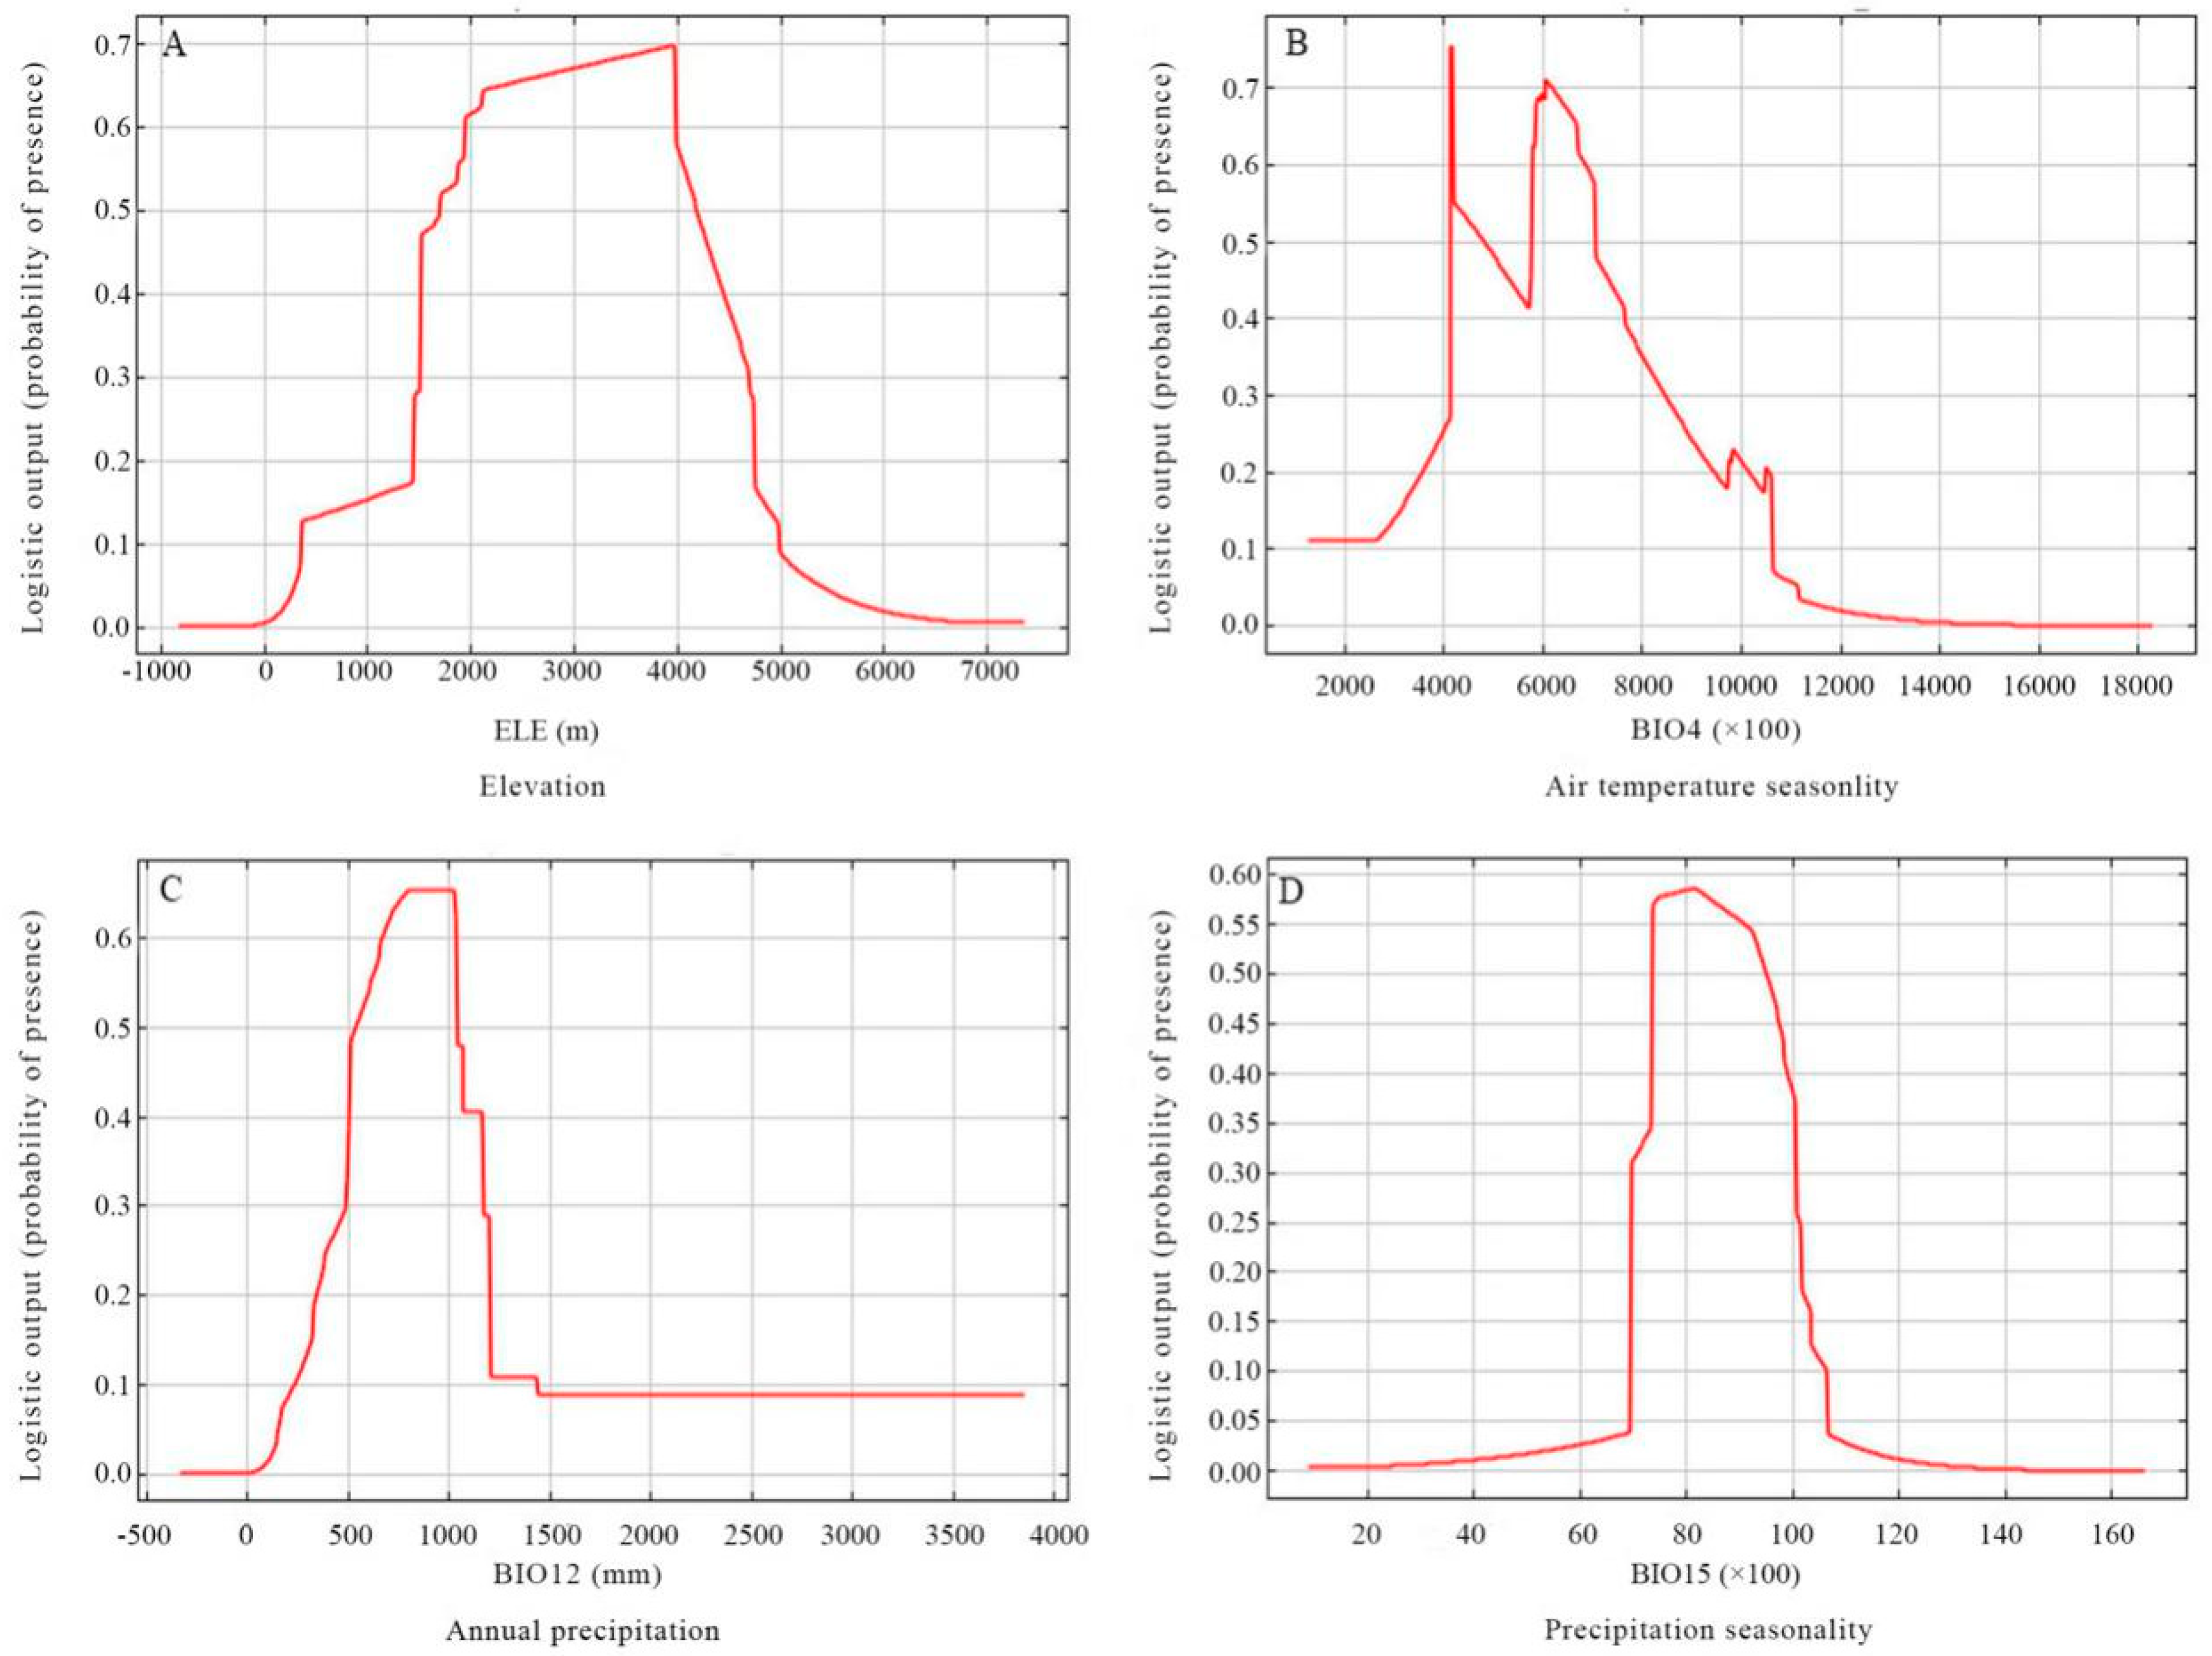
Based on the response curves (Figure 5), the thresholds (existence probability >0.2) of the major variables were obtained: elevation (ELE) ranged from 1500 to 4700 m, temperature seasonality (BIO4) ranged from 3800 to 9600, average annual precipitation (BIO12) ranged from 350 to 1200 mm, and seasonality of precipitation (BIO15) ranged from 70 to 105 mm.
3.3. Future Changes in Suitable Habitat Area
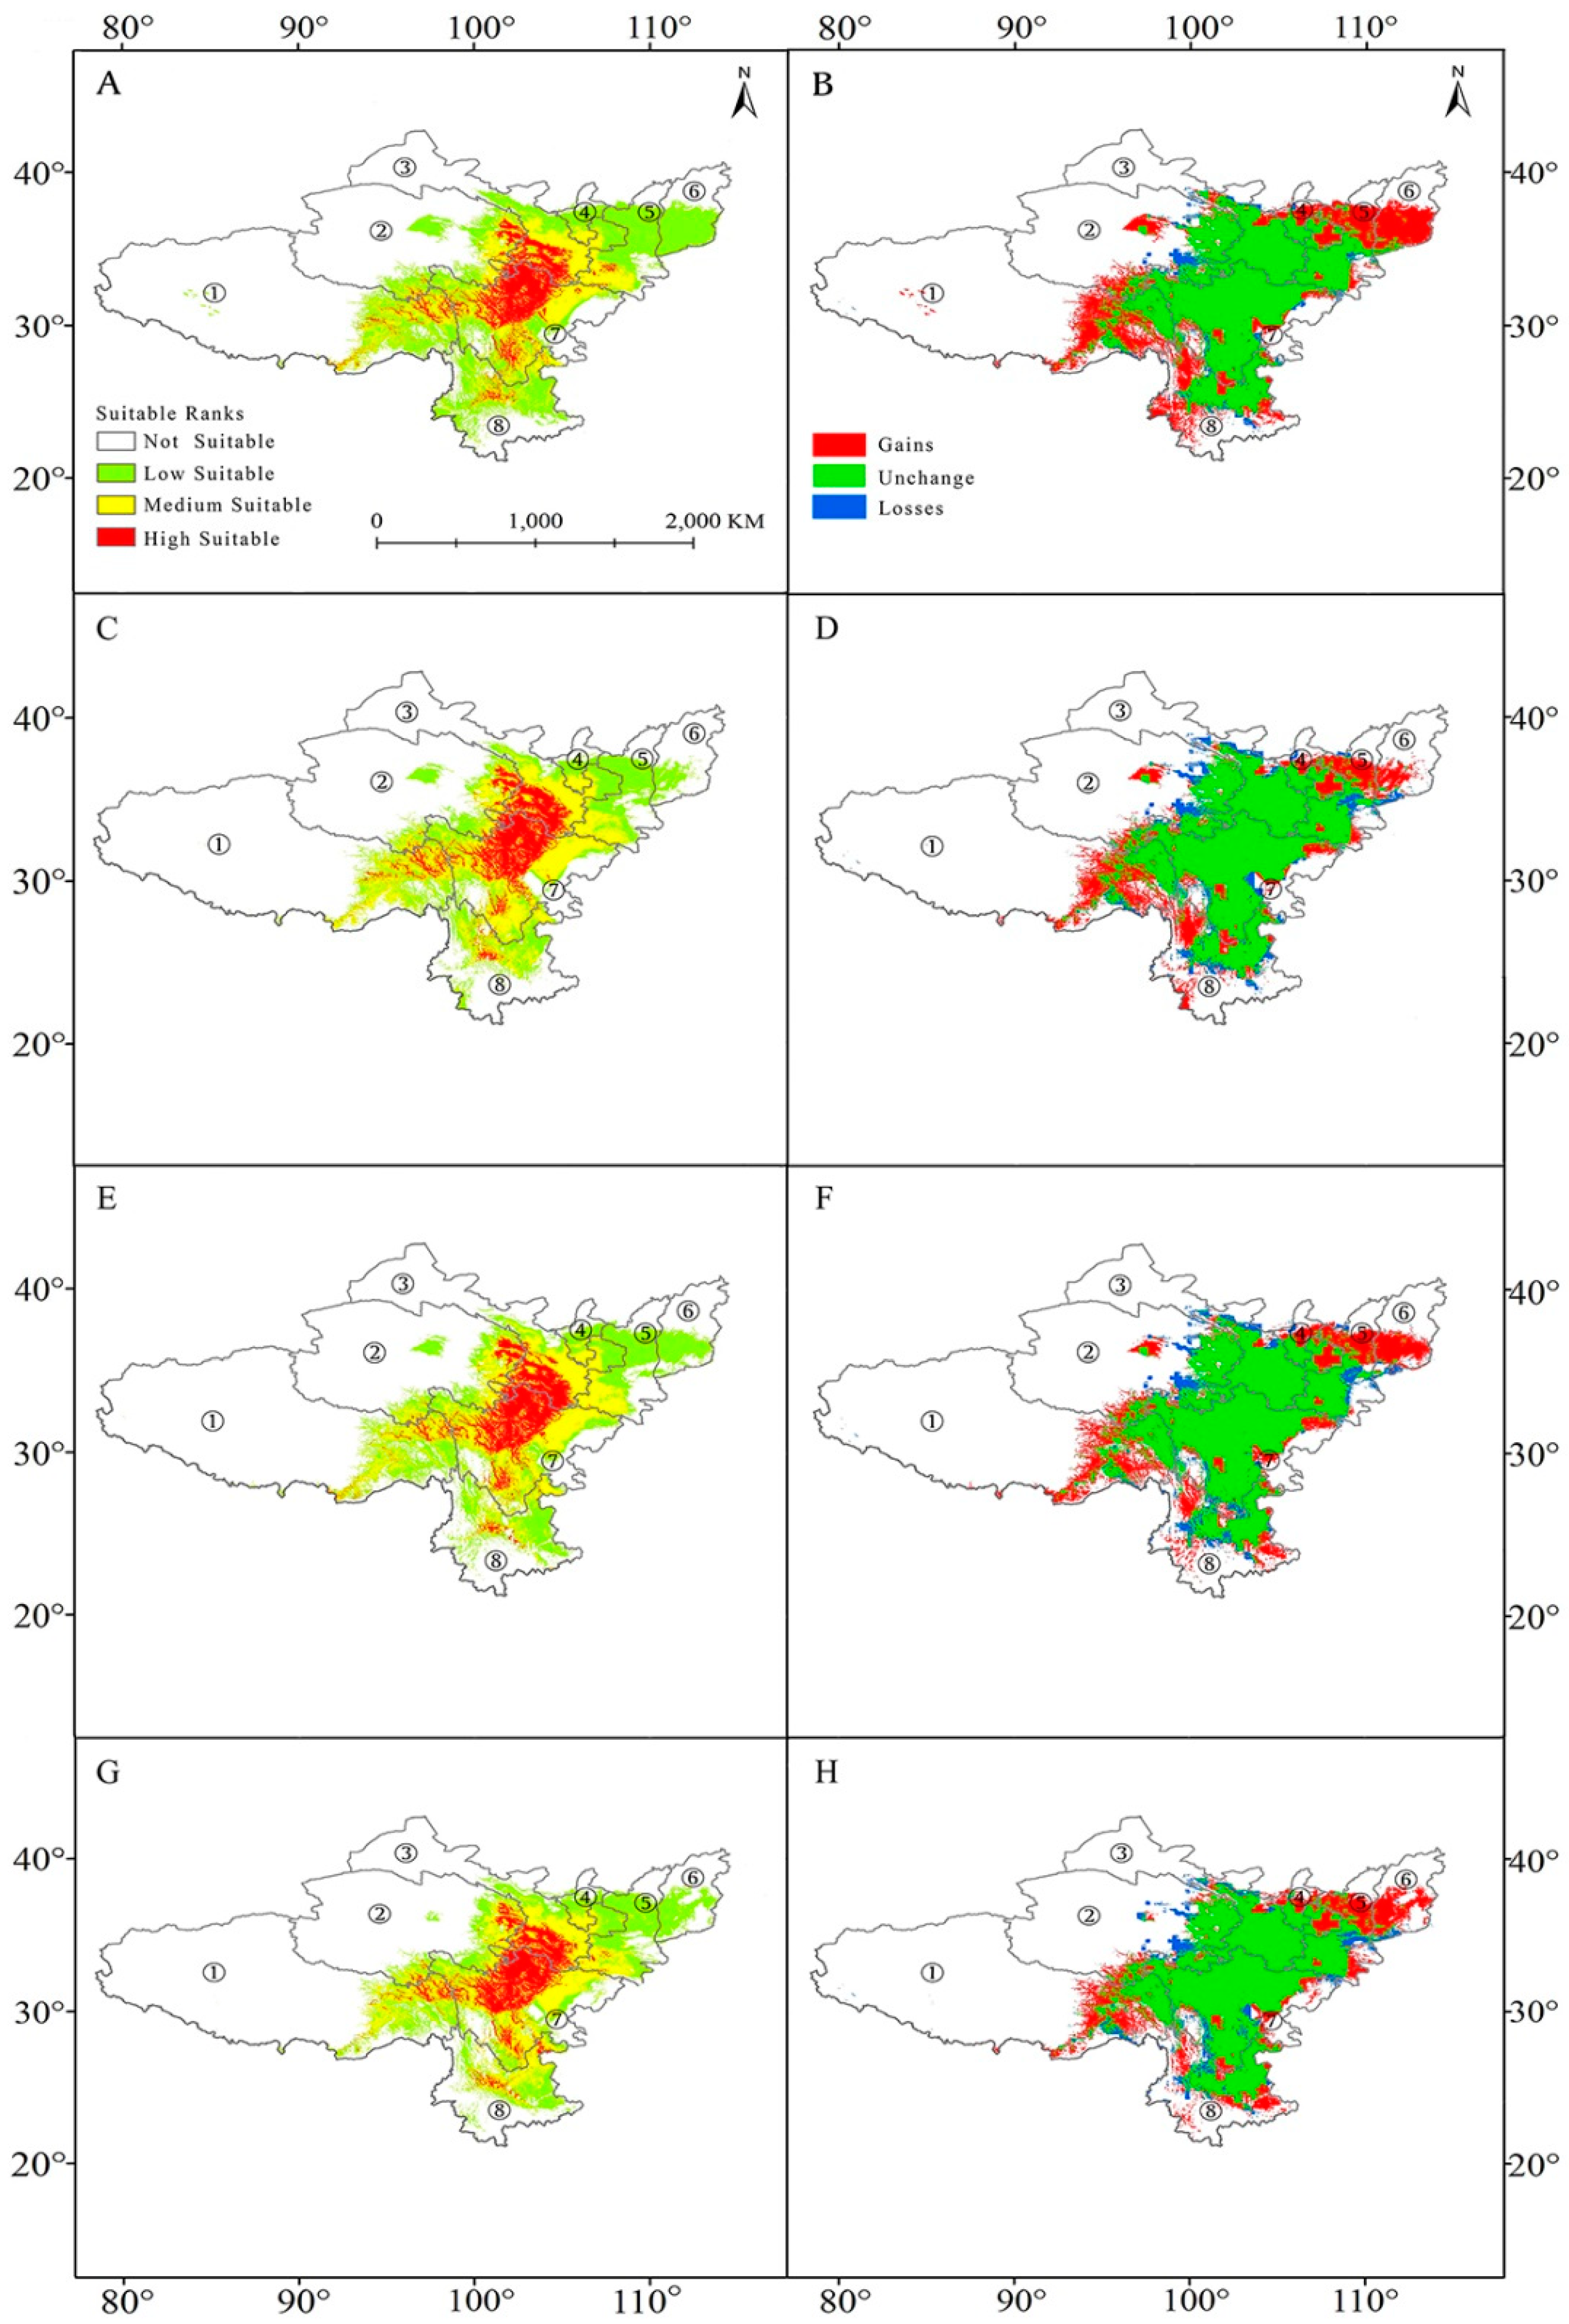
Based on the scenario with low levels of greenhouse gas emissions (RCP 2.6), Maxent estimated that the range of suitable habitat would increase in south Shanxi, south Shaanxi, south Ningxia, east Tibet, and north Yunnan in 2050, amounting to ca. 513,449 km2. The area of suitable habitat that was lost was ca. 94,425 km2 and it was predicted for central Gansu and southeast Qinghai (Figure 6A,B; Table 2). When compared with the current conditions, the percentage of the total range-wide area will increase from 1.94% to 2.25%, while the unsuitable habitat will decrease from 89.23% to 85.05% (Table 3). However, by 2070, the area that had increased by 2050 decreased to 321,434 km2 and the amount of lost range increased to 159,157 km2 (Figure 6C,D; Table 2). Overall, we saw a decreased pattern in unsuitable habitat and an increased pattern in moderate and high suitable habitat (Table 3).
Under RCP8.5, Maxent predicted gains in the habitat area in eastern Tibet, eastern Yunnan, southern Shanxi, central Shaanxi, and central Ningxia (Figure 6E,F) by 355,565 km2 (Table 2). The area of lost suitable habitat of ca 147,916 km2 will mainly be scattered in central Yunnan, western Qinghai, and western Henan (Figure 6G,H; Table 2). Generally, there was a restricted range expansion observed in the suitable habitat area. In 2070, the changed area remained generally stable as in 2050, with an increase in highly suitable habitat from the current 2.22% to 2.317% and the unsuitable area was predicted to decrease from 87.19% to 87.05% (Table 3).
3.4. Shift of the Distribution Center of Suitable Habitat
The centroid of the current distribution of P. veitchii was located in Heishui County, Sichuan Province (32°2′ N, 102°60′ E; Figure 3B). The centroid of the suitable area is predicted to shift to 32°5′ N and 102°58′ E in 2050 and to 31°55′ N and 102°29′ E in 2070 under RCP2.6. Meanwhile, the centroid of the suitable area is predicted to shift southwest (31°59′ N, 102°45′ E) in 2050 under RCP8.5, but then move southeast (32°1′ N, 102°59′ E).
4. Discussion
A pre-requisite for proper rehabilitation and the utilization of a species in an ecosystem is to understand the species distribution in detail [9]. Although discrepancies exist between various climate modeling systems [35], the approach nevertheless functions as an important research tool that is used to estimate and predict the changes occurring in terms of species distribution. Paeonia veitchii, as an endemic species of China, had been unsustainably harvested in 1950s and 1960s, because the roots can be used as a traditional Chinese medicine [36]. Humans are disturbing many populations of P. veitchii and the effects of climate change are also changing the distribution of suitable habitat; these factors may exacerbate conditions that affect the survival of P. veitchii in the long term. The present study included a detailed study of the suitable habitat for P. veitchii under current and future climate scenarios, which will provide an important step in developing feasible measures for their conservation.
P. veitchii could potentially be widely distributed in southeastern and central Gansu, southern Ningxia, eastern Qinghai, Shaanxi, Shanxi, western Sichuan, and the eastern Tibet of China [21]. Our model indicates the moderate and highly suitable habitats for P. veitchii encompass ca. 605,114 km2; the centroid of potential habitat that is listed in northwest Sichuan. The models of prior studies were consistent with those of the present study [21]. However, the potential range that we identified was broader. Northern Yunnan was also assessed to be suitable and this would provide an expanded area for the cultivation of P. veitchii.
The relative contributions of each variable for P. veitchii prediction are shown by the Jackknife tests from Maxent show (Figure 4). Of the 17 elements that were employed in the model, temperature seasonality, elevation, average annual precipitation, and precipitation seasonality were the predominant variables driving the potential distribution of P. veitchii, implying that those elements are of great importance in terms of its distribution. Based on the response curves (Figure 5), the suitable elevation for P. veitchii growth is between 1500 and 4700 m. The most suitable habitat is mainly scattered in Gannan Tibetan AP in southern Gansu, Aba Tibetan and Qiang APs in northern Sichuan, Liangshan Yi AP in southern Sichuan, and in Ganzi Tibetan and Bai APs in central Yunnan. Those regions are characterized by high elevation, specifically including the east–west Qinling Mountains across Shaanxi and Gansu, the south–north Hengduan Mountains through Sichuan, Yunnan, and Tibet, as well as in the east–west ranging Tibetan Himalayas.
The southwest monsoon and westerly circulation control and influence the climate of these regions, which have warm to hot summers and cold to very cold winters. Continual environmental stress may stimulate the evolution of this species and cause the plant to adapt [5]. The spindle-fleshy root and relatively large seed size might provide enough energy to help the plants to resist harsh environmental conditions. The high daytime temperature is beneficial in plant photosynthesis, while the low temperature at night can reduce the respiratory losses of plants and favor the accumulation of plant nutrients, which ensures the growth of the vegetative organs of P. veitchii. All of these climatic characteristics conform to the growth habit of P. veitchii, drought resistant, and cold tolerant species.
The response curve for temperature seasonality indicates that greater temperature seasonality will result in an increase in the chance that P. veitchii will occur at some particular locations. Temperature seasonality has been reported to affect flower bud differentiation [37] and seed dormancy/germination [38] of P. veitchii. The seeds of P. veitchii are reported to have deep simple epicotyl morphophysiological dormancy [38]. The embryos of the P. veitchii are linearly underdeveloped. In light of this, they need to grow inside the seed before the radicle emerges. The germination of P. veitchii seeds requires two months of warm stratification (15–20 °C) for embryo development, followed by three months of cold stratification (0–10 °C) for epicotyl growth. Moreover, the underground buds of herbaceous peony species require a critical chilling period to break their dormancy and to re-start sprouting, growth, and later flowering [39]. This indicates a physiological constraint on the distribution of P. veitchii. A similar pattern of distribution has been reported for P. delavayi [8].
The optimal annual precipitation for the growth of P. veitchii is from 350 to 1200 mm, as indicated by response curve of BIO12. Water availability is an important factor that affects plant growth and it is the most important factor that affects the growth of seedlings [23,40]. The roots of P. veitchii are fleshy and not resistant to waterlogging. Previous studies have shown that the optimum relative soil moisture content is 75% [39]. Excessive water will cause root rot and increase the risk of pests and diseases [39]. Du [41] also found that, under the stress of waterlogging, most root of P. ostii turns black and the number of respiratory roots decreased. Meanwhile, the activity of alcohol dehydrogenase, catalase, peroxidase, pyruvate decarboxylase, and superoxide dismutase decreased, indicating that waterlogging suppressed the activities of antioxidants. In addition, water availability can directly influence the emergence and growth of seedling [38]. All of these hydrothermal factors may influence the formation of the ecological adaptation of P. veitchii and the species distribution.
Currently, the effects of climatic changes have received unprecedented attention [3]. The frequency and severity of extreme climate events has increased [42]. These changes drastically affect the distribution and life cycles of plants [43]. Some species may migrate to higher elevations or latitudes as global temperatures increase [44,45]. However, some species may physiologically or phenologically adapt to such changes [32]. The present study predicts that, as the distribution of suitable habitat moves to higher elevations, a significant shift would occur.
The centroid of suitable habitat shifted was higher than the current habitat [46,47], which indicates that P. veitchii can adapt to climate change. When considering the RCP2.6 scenario, we predicted an expansion in 2050 followed by a slight contraction in 2070. In the RCP8.5 scenario, an increase in terms of the suitable habitat range is predicted to occur with the increased intensity of global warming. Global warming promotes vegetation growth [5], and a simulation of the warming climate demonstrated that there was a positive effect of temperature over P. veitchii through the acceleration of the prolonging and phenology of the growing season.
Generally, our results predict that the distribution of suitable habitat will move to higher elevations and latitudes and this change would gradually become more significant. Simultaneously, a dramatic decrease in suitable habitat would occur at low latitudes. As the intensity of climate change increases, Aba Tibetan, Qiang, and Ganzi Tibetan APs in Sichuan Province, which are at relatively high elevations, will become highly suitable for growing P. veitchii. This is predicted to occur, because the mountains block water vapor from the southwest monsoon and local areas can form a relatively independent microclimate. Therefore, these areas provide more suitable living conditions for P. veitchii.
Aside from the environmental factors that are listed above, other factors may influence the habitat suitability of P. veitchii, such as interspecific competition and low seed quality. Jing and Zheng [36] found that available pollination is insufficient for wild peony plants under natural conditions, particularly between various populations, which results in the decrease of seed production. In addition, unsustainable land use has resulted in the fragmentation of peony species habitat [21]. Habitat fragmentation has been reported to result in decreases in the local population size and gene flow from other populations [31]. As a result, adaptation, genetic variation, and the outcrossing rates will decrease [48]. To quantify the effects of habitat fragmentation in terms of the capacity of P. veitchii and to adjust to the climatic conditions in the future, more studies will be required.
The modeling of the present study predicted that the suitable habit of P. veitchii might be located in higher elevations in the future. In terms of this, it is recommended that land management agencies should set aside populations at higher elevations for conservation. In addition, we would like to propose a management strategy that can be used to respond to predicted climate change. First, immediately protecting habitats in the core area of distribution should implement in situ conservation; this could be done by strictly forbidding the removal of wild plants of P. veitchii plants. Second, ex situ conservation is known to be critical when protecting endangered species [49]. As a result, we recommend that a germplasm resource nursery/bank should be established and that seeds of this species be collected from various sites. Third, additional funding should be provided for conducting intensive surveys to examine the present conditions of wild P. veitchii populations, for strengthening research in the genetic diversity and reproductive biology of this species, especially as related to the mechanisms of low seed quality and seed germination.
5. Conclusions
Evaluating the effects of climate change on species distribution is of considerable significance to species conservation. According to the Maxent modeling, a broad habitat for P. veitchii under current and future climate scenarios has been identified. Elevation, temperature seasonality, annual mean precipitation, and precipitation seasonality were defined as the key elements shaping the distribution of P. veitchii. In the low greenhouse gas emissions scenario (RCP2.6), we predicted an expansion in 2050, followed by the slight contraction in 2070 in the range of this species; however, in the higher intensity emissions scenario (RCP8.5), we predict that the suitable habitat range will increase as global warming becomes more intense. Overall, our study predicted that there would be significant changes in terms of the distribution of suitable habitat as it moves to higher elevations. The predicted spatial and temporal shift patterns of P. veitchii will provide a useful reference for the development of forest management and conservation strategies.
Author Contributions
K.Z. and J.T. conceived and designed the study; K.Z. and Y.Z collected and analyzed the data; Y.Z. and J.T. wrote the paper.
Funding
This research was funded by the National Natural Science Foundation of the P. R. China (Grant No. 31800340); The Jiangsu Key Laboratory for Horticultural Crop Genetic Improvement of the P. R. China (Grant No. 2017023); and the Priority Academic Program Development from the Jiangsu Government.
Acknowledgments
Thanks to the anonymous reviewers for their constructive and valuable comments and the editors for their assistance in refining this article.
Conflicts of Interest
The authors declare no conflict of interest.
References
- Lawler, J.J.; Shafer, S.L.; White, D.; Kareiva, P.; Maurer, E.P.; Blaustein, A.R.; Bartlein, P.J. Projected climate-induced faunal change in the Western Hemisphere. Ecology 2009, 90, 588–597. [Google Scholar] [CrossRef] [PubMed]
- Walck, J.L.; Hidayati, S.N.; Dixon, K.W.; Thompson, K.E.N.; Poschlod, P. Climate change and plant regeneration from seed. Global Chang. Biol. 2011, 17, 2145–2161. [Google Scholar] [CrossRef]
- Stocker, T.F.; Qin, D.; Plattner, G.K.; Tignor, M.; Allen, S.K.; Boschung, J.; Nauels, A.; Xia, Y.; Bex, V.; Midgley, P.M. Climate Change 2013: The Physical Science Basis; Contribution of Working Group I to the Fifth Assessment Report. Tech. rep.; Intergovernmental Panel on Climate Change: Cambridge, UK, 2013. [Google Scholar]
- Hu, X.G.; Jin, Y.; Wang, X.R.; Mao, J.F.; Li, Y. Predicting impacts of future climate change on the distribution of the widespread conifer Platycladus orientalis. PLoS ONE 2015, 10, e0132326. [Google Scholar] [CrossRef] [PubMed]
- Ma, B.; Sun, J. Predicting the distribution of Stipa purpurea across the Tibetan Plateau via the MaxEnt model. BMC Ecol. 2018, 18, 10. [Google Scholar] [CrossRef] [PubMed]
- Peterson, A.T.; Soberón, J.; Pearson, R.G.; Anderson, R.P.; Martínez-Meyer, E.; Nakamura, M.; Araújo, M.B. Ecological Niches and Geographic Distributions (MPB-49); Princeton University Press: Princeton, NJ, USA, 2011. [Google Scholar]
- Fitzpatrick, M.C.; Gove, A.D.; Sanders, N.J.; Dunn, R.R. Climate change, plant migration, and range collapse in a global biodiversity hotspot: The Banksia (Proteaceae) of Western Australia. Global Chang. Biol. 2008, 14, 1337–1352. [Google Scholar] [CrossRef]
- Zhang, K.L.; Yao, L.J.; Meng, J.S.; Tao, J. Maxent modeling for predicting the potential geographical distribution of two peony species under climate change. Sci. Total Environ. 2018, 634, 1326–1334. [Google Scholar] [CrossRef] [PubMed]
- Franklin, J. Species distribution models in conservation biogeography: Developments and challenges. Divers. Distrib. 2013, 19, 1217–1223. [Google Scholar] [CrossRef]
- Busby, J.R. BIOCLIM—a bioclimate analysis and prediction system. In Nature Conervation: Cost Effective Biological Surveys and Data Analysis; Margules, C.R., Austin, M.P., Eds.; CSIRO: Melbourne, Australia, 1991; pp. 64–68. [Google Scholar]
- Carpenter, G.; Gillison, A.N.; Winter, J. DOMAIN: A flexible modelling procedure for mapping potential distributions of plants and animals. Biodivers. Conserv. 1993, 2, 667–680. [Google Scholar] [CrossRef]
- Hirzel, A.; Guisan, A. Which is the optimal sampling strategy for habitat suitability modelling. Ecol. Modell. 2002, 157, 331–341. [Google Scholar] [CrossRef]
- Guisan, A.; Lehmann, A.; Ferrier, S.; Austin, M.; Overton, J.M.C.C.; Aspinall, R.; Hastie, T. Making better bio-geographical predictions of species’ distributions. J. Appl. Ecol. 2006, 43, 386–392. [Google Scholar] [CrossRef]
- Stockwell, D. The GARP modelling system: Problems and solutions to automated spatial prediction. Int. J. Geogr. Inf. Sci. 1999, 13, 143–158. [Google Scholar] [CrossRef]
- Phillips, S.J.; Anderson, R.P.; Schapire, R.E. Maximum entropy modeling of species geographic distributions. Ecol. Modell. 2006, 190, 231–259. [Google Scholar] [CrossRef]
- Ashraf, U.; Ali, H.; Chaudry, M.; Ashraf, I.; Batool, A.; Saqib, Z. Predicting the potential distribution of Olea ferruginea in Pakistan incorporating climate change by using Maxent model. Sustainability 2016, 8, 722. [Google Scholar] [CrossRef]
- Ficetola, G.F.; Thuiller, W.; Miaud, C. Prediction and validation of the potential global distribution of a problematic alien invasive species—the American bullfrog. Divers. Distrib. 2007, 13, 476–485. [Google Scholar] [CrossRef]
- Hong, D.Y.; Zhou, S.L.; He, X.J.; Yuan, J.H.; Zhang, Y.L.; Cheng, F.Y.; Zeng, X.L.; Wang, Y.; Zhang, X.X. Current status of wild tree peony species with special reference to conservation. Biodiv. Sci. 2017, 25, 781–793. [Google Scholar] [CrossRef] [Green Version]
- Meng, J.S.; Zhu, M.Y.; Sun, J.; Tao, J. Research progress in the seeds of Paeonia ssp. Seed 2017, 36, 50–54. [Google Scholar]
- Keenan, R.J. Climate change impacts and adaptation in forest management: A review. Ann. Forest. Sci. 2015, 72, 145–167. [Google Scholar] [CrossRef]
- Hong, D.Y.; Pan, K.Y. A taxonomic revision of the Paeonia anomala complex (Paeoniaceae). Ann. Mo. Bot. Gard. 2004, 91, 87–98. [Google Scholar]
- Huang, L.F.; He, Y.B.; Wang, Y.L.; Feng, X.L. Analysis of volatile oils from Paeonia veitchii Lynch. Chin. J. Spectrosc. Lab. 2013, 30, 2912–2914. [Google Scholar]
- Wang, S.Q.; Su, L.L.; Zhen, C.J. Study on pollen fertility in Paeonia veitchii. Guangdong Agric. Sci. 2012, 39, 28–30. [Google Scholar]
- Kang, X.F.; Guo, X.F.; Xu, S.L.; Song, C.H. Effect of shading in summer on photosynthetic characteristics of Paeonia veitchii. Shandong Agric. Sci. 2011, 3, 43–46. [Google Scholar]
- Hijmans, R.J.; Cameron, S.E.; Parra, J.L.; Jones, P.G.; Jarvis, A. Very high resolution interpolated climate surfaces for global land areas. Int. J. Climatol. 2005, 25, 1965–1978. [Google Scholar] [CrossRef] [Green Version]
- New, M.; Hulme, M.; Jones, P. Representing twentieth-century space-time climate variability. Part I: Development of a 1961–1990 mean monthly terrestrial climatology. J. Clim. 1999, 12, 829–856. [Google Scholar] [CrossRef]
- Beckmann, M.; Vaclavik, T.; Manceur, A.M.; Sprtova, L.; von Wehrden, H.; Welk, E.; Cord, A.F. glUV: A global UV-B radiation data set for macroecological studies. Methods Ecol. Evol. 2014, 5, 372–383. [Google Scholar] [CrossRef]
- Moss, R.; Babiker, W.; Brinkman, S.; Calvo, E.; Carter, T.; Edmonds, J.; Elgizouli, I.; Emori, S.; Erda, L.; Hibbard, K.; et al. Towards New Scenarios for Analysis of Emissions: Climate Change, Impacts, and Response Strategies; IPCC Expert Meeting Report; IPCC: Geneva, Switzerland, 2008. [Google Scholar]
- Vuuren, D.P.V.; Edmonds, J.; Kainuma, M.; Kainuma, M.; Riahi, K.; Thomson, A.; Hibbard, K.; Hurtt, G.C.; Kram, T.; Krey, V.; et al. The representative concentration pathways: An overview. Clim. Chang. 2009, 109, 5–31. [Google Scholar] [CrossRef]
- Weyant, J.; Azar, C.; Kainuma, M.; Kejun, J.; Nakicenovic, N.; Shukla, P.R.; La Rovere, E.; Yohe, G. Report of 2.6 versus 2.9 Watts/m2 RCPP Evaluation Panel; Integrated Assessment Modeling Consortium: Geneva, Switzerland, 2009. [Google Scholar]
- Wu, T.W.; Song, L.C.; Li, W.P.; Wang, Z.Z.; Zhang, H.; Xin, X.G.; Zhang, Y.W.; Zhang, L.; Li, J.L.; Wu, F.H.; et al. An overview of BCC climate system model development and application for climate change studies. J. Meteorol. Res. 2014, 28, 34–56. [Google Scholar] [CrossRef]
- Hu, J.; Liu, Y. Unveiling the conservation biogeography of a data-deficient endangered bird species under climate change. PLoS ONE 2014, 9, e84529. [Google Scholar] [CrossRef]
- Phillips, S.J.; Anderson, R.P.; Dudík, M.; Schapire, R.E.; Blair, M.E. Opening the black box: An open-source release of Maxent. Ecography 2017, 40, 887–893. [Google Scholar] [CrossRef]
- Brown, J.L. SDM toolbox: A python-based GIS toolkit for landscape genetic, biogeographic and species distribution model analyses. Methods Ecol. Evol. 2014, 5, 694–700. [Google Scholar] [CrossRef]
- Cheaib, A.; Badeau, V.; Boe, J.; Chuine, I.; Delire, C.; Dufrêne, E.; Francois, C.; Gritti, E.S.; Legay, M.; Pagé, C.; et al. Climate change impacts on tree ranges: Model intercomparison facilitates understanding and quantification of uncertainty. Ecol. Lett. 2012, 15, 533–544. [Google Scholar] [CrossRef]
- Jing, X.M.; Zheng, G.H. The characteristics in seed germination and dormancy of four wild species of tree peonies and their bearing on endangerment. Acta Phytophysiol. Sin. 1999, 25, 214–221. [Google Scholar]
- Zhang, J.P.; Li, D.Q.; Shi, X.H.; Zhang, D.; Qiu, S.; Wei, J.F.; Zhang, J.; Zhou, J.H.; Zhu, K.Y.; Xia, Y.P. Mining and expression analysis of candidate genes involved in regulating the chilling requirement fulfillment of Paeonia lactiflora ‘Hang Baishao’. BMC Plant Biol. 2017, 17, 262. [Google Scholar] [CrossRef] [PubMed]
- Baskin, C.C.; Baskin, J.M. Seeds: Ecology, Biogeography, and, Evolution of Dormancy and Germination, 2nd ed.; Elsevier/Academic Press: San Diego, CA, USA, 2014. [Google Scholar]
- Zhang, X.Y.; Liu, H.N.; Su, J.H.; Tao, J.; Zhao, D.Q. Research Progress on the effect of abiotic stress on the growth and development of Paeonia plant. Mol. Plant Breed. 2018, 16, 5072–5079. [Google Scholar]
- Poorter, H.; Nagel, O. The role of biomass allocation in the growth response of plants to different levels of light, CO2, nutrients and water: A quantitative review. Funct. Plant Biol. 2000, 27, 1191. [Google Scholar] [CrossRef]
- Du, S.B. The physiological and biochemical effects on Paeonia ostii under waterlogging stress and restoration. Master’s Thesis, East China Normal University, Shanghai, China, 2016. [Google Scholar]
- Cai, W.; Borlace, S.; Lengaigne, M.; Rensch, P.V.; Collins, M.; Vecchi, G.; Timmermann, A.; Santoso, A.; Mcphaden, M.J.; Wu, L. Increasing frequency of extreme El Nino events due to greenhouse warming. Nat. Clim. Chang. 2014, 4, 111–116. [Google Scholar] [CrossRef]
- Cavaliere, C. The effects of climate change on medicinal and aromatic plants. Herbal Gram 2009, 81, 44–57. [Google Scholar]
- Lenoir, J.; Gégout, J.C.; Marquet, P.A.; de Ruffray, P.; Brosse, H. A significant upward shift in plant species optimum elevation during the 20th century. Science 2008, 320, 1768–1771. [Google Scholar] [CrossRef] [PubMed]
- Parmesan, C.; Duarte, C.; Poloczanska, E.; Richardson, A.J.; Singer, M.C. Overstretching attribution. Nat. Clim. Chang. 2011, 1, 2. [Google Scholar] [CrossRef]
- Xu, M.H.; Xue, X. Analysis on effects of climate warming on growth and phenology of alpine plants. J. Arid Land Resour. Environ. 2013, 27, 137–141. [Google Scholar]
- Kodra, E.; Steinhaeuser, K.; Ganguly, A.R. Persisting cold extremes under 21st—century warming scenarios. Geophys. Res. Lett. 2011, 38, 16. [Google Scholar] [CrossRef]
- Wang, J.R.; Hawkins, C.D.B.; Letchford, T. Photosynthesis, water and nitrogen use efficiencies of four paper birch (Betula papyrifera) populations grown under different soil moisture and nutrient regimes. For. Ecol. Manag. 1998, 112, 233–244. [Google Scholar] [CrossRef]
- Dawson, T.P.; Jackson, S.T.; House, J.I.; Prentice, I.C.; Mace, G.M. Beyond predictions: Biodiversity conservation in a changing climate. Science 2011, 332, 53–58. [Google Scholar] [CrossRef] [PubMed]
Figure 1.
Processing methodology showing a summary of the full workflow, which served as the basis of the analyses.
Figure 1.
Processing methodology showing a summary of the full workflow, which served as the basis of the analyses.

Figure 2.
Distribution records of Paeonia veitchii in China. Outlines of provinces and other administrative areas are shown.
Figure 2.
Distribution records of Paeonia veitchii in China. Outlines of provinces and other administrative areas are shown.

Figure 3.
Predicted current distribution model (A) and the core distribution shifts (B) under four climate scenario/year for Paeonia veitchii. Arrow indicates the magnitude and direction of predicted change through time. ① Tibet; ② Qinghai; ③ Gansu; ④ Ningxia; ⑤ Shaanxi; ⑥ Shanxi; ⑦ Sichuan; and, ⑧ Yunnan.

Figure 4.
Jackknife test for evaluating the relative importance of environmental variables for Paeonia veitchii in China. Table 1 provides the full definitions of each variable.
Figure 4.
Jackknife test for evaluating the relative importance of environmental variables for Paeonia veitchii in China. Table 1 provides the full definitions of each variable.

Figure 5.
Response curves for important environmental predictors in the species distribution model for Paeonia veitchii.
Figure 5.
Response curves for important environmental predictors in the species distribution model for Paeonia veitchii.

Figure 6.
Future species distribution models (SDMs) of Paeonia veitchii under climate change scenarios representative concentration pathway 2.6 (RCP 2.6) and RCP 8.5. (A) SDM for P. veitchii under RCP 2.6 in 2050; (B) comparison between the current SDM and the SDM under RCP 2.6 in 2050; (C) SDM for P. veitchii under RCP 2.6 in 2070; (D) comparison between the current SDM and the SDM under RCP 2.6 in 2070; (E) SDM for P. veitchii under RCP 8.5 in 2050; (F) comparison between the current SDM and the SDM under RCP 8.5 in 2050; (G) SDM for P. veitchii under RCP 8.5 in 2050; and, (H) comparison between the current SDM and the SDM under RCP 8.5 in 2070. ① Tibet; ② Qinghai; ③ Gansu; ④ Ningxia; ⑤ Shaanxi; ⑥ Shanxi; ⑦ Sichuan; ⑧ Yunnan.


Table 1.
Percentage contributions and permutation importance of the variables included in the Maxent models for Paeonia veitchii.
Table 1.
Percentage contributions and permutation importance of the variables included in the Maxent models for Paeonia veitchii.
| Environmental Variables | Resolution | Unit | Contribution (%) |
|---|---|---|---|
| Elevation (ELE) | 30″ × 30″ | m | 23.9 |
| Air temperature seasonality (BIO4) | 30″ × 30″ | ×100 | 18.7 |
| Annual precipitation (BIO12) | 30″ × 30″ | mm | 18.0 |
| Precipitation seasonality (BIO15) | 30″ × 30″ | mm | 15.6 |
| Annual mean temperature (BIO1) | 30″ × 30″ | °C × 10 | 7.5 |
| Mean ultraviolet-B of lightest month (UVB3) | 30″ × 30″ | J m−2·day−1 | 3.2 |
| Growing degree days (GDD) | 0.5° × 0.5° | day | 3.1 |
| Mean UV-B of lowest month (UVB4) | 30″ × 30″ | J m−2·day−1 | 3.0 |
| Wet-day frequency (WET) | 0.5° × 0.5° | 2.9 | |
| Soil organic carbon (SC) | 0.5° × 0.5° | 1.1 | |
| Annual mean UV-B (UVB1) | 30″ × 30″ | J m−2·day−1 | 0.9 |
| UV-B seasonality (UVB2) | 30″ × 30″ | J m−2·day−1 | 0.9 |
| Vapor pressure (VAP) | 0.5° × 0.5° | hPa | 0.5 |
| Soil pH (SpH) | 0.5° × 0.5° | 0.2 | |
| Isothermality (BIO3) | 30″ × 30″ | ×100 | 0.2 |
| Ground-frost frequency (FRS) | 30″ × 30″ | 0.2 | |
| Mean diurnal air temperature range (BIO2) | 30″ × 30″ | °C × 10 | 0.2 |
Table 2.
Dynamic changes in the distribution area for Paeonia veitchii under four future climate scenarios/years.
Table 2.
Dynamic changes in the distribution area for Paeonia veitchii under four future climate scenarios/years.
| Area (km2) | Increased | Decreased | Unchanged |
|---|---|---|---|
| RCP2.6-2050 | 513,449.3 | 94,425.1 | 984,215.1 |
| RCP2.6-2070 | 321,434.4 | 159,157.0 | 919,481.3 |
| RCP8.5-2050 | 355,565.9 | 147,916.1 | 930,724.1 |
| RCP8.5-2070 | 364,607.0 | 144,645.6 | 933,993.6 |
Table 3.
Portions of the four suitability classes of areas of potential distribution of Paeonia veitchii under current and four future climate scenarios/years.
Table 3.
Portions of the four suitability classes of areas of potential distribution of Paeonia veitchii under current and four future climate scenarios/years.
| Portion of Area (%) | Not Suitable | Low Suitability | Moderate Suitability | High Suitability |
|---|---|---|---|---|
| Current | 89.23 | 4.49 | 4.34 | 1.94 |
| RCP2.6-2050 | 85.05 | 7.99 | 4.70 | 2.25 |
| RCP2.6-2070 | 87.66 | 5.03 | 5.09 | 2.22 |
| RCP8.5-2050 | 87.19 | 5.68 | 4.91 | 2.22 |
| RCP8.5-2070 | 87.05 | 5.70 | 4.93 | 2.32 |
© 2019 by the authors. Licensee MDPI, Basel, Switzerland. This article is an open access article distributed under the terms and conditions of the Creative Commons Attribution (CC BY) license (http://creativecommons.org/licenses/by/4.0/).
Share and Cite
MDPI and ACS Style
Zhang, K.; Zhang, Y.; Tao, J. Predicting the Potential Distribution of Paeonia veitchii (Paeoniaceae) in China by Incorporating Climate Change into a Maxent Model. Forests 2019, 10, 190. https://0-doi-org.brum.beds.ac.uk/10.3390/f10020190
AMA Style
Zhang K, Zhang Y, Tao J. Predicting the Potential Distribution of Paeonia veitchii (Paeoniaceae) in China by Incorporating Climate Change into a Maxent Model. Forests. 2019; 10(2):190. https://0-doi-org.brum.beds.ac.uk/10.3390/f10020190
Chicago/Turabian StyleZhang, Keliang, Yin Zhang, and Jun Tao. 2019. "Predicting the Potential Distribution of Paeonia veitchii (Paeoniaceae) in China by Incorporating Climate Change into a Maxent Model" Forests 10, no. 2: 190. https://0-doi-org.brum.beds.ac.uk/10.3390/f10020190
Note that from the first issue of 2016, this journal uses article numbers instead of page numbers. See further details here.