Study on the Diurnal Dynamic Changes and Prediction Models of the Moisture Contents of Two Litters

1
School of Biological Sciences, Guizhou Education University, Gaoxin St. 115, Guiyang 550018, Guizhou, China
2
College of Forestry, Northeast Forestry University, Hexing St. 26, Harbin 150040, Heilongjiang, China
*
Author to whom correspondence should be addressed.
Forests 2020, 11(1), 95; https://0-doi-org.brum.beds.ac.uk/10.3390/f11010095
Submission received: 14 December 2019
/
Revised: 9 January 2020
/
Accepted: 10 January 2020
/
Published: 12 January 2020
(This article belongs to the Special Issue Forest Fire Risk Prediction)
Abstract
:The occurrence and behavior of forest fires are mainly affected by litter moisture content, which is very important for fire risk forecasting. Errors in models of litter moisture content prediction mainly stem from the neglect of diurnal variation. Consequently, it is essential to determine the diurnal variation of litter moisture content and establish a high-precision prediction model. In this study, the moisture contents of litters of Mongolian oak (Quercus mongolica) and Korean pine (Pinus koraiensis) were monitored at 1 h time steps to obtain the diurnal variations of moisture content, and two direct estimation (Nelson and Simard) methods as well as one meteorological factor regression method were selected to establish prediction models at 1 h time steps. The moisture contents of the two litter types showed obvious diurnal variation, and the changes were significantly correlated with the air temperature and relative humidity. The wind speed had no significant effect on the change within 1 h. The mean absolute error (MAE) values of the three prediction models of Mongolian oak were 1.02%, 1.03%, and 1.46%, and those of Korean pine were 0.50%, 0.50%, and 1.95%, respectively. Similarly, the mean relative error (MRE) values of the three prediction models of oak litter were 4.76%, 4.73%, and 6.65%, and those of pine were 3.53%, 3.59%, and 13.26%, respectively. These results indicated that the accuracy of the Nelson and Simard methods was similar, and both met the requirements for the forecasting of forest fire risk. Therefore, the direct estimation method was selected to predict the moisture contents of two litter types in this area.
1. Introduction
The goal of forecasting forest fires is to calculate the probability of fire occurrence and potential damage [1,2]. With global warming and the increasing occurrence of forest fires, the study of forest fire forecasting is becoming increasingly important [3,4,5]. High-accuracy forest fire forecasting can reduce the losses caused by forest fires through the formulation of firefighting plans according to the possibility of forest fires and potential damage. Whether suppression can be achieved and appropriate firefighting plans formulated mainly depends on whether the forest fire forecast is accurate, and whether the accuracy can meet the needs for prevention and extinguishing of the fire. Therefore, one of the main tasks of forest fire forecasting is to improve the accuracy of predictions of fire occurrence and potential damage, which can provide accurate technical support for forest fire management decision-makers.
Research on forest fire forecasting must explore information related to meteorological conditions, fuel characteristics, geographical conditions, and human activities [6,7]. Among these, forest fuel is the carrier of forest fire and it is an important variable in forest fire forecasting [8,9,10,11,12]. The moisture content of fuel determines the possibility of burning and fire behaviors [13,14,15], and thus forms the basis of forest fire prediction. As an important part of forest fuel, surface litter is an important fuel contributing to forest fires, and its moisture content value determines the probability and initial spread rate of forest fires. Therefore, it is of great significance to establish a high-accuracy prediction model for litter moisture content for forecasting forest fires [16].
The prediction methods used to obtain the moisture content of litters mainly include the meteorological factor, physical process, and direct estimation methods. Although the physical process method can help to understand the phenomenon of litter moisture change, it is difficult to apply to fire risk systems due to its complex structure and numerous model parameters [17,18,19,20]. The principal methods employed to predict the moisture content of litter in a fire risk system are the regression method of meteorological factors and the direct estimation method, both of which still result in some errors [18,21,22]. The meteorological factor method is a statistical method with a large error of 15% or more [23,24]. The direct estimation method is a combination of physical processes, the meteorological factor method, and the principal prediction equation derived from the physical diffuse equation, and it can be used in the equilibrium moisture content response equation based on the form of physical derivation or other statistical models [25,26]. The parameters of the direct estimation method are estimated using observation data and, therefore, it has the advantages of universality and reliability of the physical method and simplicity of the statistical method [27,28,29].
The small errors of the direct estimation method compared with the meteorological factor method [30,31,32], can lead to a 1- or 2-fold difference in fire risk in some cases [32,33]. Two main reasons for the errors are as follows: one source of error is the oversimplification of the diurnal variation of litter moisture content [17,18], while the other is extrapolation and poor applicability [34,35]. Therefore, there are two mainstream methods for improving the prediction accuracy of dynamic changes in moisture content, the first of which makes predictions based on an hour (h) or shorter scales. For a specific forest type, the shorter the prediction scale, the higher the prediction accuracy [17,18,19]. The other method is to establish corresponding prediction models according to different stand conditions and fuel types. Because of the strong spatial heterogeneity of litter bed moisture content [36], if the second method is selected, it will be time-consuming and laborious, and thus it is difficult to apply in practice. Therefore, this study chose to shorten the prediction scale to improve the moisture content prediction accuracy, which is of great significance to understanding the diurnal dynamic changes in litter moisture content.
Meteorological factors have significant impacts on litter moisture content. The air temperature and relative humidity have a stable diurnal variation process for non-rain days, so the moisture content of litter has a strong daily variation process [17,18,24]. In addition, stochastic wind and rainfall further complicate the process. In the past, meteorological factor observation techniques have been limited, and it has been difficult to provide detailed information that can reflect the daily changes in these weather phenomena. The value of litter moisture content can be calculated using only meteorological observations at a certain time of day. The existing fire risk system basically follows the traditional method; thus, the prediction of litter moisture content is still based on 24 h as the calculation step. For example, in the Canadian Fire Risk Forecasting System, the noon temperature, humidity, wind speed, and first 24 h of rainfall are used as predictors to calculate the litter moisture content. In the United States, meteorological factors such as the daily maximum and minimum temperature are used. In other models, the meteorological factors at a certain time are directly used as regression models [37,38], which produce errors due to simplification of the daily variation in moisture content of the surface litter. It seems the main reason for this is that the influence of diurnal variation of meteorological factors upon changes in litter moisture content is not taken into consideration.
Due to technical progress, meteorological factors and litter moisture content can now be monitored in steps of 1 h or less. Forest fire researchers also recognize that fire occurrence and fire behavior are very sensitive to litter moisture content responses, and accurate forest fire forecasting requires litter moisture content data at a shorter time scale than that of an entire day to be used to establish a prediction model using steps of 1 h or less. Therefore, some studies have investigated the diurnal variation in moisture. Van Wagner [39] proposed a method for predicting the moisture content of litter at a 1 h step. Additionally, Lawson et al. [40] used the moisture content at 4 pm to calculate moisture content data at other times. Furthermore, Catchpole et al. [26] studied the diurnal variation process of moisture content and established a prediction model using the direct estimation method, with errors from 2.3% to 5.2%. Sun et al. [24] selected the direct estimation and meteorological factor regression methods to predict the diurnal variation in litter moisture content and found that direct estimation was better than the regression method, but the study was only conducted during the daytime, indicating that the applicability of the diurnal variation prediction model has limitations. Nelson [17] used the 10 h humidity bar as the object and obtained a diurnal variation model of moisture content. However, the driving mechanism of moisture content change between the humidity bar and surface litter layer was quite different, and the error was large and not suitable for forest fire forecasting when applied to the surface litter layer. Among these studies, the direct estimation and meteorological factor regression methods are the two most commonly used methods. In summary, although the diurnal variation of surface litter moisture content has been studied and relevant prediction models have been established, the diurnal variation in the moisture content of litter layer has not been fully revealed due to the limitations of previous research, including the structure of the litter layer, research duration, and research objects. Therefore, in this study, the litter moisture content was monitored hourly in the field both during daytime and nighttime, and the driving factors of moisture content change were analyzed. The direct estimation method and the meteorological factor method were selected to establish the 1 h step prediction model. Which method is more suitable for the prediction of diurnal changes in moisture content was also assessed.
Heilongjiang Province is the most serious fire-risk region in China [24]. We selected two important types of forest, Mongolian oak (Quercus mongolica) and Korean pine (Pinus koraiensis), which are widely distributed in this region. The leaf litter of Mongolian oak is large and easily collapses, making it easy to ignite; thus, oak forest often carries a higher fire risk [41]. Korean pine plantations also face a high risk of fire due to their high lipid content. Therefore, we selected the surface litter layers of oak and pine forests as the research object, and used a non-destructive sampling method to monitor the diurnal variation in litter moisture content in 1 h steps. Meteorological data were simultaneously recorded and used to analyze the driving factors of diurnal variation in litter moisture content. The direct estimation and meteorological factor regression methods were used to establish a prediction model with 1 h steps and to quantify the accuracy of the model and the difference between forest types, which will be of great significance for improving the prediction accuracy of moisture content prediction and forest fire forecasting in the future.
2. Methods
2.1. Study Area
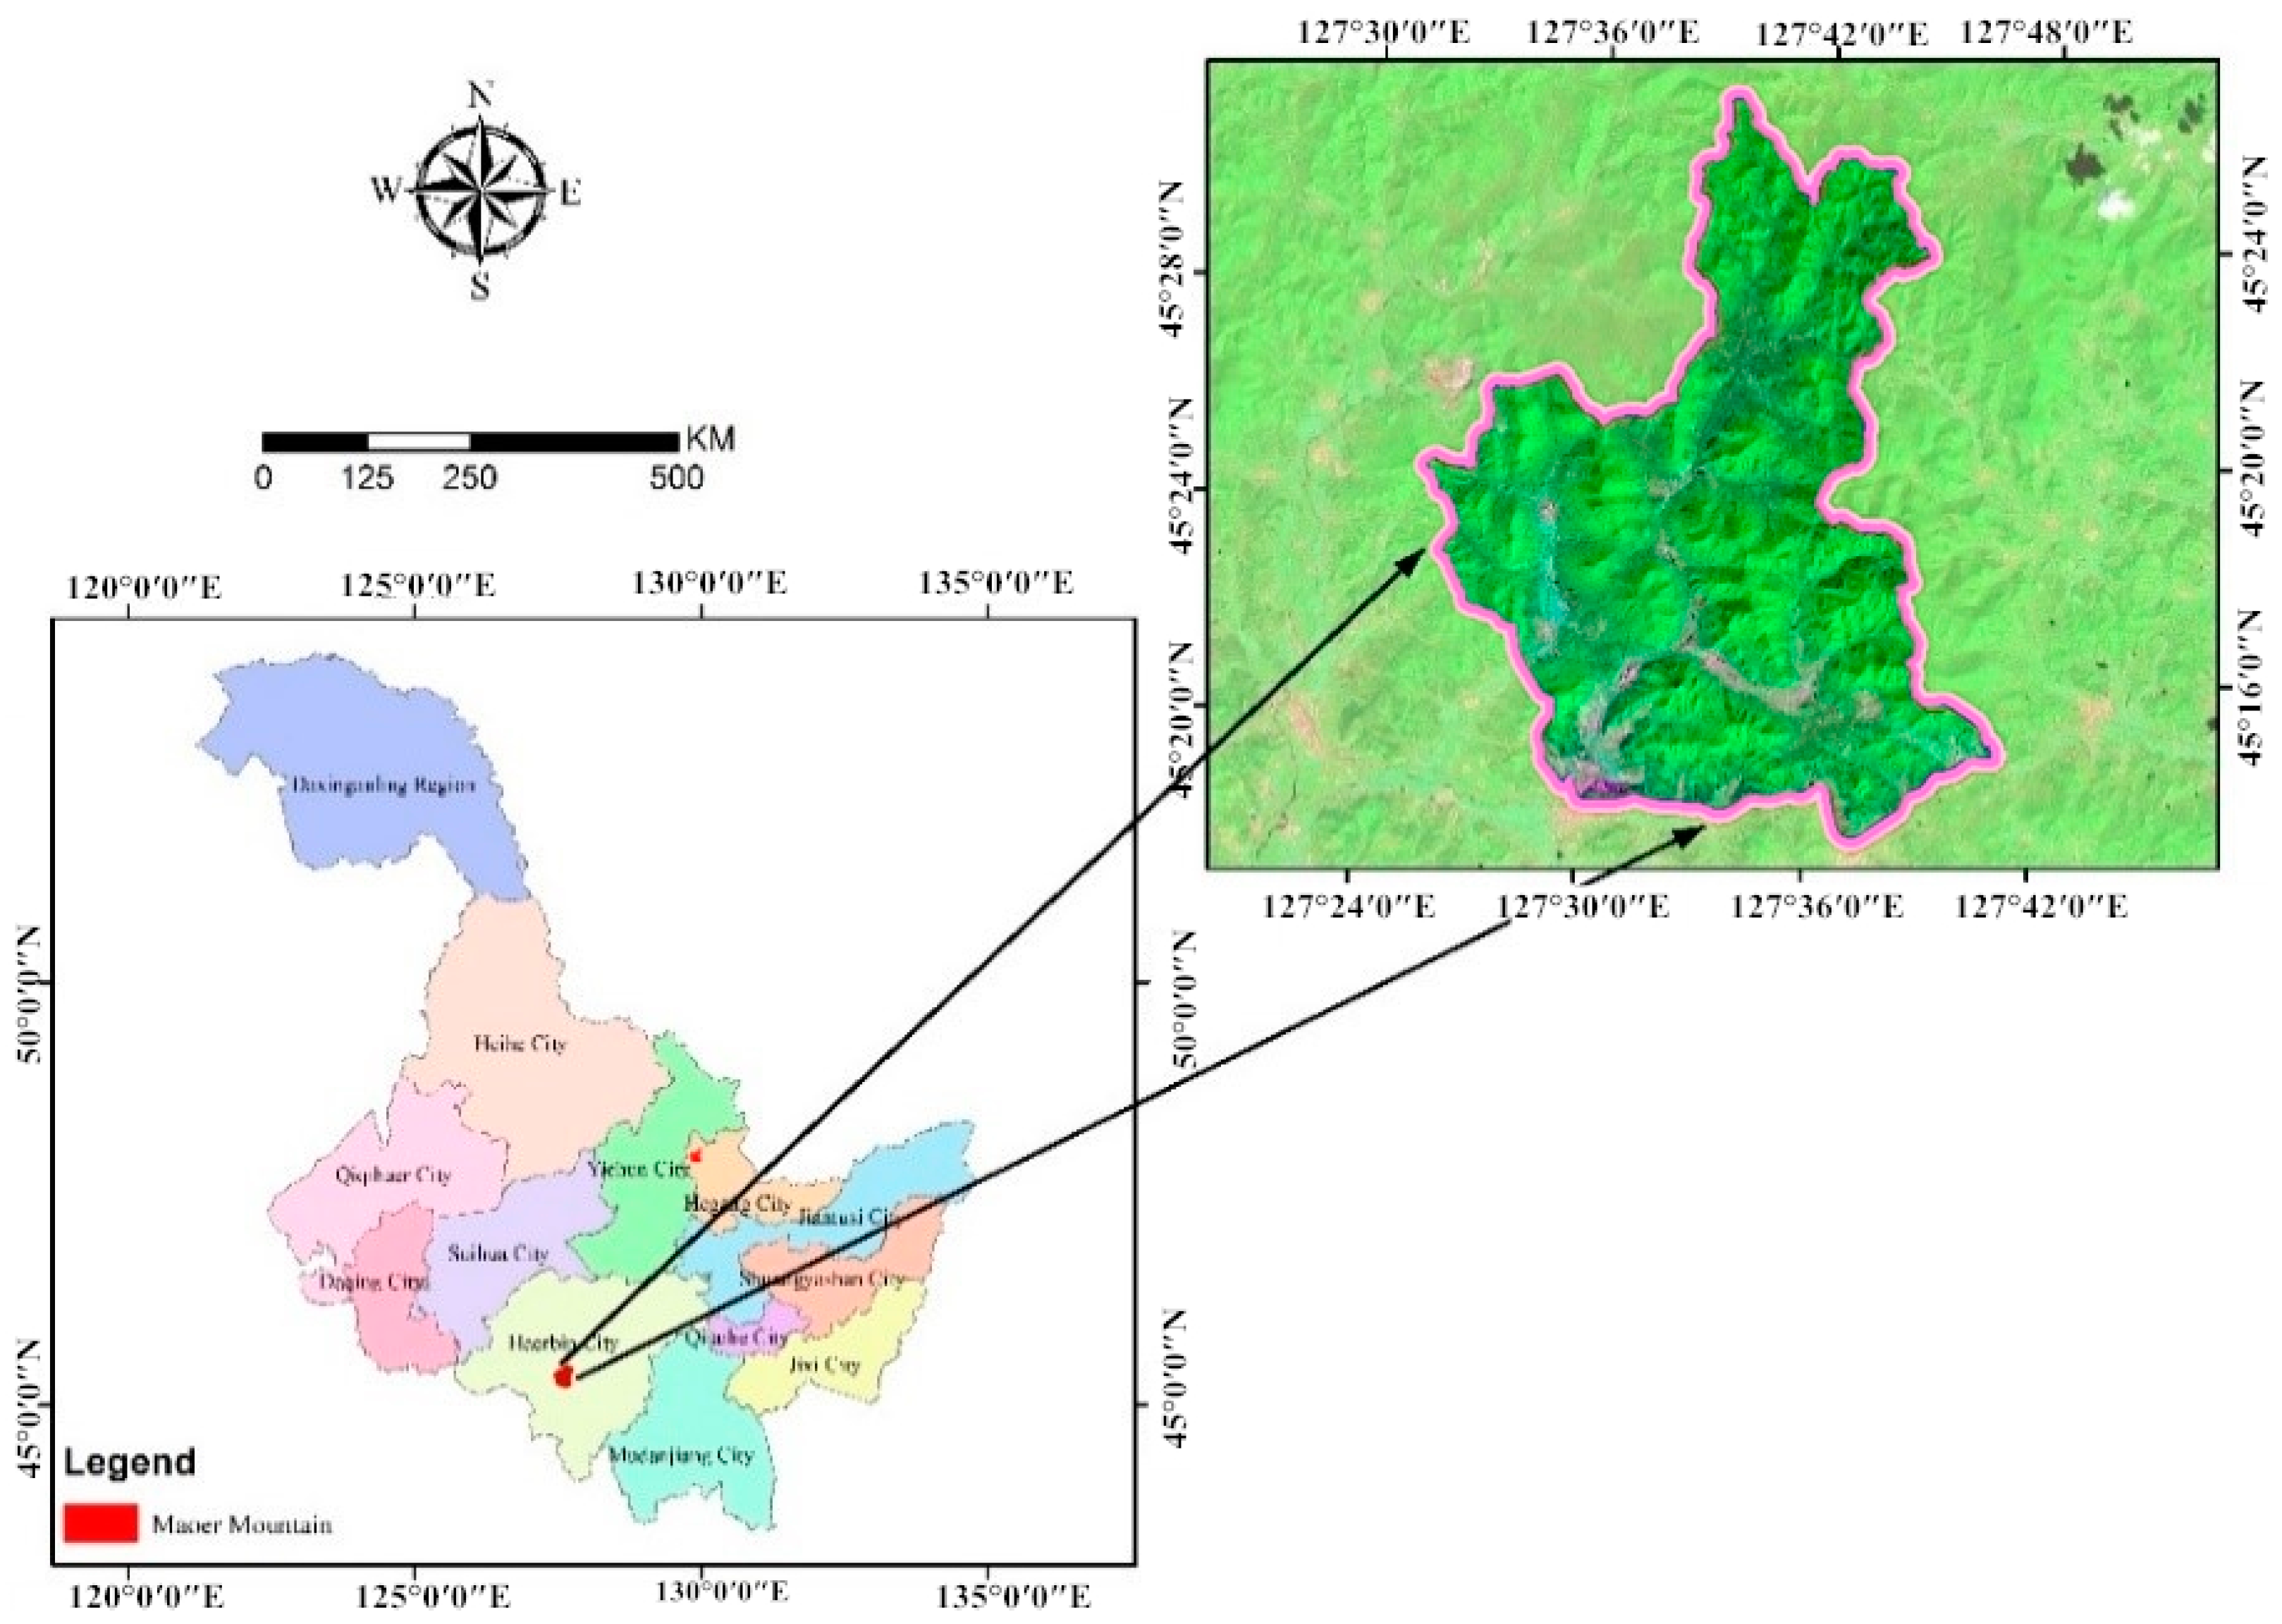
The study area was located at the Maoer Mountain Experimental Forest Farm of the Northeast Forestry University, Shangzhi City, Heilongjiang Province, China (45°24′–45°25′ N, 127°34′–127°40′ E), 30 km from north to south and 26 km from east to west, with an area of approximately 260 km2 (Figure 1). In this area, the forest coverage is 85% and the total forest stock is 20,500 km2, with an elevation of 200–805 m. The climate is a temperate continental monsoon climate. The annual average temperature is 2.8 °C, the lowest temperature in January is –31.9 °C, and the highest temperature in July is 26.1 °C. The annual rainfall is 720 mm and is mainly concentrated in July and August, which accounts for more than half of the total value for the year. The vegetation mainly includes Mongolian oak (Quercus mongolica), Korean pine (Pinus koraiensis), walnut (Juglans mandshurica), ash (Fraxinus mandchurica Rupr.), and poplar (Populus davidiana Dode).
2.2. Field Experiment
Although the slope, aspect, and canopy density influence the dynamics of litter moisture content, taking these factors into consideration when studying the diurnal process of moisture content and establishing prediction models would result in large uncertainties that are unsuitable in practice. Therefore, this study selected only one plot for each type of forest, and plots of 20 × 20 m were set up in both the Mongolian oak forest and Korean pine plantations (see Table 1 for plot conditions). The moisture content of the surface litter was monitored from 18 May 2017 to 24 May 2017 (spring fire prevention period).
In this study, a non-destructive sampling method was adopted to monitor moisture content. To ensure that the structure of the surface litter layer was consistent with the original state and that water exchange could be carried out in a wild state, plastic baskets were selected for holding litter. The length, width, and height of the plastic baskets were 300, 300, and 45 mm, respectively, and the baskets were covered with nylon mesh (1 × 1 mm mesh size) at the bottom and around the plastic basket. Three plastic baskets were arranged for each plot. The samples were weighed once every 1 h for a total of 7 days. After the experiment, the baskets were dried at 105 °C for 24 h, and the dry mass of the litter was recorded. The surface litter bed moisture content was then obtained according to the formula for calculating the moisture content (the ratio of the water to the dry mass of the litter). A total of 24 × 7 = 168 records of data were obtained for each basket and a total of 168 × 3 = 504 sets of data were obtained for each plot. The arithmetic means of the moisture content of the three baskets of each plot were calculated as the moisture content value of the plot.
A HOBO meteorological station, developed by Onset Company (US) that can automatically record weather data in the field and was installed in each plot. The sensors were placed on the ground and the temperature, humidity, wind speed, and rainfall meteorological factors were recorded every 1 h. The recording of meteorological factors occurred earlier than the moisture content monitoring start time, although the recording of meteorological factors was synchronized with the moisture content monitoring when they overlapped.
2.3. Model Description
2.3.1. Direct Estimation Method
Catchpole [26] proposed a direct estimation method to predict litter moisture content. Based on the equilibrium moisture content, the field litter moisture content data and meteorological data were used to directly predict litter moisture content. This method can directly use meteorological data to predict the moisture content, so has a better applicability and higher accuracy than an indoor simulation [42]. For the response equation of the equilibrium moisture content in the direct estimation method, the Nelson model [27] was selected based on semiphysical conditions, and the Simard model [43] was chosen based on statistics to achieve better prediction results [44]. Therefore, when the direct estimation method was selected to establish the prediction model, the Nelson and Simard equilibrium moisture content prediction models were used to calculate the equilibrium moisture content. Hereinafter, they are simply referred to as the Nelson method and the Simard method.
The main equation of the direct estimation method was based on the differential equation of litter moisture content proposed by Byram [42]. The form of the equation is shown in Equation (1):
where indicates the litter moisture content (%), is the equilibrium moisture content (%), and represents the time lag (h); the same applies to the equations below.
The equilibrium moisture content prediction model in Equation (1) was calculated by the Nelson and Simard models, respectively. The forms of the Nelson model [27] and the Simard model [43] for the equilibrium moisture content are shown in Equations (2) and (3):
where is the universal gas constant (8.314 J·K−1·mol−1); and indicate the air temperature (K) and relative humidity (%), respectively; indicates the molecular mass of water (18.0153 g·mol−1); and and are empirical parameters.
where indicates the air temperature (°C) and indicates the relative humidity (%).
When the direct estimation method is used to predict the moisture content of litter, the time lag of the litter must be fixed [45]. Because the monitoring step of litter moisture content was 1 h, was equal to 1 h. Discretization of the differential Equation (1) for moisture calculation yielded a discrete equation for the moisture content calculation (Equation (4)).
where indicates the moisture content of the litter at time ; is the moisture content of the litter at time ; and and are the equilibrium moisture contents at time and , respectively.
The Nelson and Simard methods were separately selected for moisture content prediction. The ordinary least squares method was used to obtain the parameters.
2.3.2. Meteorological Factor Regression Method
With the litter moisture content as the dependent variable, the meteorological factors with significant influence were used as the independent variables in the stepwise regression method. The equation employed for this has the form of a multivariate linear equation, as shown in Equation (5).
where is the litter moisture content; indicates the weather variable, such as the current or n-hour earlier (n < 10 h) temperature, humidity, wind speed, or rainfall; and is the estimated parameter.
2.4. Data Analysis
When the litter moisture content is higher than 35%, it is difficult for it to ignite and cause forest fires [46]. Therefore, all the data in this paper were analyzed for a moisture content of less than 35%. For the oak litter, a total of 133 data records were collected from 18 May 2017 at 9:40 to 23 May 2017 at 21:40, and for the pine litter, a total of 125 data records were collected from 18 May 2017 at 17:40 to 23 May 2017 at 21:40.
2.4.1. Basic Statistics
Statistical analysis was performed on the surface litter moisture content data to calculate the minimum, maximum, and average changes in the monitoring interval of litter moisture contents in the oak and pine plots. Using the sampling sequence as the abscissa and the moisture contents of the litter bed as the coordinates, the daily variation in the moisture contents of the two types of litter bed was plotted.
2.4.2. Correlation Analysis
Changes in litter moisture content are driven by meteorological factors, and the moisture content responds differently to different meteorological factors. Therefore, it was necessary to analyze the correlation between the litter moisture content and meteorological factors. This study specified that the meteorological factor before n (≤10) hours was represented by the angle n, that is, indicates the air temperature 5 h before. Pearson correlation analysis was carried out, and the correlation coefficient was plotted as a function of time.
2.4.3. Model
In this study, the methods of direct estimation and meteorological factor regression were used to establish the prediction model of diurnal variation in litter moisture content (see Section 2.3 for the methods). N-fold cross-validation was selected to test the accuracy of the model, and the mean absolute error (MAE) and mean relative error (MRE) of the prediction model were then calculated. The calculation formulas are shown in Equations (6) and (7), and error bars were drawn to compare the errors of the prediction model.
where indicates the observed moisture content (%) and indicates the predicted moisture content (%).
The forecasting performances of the three models at different time periods of the day were compared by drawing polyline maps. A 1:1 scatter plot of the three methods was drawn by taking the measured values as the abscissa and the predicted values as the vertical coordinates. The prediction effects of the three prediction models were then compared according to different sections of litter bed moisture contents.
3. Results
3.1. Diurnal Variation in the Litter Moisture Content
Table 2 shows the changes in the litter moisture contents for the two forest types. The minimum, maximum, and mean of the litter moisture content for oak were 17.91%, 32.37%, and 22.02%, respectively. The range of moisture content of the pine plantation was greater than that of the oak forest, with an average of 15.35%. The change in the litter moisture contents was calculated at 1 h steps. The minimum change in the litter moisture content of the oak and pine was 0. The maximum change for oak was 11.49%, and the mean was 1.06%. Additionally, the maximum change for pine was only 2.94%, and the average change value was 0.58%.
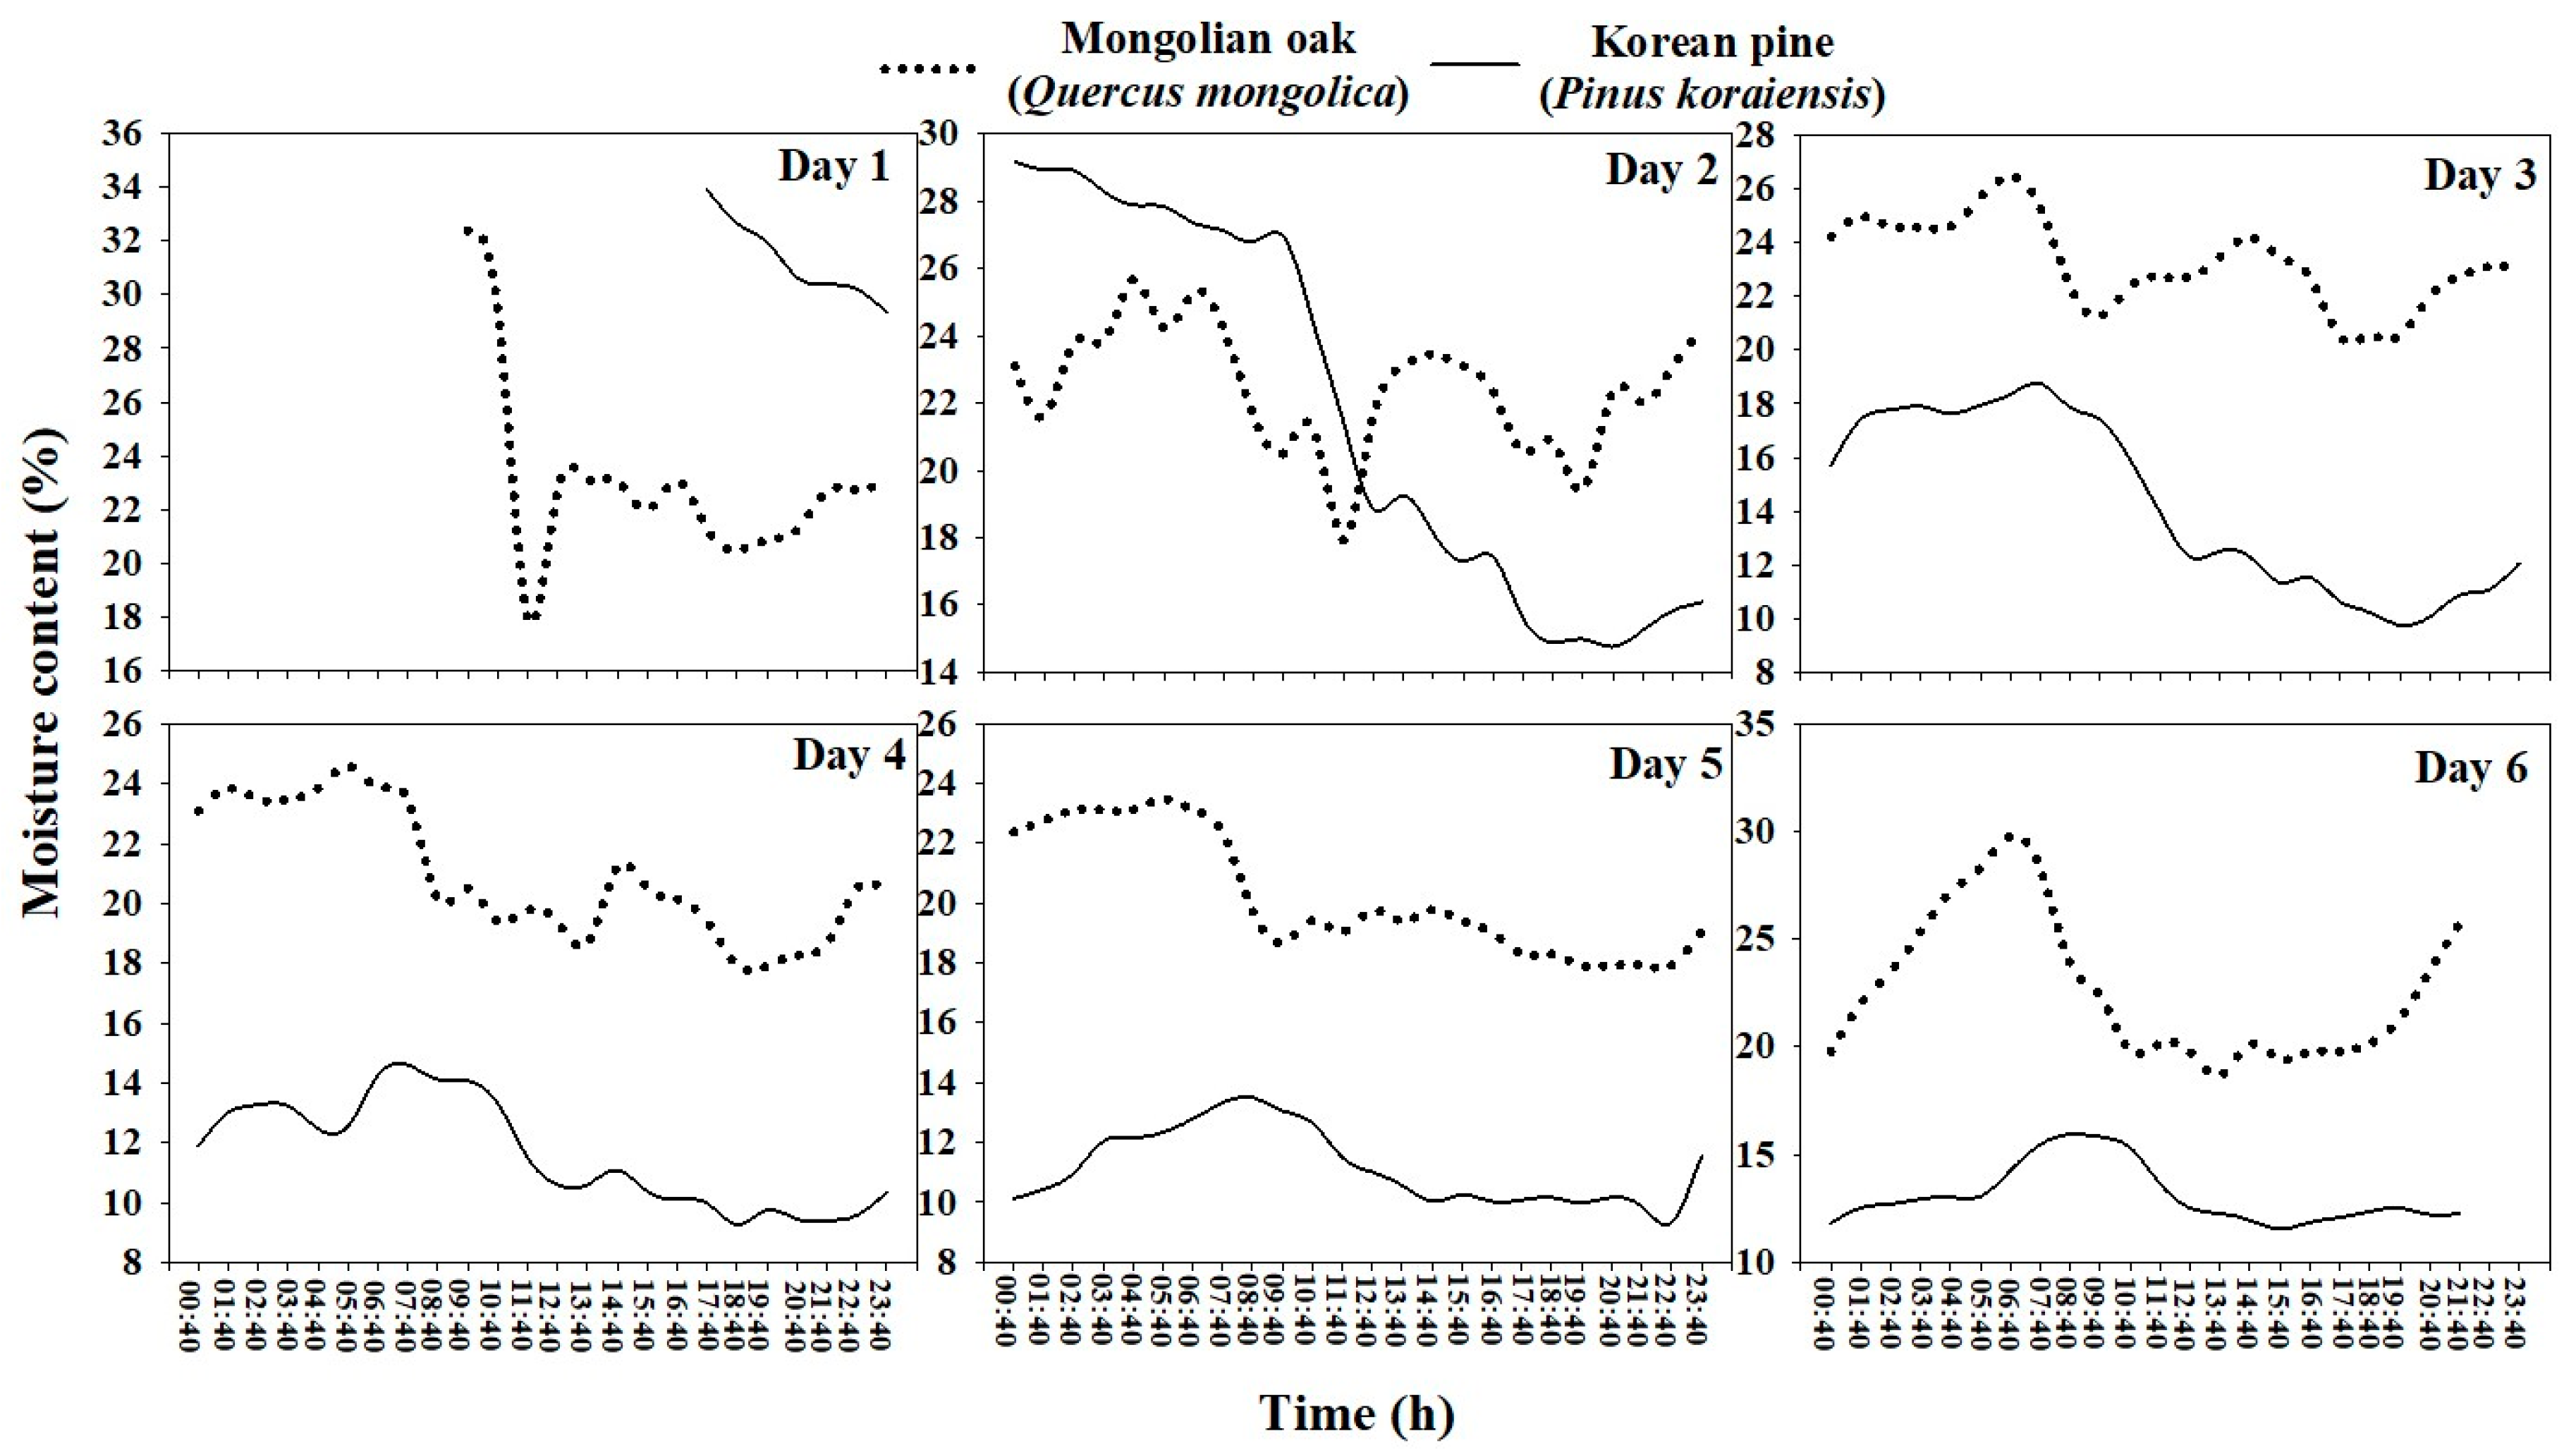
The litter moisture contents exhibited obvious diurnal variations. Because there was rainfall (8 mm in total) before the beginning of the monitoring period, the litter moisture contents of the two forests began to decline on the first day. The litter moisture content of the oak showed obvious changes from the second to sixth days, and the pine planation showed a similar trend from the third to the sixth day; that is, the litter moisture content increased from early morning to a peak at approximately 8:40 AM, and then began to decline. The litter moisture content was lowest from 13:40 to 15:40, and then began to increase again. In this process, due to the effect of wind speed, the changes in litter moisture content in different time periods of the day displayed some fluctuations, but the overall trend was similar (Figure 2).
3.2. Correlation Analysis
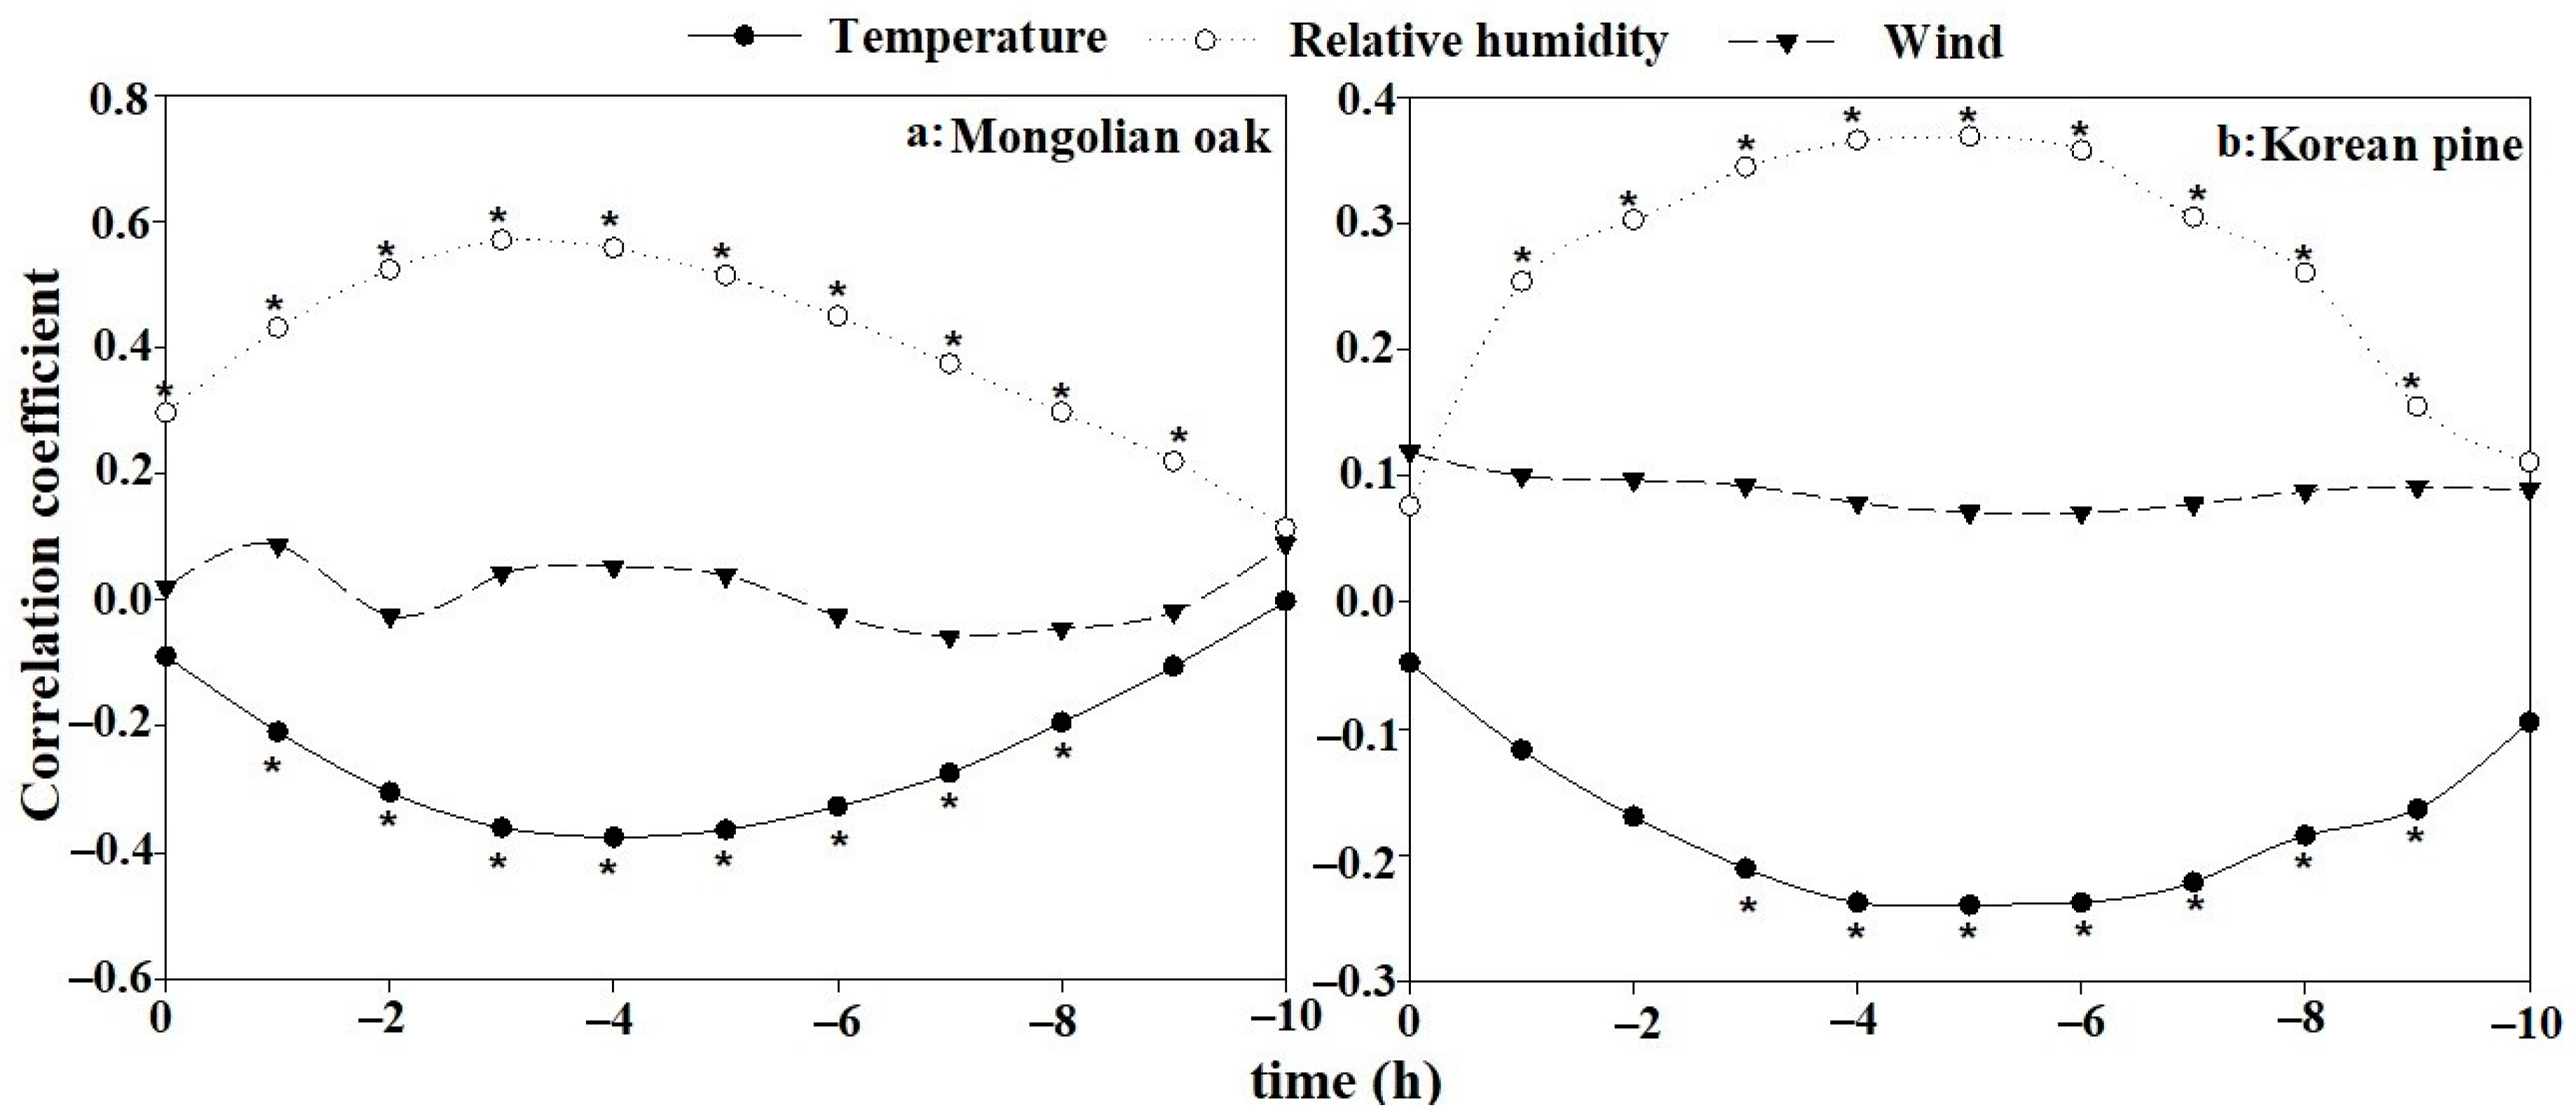
The change in the moisture content of the oak litter as a response to meteorological factors was stronger than that of the pine. The litter moisture content was negatively correlated with the air temperature and positively correlated with the relative humidity. The correlation coefficient first increased and then decreased with lagging time. For the oak, the temperature and humidity 3 h before had the most significant effect on the litter moisture content. For the pine, the temperature and humidity 5 h before had the most significant effect on the litter moisture content (Figure 3). Wind speed had no significant effect on the change in litter moisture content.
3.3. Model
3.3.1. Model Parameters
Table 3 shows the estimated parameters and errors of the litter moisture content prediction model. The time lags of oak obtained by the Nelson and Simard methods were 2.0261 and 16.0968 h, respectively, and those of the pine litter were 12.2335 and 18.4463 h, respectively, indicating that the time lag of oak was shorter than that of pine. For the same litter type, the Simard method obtained a higher time lag than the Nelson method. In the meteorological factor regression method, the relative humidity 3 h before and the air temperature 4 h before were selected as the meteorological factors for oak litter, and the relative humidity values at 3, 4, and 5 h before were selected as the meteorological factors for pine litter moisture content.
3.3.2. Model Error Comparison
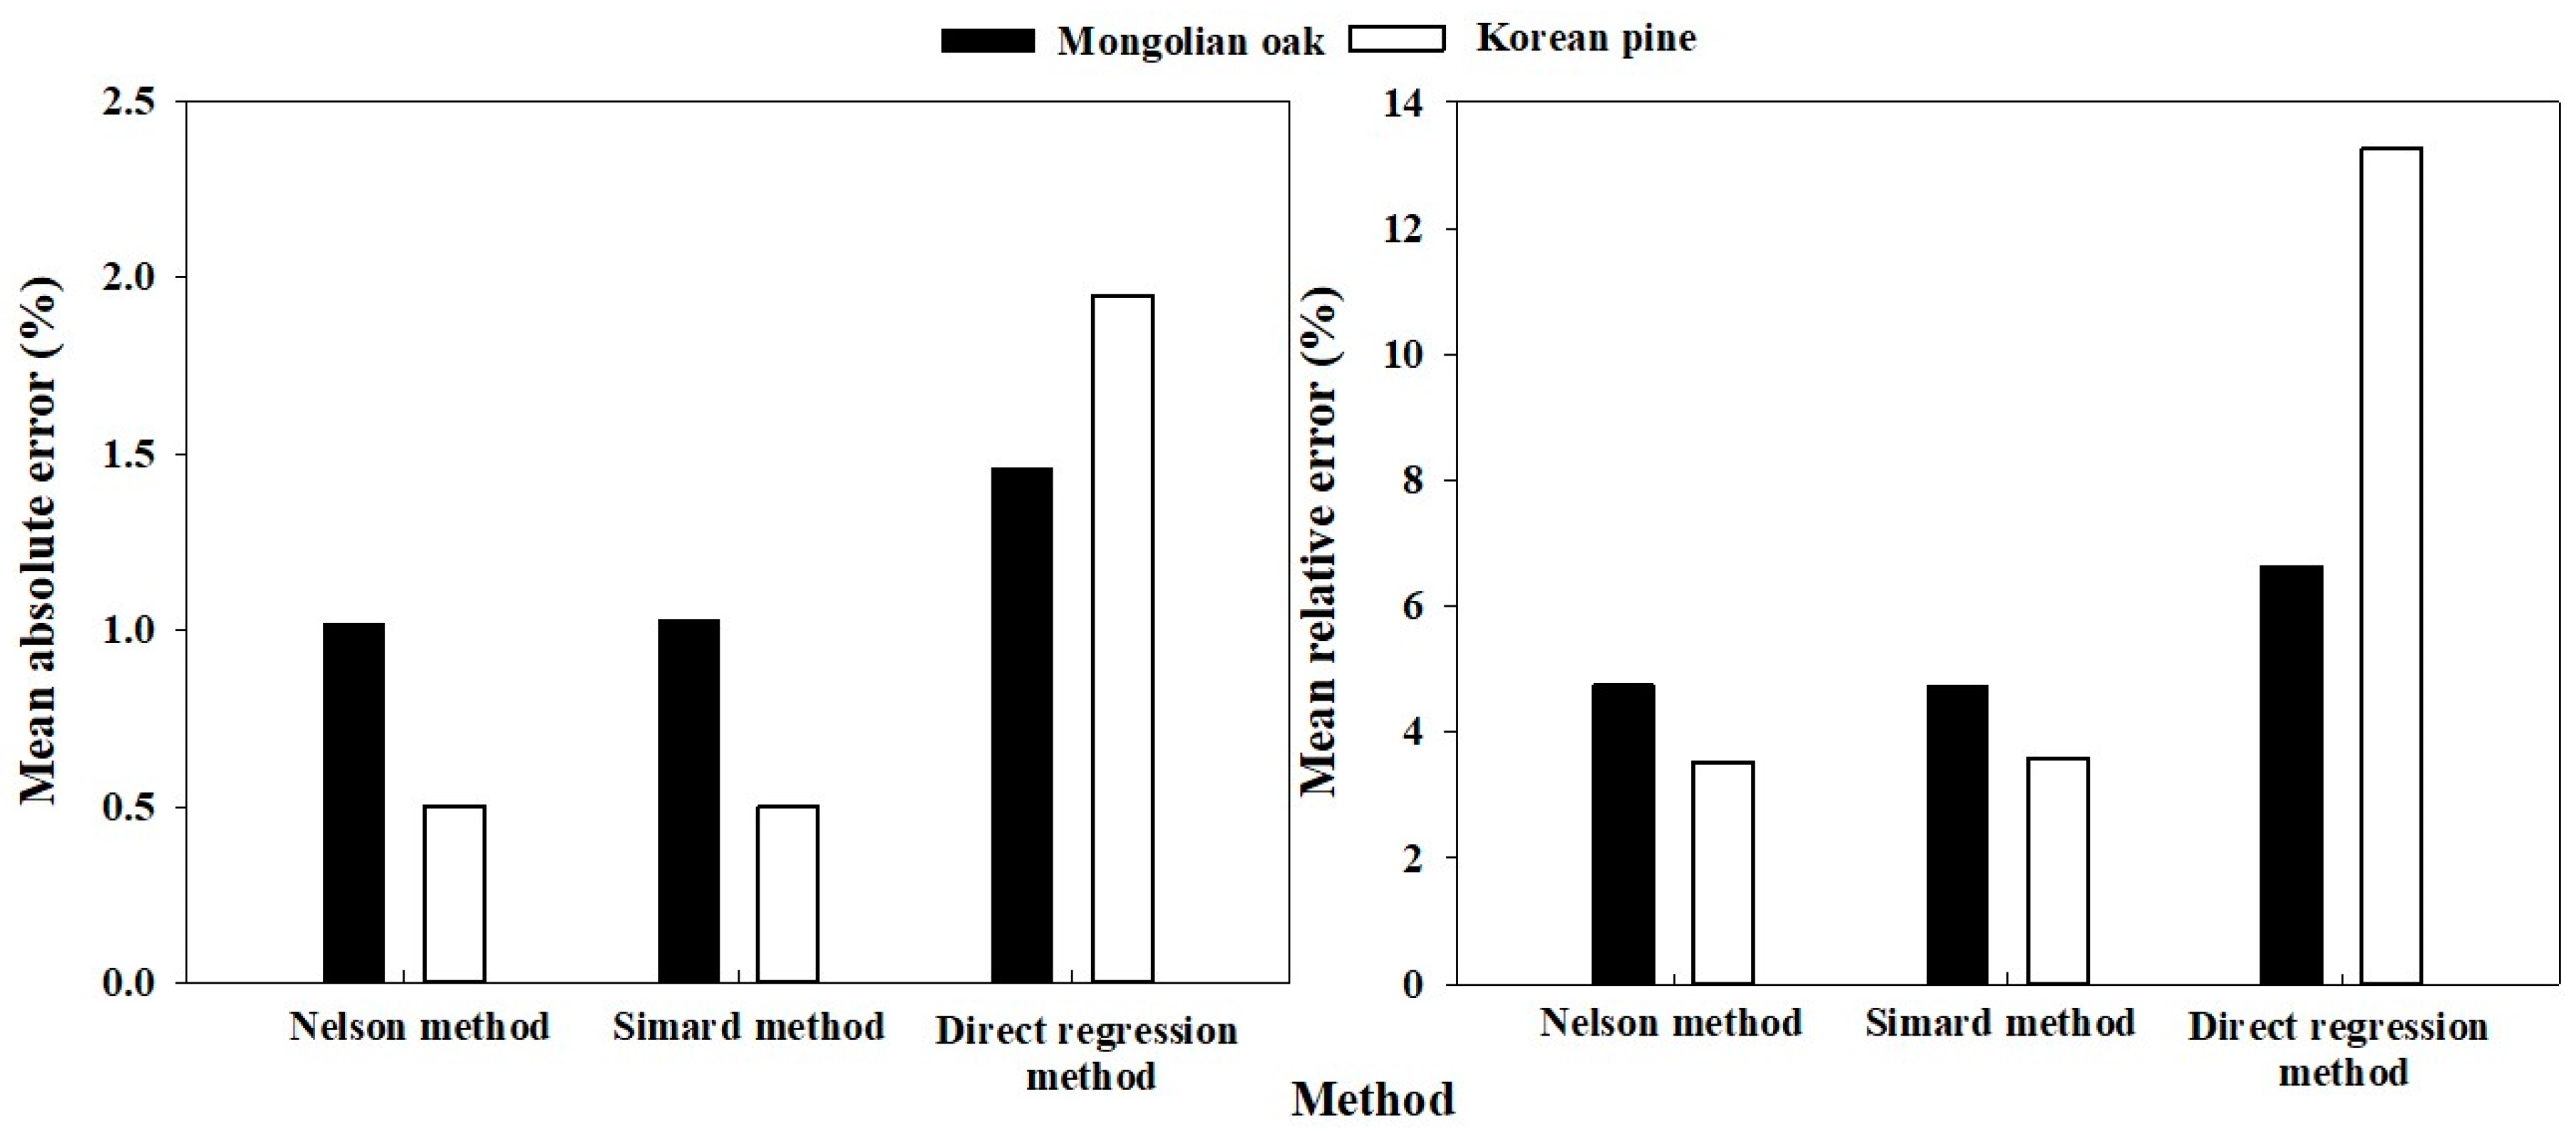
For Mongolian oak, the MAEs based on the Nelson, Simard, and meteorological factor regression methods were 1.02%, 1.03%, and 1.46%, respectively, with corresponding MREs of 4.76%, 4.73%, and 6.65%. The MAEs of the three prediction models for the diurnal variation in litter moisture content of the pine litters were 0.50%, 0.50%, and 1.95%, respectively, and the corresponding MREs were 3.53%, 3.59%, and 13.26%. For the direct estimation method, the prediction performance of the litter moisture content model was better for pine than for oak, while the opposite performance trend was observed in the case of the meteorological factor regression method for the two forest types. The direct estimation method was better than the regression method for both forest types (Figure 4).
3.3.3. Comparison of Measured and Predicted Values of Diurnal Variation
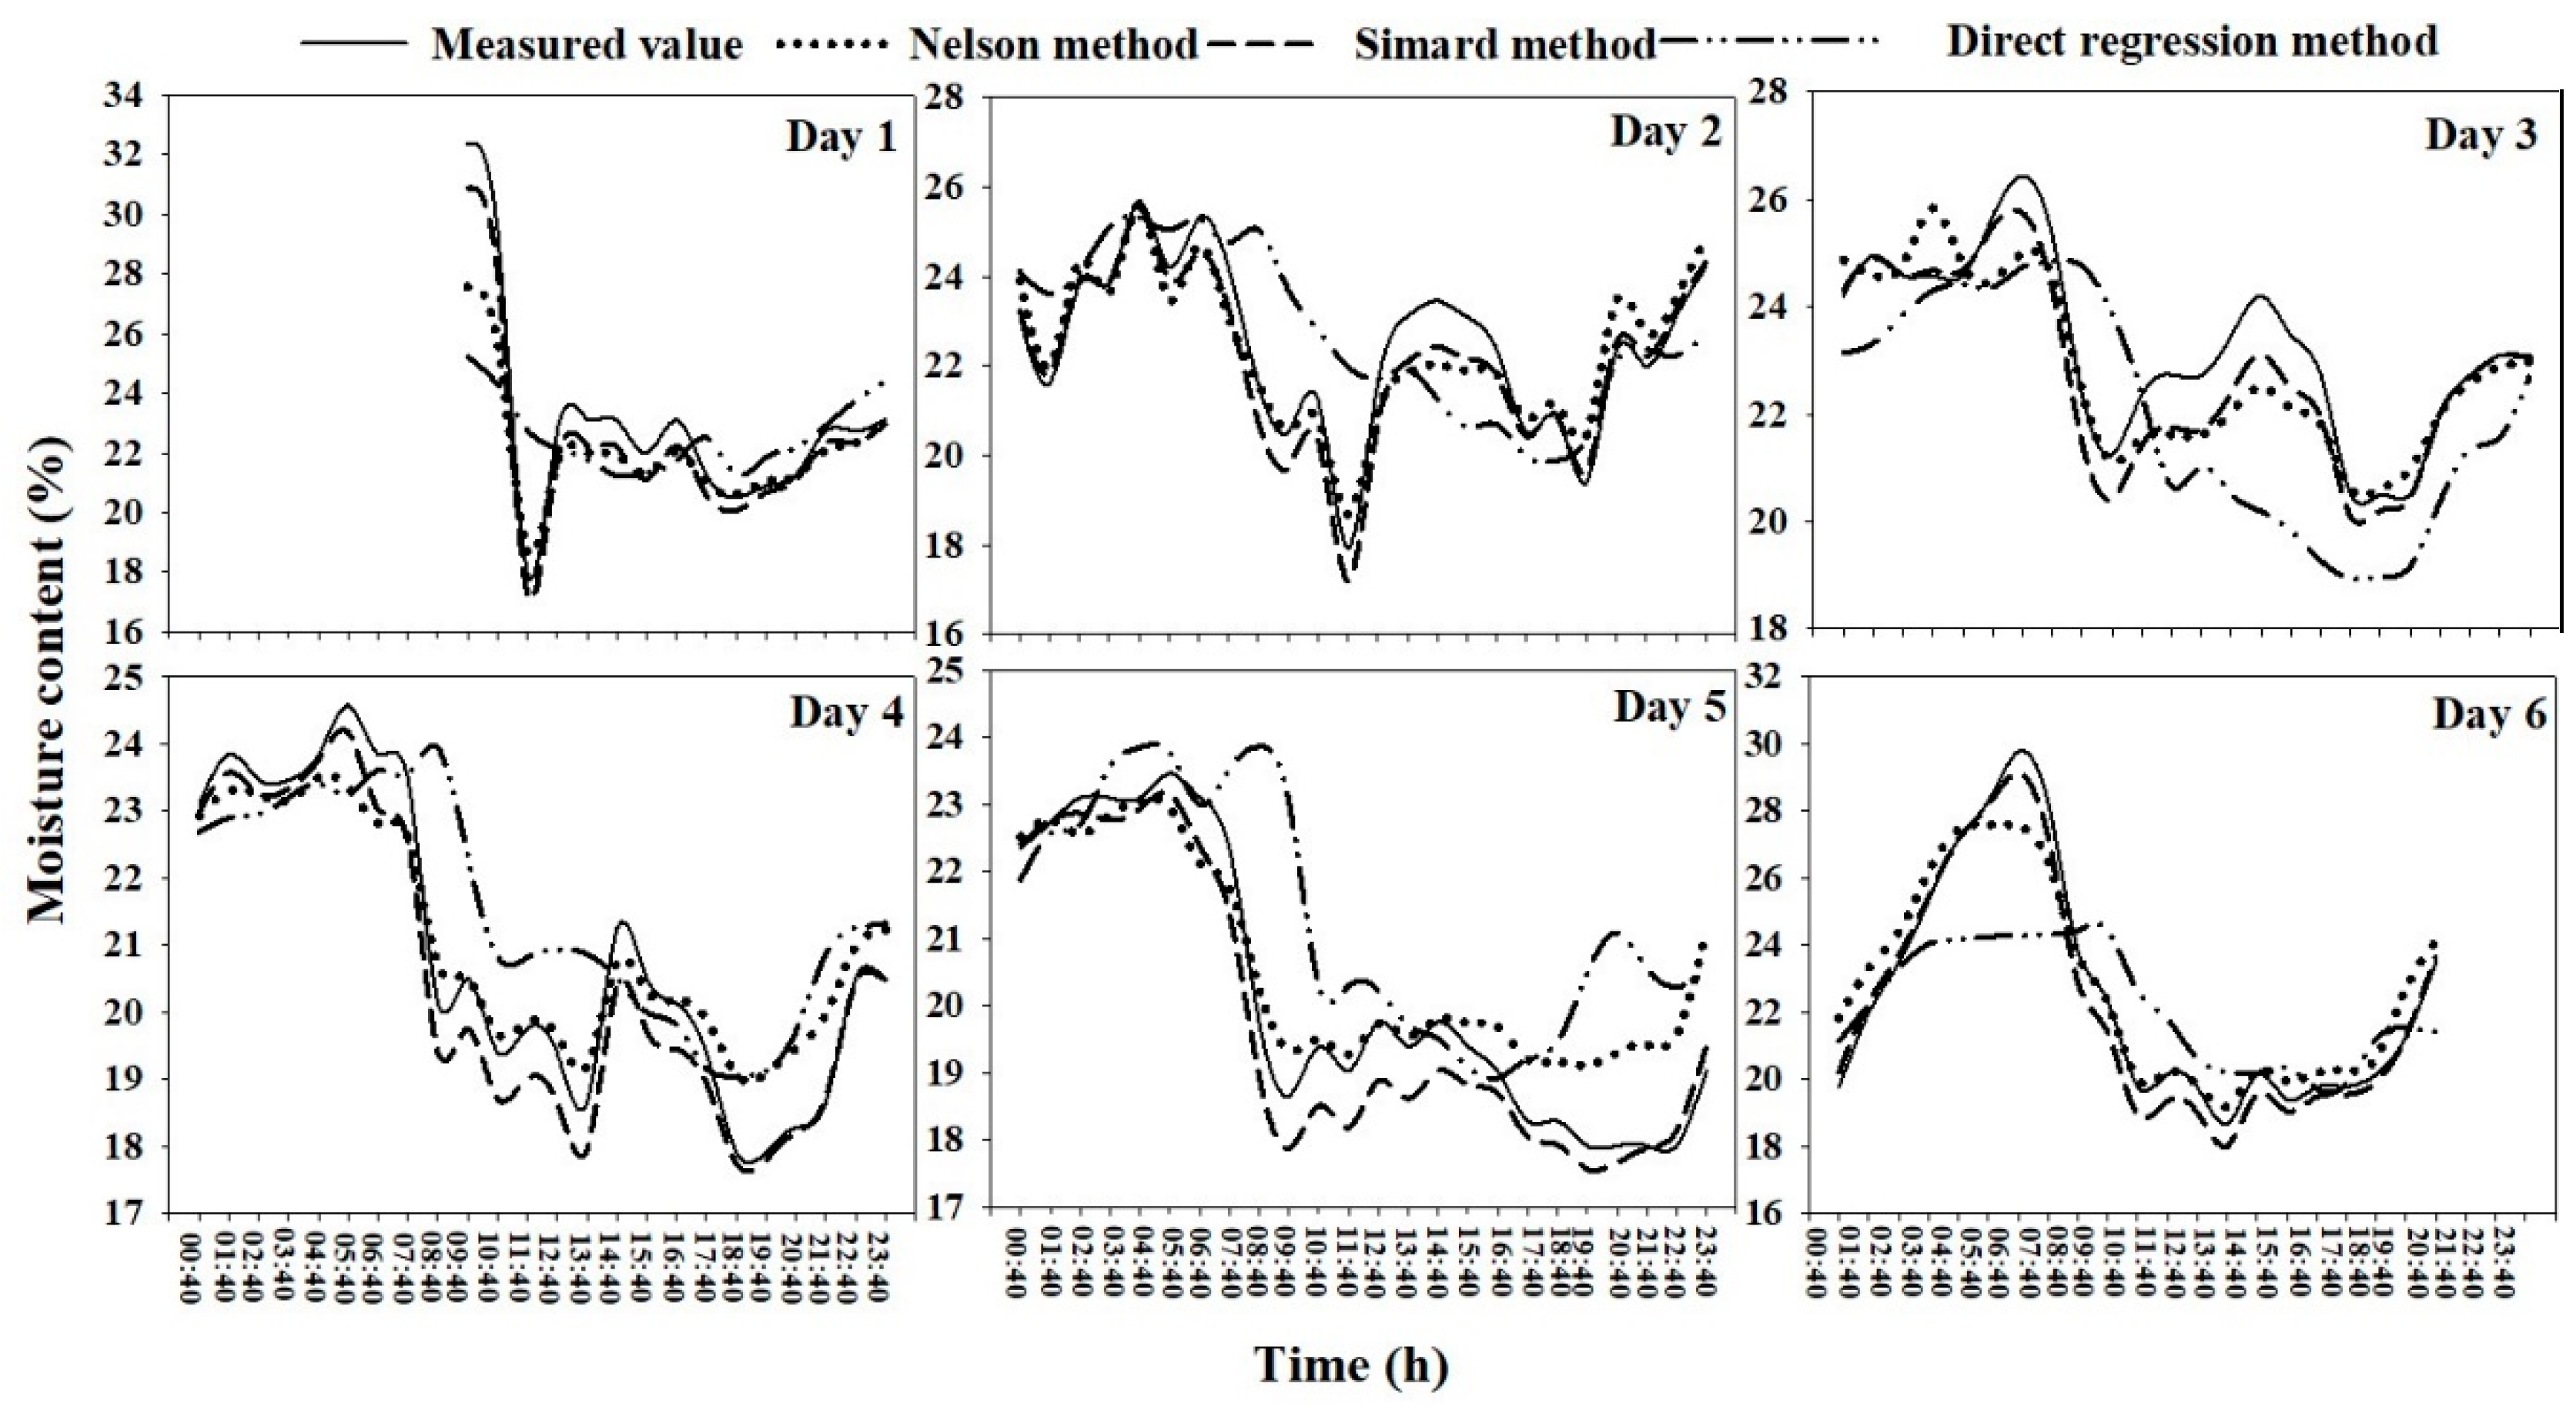
For the prediction model of diurnal variation in litter moisture content of oak, the Nelson and Simard methods produced similar predictions, but the prediction effect of the two methods depended on the daily stage, and the meteorological factor regression method had the worst prediction performance. When the peak litter moisture content (maximum and minimum) of the oak began to change, the Nelson and Simard methods had the largest error, although the Simard method was slightly better and its error was lower than that of the Nelson method. The predicted value of the meteorological factor regression method always had a certain lag for the measurements (Figure 5).
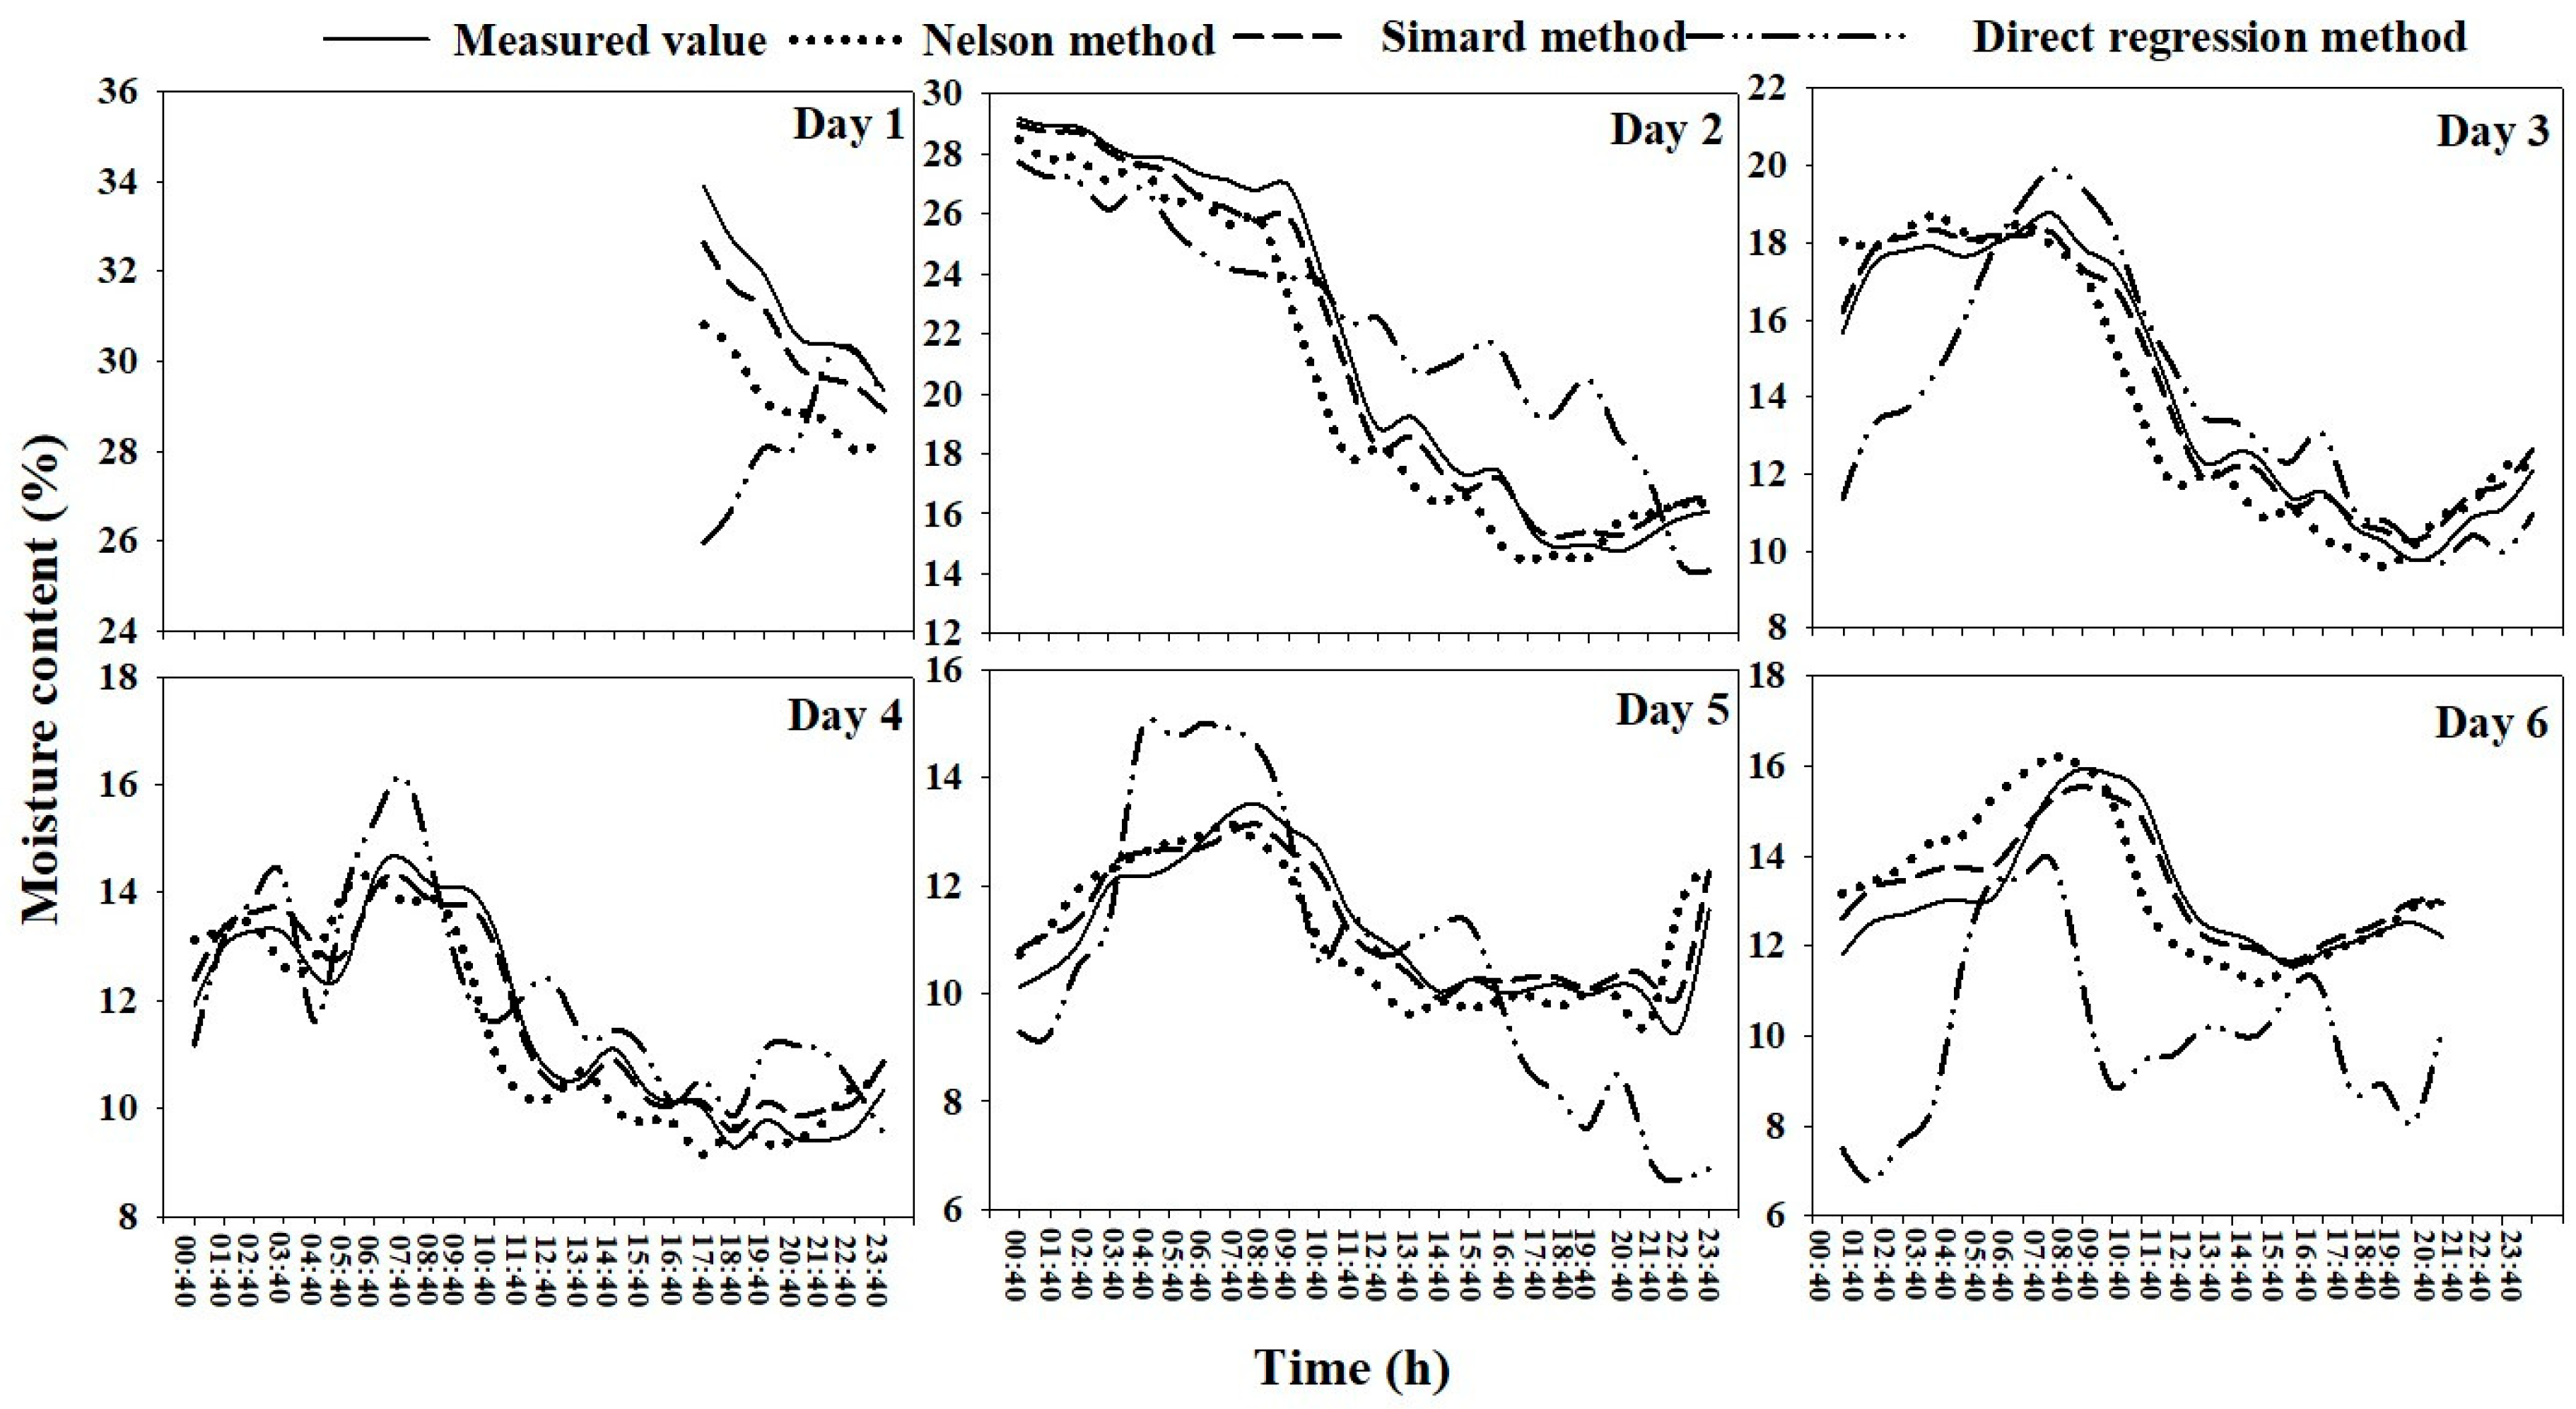
The performance of the prediction of litter moisture content model for pine was similar to that for oak. The meteorological factor regression method had the worst prediction effect but also showed a certain lag. The predicted results of the Nelson and Simard methods were also similar to each other, but the errors between the predicted values and the measured values at different stages of the day showed a certain regularity; that is, from approximately 9:40 to 17:40, the measured values were slightly higher than the predicted values, while in the remaining stages of the day, the measured values were lower than the predicted values. The error of the direct estimation method mainly occurred when the litter moisture content reached its peak value, and the model performance was good for all other times (Figure 6).
3.3.4. 1:1 Comparison of Measured and Predicted Values
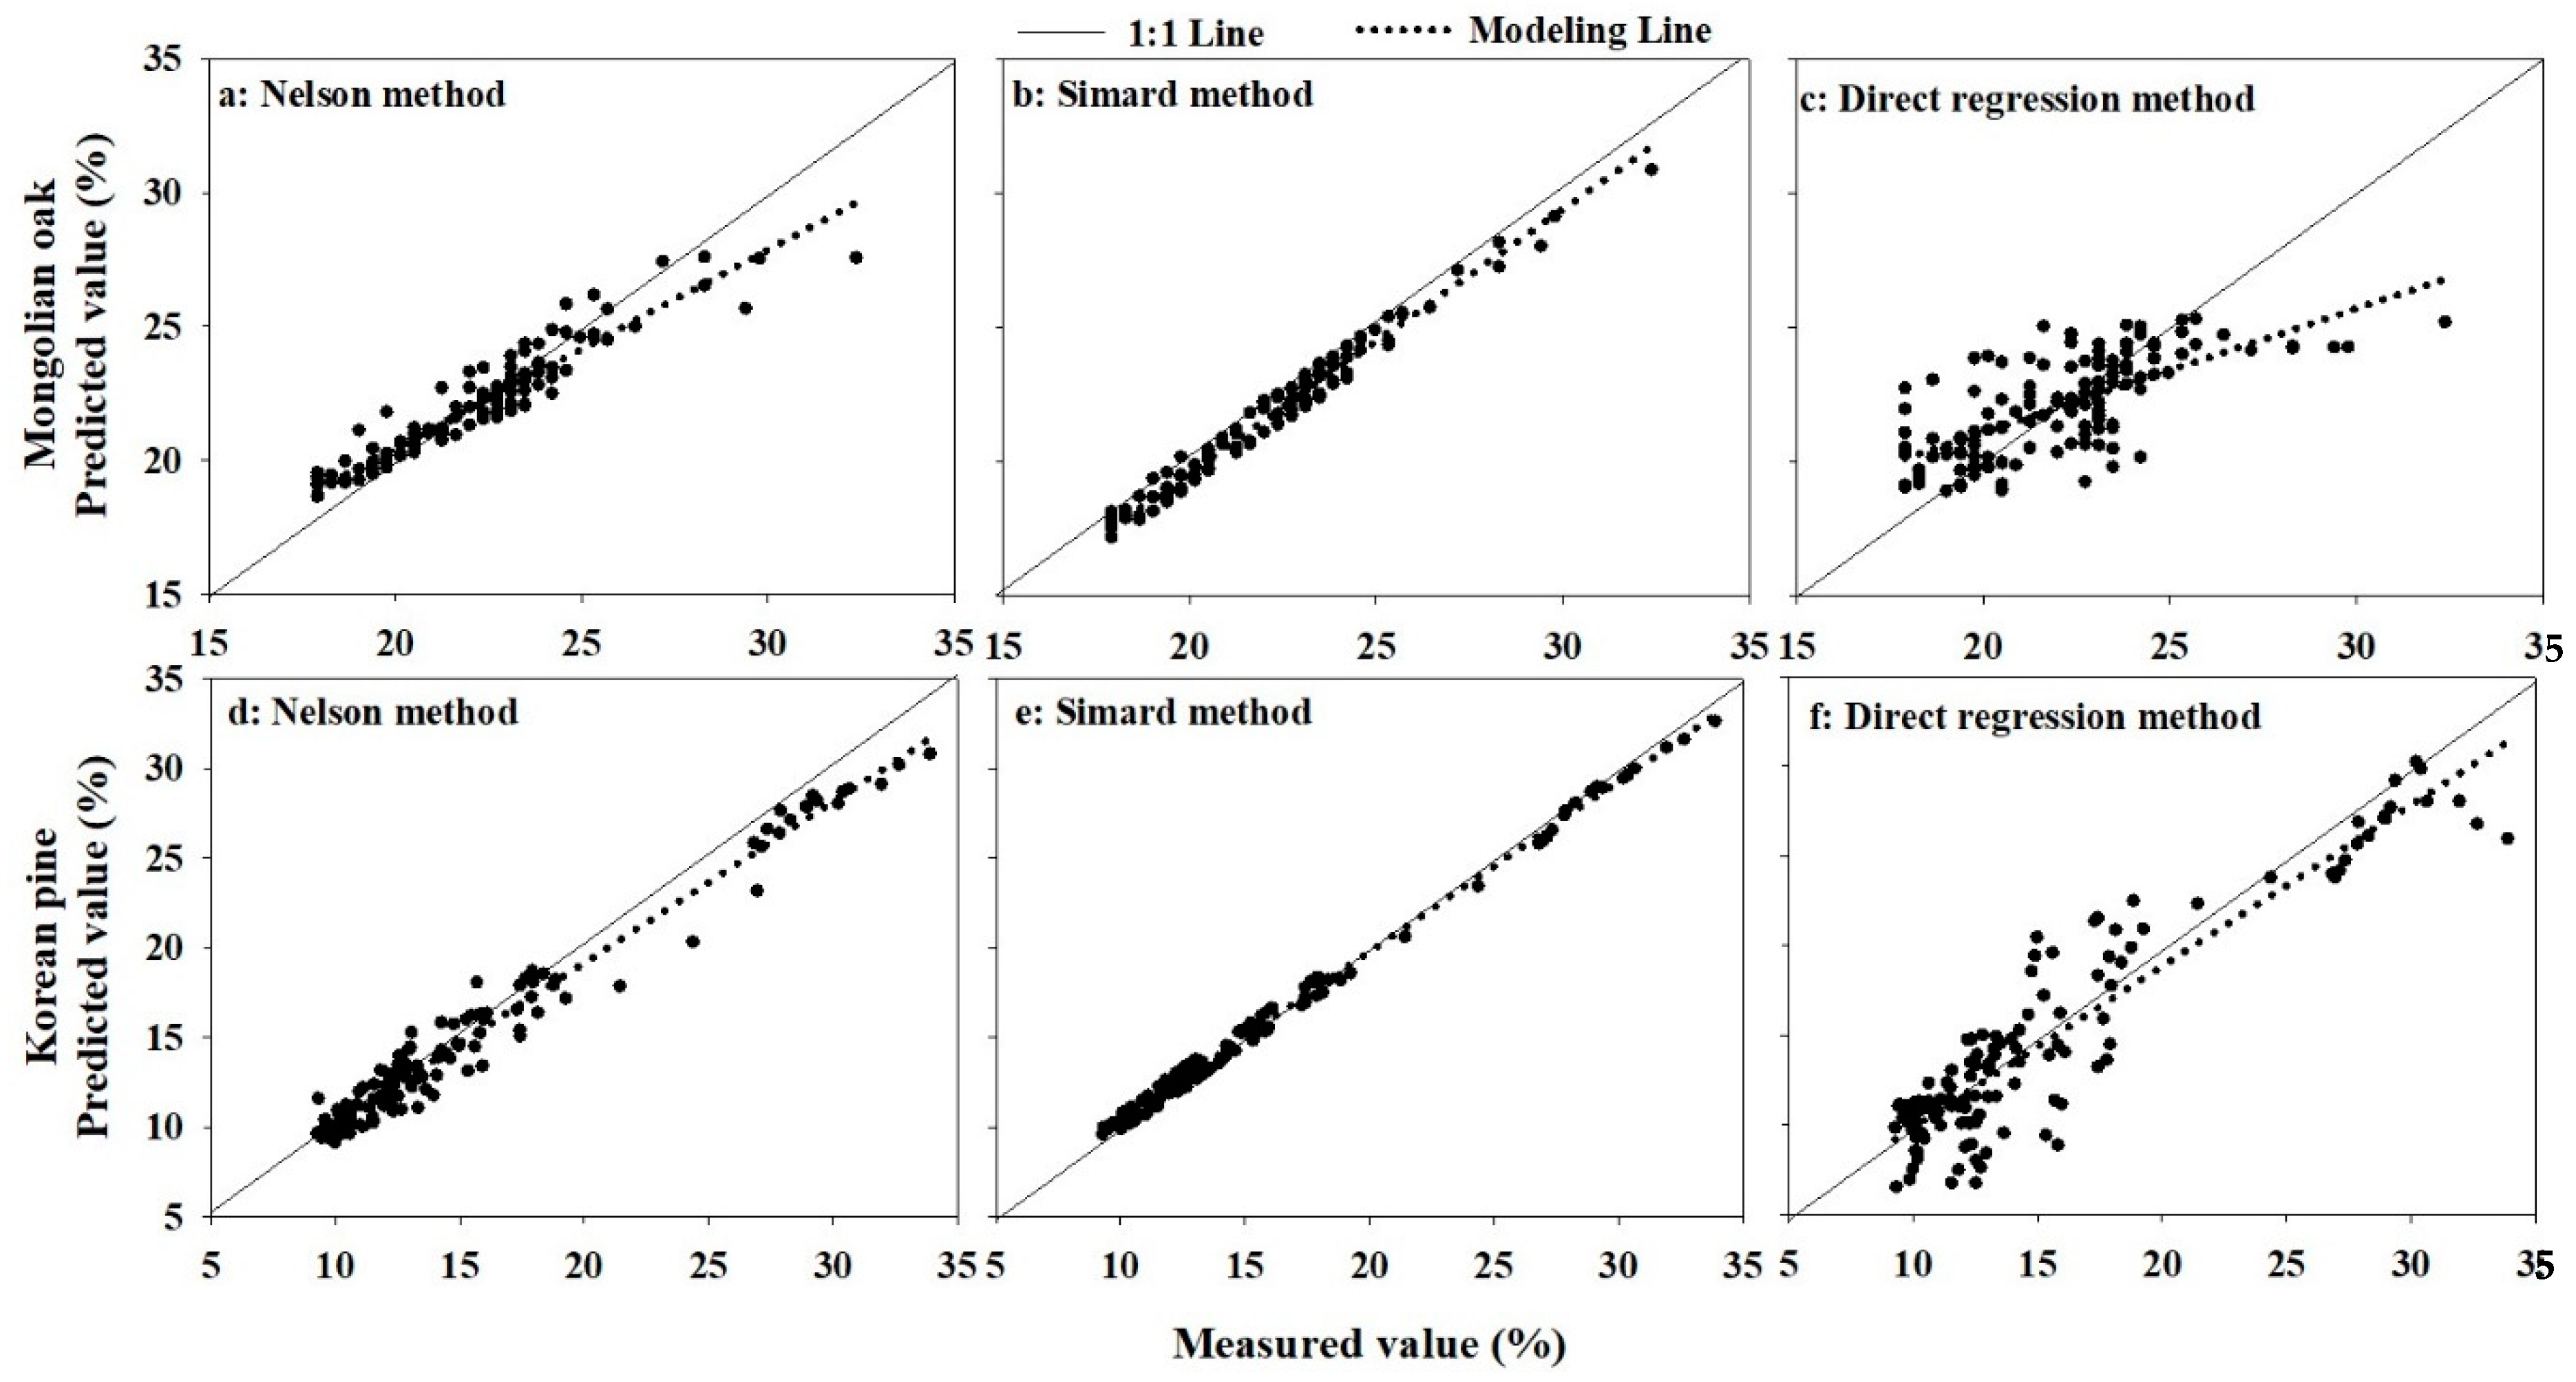
As seen in Figure 7, variation in the litter moisture content range resulted in differences between the predicted and measured values for the different methods. For the litter moisture content of oak, the Simard method value was closer to the measured value and could be evenly distributed on both sides of the 1:1 line, particularly when the moisture content was low. When the moisture content increased, the Simard method slightly underestimated the litter moisture content. When the litter moisture content was low, the Nelson method values were almost uniformly distributed near the 1:1 line. When the moisture content exceeded 30%, the litter moisture content was substantially underestimated. By contrast, the predicted and measured values of the meteorological factor regression method were irregularly distributed near the 1:1 line, and the model overestimated when the litter moisture content was lower, but underestimated when the litter moisture content was higher than 25%. The model performance for pine was similar to that for oak. With different moisture content intervals, the Simard method had the best prediction effect, followed by the Nelson method, and the meteorological factor regression method had the worst prediction effect. Regardless of the method, the prediction model performance for pine with a low moisture content was better than that with a high moisture content.
4. Discussion
4.1. Correlation Analysis
The diurnal variation in the litter moisture contents of oak and pine was significantly correlated with the air temperature and relative humidity, and was not related to the wind speed. As the collection time of the meteorological factor progressed, its influence on litter moisture content first increased and then decreased, indicating that the litter moisture content had a specific lag associated with the meteorological factor, which is in line with the results of numerous studies [26,47,48,49]. The wind speed had no significant effect on the diurnal variation of litter moisture contents, which is different to the research results published by Zhang et al. [50]. This difference may have been because the influence of wind speed on the moisture content of the litter needed to be analyzed over a longer time interval.
4.2. Model Parameters
The litter moisture contents of oak and pine were established using the Nelson method with an hourly step prediction model, and the values were 0.2458 and 0.0039, respectively. Catchpole et al. [26] found that the value ranged from 0.26 to 0.37, whilst Slijepcevic et al. [51] found that the value ranged from 0.28 to 0.41. Additionally, Sun et al. [24] obtained an value of 0.087 to 0.594 for Dahurian larch forests. These different research results may be related to the litter type, test conditions, and setting time period. In the Nelson method, reflects the degree of response of the equilibrium moisture content to the air temperature and relative humidity. The larger the absolute value of , the more sensitive the response of the litter moisture content to temperature and humidity [27]. The absolute value of of the oak (0.0261) was higher than that of the pine (0.0023), indicating that the water holding capacity of the broad-leaf layer was lower than that of the needle layer, and that the change in moisture content was more sensitive to temperature and humidity for the former. The packing ratio and physical properties of the litter layer have a significant impact on the dynamic change of litter moisture content [52]. Consequently, the differences in the estimated and water holding capacity between the two forest types may have been caused by differences in the structure and physical properties of the litter layer.
4.3. Time Lag
The observed time lags for the oak and pine litter beds were 2.0261 and 12.2335 h, respectively, as calculated using the Nelson method. Sun et al. [24] studied Dahurain larch litter and obtained a time lag from 2.375 to 4.180 h. Yu et al. [53,54] obtained a time lag from 1 to 8 h for a broad-leaved bed, and that of the needle bed they studied was between 1 and 4 h. Furthermore, Lu [55] used the Nelson method to obtain time lags of broad-leaved and needle beds of 29.1 and 15.6 h, respectively. The results of this study were different to those of previous investigations. In addition to the differences in litter structure and morphology, there were also differences associated with the research monitoring time intervals. In this paper, the moisture content was monitored continuously for 7 days at 1 h steps. Sun et al. [24] only monitored the moisture content data from 8:00 to 16:00, i.e., during the daytime, but the water vapor exchange at night is different from that in the daytime. Therefore, the time lag may be different between studies. The time lag of the broad-leaved Mongolian oak was shorter than that of the pine needle, which may also have been related to the packing ratio of the litter layer. The average packing ratios of the litter layer of the oak and pine stands were 0.0138 and 0.0236, respectively, which suggests that the water vapor exchange between litter and air was faster, and the response to meteorological factors was stronger for oak litter. Therefore, the time lag of oak litter layer was shorter than that of pine litter layer.
The time lags of the oak and pine litter layer obtained using the Simard method (16.0968 and 18.4463 h, respectively) were higher than those obtained using the Nelson method. This difference occurred mainly because the equilibrium moisture content value obtained by the Simard equilibrium moisture content formula was approximately 4% higher than that obtained using the Nelson method at the same temperature and humidity. Sun et al. [24] concluded that the time lag of Dahurian larch litter was 5.705 to 18.880 h using the Simard method, and the time lags of the broad-leaved and needle specimens obtained by Liu [56] using fixed indoor temperature and humidity were 9.35 and 25.3 h, respectively—similar to the Simard results presented in this paper. This results showed that the time lag value obtained using the Simard method was more reliable than that obtained using the Nelson method.
4.4. Model Accuracy
Using the Nelson and Simard methods, the accuracies in litter bed moisture content daily variation prediction models for oak were 1.02% and 1.03%, respectively, and those for pine were 0.5% and 0.5%, respectively. The results were similar to the 0.41%–1.30% reported by Sun et al. [24] and the 0.8%–1.9% reported by Catchpole et al. [26], indicating that a direct estimation method can be used in prediction models for the diurnal variation of oak and pine litter moisture content in this region. Its prediction accuracy meets the accuracy requirements for fire behavior prediction and fire risk forecasting [16]. The MAEs of the prediction model of the oak and pine obtained by meteorological factor regression were 6.65% and 13.26%, respectively, which did not meet the forecast accuracy requirements.
5. Conclusions
This study showed that the moisture contents of two types of litter had strong diurnal variation. The diurnal variation of the litter moisture content was significantly correlated with the air temperature and relative humidity at 1 h intervals, but not with the wind speed. The time lags of the oak litter bed obtained using the Nelson and Simard methods were 2.0261 and 16.0968 h, respectively, and the time lags for the pine were 12.2335 and 18.4463 h, respectively. The moisture content of the Mongolian oak litter bed was more sensitive to meteorological factors than that of pine. The accuracy of the two kinds of litter moisture content diurnal variation prediction models established by the direct estimation method met the fire behavior prediction and forest fire risk forecast accuracy requirements, but the prediction model obtained by the meteorological factor regression method did not meet the requirements.
This study had certain limitations. For example, specific litter types, different stand characteristics, bed packing ratios, slopes, and aspects have significant impacts on litter moisture content [57], but this research did not consider the impacts of stand characteristics. The use of the equilibrium moisture content prediction model using a direct estimation method is limited, i.e., to only the spring fire season research. In future, the diurnal variation of litter moisture content in various stand and topographic conditions should be considered comprehensively, and the time scale should be expanded, which will be of great significance for improving the accuracy and practical application of litter moisture content prediction models.
Author Contributions
Y.Z. analyzed the data, data collection, literature search and wrote manuscript; P.S. conceived and designed experiment. All authors have read and agreed to the published version of the manuscript.
Funding
This research was funded by [Research results of Guizhou Education University’s PhD Project in 2019] grant number [2019BS005] and the APC was funded by [National Natural Science Foundation of China] grant number [31370656].
Acknowledgments
We are indebted to Ziyuan Man, Fangce Liu, and Yuan Li for their support in field work. We are also grateful to two anonymous reviewers for their valuable comments.
Conflicts of Interest
The authors declare no conflict of interest.
References
- Chuvieco, E.; Aguado, I.; Yebra, M.; Nieto, H.; Salas, J.; Martín, M.P.; Vilar, L.; Martínez, J.; Martín, S.; Ibarra, P.; et al. Development of a framework for fire risk assessment using remote sensing and geographic information system technologies. Ecol. Model. 2010, 221, 46–58. [Google Scholar] [CrossRef]
- Finney, M.A. The challenge of quantitative risk analysis for wildland fire. For. Ecol. Manag. 2005, 211, 97–108. [Google Scholar] [CrossRef]
- Shu, L.F.; Tian, X.R. Current Status and Prospects of Forest Fire Prevention work abroad. World For. Res. 1997, 2, 28–36. [Google Scholar]
- Ager, A.; Vaillant, N.; Finney, M. A comparison of landscape fuel treatment strategies to mitigate wildland fire risk in the urban interface and preserve old forest structure. For. Ecol. Manag. 2010, 259, 1556–1570. [Google Scholar] [CrossRef]
- Turco, M.; Marcos-Matamoros, R.; Castro, X.; Canyameras, E.; Llasat, M. Seasonal prediction of climate-driven fi re risk for decision-making and operational applications in a Mediterranean region. Sci. Total Environ. 2019, 676, 577–583. [Google Scholar] [CrossRef] [Green Version]
- Chowdhury, E.H.; Hassan, Q.K. Operational Perspective of Remote Sensing-based Forest Fire Danger Forecasting Systems. ISPRS J. Photogramm. Remote Sens. 2015, 104, 224–236. [Google Scholar] [CrossRef]
- Sokolova, G.V.; Makogonov, S.V. Development of the Forest Fire Forecast Method (a Case Study for the Far East). Russ. Meteorol. Hydrol. 2013, 38, 222–226. [Google Scholar] [CrossRef]
- Deeeming, J.E.; Burgan, R.E.; Cohen, J.D. The Nation Fire Danger Rating System-1978. USDA For. Serv. GTR 1978. [Google Scholar] [CrossRef]
- Bradshaw, L.S.; Deeming, J.E.; Burgan, R.E. The 1978 National Fire-Danger Rating System: Technical documentation; General Technical Report INT-169; United States Department of Agriculture, Forest Service, Intermountain Research Station: Ogden, UT, USA, 1983; p. 44.
- Van Wagner, C.E. Development and Structure of the Canadian Forest Fire Weather Index System; Forestry Technical Report; Canadian Forestry Service: Ottawa, ON, Canada, 1987; pp. 35–37.
- Hu, H.Q. Forest Ecology and Management; China Forestry Press: Beijing, China, 2005. [Google Scholar]
- Sun, P.; Zhang, Y.L. A Probabilistic Method Predicting Forest Fire Occurrence Combining Firebrands and the Weather-Fuel Complex in the Northern Part of the Daxinganling Region, China. Forests 2018, 9, 428. [Google Scholar] [CrossRef] [Green Version]
- Rothermel, R.C.; Wilson, R.A.J.; Morris, G.A.; Scatett, S.S. Modeling Moisture Content of Fine Dead Wildland Fuels: Input to the BEHAVE Fire Prediction System. Usda For. Serv. Intermt. Res. Stn. Res. Pap. 1986, 11, 1–61. [Google Scholar] [CrossRef]
- Marsdensmedley, J.B.; Catchpole, W.R.; Marsdensmedley, J.B.; Catchpole, W.R. Fire Modelling in Tasmanian Buttongrass Moorlands. III. Dead Fuel Moisture. Int. J. Wildland Fire 2001, 10, 241–253. [Google Scholar] [CrossRef]
- Chuvieco, E.; Aguado, I.; Dimitrakopoulos, A.P. Conversion of Fuel Moisture Content Values to Ignition Potential for Integrated Fire Danger Assessment. Can. J. For. Res. 2004, 34, 2284–2293. [Google Scholar] [CrossRef]
- Trevitt, A.C.F. Weather parameters and fuel moisture content: Standards for fire model inputs. In Proceedings of the Conference on Bushfire Modeling and Fire Danger Rating Systems, Canberra, ACT, Australia, 11–12 July 1988. [Google Scholar]
- Nelson, R.M.J. Prediction of Diurnal Change in 10-h Fuel Stick Moisture Content. Can. J. For. Res. 2000, 30, 1071–1087. [Google Scholar] [CrossRef]
- Matthews, S.; Mccaw, W.L. A Next-generation Fuel Moisture Content Model for Fire Behavior Prediction. For. Ecol. Manag. 2006, 234, s27–s30. [Google Scholar] [CrossRef]
- Matthews, S.; Mccaw, W.L.; Neal, J.E.; Smith, R.H. Testing a Process-based Fine Fuel Moisture Model in Two Forest Types. Can. J. For. Res. 2007, 37, 23–35. [Google Scholar] [CrossRef]
- Matthews, S.; Gould, J.; Mccaw, L. Simple models for predicting dead fuel moisture in eucalyptus forests. Int. J. Wildland Fire 2010, 19, 459–467. [Google Scholar] [CrossRef]
- Wang, C.; Gao, H.Z.; Cheng, S.; Lu, D.L.; Chang, W.Q. Study on water content of Forest Fuel and Forest Fire Risk Prediction in Saihanba Forest Area. For. Sci. Technol. Dev. 2009, 23, 59–61. [Google Scholar] [CrossRef]
- Pook, E.W.; Gill, A.M. Variation of live and dead fine fuel moisture in Pinus radiata plantations of the Autralian Capital Territory. Int. J. Wildland Fire 1993, 3, 155–168. [Google Scholar] [CrossRef]
- Li, S.Y.; Shu, Q.T.; Ma, A.L.; Zhang, Q.R.; Liu, Y.; Wang, X.Q. Modeling on Moisture Content Predicting of Surface Fuel of Litter- fall Layer in Pinus armandii Plantations. For. Resour. Manag. 2009, 1, 84–88. [Google Scholar] [CrossRef]
- Sun, P.; Yu, H.Z.; Jin, S. Predicting hourly litter moisture content of larch stands in daxinganling region, china using three vapour-exchange methods. Int. J. Wildland Fire 2015, 24, 114–119. [Google Scholar] [CrossRef]
- Jin, S.; Li, L. Validation of the Method for Direct Estimation of Timelag and Equilibrium Moisture Content of Forest Fuel. Sci. Silvae Sin. 2010, 46, 98–105. [Google Scholar]
- Catchpole, E.A.; Catchpole, W.R.; Viney, N.R.; McCaw, W.L.; Marsden-Smedley, J.B. Estimating Fuel Response Time and Predicting Fuel Moisture Content From Field Data. Int. J. Wildland Fire 2001, 10, 215–222. [Google Scholar] [CrossRef] [Green Version]
- Nelson, R.M. A method for describing equilibrium moisture content of forest fuels. Can. J. For. Res. 1984, 14, 597–600. [Google Scholar] [CrossRef]
- Ruiz, A.D.; Maseda, C.M.; Lourido, C.; Viegas, D.X. Possibilities of dead fine fuels moisture prediction in Pinus pinaster Ait. stands at “Cordal de Ferreiros” (Lugo, north-western of Spain). In Proceedings of the Forest Fire Research & Wildland Fire Safety: IV International Conference on Forest Fire Research Wildland Fire Safety Summit, Coimbra, Portugal, 18–23 November 2002. [Google Scholar]
- Slijepcevic, A.; Anderson, W. Hourly variation in fine fuel moisture in eucalypt forests in tasmania. For. Ecol. Manag. 2006, 234. [Google Scholar] [CrossRef]
- Simard, A.J.; Main, W.A. Comparing methods of predicting jack pine slash moisture. Can. J. For. Res. 1982, 12, 793–802. [Google Scholar] [CrossRef]
- Simard, A.J.; Eenigenburg, J.E.; Blank, R.W. Predicting fuel moisture in jack pine slash: A test of two systems. Can. J. For. Res. 1984, 14, 68–76. [Google Scholar] [CrossRef]
- Groot, W.J.; Wardati Wang, Y. Calibrating the fine fuel moisture code for grass ignition potential in sumatra, indonesia. Int. J. Wildland Fire 2005, 14, 161–168. [Google Scholar] [CrossRef]
- Wang, H.Y.; Li, L.; Liu, Y.; Jin, S. Suitability of Canadian Forest Fire Danger Rating System in Tahe Forestry Bureau, Heilongjiang Province. J. Northeast For. Univ. 2008, 36, 47–49. [Google Scholar]
- Wotton, B.M.; Stocks, B.J.; Martell, D.L. An index for tracking sheltered forest floor moisture within the canadian forest fire weather index system. Int. J. Wildland Fire 2005, 14, 169–182. [Google Scholar] [CrossRef]
- Wotton, B.K.; Beverly, J.L. Stand-specific litter moisture content calibrations for the Canadian Fine Fuel Moisture Code. Int. J. Wildland Fire 2007, 16, 463–472. [Google Scholar] [CrossRef]
- Mao, W.X.; Tong, D.H.; Zhang, C.; Zhao, D.D.; Ding, Y.Y.; Jin, S. Spatial Heterogeneity of Moisture Content of Land Surface Dead Fuel in Larch Stand and Effects of Sampling Methods on Moisture Estimation. J. Northeast For. Univ. 2012, 40, 29–33. [Google Scholar] [CrossRef]
- Bülent, S.; Bilgili, E.; KuUk, O.; Durmaz, B.D. Determination of surface fuels moisture contents based on weather conditions. For. Ecol. Manag. 2006, 234, S75–S81. [Google Scholar] [CrossRef]
- Viegas, D.X.; Piñol, J.; Viegas, M.T.; Ogaya, R. Estimating live fine fuels moisture content using meteorologically-based indices. Int. J. Wildland Fire 2001, 10, 223–240. [Google Scholar] [CrossRef]
- Van Wagner, C.E. Equilibrium Moisture Contents of some Fine Forest Fuels in Eastern Canada. Inf. Rep. Petawawa For. Exp. Stn. 1972, PS-X-36. [Google Scholar]
- Lawson, B.D.; Armitage, O.B.; Hoskins, W.D. Diurnal variation in the fine fuel moisture code: Tables and computer source code. FRDA Rep. 1996, 245. (Pacific Forestry Centre and Research Branch: Victoria, BC). [Google Scholar]
- Sun, P.; Zhang, Y.L.; Sun, L.; Hu, H.H.; Guo, F.T.; Wang, G.Y.; Zhang, H. Influence of Fuel Moisture Content, Packing Ratio and Wind Velocity on the Ignition Probability of Fuel Beds Composed of Mongolian Oak Leaves via Cigarette Butts. Forests 2018, 9, 507. [Google Scholar] [CrossRef] [Green Version]
- Byram, G.M.; Nelson, R.M. An Analysis of the drying Process in Forest Fuel Material. In General Technical Report; Southern Research Station, USDA Forest Service: Blacksburg, VA, USA, 1963; pp. 1–38. [Google Scholar]
- Simard, A.J. The moisture content of forest fuels-1. In A Review of the Basic Concepts; Information Report FF-X-14; Canadian Department of Forest and Rural Development, Forest Fire Research Institute: Ottawa, ON, Canada, 1968; p. 47. [Google Scholar]
- Liu, X.; Jin, S. Development of Dead Forest Fuel Moisture Prediction Based on Equilibrium Moisture Content. Sci. Silvae Sin. 2007, 43, 126–133. [Google Scholar] [CrossRef]
- Viney, N.R. A Review of Fine Fuel Moisture Modelling. Int. J. Wildland Fire 1991, 1, 215–234. [Google Scholar] [CrossRef]
- Luke, R.H.; Mcarthur, A.G.; Brown, A.G.; Mcarthur, A.G.; Hillis, W.E. Bushfires in Australia; Australian Government Publishing Service: Canberra, Australia, 1978.
- Pixton, S.W.; Warburton, S. Moisture Content/Relative Humidity Equilibrium of Some Cereal Grains at Different Temperatures. J. Stored Prod. Res. 1971, 6, 283–293. [Google Scholar] [CrossRef]
- Britton, C.M.; Countryman, C.M.; Wright, H.A.; Walvekar, A.G. The Effect of Humidity, Air Temperature, and Wind Speed on Fine Fuel Moisture Content. Fire Technol. 1973, 9, 46–55. [Google Scholar] [CrossRef]
- Anderson Hal, E. Moisture Diffusivity and Response Time in Fine Forest Fuels. Can. J. For. Res. 1990, 20, 315–325. [Google Scholar] [CrossRef]
- Zhang, H. Influencing Factors of Dead Surface Fuel Moisture Prediction in Great Xing’an Region. Ph.D. Thesis, Northeast Forestry University, Harbin, China, 2014. [Google Scholar]
- Slijepcevic, A.; Anderson, W.R.; Matthews, S. Testing existing models for predicting hourly variation in fine fuel moisture in eucalypt forests. For. Ecol. Manag. 2013, 306, 202–215. [Google Scholar] [CrossRef]
- Zhang, Y.L. Study on Influencing Factors and Prediction Model of Dynamic Change of Litter Moisture Content of Mongolian Oak and Pinus Koraiensis. Ph.D. Thesis, Northeast Forestry University, Harbin, China, 2019. [Google Scholar] [CrossRef]
- Yu, H.Z.; Jin, S.; Di, X.Y. Prediction Models for Ground Surface Fuels Moisture Content of Larix gmelinii Stand in Daxing’anling of China Based on One-hour Time Step. Chin. J. Appl. Ecol. 2013, 24, 1565–1571. [Google Scholar]
- Yu, H.Z.; Jin, S.; Di, X.Y. Models for Predicting the Hourly Fuel Moisture Content on the Forest Floor of Birch Stands in Tahe Forestry Bureau. Sci. Silvae Sin. 2013, 49, 108–113. [Google Scholar] [CrossRef]
- Lu, X. Research on Dynamic and Prediction Model of Dead Fuel Moisture Content of Typical Stands in Great Xing’an Mountains. Ph.D. Thesis, Northeast Forestry University, Harbin, China, 2016. [Google Scholar]
- Liu, X. Effects of Temperature and Humidity on Fuel Equilibrium Moisture Content. Master’s Thesis, Northeast Forestry University, Harbin, China, 2007. [Google Scholar]
- Carlson, J.D.; Bradshaw, L.S.; Nelson, R.M. Application of the Nelson Model to Four Timelag Fuel Classes Using Oklahoma Field Observations: Model Evaluation and Comparison with National Fire Danger Rating System Algorithms. Int. J. Wildland Fire 2007, 16, 204–216. [Google Scholar] [CrossRef]
Figure 1.
Location of the study site.

Figure 2.
Diurnal variation of litter moisture contents of the Mongolian oak forest and Korean pine plantation.
Figure 2.
Diurnal variation of litter moisture contents of the Mongolian oak forest and Korean pine plantation.

Figure 3.
The coefficient of cross correlation between meteorological factors and the moisture content lagged with different times. * Indicates significant correlation.
Figure 3.
The coefficient of cross correlation between meteorological factors and the moisture content lagged with different times. * Indicates significant correlation.

Figure 4.
Comparison of litter moisture content model errors for the Mongolian oak and Korean pine.

Figure 5.
Measured and predicted values of the diurnal variation in litter moisture content of Mongolian oak.
Figure 5.
Measured and predicted values of the diurnal variation in litter moisture content of Mongolian oak.

Figure 6.
Measured and predicted values of the diurnal variation in litter moisture content of Korean pine.
Figure 6.
Measured and predicted values of the diurnal variation in litter moisture content of Korean pine.

Figure 7.
Comparisons of measured and predicted values. (a–c) indicate the comparisons of measure and predicted values of Mongolian oak by Nelson, Simard and Direct regression methods, respectively; (d–f) indicates the comparisons of measure and predicted values of Korean pine by Nelson, Simard and Direct regression methods, respectively.


Table 1.
Basic information of the two sample plots.
| Forest Type | Location | Elevation (m) | Mean Height (m) | Mean Diameter at Breast Height (cm) | Canopy Density | Litter Load (t·ha−1) |
|---|---|---|---|---|---|---|
| Mongolian oak (Quercus mongolica) | Upper slope | 544 | 12 | 23 | 0.45 | 3.68 |
| Korean pine (Pinus koraiensis) | Middle slope | 382 | 15 | 21 | 0.55 | 6.22 |
Table 2.
Basic statistics of the moisture content of surface litter.
| Litter Type | N | Mean (%) | Minimum (%) | Maximum (%) | Mean Change in 1 h (%) | Minimum Change in 1 h (%) | Maximum Change in 1 h (%) |
|---|---|---|---|---|---|---|---|
| Mongolian oak | 134 | 22.02 | 17.91 | 32.37 | 1.06 | 0.00 | 11.49 |
| Korean pine | 125 | 15.35 | 9.28 | 33.89 | 0.58 | 0.00 | 2.94 |
Table 3.
Estimated parameters and errors of all the models established using three different methods. MAE and MRE indicates the mean absolute error and mean relative error, respectively).
Table 3.
Estimated parameters and errors of all the models established using three different methods. MAE and MRE indicates the mean absolute error and mean relative error, respectively).
| Method | Parameters | Mongolian Oak | MAE (%) | MRE (%) | Korean Pine | MAE (%) | MRE (%) |
|---|---|---|---|---|---|---|---|
| Nelson method | 0.2458 | 1.02 | 4.76 | 0.0039 | 0.50 | 3.53 | |
| −0.0261 | −0.0023 | ||||||
| 0.7813 | 0.9600 | ||||||
| 2.0261 | 12.2335 | ||||||
| Simard method | 0.9694 | 1.03 | 4.73 | 0.9732 | 0.50 | 3.59 | |
| 16.0968 | 18.4463 | ||||||
| Direction regression method | 19.7130 | 1.46 | 6.65 | 15.009 | 1.95 | 13.26 | |
| 0.0630 | −08400 | ||||||
| −0.1211 | 0.4130 | ||||||
| - | 0.079 |
© 2020 by the authors. Licensee MDPI, Basel, Switzerland. This article is an open access article distributed under the terms and conditions of the Creative Commons Attribution (CC BY) license (http://creativecommons.org/licenses/by/4.0/).
Share and Cite
MDPI and ACS Style
Zhang, Y.; Sun, P. Study on the Diurnal Dynamic Changes and Prediction Models of the Moisture Contents of Two Litters. Forests 2020, 11, 95. https://0-doi-org.brum.beds.ac.uk/10.3390/f11010095
AMA Style
Zhang Y, Sun P. Study on the Diurnal Dynamic Changes and Prediction Models of the Moisture Contents of Two Litters. Forests. 2020; 11(1):95. https://0-doi-org.brum.beds.ac.uk/10.3390/f11010095
Chicago/Turabian StyleZhang, Yunlin, and Ping Sun. 2020. "Study on the Diurnal Dynamic Changes and Prediction Models of the Moisture Contents of Two Litters" Forests 11, no. 1: 95. https://0-doi-org.brum.beds.ac.uk/10.3390/f11010095
Note that from the first issue of 2016, this journal uses article numbers instead of page numbers. See further details here.