A Framework for Characterizing and Regulating Ecosystem Services in a Management Planning Context


Former Member of Faculty of Forestry, Karadeniz Technical University, 61080 Trabzon, Turkey
Forests 2020, 11(1), 102; https://0-doi-org.brum.beds.ac.uk/10.3390/f11010102
Submission received: 12 November 2019
/
Revised: 19 December 2019
/
Accepted: 11 January 2020
/
Published: 14 January 2020
(This article belongs to the Special Issue Decision Support to Address Multiple Ecosystem Services in Forest Management Planning)
Abstract
:Sustainable management promises to improve the conservation and utilization of ecosystem services and their contribution to human wellbeing through management plans. This paper explores the concept of characterization and integration of ecosystem services in a management planning concept. The integration process involves the identification, quantification, valuation, assessment, and monitoring of ecosystem services over time. The quantification of common ecosystem services, such as soil erosion, water conservation, recreation, biodiversity conservation, and carbon sequestration was explored. A framework was developed to integrate ecosystem services into management planning process. Ecosystem services are classified as provisioning, regulating, supporting, and cultural services with a defined typology. The conceptual framework acts as an organizing structure and it serves as a model for the management of ecosystems with their contribution to human wellbeing. Ecosystem management with multi-criteria decision techniques, information technologies and a structured participation is a proposed approach for the sustainable management of ecological, economic, and socio-cultural functions. Establishing the quantitative relationships between ecosystem services and societal benefits is essential. The provision of a universally accepted clear measurement of regulating, supporting, and cultural services is challenging. A commitment, vision, and strong willingness are required to adopt policies, regulations, and management objectives in planning. Integration can only be realized with prioritizing ecosystem services with the involvement of stakeholders. Substantial understanding of both the ecological and social systems is a prerequisite for sustainable management of ecosystem services. The ecosystem services with significant benefits to the wellbeing of society should primarily be characterized, their relative importance be weighted, and prioritized through a participatory approach. A holistic approach with a comprehensive decision support system is essential in forecasting the future provision of ecosystem services and assessing the trade-off analysis, resulting in better policy formulation before on-the-ground implementation.
1. Introduction
Ecosystem services (ES) are simply the baskets of benefits that are produced and provided by the ecosystems from which the people benefit [1]. They are the relative contribution of natural capital to human wellbeing [2]. Therefore, it is essential to adopt a broad and transdisciplinary perspective to address ES properly in a management planning concept. These benefits can range from tangible products, such as provisioning services of wood, food, and fresh water production, to intangible products, such as habitat for biodiversity conservation, erosion control, air quality, recreation, and aesthetics [3]. These services are generated from different ecosystems, such as grasslands, forestlands, farmlands, and wetlands, at varying levels and extents. The importance of any ES lies on their availability (existence and accessibility), extent (size or coverage), quantity (amount), management framework, including policies, regulations, and personal resources, and the relative monetary value within the general economy of society (societal demand and market condition). Most of them are critical components in managing ES. However in the meantime, the characterization (identification and quantification) of ES is necessary and a prerequisite for regulating ecosystem development over time and developing a set of management objectives and conservation targets.
The ecosystem services contribute to human wellbeing in multiple ways, such as the provision of food, fresh water, recreation, and nutrients with very strong links to security, basic material for a good life and health [1,4]. Similarly, freshwater provision and natural medicines make strong contribution to elements of human wellbeing [5,6]. The regulating services make a significant contribution to human health through regulation of air quality, local climate and disease, and to security through the regulation of water in particular, but also through regulating natural hazards, pests, and local climate [7]. The cultural services make strong contribution to good social relations [8].
In fact, the concept of ES covers the economic, ecological, and socio-cultural functions of nature. Specifically, the ecosystem services are vital in social, ecologic, and economic developments, including human progress and survival. A comprehensive study by Costanza [9] estimated the total economic value of all ecosystems services to be around $16–54 trillion per year. A more focused research that was conducted in 47 countries in Asia and Pacific region only by Kubiszewski [10] indicated the economic value of ES for terrestrial ecosystems to be $14 trillion per year in benefits. However, the real essence of the ES is undervalued, because of economic and political insufficiencies, indifferences, and weaknesses—economic invisibility of nature—in accounting the value of the nature [11]. This might be due to a lack of funding, lack of legal infrastructure, or technical inabilities, such as insufficient quantification process coupled with traditionally free use perception embedded in the socio-economic structure. Besides, understanding both the ecological and the social systems and developing sound policy and management interventions are critical in enhancing the contribution of ecosystems to human wellbeing by harmonizing the conservation and sustainable use of ecosystems [2,4,12].
The degradation of ecosystems contributes to growing inequities and disparities among the people living particularly in rural areas, and is sometimes the principal factor causing poverty and social conflicts [1]. In another words, degradation and unsustainable use will cause severe problems for people in the future, when ES will no longer be available [3]. In fact, ecosystems are responsive to both the anthropogenic impacts and natural disturbances. For example, Costanza [13] estimated the global loss of ES due to land use changes between 1997 and 2011 to be around $4.3–20.2 trillion per year. Thus, it is important to recognize the fact that anthropogenic disturbances have changed the capacity of the ecosystems to provide the appropriate levels of ES, mainly due to the degradation of natural resources that, in turn, results in the potentially irreversible loss of ecosystem functions and services, with the ultimate effect of reducing human wellbeing. Unfortunately, such degradation problems cannot be solved, so long as ES are treated as free and limitless [1]. The challenge is to recognize the fact and manage natural resources on a sustainable basis that balances between the increasing needs of society and the provision of ES over time. Hence, the conservation and sustainable use of ecosystems services are indispensable in determining the sustainable level of ES and the assessment of their contribution to human wellbeing that highly depends on the quantitative characterization and incorporation into the management plans.
The ecosystem services have been sporadically characterized and integrated into a management planning process that is based on the available information. There are some research endeavors to pinpoint the characterization and integration of various forest goods and services (i.e., ecosystem services) in management planning [14,15,16,17,18,19,20,21,22]. However, they hardly focus on the holistic incorporation of the ES within a conceptual framework of their management. They usually incorporate one or a few other ES in an incremental fashion as they become necessary, which overlooks the overall process of a coherent framework that encompasses the whole set of the ES within the concept of ecosystem management. This paper develops a general framework for the management of ES in a planning process and focuses on the quantification of some prevailing ES. Specifically, the paper conceptualizes the process of managing ES in a management planning concept by integrating the ES into the planning process and attempts to provide how the most prevalent ES can be quantified for integration.
2. The Conceptual Framework of Managing Ecosystem Services
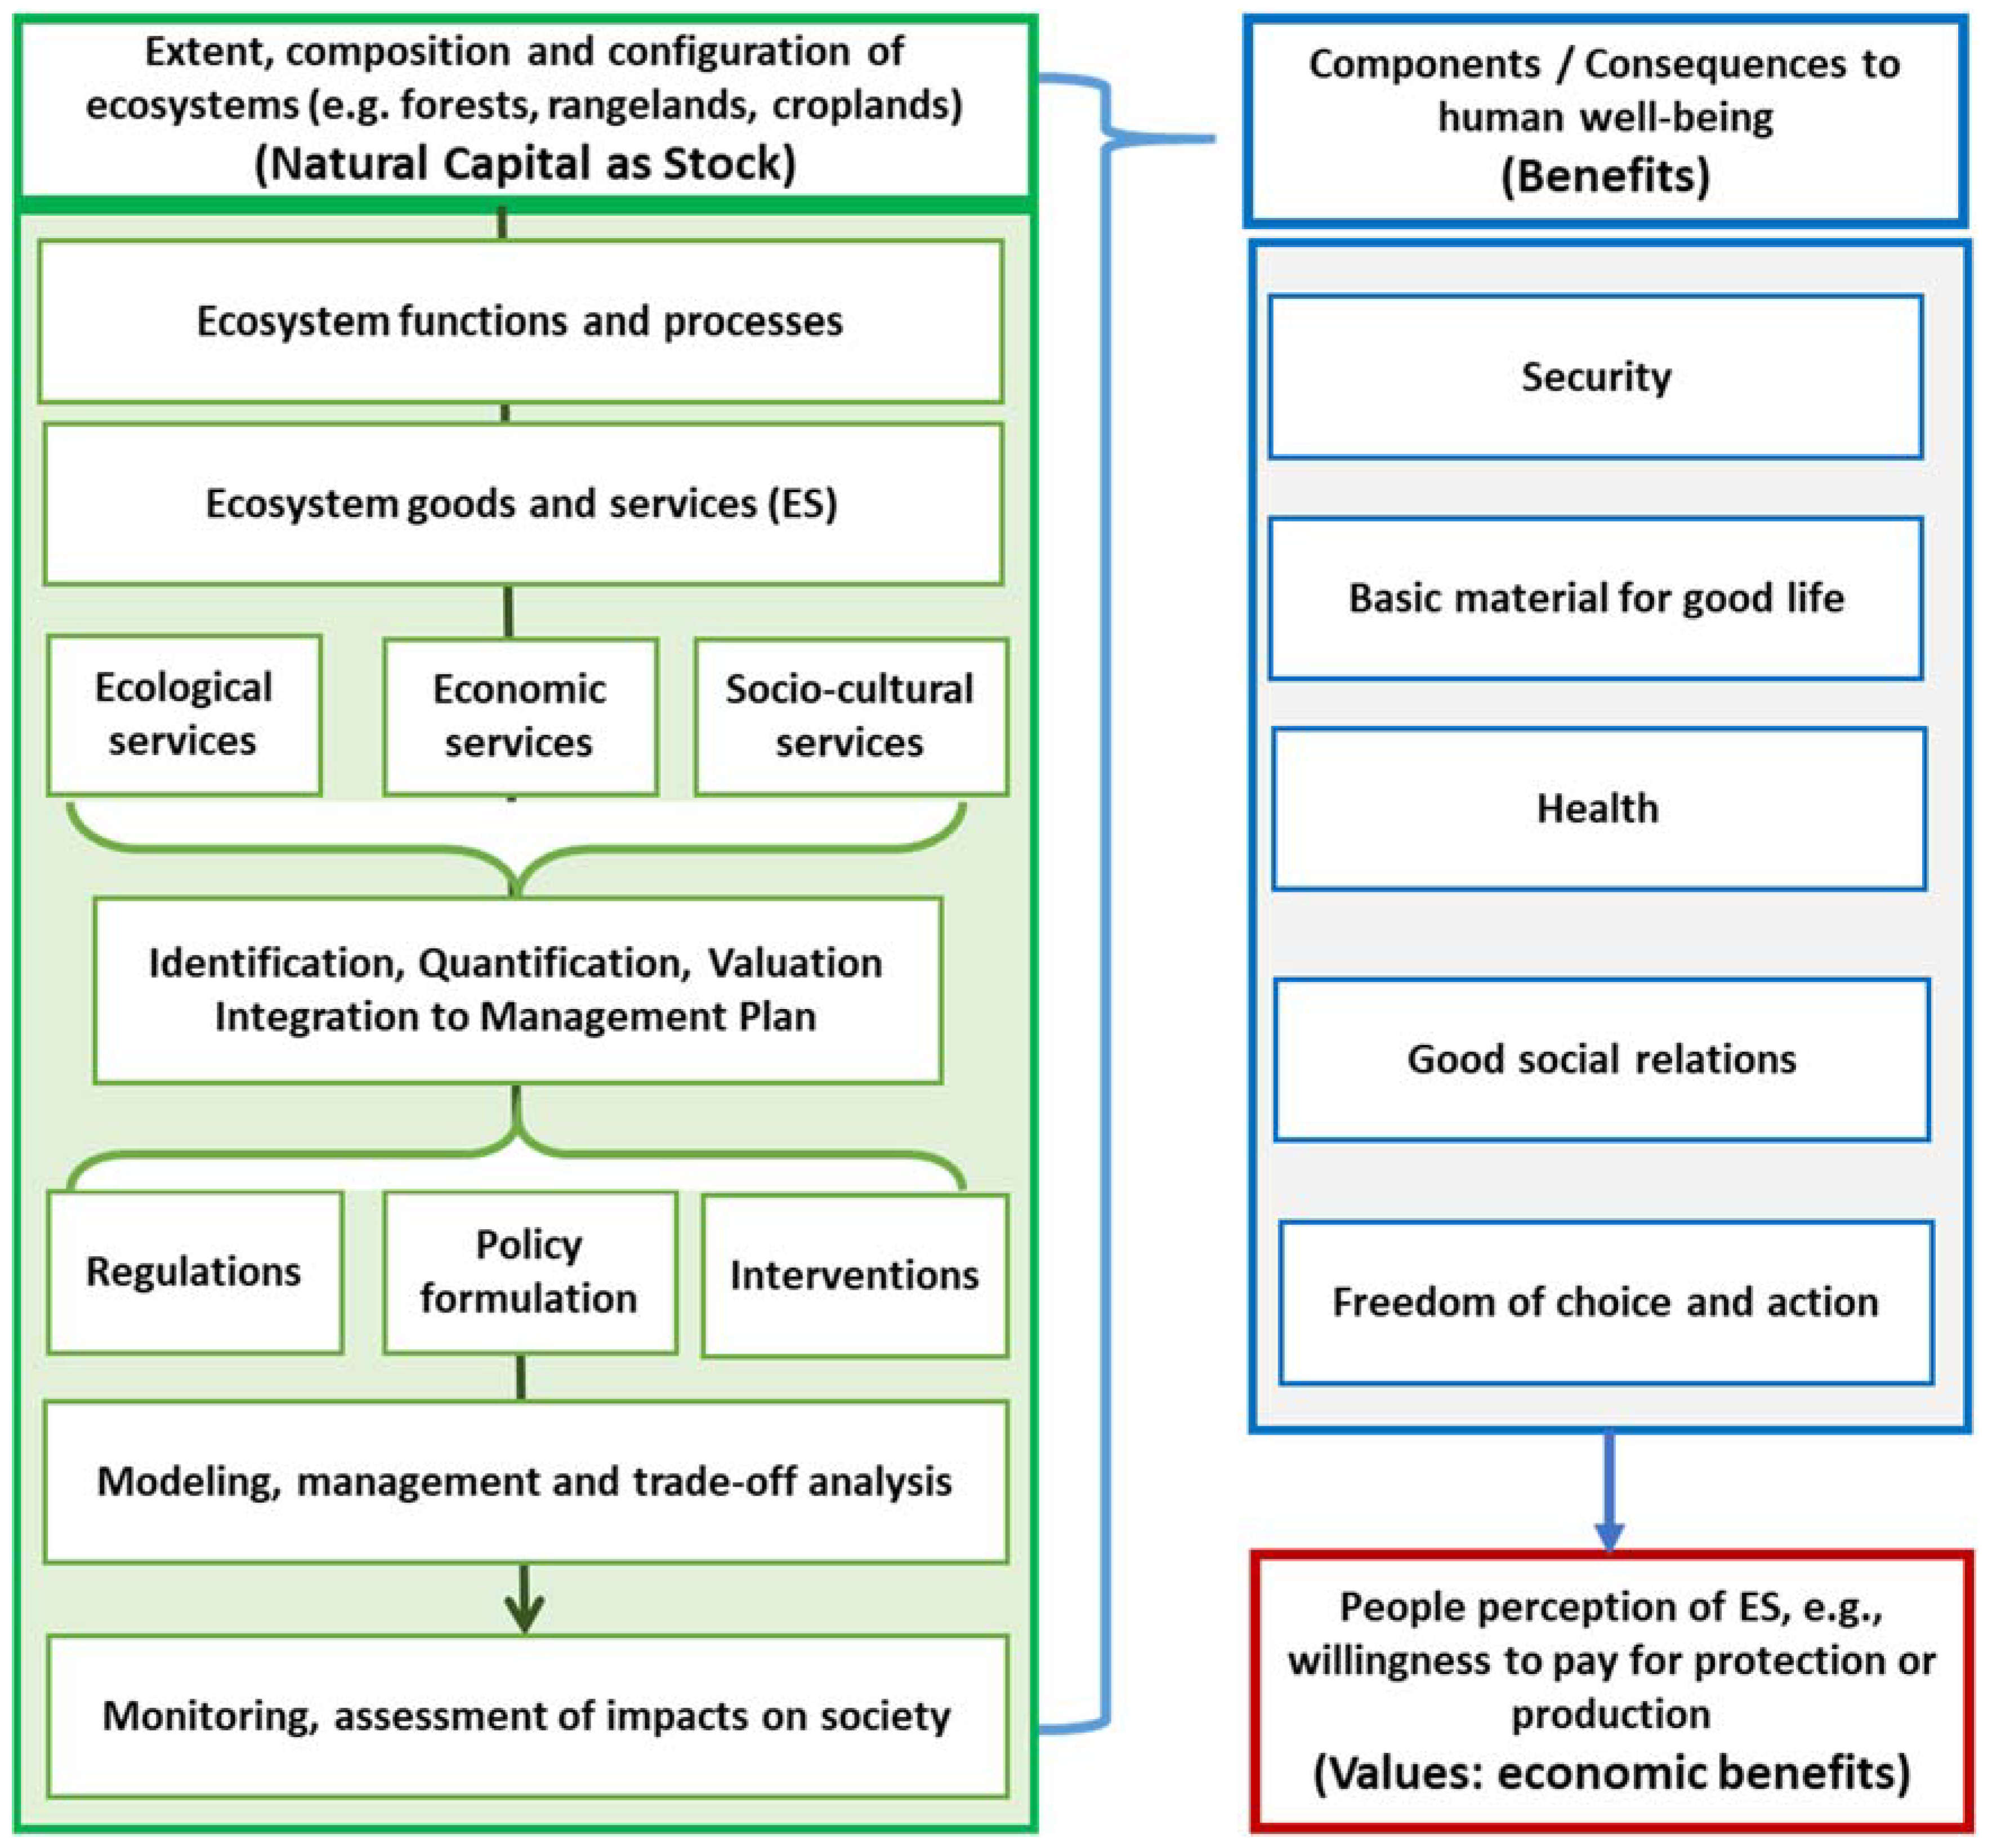
The conceptual framework of managing ecosystem services includes a process that starts from the inventory of extent, composition, and configuration of ecosystems to the assessment of their impacts on human welfare (Figure 1). Here, natural capital refers to a stock of natural resources (i.e., extent, composition, and configuration of forest ecosystems) that exists at a certain point in time. Each form of capital stock generates a flow of services, which may be used to transform materials, or the spatial configuration of materials, to enhance the welfare of humans [9]. There are various approaches (i.e., The Economics of Ecosystems and Biodiversity (TEEB), Millennium Ecosystems Assessment (MEA), and The Common International Classification of Ecosystem Services (CICES)) to organizing the management of ES with a typology for the classification, description and valuation of ecosystem functions, goods and services under the scope of provisioning, regulatory, supporting, and cultural services [2,23]; for a definition of those terms, see [24]. The MEA initiative puts ES at the centre of the framework and links human wellbeing to the impacts on ecosystems of changes in natural resources. The TEEB endeavor draws attention to the economic benefits of conserving ecosystems and biodiversity in formulating policy instrument during decision-making processes. However, based on international conventions and common scientific understanding, ES are principally viewed and conceptualized as a combination of ecological, economic, and socio-cultural services in a management planning context. Whatever classified, the ecosystem services are created from the complex composition and structure of ecosystems where people esteem and capitalize on them. In other words, they consist of flows of materials, energy, and information from natural capital stocks to produce human welfare [9].
The ES need to be defined, identified, and quantified to benefit from them before the integration to management plans. Based on the characterization of each ES, an economical value can then be assigned to each land use category to map out the per area valuation of ES in a given landscape. Given the characterization, valuation, and mapping of each ES, management strategies are developed with the appropriate regulations, policy formulation, and management actions. Subsequently, the impact of each ES on the wellbeing of the society can be assessed with a decision support system through a structured participation. Thus, it is not a straightforward approach to manage the ecosystems for a basket of ES, as all of them are associated with the complex web of ecosystem structure, composition, and spatial configuration, as well as the public/stakeholder’s perception towards the end of the process.
The ecosystem services concept serves as a basis for identifying, quantifying, modelling, assessing, and displaying the trade-offs between different land-use scenarios with different interventions in a given landscape. In fact, there are numerous ES, such as wood production, water provision, carbon sequestration, biodiversity protection, and erosion control, and most of them are linked with different management alternatives. Naturally, the ES are embedded into the natural resources, where the people benefit from them. Ecosystem processes and functions underlie all ES and are thus critical to the supply of all services, as they describe the existing biophysical relationships [2]. Ecosystem services are those processes and functions that benefit people [25], while dis-services denotes the process and functions that affect humans negatively, causing damage and costs [2,26].
Before integrating ES into the management plan, the existence and the quantity (extent and composition) of each ES need to be determined for better association of them with land use categories, such as forests, rangelands, and farmlands, and with the management actions that cause ES to change over time. For example, the flows of the services and dis-services directly depend on how agricultural or forest ecosystems are managed with respect to the diversity, composition, and functioning of remaining natural ecosystems in the landscape [26]. The ES are also linked to the interaction with the wellbeing of the society through security, basic material for good life, health, good social relations, and even freedom of choice and action [1]. Finally, the economic values of ES are extracted as a direct or indirect contribution to the wellbeing of society. This refers to the perception of the people for each ES in the form of willingness to pay for the protection of natural resources or production of goods and services. Unlike other conceptual frameworks, Figure 1 attempts to illustrate the multidisciplinary nature of ES to link representations of extent, composition, and structures of ecosystems, along with the functions and processes to the benefits, economic values, and ultimately peoples’ wellbeing through the management of ES [24,27]. This framework is somehow similar to the Cascade model referring to intermediate and final services wrapped around the logical process of biophysical structure, functions, services, benefits, and values [24].
Specifically, the framework recognizes the extent, composition, and structure of ecosystems as the natural capital to provide flow of benefits as ecosystem services. It seeks to conceptualize ecosystem services, which are defined as the contribution of ecosystems to the benefits of society. These services are the outputs of ecosystems that most directly affect the wellbeing of people. A fundamental characteristic of ES is that they retain a connection to the underlying ecosystem functions, processes, and structures that generate them. Function is used to highlight the characteristics of ecosystem development as the flow to generate a service [24]. The ecosystem services have been economically valued based on people’s perception. In this framework, the crucial aspect is the integration process, including identification, quantification, valuation, and monitoring of ES based on the development of regulation, policy formulation, and management interventions with a sound decision support system to allow for a tradeoff analysis.
While some of the ecosystem services can be measured and quantified directly with some numerical indicators (e.g., wood production ES with the amount of growing stock and increment), it is often difficult to quantify most of the other ES, as they are intangible values and can only be measured indirectly with some qualitative indicators or measurements (e.g., habitat suitability index for biodiversity conservation). The nature of such ES necessitates the use of various “proxy measures” to be able to attribute and translate them into an understandable scale. Furthermore, there need to be relevant empirical/field data and information, including the spatial data (locational and attribute data), in order to be able to quantify the ES appropriately. Specifically, it would be quite cumbersome and difficult to quantify ES in the absence of the appropriate data. However, there are various indirect ways or tools of quantifying ES while using the spatial data and information currently available. For example, Crossman [28] described a blueprint to give guidance on modelling and mapping ES and reduce the uncertainty that is associated with quantifying ES. Added to that, the assessment of their impacts on the society would become difficult without a relatively sound framework and a method of quantification of ES.
Another bottleneck or difficulty is the dynamics of ES with respect to both natural disturbances, such as wildfires and growth/development of natural resources, and anthropogenic disturbances, such as forestry and agricultural interventions. The disturbance regimes help to describe and understand the status of ES changes over time. Thus, it is crucial to realize the dynamics of ES during both quantification and assessment of the impacts of ES on the wellbeing of society. However, the long-term ecosystem dynamics can only be modelled and assessed through a versatile decision support system (DSS), which is a computerized information system that is used to solve problems and enhance the user’s ability to make better decisions in an organization with sophisticated analysis and interpretation capability [19,20,22]. Thus, the dynamics of ES over time that are based on disturbances and natural developments can be realized with a sophisticated modeling system to overcome the bottleneck.
As part of the integration process, understanding the characteristic structure of ES is also an important mission. Various research initiatives focused on quantifying as well as assessing the impact of ES on the livelihood of different societies [2,3,9,13,29]. As stated above, while it is difficult to quantify directly some ES with certain set of indicators, there might be some qualitative measurements to indirectly quasi quantify them. Furthermore, some indicators may need longer time and further efforts to be able to get data from the field before using them in the assessment stage. Besides, the extent and level of land use interventions cause the trend and, thus, delivery of ES over time. In such a case, modelling approaches are then deemed necessary to be able to forecast the long term dynamics of ecosystems under various levels of interventions and natural disturbances to investigate the changes of ES under varying management scenarios. Nevertheless, comprehensive quantification of ES will easily respond to the changes of ecosystem composition and configuration under any disturbances over time.
Another important component of the ES framework is the identification of key stakeholders and the creation of awareness through dissemination activities, such as workshops and local events, to determine the suitable set of ES in forest management planning [27,30,31,32,33]. Here, major interest groups are identified and invited to a meeting, where the value and the effects and ES on the local economy are discussed and cooperative decisions are made. The major components of the ES framework are further described below.
2.1. Identification of Ecosystem Services
The first component of the process is to identify the potential list of ES in each category, ecosystem type, and land use class based on a globally accepted common typology for a better understanding. The list can be prepared and documented based on the available infrastructural data and the experts. The primary land use categories and the associated ecosystems, such as forests, rangelands, wetlands, agricultural lands, and hard surfaces (i.e., residential areas and roads), are considered in the identification and classification of ES in a given landscape. As the terrestrial ecosystems are focused, open water is excluded, and further classifications, including biomes, are opted out for simplicity.
There are a few widely acknowledged typologies of ecosystem services [1,3,24] that can be used to classify the ES. Those systems classify the ES in four categories with small differences, as follows:
- Provisioning services describe the material or energy outputs directly derived from wild and cultivated plant species or the products obtained from the ecosystem. They include products, such as food, fresh water, raw material (wood, fuel, biofuels, and non-wood products), and medicinal resources (bio-chemicals, natural medicines, and pharmaceuticals).
- Regulating services refer to the benefits that are obtained from the regulation of ecosystem processes, including climate regulation with carbon sequestration, air quality and moderation of extreme events, biological control with disease regulation, erosion prevention with maintenance of soil fertility, pollination, water purification, waste treatment, and flood control.
- Supporting services are general and necessary for the production of other ES. These include nutrient cycling, oxygen production, soil formation, habitat for species, genetic diversity, and primary production. It should be noted that CICES 5.1 avoids the use of the terms ‘intermediate’ and ‘supporting services’ entirely, as they are not regarded as services—rather they support “final services” [24]. While the classification is respected, supporting services are included as they are one way or another “services” based on most of the other systems (MEA, TEEB). Nevertheless, the discussion is still ongoing.
- Cultural services are the non-material benefits that the people gather from the ecosystems through spiritual enrichment, cognitive development, reflection, recreation, and aesthetic experiences. They are the perceptual values that the people inspire from the various functions of the ecosystem. They include recreational experiences, maintenance and rejuvenation of mental and physical health, aesthetic appreciation, cultural heritage, educational values, inspiration for culture, art and design, ecotourism, spiritual experience, religious values, and sense of place.
An infrastructural geodatabase is used to describe and list the available ecosystem services with the appropriate criteria and GIS functions in a given landscape based on the largely envisioned descriptions and classification of ES like MEA and TEEB. The level of utilization of the ES by the public can also be identified for different land use categories and ecosystem types. Additionally, the priority of an ES to others might change in different places and times. Thus, the priorities for an area, ES, and time should be assessed with the stakeholders for developing better management strategies and policies.
2.2. Quantification of Ecosystem Services
This is one of the difficult steps in the framework as there is not any well-defined set of methods for the quantification of ES. In fact, some of the ES, particularly the provision services, such as raw material (wood production, non-wood production, food etc.), are relatively straightforward to quantify. However, other ES, such as supporting, regulating and cultural services are quite hard and complex to quantify. Thus, the next section focuses on the commonly considered ES that have a quantification process that is not straightforward and most widely considered and used ES in land use planning. While it is not an exhaustive list, the common ES include soil erosion, water provision, recreational values, habitat for biodiversity conservation, and carbon sequestration.
Soil erosion is the removal of soil by wind, water, and other activities. It involves the processes of detachment, transportation, and deposition, which results in the relocation of the top soil [34]. The removal of top soil, containing organic matter, humus, and nutrients, by erosion leads to a loss of soil fertility or productivity [35]. It is the most pressing environmental problem in areas where the topography is steep and/or precipitation is high.
It is generally quantified by the RUSLE (Revised Universal Soil Loss Equation), as:
where;
A = R × K × LS × C × P
A represents the potential long term average annual soil loss in tons per acre per year, R is the rainfall and runoff factor by geographic location, K is the soil erodibility factor, LS is the slope length-gradient factor, C is the crop/vegetation and management factor, and P is the support practice factor [36].
Soil organic matter (SOM) content (%), clay fraction (%), and the decimal logarithm of the geometric mean of soil particle size can be used to assess the soil erodibility factor of RUSLE (RUSLE-K) [37]. Therefore, a sufficient number of soil samples need to be analyzed for SOM, clay, and soil particle size distribution to correctly run RUSLE. It should be noted that the equation does not include processes, such as gully erosion, landslides, or streambank erosion [36]. While these are the primary parameters for measuring the amount of soil loss by erosion, the method often requires field measurements to use the model for effective characterization of soil loss. In the meantime, practical approaches may also be developed to quantify and delineate the areas for erosion with a relatively effective scale (i.e., very high, high, medium, low/none). Sheet/surface erosion, gully erosion, and wind erosion are the basic erosion types that would easily be identified by the experts and recorded into the relevant database [38].
The practical criteria that can be used to identify erosion prone areas (and the scale of its effectiveness) are: any indication of the existence of sheet, rill and gully erosion, areas over 60% or slope (particularly over 80%), landslide and avalanche prone areas, and watershed buffers prone to water erosion and landslide. Additionally, severe and widespread forest harvesting (mass clear cutting on steep slopes) contributes to sediment fluxes [39,40]. Roads and trails construction, stream crossing, and particularly forest fires reduce vegetation cover and soil infiltration. Intense grazing can remove soil cover, increase compaction, and cause erosion. Thus, these parameters can also be used in identifying and quantifying the soil protection areas, as most of them are relevant in a management planning context. Although quantifying the soil loss from any individual land use type is crucial, it might not be solely sufficient for entirely characterizing the ES services. Alternative suitable practical measures (changing the crop design or land use type, windbreaks, counter cropping, etc.) may need to be proposed to lower the soil loss in the areas with high erosion risk.
As for water related ecosystem services: there are different approaches in quantifying the water related ES through various indicators. While they differ in details, the water associated ES are water yield for drinking and non-drinking purposes, flood protection, water flow maintenance, erosion control, and the chemical condition of the water [7,24]. The indicators that are used to quantify water services are annual runoff, annual quick and base flow, annual sediment loss, and total nutrient export. The water related ES descriptions and the specific parameters used in the quantification process are as follows [7].
- Water yield: Evapotranspiration and total supply of water per area measured by % of soil covered by trees, shrubs and litter, % of removal of crop (harvesting), species composition, annual precipitation, surface water from rivers, lakes, and other open water bodies for drinking, domestic use (washing, cleaning, and other non-drinking use), irrigation, livestock consumption, and industrial use (consumption and cooling) [5,40].
- Flood protection: The possible indicators are quick flow amount, runoff time, and number of floods affected by road density, harvesting, or logging (% of removal), intensive grazing, fraction of soil covered by vegetation, burning (% of area affected) [39].
- Erosion control: The annual amount of sediment removal and erosion/landslide/gravity flow protection measured/affected by the vegetation cover, harvesting, road density burning, and grazing activities [36].
- Chemical condition: Water quality; Concentration of Nitrogen, Phosphorus; Concentration of toxic elements measured/affected by applied chemicals, harvesting, burning, species composition, and age distribution. It should be noted that some of the indicators that are related to the chemical condition, such as applied chemicals, are often difficult to obtain, yet easy enough to test practically for the relevant data [42].
The above criteria are generally used for the characterization of water resources. However, meteorological, agricultural, and hydrological droughts should be determined using meteorological data, such as precipitation, temperature, and wind speed, and soil data, such as soil moisture storage, runoff, evaporation, and drainage, to assess and quantify the water scarcity specifically. Changes in soil moisture content during cropping stage should be measured and monitored continuously for the most common crops in an area. Additionally, the soils analyzed for soil field capacity and wilting point to obtain drought indices and field water budget, crop water use, and soil water balance should be calculated from such databases. The common indices, such as Percent of Normal Precipitation and Standardized Precipitation Index (SPI) for different time periods and the Palmer Drought Severity Index (PDSI), can be employed [36,41]. Furthermore, a sufficient number of soil moisture sensors might need to be mounted to the area of interest to determine the amount of water in the soil profile for various ecosystems and land use types, depending on the size of the area and its homogeneity. The measurement intervals change, depending on the time of the year and the canopy size.
On the other hand, modeling opportunities, such as Integrated Valuation of Ecosystem Services and Tradeoffs (InVEST), can also be used to quantify the changes on ES indicators and assess the level of water resource availability over time [43]. Some empirical models can be used to estimate the water yields based on its relationship to some stand parameters, such as tree species mix, crown closure, basal area, mean stand diameter, number of stems, standing timber volume, and leaf area index of trees. Among these, basal area has been used as a fairly good driving parameter in determining the amount of ground water produced in forest ecosystems [44,45,46]. Water quality might also be estimated with empirical models that are based on some stand parameters, such as species composition, volume, and developmental stages [47]. These models are simplified enough to investigate the opportunity for estimating the total water yield for a catchment, depending on the data availability and compatibility.
Recreational services are defined under cultural services that are defined as the non-material benefits that people obtain from ecosystems through spiritual enrichment, cognitive development, reflection, recreation, and aesthetic experiences [1]. This definition is quite appropriate for recreational services of a landscape. Despite the fact that cultural services are consistently recognized as important, at the same time they face the problem of being characterized as intangible, subjective, and difficult to quantify, either in biophysical or monetary terms [8]. Specifically, it is quite difficult and cumbersome to translate cultural services into a more coherent and quantitative scoring to represent the recreation values. However, there are a variety of proxy measures that are available in the scientific literature that could be used at either fine scale (i.e., stand, patch) or coarse scale (i.e., forests, landscape). The concept, which relates to the abstraction and function as an umbrella term and the associated indicators, represents the level at which the landscape attributes can be measured to determine and compare scores, and they are listed, as follow [48,49,50]:
- Stewardship: It refers to the sense of care of the landscape by the society and the practitioners. This could be measured by the percentages of total forest landscape with management actions such as thinning and/or clear felling activities where residues have been left (% of area treated where residues were left).
- Naturalness/disturbances: This concept is quantified by the alteration rate of the landscape, naturalness of the stands, wilderness, and intrusion. The associated indicators that could be used are, in turn, area of final felling, naturalness of forest stands, amount of natural deadwood, and naturalness of forest edges or edge effects (size of clear cutting, % natural areas measured with Hemeroby index, % of lands with dead wood, edge density).
- Complexity: It indicates the diversity, variety and spatial pattern of stands over a landscape. The complexity is then measured by the combination of plant diversity and diversity of stands (# of different trees/stands, richness and evenness indexes), size variation (tree sizes in age class structure, stand structure), and the heterogeneity measured by the spatial distribution of stands over a landscape.
- Visual scale: It refers to the openness and visibility dimensions. Openness refers to the visual penetration measured by the number of trees and basal area. Visibility is described by the presence of understory measured by the relative amount of understory in a stand/landscape.
- Historicity/imageability: It is described by both historical richness indicated by the age of trees/stands and the presence of older stand/forests and identity indicted by the age of current land-use measured by the % of total forest landscape being afforested more than certain years ago.
- Ephemera: It refers to the seasonal changes that are reflected by the mix of stand structure (% of broadleaves, coniferous, mixed stand types)
As for biodiversity: food, water, and shelter are provided by the habitat for the survival of fauna and flora. The quantification of habitat for species is quite generic and, thus, hard to find suitable set of direct indicators to determine their relative contribution. It is important to note that there are a variety of quantification methods for the composition and configuration of habitats, such as richness, abundance, evenness, and distribution of habitats [11,19,22,27,32]. Yet, there is not any well-documented, well-accepted, and well-suited set of common methods of quantification. Thus, it can often be realized with proxy measures, such as indexes and the extent. The existing indicators generally relate to the structural and qualitative changes in habitats. However, in any case, a general framework for the quantification of “habitat for species” ES can be drafted. The practical method includes the following important steps with the appropriate categories in quantifying the habitat for species.
- First of all, biodiversity inventory needs to be in place, target species/habitat should be determined with the global/regional protection categories being identified.
- The primary components (species, habitat, and gen) of biodiversity should be clearly defined.
- The scale (gaps, stands/patches, landscape, region) needs to be identified for each biodiversity component and/or species.
- A suitable set of proxy measures/indicators need to be developed to quantify the habitat, as the direct measurement of biodiversity is difficult.
- Diversity (species diversity, richness/evenness, endemism, and turnover rate), quantity (area, abundance, and biomass), condition or spatial distribution (protection categories, red list index, fragmentation indexes, such as fractal dimension, core area index, connectivity, patch cohesion) of habitats, are to be separately measured.
- The values of the indexes need to be normalized and weighted based on the preferences of stakeholders and experts.
The primary component of the quantification process is to define a habitat for quantification. The potential habitats for biodiversity conservation include the areas that (i) have highly threatened species, (ii) contain species that are adversely affected from land use activities, such as forestry and agriculture, (iii) contain many priority conservation species, and (iv) other biodiversity elements (such as alpine and high mountain ecosystems, riparian buffers, old forests, high species richness areas, water conservation areas). The habitats for biodiversity are determined based on the requirements of the “target species”, such as endemic, threatened, and critically endangered species that are found in an area of interest. Thus, a set of biodiversity features for any area of interest can be developed, as follows:
- Areas of target species with IUCN (International Union for Conservation of Nature) categories (i.e., CR (Critically Endangered), EN (Endangered), and VU (Vulnerable))
- Areas of target species with other protection categories of IUCN
- International recognized protected areas (i.e., BERN areas, RAMSAR sites, Biosphere reserves, Natura2000 sites, World heritage sites)
- Other wetlands and riparian buffers
- Mixed stands (three or more tree species)
- Legally protected areas (Nature SIT areas etc.)
- Other protected areas, such as nature conservation areas, high conservation value forests, areas for conservation, and improvement of biodiversity
These areas are potential habitats for biodiversity conservation. Having determined the habitats, then the extent, composition, and configuration of the identified habitats in a landscape are measured with the abovementioned set of indicators to be able to quantify biodiversity.
Climate regulation, including carbon sequestration, air quality, and moderation of extreme events, is another prevailing ecosystem service within the land use or forest management planning. Climate is mostly regulated by the ecosystems through storing greenhouse gases. Carbon is sequestered by the growth of plants and trees through removing carbon dioxide from the atmosphere and effectively locking it away in their tissues [29]. The ability of an ecosystem to sequester carbon depends on the management of biomass through various land use activities.
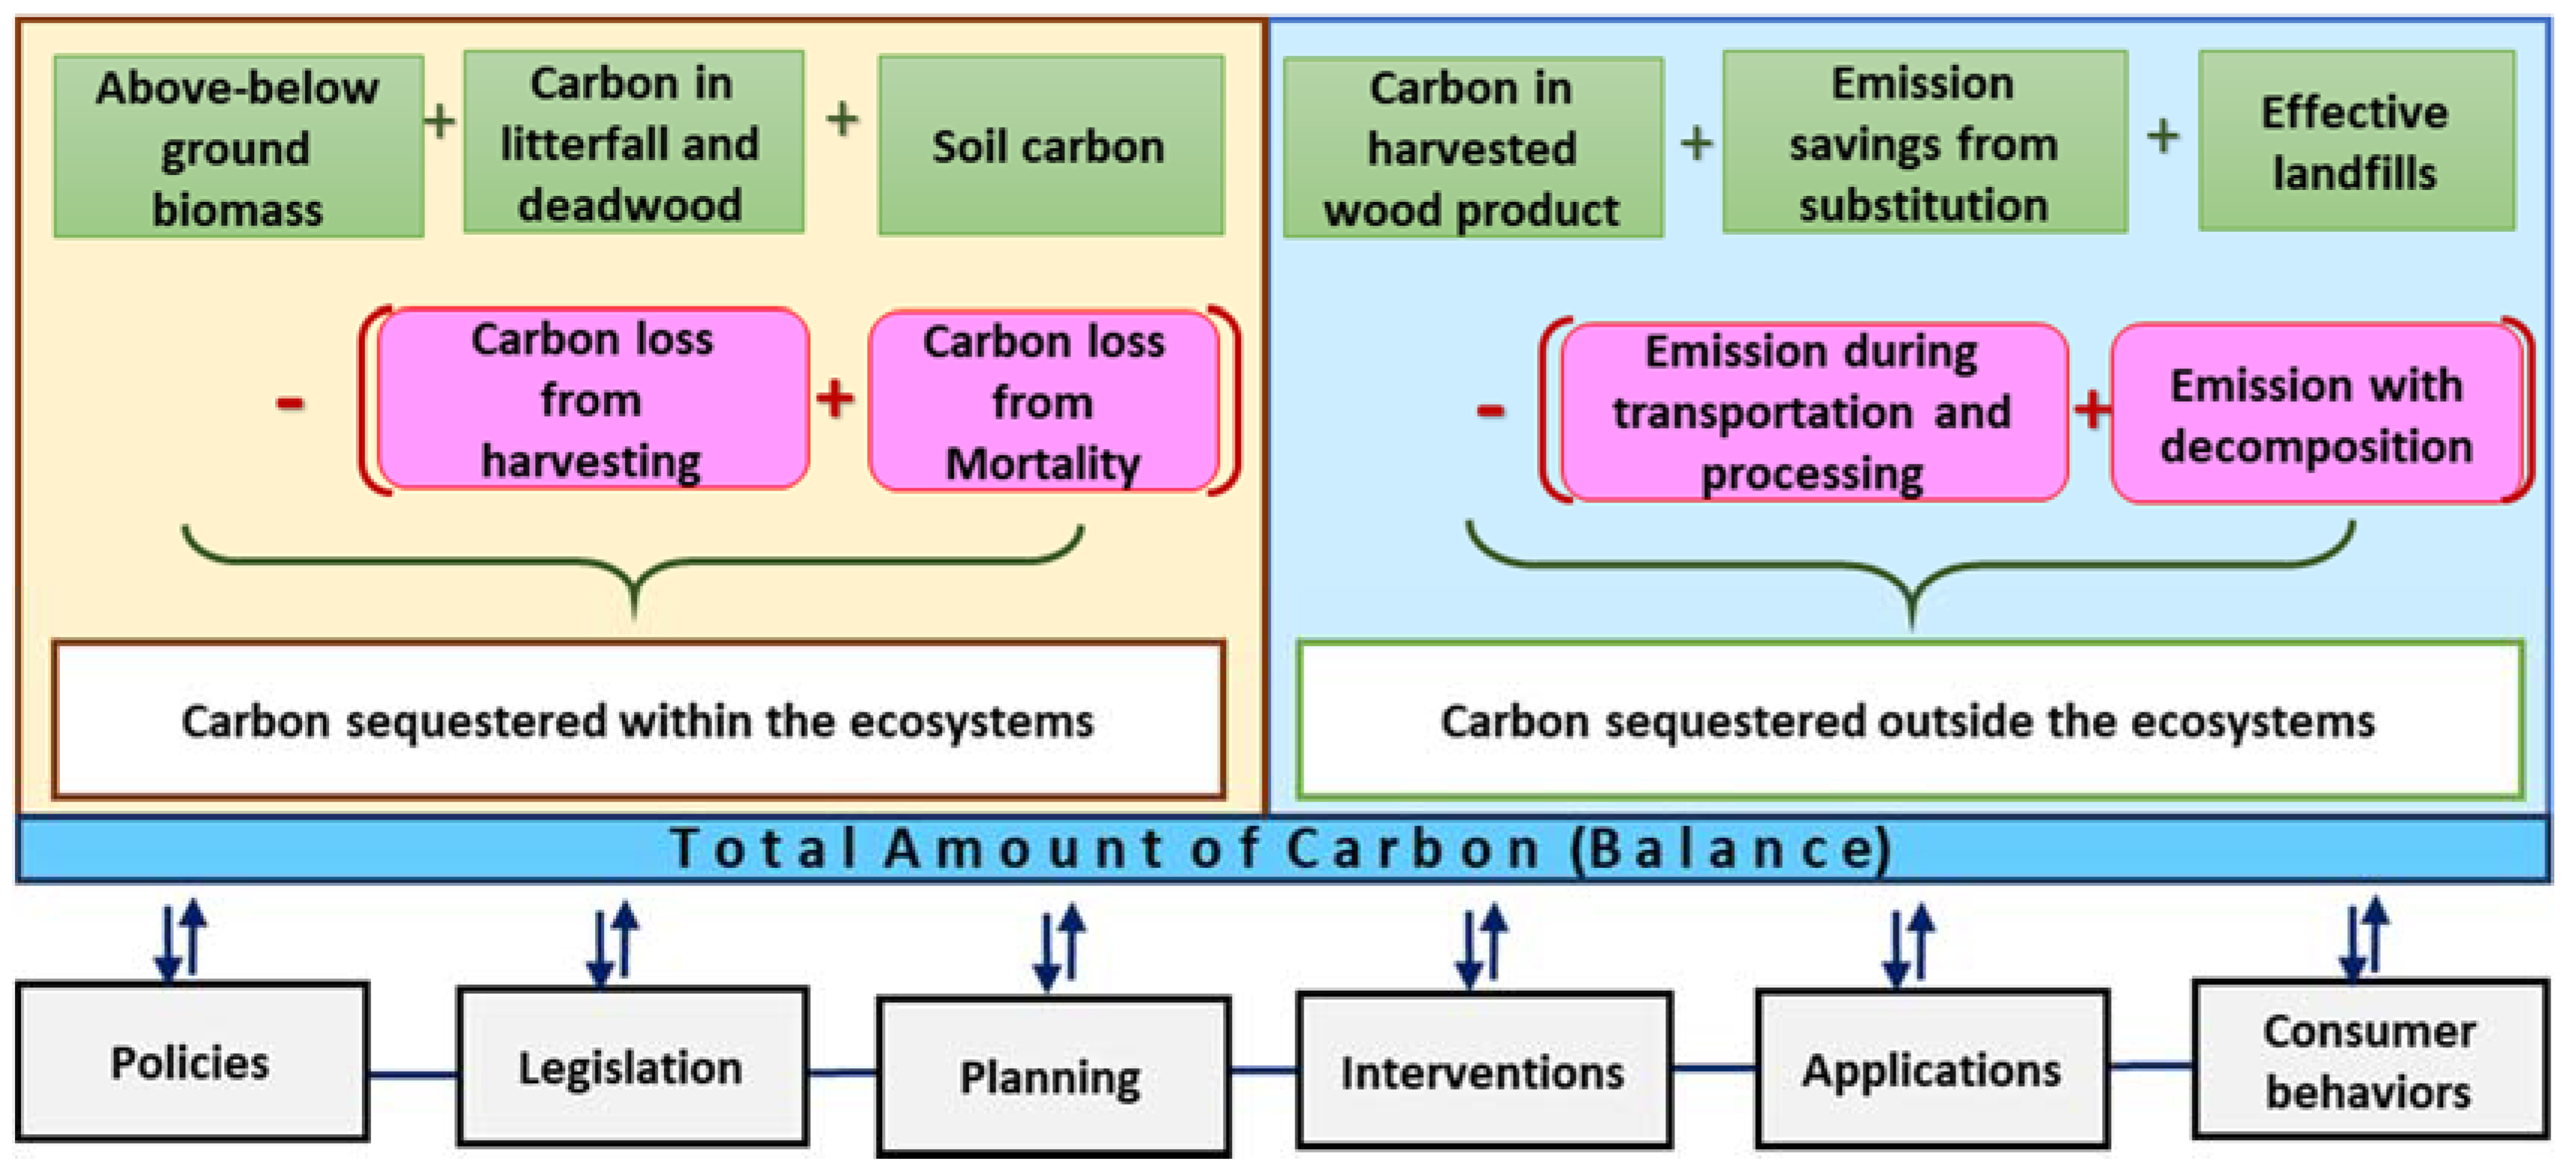
The total amount of living and dead carbon stored in ecosystem biomass, as measured in above-ground vegetation, roots, and soil, carbon emission, and net balance between ecosystem carbon gains and losses, is a widespread indicator for measuring the amount of carbon [51] (Figure 2). Specifically, there are a few carbon pools, such as above, and below-ground biomass, deadwood, litterfall, and soil within the ecosystems. Additionally, carbon also is stored indirectly outside the ecosystems, such as in harvested wood products (HWP), emission savings from wood substitution, and well managed landfills [52]. Carbon is lost with harvesting, mortality, and emissions from transportation, processing, and decomposition. In fact, carbon balance is determined with respect to the carbon gain and loss as well as various outside factors, such as policies, regulations, interventions, and consumer behaviors (Figure 2).
Based on the calculation of carbon in each pool, carbon sequestration is calculated with two primary approaches: gains and losses versus stock change [51]. The gains are estimated as the above and below ground biomass growth. Biomass losses are derived from volumes removed during harvesting operations and mortality losses. Furthermore, the transfer of carbon from biomass gains to harvest and deadwood pools is also considered in the carbon sequestration. Carbon emissions from various timber assortments are calculated based on the lifetime of each wood product while using life cycle assessment approach [53]. Carbon sequestration in HWP occurs in the storage of carbon in wood products from harvesting and from the added potential of energy substitution of energy demanding products, such as steel or cement or fossil fuel energy production [52,54].
2.3. Valuation of Ecosystem Services
The ecosystem services contribute to human wellbeing in multiple ways, such as the provision of food, fresh water, recreation, and nutrient with very strong links to security, the basic material for a good life and health [55]. Similarly, freshwater provision and natural medicines make a strong contribution to the elements of human wellbeing. The regulating services make a significant contribution to the human health through the regulation of air quality, local climate, and disease and to security through the regulation of water in particular, but also through regulating natural hazards, pests, and local climate. The cultural services make strong contribution to good social relations.
Some of these benefits, such as the amount food and wood production, can be directly translated into an economic value while using market prices. However, others, such as habitat for species, recreation, and the regulation of local air temperatures are more difficult to monetize with regard to individual households. Different techniques, such as Delphi (a forecasting process framework that is based on the results of multiple rounds of questionnaires sent to a panel of experts), questionnaire, and reflective interviews can be used when the precise analytical techniques are unable to provide solution, but can benefit from subjective judgments on a collective basis. A reflective interview involves the whole process that is conduced with the researchers who examine their subject positions in relation to participants, and examine their interview interactions systematically to inform research design. Practically, it includes how the design of research projects might be approached to ensure quality work. Such methods would allow for the identification of issues, such as income sources, trends, the status of natural resource production, products utilization patterns, market structure, and the potential pitfalls and their causes [55]. The valuation of ES is quite complicated, as it should cover consistency between conventional market accounting units and ecosystem accounting units leading naturally and necessarily to a bridge between economic and biophysical analysis [56].
It is important to clarify that the total economic value of ES (TEV) is rather a means for measuring ES stock change at a particular moment in time. It basically refers to the present value of the flow of aggregate future consumption [57] or stock/capital changes over time. The total estimates of the values of the stock changes of each of the various forms of resources are built up and then summed to calculate comprehensive wealth i.e., total economic value [58]. Furthermore, natural resources, such as forests, agriculture, and protected areas, can produce benefits in perpetuity when sustainably managed and the valuation system might need to take it into account [59]. Specifically, valuation is based on the concept that the value of an ES or the capital of change should be equal to the discounted stream of expected net earnings over time. In anyhow, measuring TEV over time can offer an important piece of information for characterizing and understanding the management process on a sustainable basis [58,59].
Whatever the method used (direct analytical method, market-ecosystem accounting or a heuristic method), the following overall simplistic formula might be used to estimate the economic value of an ES in a given area at a given moment in time. The net present values of ES may also be estimated over a longer time horizon based on an accepted discount rate. Here, it is critical to identify two parameters: the per unit (i.e., ha) ES production value and again per unit monetary value of a given ES.
where; TEV = Total Economic Value, PUEV = Per Unit Economic Value of a given ES (benefits−costs), PUMES = Per Unit Measure of a given ES, UR = Utilization rate of an area in question (%), and Area = Total area of a specific land use type.
TEV = PUEV × UR × PUMES × Area
For example, improved habitat will likely provide benefits for biodiversity. While some biodiversity benefits accumulate globally, the costs that are associated with biodiversity conservation are primarily borne by the stakeholders such as local people or institutions. Biodiversity benefits and costs accrue at various levels and in various forms, like [60]:
- Government budget gains from a range of taxes and license fees accruing from biological resource utilization and biodiversity-related tourism.
- National economy with the goods and services associated with biological resources and their diversity make a significant contribution to economic growth (e.g., output and income, foreign exchange earnings, employment generation in forestry, agriculture and tourism).
- Commercial profit from using the biological resources (any commercial activities related to the use of biological resources).
- Household livelihoods receive benefits (indigenous crop, agricultural output, energy input, maintenance of soil fertility by avoiding soil erosion, agro-biodiversity significantly enhances the security of rural farming systems, benefits from NWFP) while using the biological resources.
- Global community receives benefits (tourism, carbon sequestration, resource export, investment support from national and international organizations) from the conservation of biodiversity resources and their diversity.
Setting aside lands for habitat of biodiversity and providing (human and infrastructure) resources to protect those lands bear some additional or opportunity costs that could be used to indirectly value biodiversity. For example, the impacts of deforestation that arise from unsustainable wood/fuelwood consumption, soil and water degradation arising from clearance of catchments or poor agricultural land management practices or land and water pollution caused by industry or urban settlements are felt by downstream populations.
The land values indirectly affect the value of protected areas, which is estimated as the opportunity cost of the lowest-value land in a country [60]. The items of opportunity costs that are associated with biodiversity conservation, for instance, can be listed, as follows [3]:
- The direct costs for investment on biodiversity conservation projects and programmes (agencies, planning/monitoring, training and information, protected area management, land restoration with forestation, enforcement of biodiversity legislation and rulings).
- The indirect costs that are associated with foregoing resource uses for economic activities on forest resources to achieve biodiversity conservation targets. The opportunity costs associated with reducing resource use level (reducing annual allowable cut, reducing firewood production). The opportunity cost in terms of utilization possibilities foregone as a result of reservation, resource protection, and human exclusion from the areas designated for biodiversity conservation one way or another—Loss of productive land and resources.
- The indirect costs of replacing the effects of agricultural, industrial, and urban activities to biodiversity. The costs that are associated with mitigation of the effects of industrial technologies and production processes (mining, oil refining, and various water and energy-consuming production processes). The costs that are associated with urban and industrial waste treatment. The additional measures proposed for improving waste disposal and management processes are also envisioned as additional opportunity costs for protecting areas for biodiversity conservation.
- Any other indirect costs regarding protecting natural resources for providing habitat for biodiversity conservation.
In summary, it is quite complicated to directly value the costs and benefits of most of the ES, such as habitats for biodiversity conservation and recreational opportunities. However, where direct method fails indirect methods, such as the ones that are mentioned above, can help to initiate the valuation process for various ES. In fact, there are a variety of valuation methods (i.e., avoided cost, CVM, opportunity cost, hedonic pricing, etc.) with advantages and disadvantages that can be used in estimating the value of the various ES [55]. However, hybridizing approaches may overcome the disadvantages of particular valuation methods [61].
2.4. Assessment and Monitoring Ecosystem Services
The ecosystem services are directly affected by the land use activities along with the natural disturbances. The type, intensity, duration, and location of these activities are the main attributes to consider in developing a monitoring system. Thus, it is highly crucial to monitor the activities with their attributes in various land use types, such as forest, rangeland, wetland, and agriculture. The general framework of developing ES monitoring indicators involves the identification of ES, target stakeholders, policy objectives, key concerns, and the possible indicators. Subsequently, the data are collected for each indicator and assessed to communicate the changes to the stakeholders. The process is limited by the potential constraints regarding time, resources and capacity.
First of all, an effective monitoring system needs to accommodate a set of monitoring indicators. Second, data that are associated with each indicator should be regularly collected. National statistics, remote sensing, and field measurements or observations are the common source of data to collect and compile for an effective monitoring system. Third, the regularly collected data are evaluated in terms of the status of ES. Fourth, the assessment of ES with the indicators by linking supply to service and benefits will provide a better picture of the consequences of ES for human wellbeing. Fifth, market conditions, including prices, cost of production, changes in human demand, and government subsidies should be followed up in regular bases and possible impacts should be foreseen for all ES. Finally, the appropriate decisions are made to develop the implementation status of activities in each land use type.
Based on the general process, an effective monitoring system should be able to accommodate important components. This is a broad proposed list of monitoring of the changes of ES with respect to disturbances and stakeholder’s involvement:
- The appropriate list of monitoring indicators should be developed and the data that are associated with each indicator should be regularly collected. Satellite systems need to be effectively used as the system produces up-to-date data on a consistent scale and time for a large coverage of landscape.
- Various land use plans such as forest management plans, grazing plans, protected area management plans and action plans should be regularly renewed and up-to-date information is to be generated.
- The level, types, location, and the intensities of all land use activities should be recorded systematically.
- Database in each land use category need to be developed and regularly updated and be consistent, sustainable, affordable, and accessible to the users.
- Management of database and metadata is required for effective use of the database.
- Market conditions for certain ES should also be monitored with economic indicators.
- Establishment of institutional and technical capacities is necessary.
- The responsibility of monitoring indicators for each ES should be clarified and given to a certain institution to maintain and sustain the monitoring system.
A suitable set of monitoring indicators is necessary for assessing the changes with regard to nature’s benefits to the society in order to enable monitoring ES. A monitoring indicator is information that efficiently communicates the characteristics, trends and rate of changes of ES to the user, decision makers, and policymakers. In practice, there are often composite indicators of measurements of the supply and the use/demand of a benefit provided by an ecosystem. For example, water scarcity indicator combines the measurement of water availability and demand, and describes their ratio. In fact, the development of indicators requires extensive work to identify basic characteristics before their use in monitoring ES. The indicators have to be relevant to the issue, transparent and understandable, sensitive to changes, scientifically sound, and practically feasible [62,63,64,65,66]. In the meantime, the stakeholders’ views, risk assessment, and feedback process are also important components of the monitoring process. As well, measures of wellbeing as outcome of ecosystem planning process, as outlined in Figure 1, are therefore a primary candidate for monitoring process.
Finding the right monitoring indicator combination (or composite indicator) is an exercise of comparing and skillfully combining data options and practicalities with specific information needs [29]. The indicators are basically designed to measure the supply/provision and the demand/need of the related ES in a given area. For example, vegetation cover, water yield, water flux (rainfall, evapotranspiration, streamflow), water use/demand by all sectors, sediment load, treatment and maintenance cost, and market value of water use are good indicators for monitoring water provision. Likewise, living and dead carbon in all carbon pools (i.e., above-below ground, litterfall, soil, harvested wood products), carbon loss (i.e., harvesting, deadwood, deforestation, conversation), market value of carbon credits and avoided emissions are some prevailing indicators for monitoring changes in carbon sequestration. Vegetation cover, sediment load, precipitation, erosion hazard category, land use changes, and soil type are some indicators for monitoring erosion. Likewise, habitat structure (forest area, areas in development stages, forest loss, old growth forests etc.), forest fragmentation, protected areas, water bodies, hunters, gen reserves, rate and intensity of forest harvesting, and population dynamics on target species are prevailing indicators for monitoring the changes of habitats for biodiversity. The monitoring indicators may need to be regularly verified with the reliable source of data, responsible institutions, and verification measures.
2.5. Integration of Ecosystem Services to Management Plans
The ultimate goal of managing ecosystem services is the wellbeing of society based on sustainable ecosystem management principles [57,58,59]. However, it becomes a highly challenging process when more ES, some of which contradict, are involved in the preparation of ecosystem management plans. On one hand, the integration process requires the identification of policies, regulations, market conditions, and objectives for the integrated management of ES in a management plan. On the other hand, a smart and a comprehensive decision support systems (DSS) is needed to forecast the future conditions of ecosystems and provide necessary information for better decisions among alternative management strategies with multiple ES. A DSS refers to a wide collection of software tools that can be efficiently used together to improve the decision-making process by helping to integrate better information into the planning and evaluation of decision alternatives. Specifically, a DSS facilitates enabling the environment to help a decision-maker to determine goals, objectives, and priorities, formulate alternative options, analyze options, and evaluate potential consequences for better trade-off among alternatives. The basic role of DSS is to provide information and knowledge base to decision-makers in an effective, efficient manner that accelerates the decision making process [20,60,61,62,63,64,65]. Coupled with a structured participation of multiple stakeholders, both components constitute the integrated process of management planning for multiple objectives and conservation targets.
The integration of ecosystem services into the management plan ultimately involves the due consideration of the vision, insights, and interest of the major stakeholders. The actors have certain power resources, interests, and/or responsibilities in developing policies, making decisions, and ultimately managing natural resources. A structured participation is essential in integrating multiple ES in the management process in order to consider and reconcile various rights, interests, and responsibilities. Thus, a participatory approach is necessary that involves a few steps in the integration of ES to the management planning. First of all, stakeholders are identified. Actors include local and county agencies, forest industries and associations, scientists, local politicians, and several other non-profit organizations. Awareness is created following the identification of stakeholders. Information regarding the existence and the market value of the ES along with any incentives or opportunities in extracting an ES from the landscape is crucial step in the participation process. Ownership history, present and future management goals, opinion on forest management activities, management tradition, legislation, local conflicts, cooperation, and networking are factors to be considered in the process. The third stage involves the discussion and decision making process through means, such as direct meetings, interviews, and questionnaires. Using quantitative methods in the participatory situation, fostering discussion qualities and securing representation and increasing motivation for participation are necessary in the participatory process of management planning. Finally, sharing rights and responsibilities among the stakeholders provides the basis for accountable management decisions and associated actions on the ground.
The following stepwise approach briefly describes the ecosystem management process that accommodates stakeholder’s views in a participatory approach [20,27]:
- First of all, management objectives involving the expected combination of ES, conservation targets, the scope, and the key stakeholder are identified.
- Ecosystem inventory is conducted, the relevant ES to the planning process are determined and prioritized by the key stakeholders based on demand and market conditions.
- Key drivers regarding the policies, strategies, regulations, and informal rules affecting the ES are analyzed.
- Per area provisional characteristics (i.e., productivity) of each ES is determined based on the functional relationships between ecosystem composition (i.e., stand parameters) and the characteristics of each ES.
- Trade-off analyses are conducted with appropriate decision making tools (i.e., decision support systems) and the best set of management interventions and better provision of the suitable set of ES among many alternatives are selected.
- The output of modeling and decision-making exercise is assessed with the involvement of stakeholders in choosing the suitable management option for a better combination of ES for implementation.
Linkages between ecosystems and the management objectives that are determined by the demand/benefits of society through the use of ES is important in making appropriate mix or tradeoffs among the ecological, economical and sociocultural services. Management strategies should encompass both temporal and spatial aspects of ES within the management interventions aside from the policy measures and regulations. The normalization and prioritizing of various ES in management planning process need to be realized to reflect the perceptions of key stakeholders. By all means, understanding the cause and effect relationships between the provisional level of each ES and the development of ecosystems over time is essential in understanding forest dynamics to improve the decision making process.
3. Discussions and Conclusions
A solo timber production oriented forest management planning process is no longer a valid approach, as it merely schedules the flow of timber production. The conventional framework is unable to represent how various ES are to be integrated into the planning process. However, ecosystems provide many goods and services that people desire to benefit from. Thus, this paper proposes a framework that refers to the process of managing ES within the ecosystem management concept that considers the whole basket of ecosystem goods and services as the appropriate approach to follow in the ecosystem management planning [64,67,68]. It is vital to understand the necessary components and develop a sound characterization procedure before integrating ES into the planning process in order to obtain the benefit from the full spectrum of ES. A variety of qualitative and quantitative methods can assess the ability of ecosystems to deliver multiple services.
The paper provided a systematical procedure of the integration process: identification, quantification, valuation, and monitoring of the ecosystem services in a planning context. While the discussion on the common classification of ecosystem services is ongoing, MEA and TEEB provided a good basis for the classification of ecosystem services into the categories of provisioning, regulating, supporting, and cultural around economical, ecological, and socio-cultural themes of functions [2,64]. Although the classification system has been increasingly widely adopted, some argued that the classification of services might not be the most appropriate for monetary assessments due to the risk of double counting and the problems related to the secondary use of valuation estimates, as a consequence of service overlapping and service ambiguity [69]. As such, CICES 5.1 avoided the use of supporting services, as they are regarded to be intermediate services to support final services [24]. According to Heink and Jax [12], the conceptual framework and the cascade model provided by Haines-Young and Potschin [24] acts as an organizing structure and serves as a model for the valuation of ecosystems in terms of their contribution to human wellbeing.
The quantification of five prevailing and common ecosystem services was presented within the context of the paper. A set of measurements, based on the relevant and accepted methods, is needed to capture the relationships between the ecosystems and benefits that they provide, and be convertible into monetary terms. However, it is still cumbersome to provide a universally accepted clear measurement of regulating, supporting, and cultural services. The valuation of ES should include both benefits (direct and indirect) incurred and the societal costs, like missed opportunities of alternative uses. A hybrid of valuation approaches might be used in estimating the value of the various ES. The integration into management planning requires well designed modeling approaches to be able to forecast future conditions and, thus, evaluate the relative effects of acquiring ES under various management actions. A DSS is indispensable to make the appropriate tradeoffs among management alternatives with various sets of ES and stakeholders. Furthermore, assessments of ES on the wellbeing of society should integrate an analysis of the risks and uncertainties, as well as the reflections of the stakeholders. Here, ecological economic perspective for assessing ES could play an important role in investigating the interplay between ecological and socio-economic systems [70].
Before the integration of the ecosystem services, the first crucial aspect of ES within the framework of management planning is to assess clearly the quality and quantity of benefits generated by the ES. A transparent participatory approach is required to capture and make available knowledge to the stakeholders particularly to the decision makers in order to facilitate comparability of assessment results, as well as transparency and accountability of the integration process [71]. Identifying the purpose of the management of ES, scoping the process, recognizing the pluralistic valuation, integrating multi-criteria analysis with multiple stakeholders, and communicating on values are critical steps in providing relevant basis for understanding the use of a mix of services to the wellbeing [71,72]. Based on the stakeholder analysis, it can only be decided whether it is worthwhile to consider ES in a planning process. A second aspect is to find out the stakeholders that benefit from the ES. This aspect helps to identify the valid management objectives along with the development or ratification of appropriate policies and regulations in effect. The third aspect is to evaluate the impacts of development and/or land use activities on the supply of ES. Here, a cause and effect relationship is established by evaluating various mix of management options to assess the trade-offs (ecological, economic and socio-cultural) among various management scenarios accommodating relative levels of ES. These aspects of managing forest ecosystems for multiple ecosystem goods and services are meaningful in a comprehensive planning approach.
Accommodating the full spectrum of existing ecosystem services in a forest landscape requires a commitment and vision in planning. The success depends highly on the strong willingness of the decision makers to adopt related policies, regulations, and management objectives in planning. Characterizing and understanding the value of ES play an important role in setting policy directions for ecosystem management leading to the provision of ES and their contribution to human wellbeing. Developing right policies with the appropriate regulations at the start will provide the basis and activate the implementation for ES integrated management on the ground. Knowledge, wisdom, capacity, and insight of decision makers all help to better formulate the appropriate policies for a sound framework and implementation of integrated management of multiple ES. Local and global case studies are critical in showcasing the value of ES (e.g., high-income and good-health) for the wellbeing of society. Developing strong policies in accordance with the world sustainable development goals can restore ES and improve sustainable wellbeing [10]. The sustainable management of ES and dis-services in various land uses (e.g., agriculture [26]) requires research that is policy-relevant [73], multidisciplinary [71], and collaborative. However, lack of data and technical capacity as well as limited understanding hinders the success of implementing the planning process accommodating the ES.
There are some challenges that are related to the ecosystem framework proposed here. These are: (i) sustainable ecosystem management to harmonize the provision of multiple ES, (ii) effective governance and regulations to maintain and restore ecosystem functions required by society, (iii) competitiveness between the cost of interventions and the benefits or opportunities for wealth creation, and (iv) valuation and assessment of trade-offs, synergies, and conflicting interests for human wellbeing.
There are a few caveats to consider during the management of forest ecosystems for multiple ecosystem goods and services. Establishing the functional relationships between the ecosystems and the human benefits is essential. The per unit value of each ES should be explicit at appropriate scales that are meaningful for model development and policy formation. A large set management strategy should be developed to assess the ecosystem dynamics with both the value of ES and the costs of actions—a trade-off analysis required. The cost and benefit analysis of each ES in terms of ecological economics perspective and marketing is essential. It is also critical to forecast the economic value of ES with equal rigor to their biophysical relationships to evaluate the trade-offs and inform policy decision. Risk and uncertainty are always critical aspects in the development of management plans and assessment of forest ecosystem dynamics.
Funding
This research received no external funding.
Acknowledgments
I would like to extend my special thanks to ANÇEO Ltd. consulting firm and anonymous reviewers for offering valuable feedbacks and suggestions.
Conflicts of Interest
The author declares no conflict of interest.
References
- MEA. A report of the millennium ecosystem assessment. In Ecosystems and Human Wellbeing: Synthesis; Island Press: Washington, DC, USA, 2005. [Google Scholar]
- Costanza, R.; de Groot, R.; Braat, L.; Kubiszewski, I.; Fioramonti, L.; Sutton, P.; Farber, S.; Grasso, M. Twenty years of ecosystem services: How far have we come and how far do we still need to go? Ecosyst. Serv. 2017, 28, 1–16. [Google Scholar] [CrossRef]
- TEEB. The Economics of Ecosystems and Biodiversity: Ecological and Economic Foundations; Kumar, P., Ed.; Earthscan: London, UK; Washington, DC, USA, 2010. [Google Scholar]
- Alcamo, J.; Ash, N.J.; Butler, C.D.; Callicot, J.B.; Capistrano, D.; Carpenter, S.R. Ecosystems and Human WellBeing: A Framework for Assessment; Island Press: Washington, DC, USA, 2003. [Google Scholar]
- Barten, P.; Jones, J.; Achterman, G. Hydrologic Effects of a Changing Forest Landscape; National Academies Press: Washington, DC, USA, 2008; 180p. [Google Scholar]
- Winkler, R.; Spittlehouse, D.; Boon, S. Streamflow response to clear-cut logging on British Columbia’s Okanagan Plateau. Eco-Hydrol. 2017, 10, 1–15. [Google Scholar] [CrossRef]
- Maes, J.; Teller, A.; Erhard, M.; Liquete, C.; Braat, L.; Berry, P.; Egoh, B.; Puydarrieux, P.; Fiorina, C.; Santos, F. Mapping and Assessment of Ecosystems and their Services. Anal. Framew. Ecosyst. Assess. Action 2013, 5, 1–58. [Google Scholar] [CrossRef]
- Daniel, T.C.; Muhar, A.; Arnberger, A.; Aznar, O.; Boyd, J.W.; Chan, K.M.; Grêt-Regamey, A. Contribution of cultural services to the ecosystem services agenda. Proc. Natl. Acad. Sci. USA 2012, 109, 8812–8819. [Google Scholar] [CrossRef] [Green Version]
- Costanza, R.; d’Arge, R.; de Groot, R.; Farber, S.; Grasso, M.; Hannon, B.; Limburg, K.; Naeem, S.; Oneill, R.V.; Paruelo, J.; et al. The value of the world’s ecosystem services and natural capital. Nature 1997, 387, 253–260. [Google Scholar] [CrossRef]
- Kubiszewski, I.; Anderson, S.J.; Costanza, R.; Sutton, P.C. The future of ecosystem services in Asia and the Pacific. Asia Pac. Policy Stud. 2016, 3, 389–404. [Google Scholar] [CrossRef] [Green Version]
- Sukhdev, P. Corporation 2020: Transforming Business for Tomorrow’s World; Island Press: Washington, DC, USA, 2012; ISBN 978-1610912389. [Google Scholar]
- Heink, U.; Jax, K. Going Upstream-How the purpose of a conceptual framework for ecosystem services determines its structure. Ecol. Econ. 2019, 156, 264–271. [Google Scholar] [CrossRef]
- Costanza, R.; de Groot, R.; Sutton, P.; der Ploeg, S.V.; Anderson, S.J.; Kubiszewski, I.; Farber, S.; Turner, K. Changes in the global value of ecosystem services. Glob. Environ. Chang. 2014, 26, 152–158. [Google Scholar] [CrossRef]
- Vacik, H.; Lexer, M.J.; Lexer, M.J. Application of a spatial DSS in managing the protection forests of Vienna for sustained yield of water resources. For. Ecol. Manag. 2001, 143, 65–76. [Google Scholar] [CrossRef]
- Bettinger, P.; Holliday, C.P.; Threadgill, M.S.; Hyldahl, C.A. On integrating water yield models with forest planning efforts. Water Policy 2007, 9, 631–643. [Google Scholar] [CrossRef]
- Baskent, E.Z.; Keles, S. Developing alternative forest planning strategies incorporating timber, water and carbon values: An examination of their interactions. Environ. Model. Assess. 2009, 14, 467–480. [Google Scholar] [CrossRef]
- Baskent, E.Z.; Kucuker, D.M. Incorporating Water Production and Carbon Sequestration into Forest Management Planning: A Case Study in Yalnızçam Planning Unit. For. Syst. 2010, 19, 98–111. [Google Scholar] [CrossRef] [Green Version]
- Pukkala, T. Does biofuel harvesting and continuous cover management increase carbon sequestration? For. Policy Econ. 2014, 43, 41–50. [Google Scholar] [CrossRef]
- Ezquerro, M.; Pardos, M.; Diaz-Balteiro, L. Operational research techniques used for addressing biodiversity objectives into forest management: An overview. Forests 2016, 7, 229. [Google Scholar] [CrossRef] [Green Version]
- Borges, J.G.; Marques, S.; Garcia-Gonzalo, J.; Rahman, A.U.; Bushenkov, V.; Sottomayor, M.; Carvalho, P.O.; Nordstrom, E.M. A Multiple Criteria Approach for Negotiating Ecosystem Services Supply Targets and Forest Owners’ Programs. For. Sci. 2017, 63, 49–61. [Google Scholar] [CrossRef]
- Kurttila, M.; Pukkala, T.; Miina, J. Synergies and trade-offs in the production of NWFPs predicted in boreal forests. Forests 2018, 9, 417. [Google Scholar] [CrossRef] [Green Version]
- Marto, M.; Reynolds, K.; Borges, J.; Bushenkov, V.; Marques, S. Combining Decision Support Approaches for Optimizing the Selection of Bundles of Ecosystem Services. Forests 2018, 9, 438. [Google Scholar] [CrossRef] [Green Version]
- De Groot, R.S.; Wilson, M.A.; Boumans, R.M.J. A typology for the classification, description and valuation of ecosystem functions, goods and services. Ecol. Econ. 2002, 41, 393–408. [Google Scholar] [CrossRef] [Green Version]
- Haines-Young, R.; Potschin, M.B. Common International Classification of Ecosystem Services (CICES) V5.1 and Guidance on the Application of the Revised Structure, 2018. Available online: http://www.cices.eu (accessed on 23 August 2019).
- Ekins, P.; Simon, S.; Deutsch, L.; Folke, C.; De Groot, R. A framework for the practical application of the concepts of critical natural capital and strong sustainability. Ecol. Econ. 2003, 44, 165–185. [Google Scholar] [CrossRef] [Green Version]
- Zhang, W.; Ricketts, T.H.; Kremen, C.; Carney, K.; Swinton, S.M. Ecosystem services and dis-services to agriculture. Ecol. Econ. 2007, 64, 253–260. [Google Scholar] [CrossRef] [Green Version]
- Başkent, E.Z.; Başkaya, Ş.; Terzioğlu, S. Developing and implementing participatory and ecosystem based multiple use forest management planning approach (ETÇAP): Yalnızçam case study. For. Ecol. Manag. 2008, 256, 798–807. [Google Scholar] [CrossRef]
- Crossman, N.D.; Burkhard, B.; Nedkov, S.; Willemen, L.; Petz, K.; Palomo, I.; Drakou, E.G.; Martín-Lopez, B.; McPhearson, T. A blueprint for mapping and modelling ecosystem services. Ecosyst. Services 2013, 4, 4–14. [Google Scholar] [CrossRef]
- Berghöfer, A.; Schneider, A. Indicators for Managing Ecosystem Services-Options & Examples. ValuES Project Report; Helmholtz Zentrum für Umweltforschung (UFZ) GmbH: Leipzig, Germany; Deutsche Gesellschaft für Internationale Zusammenarbeit (GIZ) GmbH: Eschborn, Germany, 2015; 49p. [Google Scholar]
- Kozak, R.A.; Spetic, W.C.; Harshaw, H.W.; Maness, T.C.; Sheppard, S.R.J. Public priorities for sustainable forest management in six forest dependent communities of British Columbia. Can. J. For. Res. 2009, 38, 3071–3084. [Google Scholar] [CrossRef]
- Nordstrom, E.M.; Eriksson, L.O.; Ohman, K. Integrating multiple criteria decision analysis in participatory forest planning: Experience from a case study in northern Sweden. For. Pol. Econ. 2010, 8, 562–574. [Google Scholar] [CrossRef] [Green Version]
- Eriksson, S.; Hammer, M. The challenge of combining timber production and biodiversity conservation for long-term ecosystem functioning-A case study of Swedish boreal forestry. For. Ecol. Manag. 2006, 237, 208–217. [Google Scholar] [CrossRef]
- Wallin, I.; Carlsson, J.; Hansen, H.P. Envisioning future forested landscapes in Sweden-Revealing local-national discrepancies through participatory action research. For. Policy Econ. 2016, 73, 25–40. [Google Scholar] [CrossRef] [Green Version]
- Hengsdijk, H.; Meijerink, G.; Mosugu, M. Modeling the effect of three soil and water conservation practices in Tigray, Ethiopia. Agric. Ecosyst. Environ. 2005, 105, 29–40. [Google Scholar] [CrossRef]
- Teklewold, H.; Kassie, M.; Shiferaw, B. Adoption of multiple sustainable agricultural practices in rural Ethiopia. J. Agric. Econ. 2013, 64, 597–623. [Google Scholar] [CrossRef]
- Renard, K.G.; Foster, G.R.; Weesies, G.A.; McCool, D.K.; Yoder, D.C. Predicting Soil Erosion by Water: A Guide to Conservation Planning with the RUSLE; Agricultural Handbook No. 703; US Department of Agriculture: Washington, DC, USA, 1997.
- Torri, D.A.; Poesen, J.B.; Borselli, L. Predictability and uncertainty of the soil erodibility factor using a global dataset. Catena 1997, 31, 1–22. [Google Scholar] [CrossRef]
- Boardman, J.; Poesen, J. Soil Erosion in Europe; Wiley: New York, NY, USA, 2006. [Google Scholar]
- Nodvin, S.C.; Driscoll, C.T.; Likens, G.E. Soil Processes and Sulfate Loss at the Hubbard Brook Experimental Forest. Biogeochemistry 1988, 5, 185–199. [Google Scholar] [CrossRef]
- Hubbart, J.A.; Link, T.E.; Gravelle, J.A.; Elliot, W.J. Timber harvest impacts on water yield in the continental/maritime hydroclimatic region of the United States. For. Sci. 2007, 53, 169–180. [Google Scholar]
- Díaz, M.F.; Bigelow, S.; Armesto, J.J. Alteration of the hydrologic cycle due to forest clearing and its consequences for rainforest succession. For. Ecol. Manag. 2007, 244, 32–40. [Google Scholar] [CrossRef]
- Tipping, E.; Rowe, E.; Evans, C.D.; Mills, R.T.; Emmett, B.A.; Chaplow, J.; Hall, J.R. N14C: A plant–Soil nitrogen and carbon cycling model to simulate terrestrial ecosystem responses to atmospheric N deposition. Ecol. Model. 2012, 247, 11–26. [Google Scholar] [CrossRef] [Green Version]
- Sharp, R.; Tallis, H.; Ricketts, T.; Guerry, A.; Olwero, N.; Wolny, S.; Vigerstol, K.; Pennington, D.N.; Mendoza, G.; Aukema, J.; et al. VEST User’s Guide; The Natural Capital Project; Stanford University, University of Minnesota, The Nature Conservancy, and World Wildlife Fund: Stanford, CA, USA, 2018. [Google Scholar]
- Tecle, A.; Shrestha, B.P.; Duckstein, L. A multi-Objective decision support system for multi-resource forest management. Group Decis. Negot. 1998, 7, 23–40. [Google Scholar] [CrossRef]
- Kucuker, D.M.; Başkent, E.Z. Incorporating water production into forest management planning: A case study in Yalnizcam planning unit. Int. J. Glob. Warm. 2010, 2, 292–304. [Google Scholar] [CrossRef]
- Keles, S.; Başkent, E.Z. Joint production of timber and water: A case study. Water Policy 2011, 13, 535–546. [Google Scholar] [CrossRef]
- Zengin, H. Optimization of Multiple Use Based on Multi-Objective Forest Management Planning Approach (Orman kaynaklarından fonksiyonel yaklaşımı ile çok amaçlı faydalanmanın optimizasyonu). Ph.D. Thesis, Graduate School of Applied Science, İstanbul University, Istanbul, Turkey, 2006. [Google Scholar]
- Tveit, M.; Ode, Å.; Fry, G. Key concepts in a framework for analyzing visual landscape character. Landsc. Res. 2006, 31, 229–255. [Google Scholar] [CrossRef]
- Edwards, D.; Jay, M.; Jensen, F.S.; Lucas, B.; Marzano, M.; Montagné, C.; Weiss, G. Public preferences for structural attributes of forests: Towards a pan-European perspective. For. Policy Econ. 2012, 19, 12–19. [Google Scholar] [CrossRef]
- Adamowicz, W.L.; Naidoo, R.; Nelson, E.; Polasky, S.; Zhang, J. Nature-Based Tourism and Recreation; Kareiva, P., Daily, G., Ricketts, T., Tallis, H., Polasky, S., Eds.; Natural Capital: Theory and Practice of Mapping Ecosystem Services; Oxford University Press: New York, NY, USA, 2011. [Google Scholar]
- IPCC. 2006 IPCC Guidelines for National Greenhouse Gas Inventories; Prepared by the National Greenhouse Gas Inventories Programme; Eggleston, H.S., Buendia, L., Miwa, K., Ngara, T., Tanabe, K., Eds.; GES: Hayama, Japan, 2006. [Google Scholar]
- Sathre, R.; O’Connor, J. Synthesis of Research on Wood Products and Greenhouse Gas Impacts, 2nd ed.; Technical Report No. TR-19R; FPInnovations: Vanvouver, BC, Canada, 2010; 117p. [Google Scholar]
- Helin, T.; Sokka, L.; Kim Pingoud, S.; Pajula, T. Approaches for inclusion of forest carbon cycle in life cycle assessment-A review. GCB Bioenergy 2013, 5, 475–486. [Google Scholar] [CrossRef]
- Oliver, C.D.; Nassar, N.T.; Lippke, B.R.; McCarter, J.B. Carbon, fossil fuel, and biodiversity mitigation with wood and forests. J. Sustain. For. 2014, 33, 248–275. [Google Scholar] [CrossRef]
- Masiero, M.; Pettenella, D.; Boscolo, M.; Barua, S.K.; Animon, I.; Matta, J.R. Valuing Forest Ecosystem Services: A Training Manual for Planners and Project Developers; Forestry Working Paper No. 11; FAO: Rome, Italy, 2019. [Google Scholar]
- Boyd, J.; Banzhaf, S. What are ecosystem services? The need for standardized environmental accounting units. Ecol. Econ. 2007, 63, 616–626. [Google Scholar] [CrossRef] [Green Version]
- Arrow, K.J.; Dasgupta, P.; Goulder, L.H.; Mumford, K.J.; Oleson, K. Sustainability and the measurement of wealth. Environ. Dev. Econ. 2012, 17, 317–353. [Google Scholar] [CrossRef] [Green Version]
- Bruntland Commission. Our Common Future. The World Commission on Environment and Development; UN Documents; Oxford University Press: Oxford, UK, 1987. [Google Scholar]
- Lange, G.-M.; Wodon, Q.; Carey, K. The Changing Wealth of Nations 2018: Building a Sustainable Future; World Bank: Washington, DC, USA, 2018. [Google Scholar]
- Emerton, L.; Asrat, A. Eritrea Biodiversity: Economic Assessment; Prepared with the Department of Environment, Ministry of Land, Water and Environment, as part of the Eritrea National Biodiversity Strategy and Action Plan by IUCN; IUCN: Gland, Switzerland, 1998. [Google Scholar]
- Pascual, U.; Muradian, R. Chapter 5. The economics of valuing ecosystem services and biodiversity. TEEB Doc. 2010. [Google Scholar] [CrossRef]
- Bettinger, P.; Chung, W. The key literature of and trends in forest-level management planning in North America, 1950–2001. Int. For. Rev. 2004, 6, 40–50. [Google Scholar] [CrossRef]
- Pukkala, T.; Kurttila, M. Examining the performance of six heuristic optimization techniques in different forest planning problems. Silva Fenn. 2005, 39, 67–80. [Google Scholar] [CrossRef] [Green Version]
- Başkent, E.Z. A review of the development of the multiple use forest management planning concept. Int. For. Rev. 2018, 20, 296–313. [Google Scholar] [CrossRef]
- Kangas, J.; Kangas, A. Multiple criteria decision support in forest management-The approach, methods applied, and experiences gained. For. Ecol. Manag. 2009, 207, 133–143. [Google Scholar] [CrossRef]
- Brown, C.; Reyers, B.; Ingwall-King, L.; Mapendembe, A.; Nel, J.; O′Farrell, P.; Dixon, M.; Bowles-Newark, N.J. Measuring Ecosystem Services: Guidance on Developing Ecosystem Service Indicators; UNEP-WCMC: Cambridge, UK, 2014. [Google Scholar]
- Gadow, K.; Kurttila, M.; Leskinen, P.; Leskinen, L.; Nuutinen, T.; Pukkala, T. Designing forested landscapes to provide multiple services. CAB Rev. Perspect. Agric. Vet. Sci. Nutr. Nat. Resour. 2007, 2, 1–15. [Google Scholar]
- Pukkala, T. Which type of forest management provides most ecosystem services? For. Ecosyst. 2016, 3. [Google Scholar] [CrossRef] [Green Version]
- Ojea, E.; Martin-Ortega, J.; Chiabai, A. Defining and classifying ecosystem services for economic valuation: The case of forest water services. Environ. Sci. Policy 2012, 19–20, 1–15. [Google Scholar] [CrossRef]
- Hayha, T.; Franzese, P.P. Ecosystem services assessment: A review under an ecological-economic and systems perspective. Ecol. Model. 2014, 289, 124–132. [Google Scholar] [CrossRef]
- Pascual, U.; Balvanera, P.; Díaz, S.; Pataki, G.; Roth, E.; Stenseke, M.; Watson, R.T.; Dessane, E.B.; Islar, M.; Kelemen, E.; et al. Valuing nature’s contribution to people: The IPBES approach. Curr. Opin. Environ. Sustain. 2017, 26, 7–16. [Google Scholar] [CrossRef] [Green Version]
- Diaz, S.; Demissew, S.; Carabias, J.; Joly, C.; Lonsdale, M.; Ash, N.; Larigauderie, A.; Adhikari, J.R.; Arico, S.; Báldi, A.; et al. The IPBES Conceptual Framework-Connecting nature and people. Curr. Opin. Environ. Sustain. 2015, 14, 1–16. [Google Scholar] [CrossRef] [Green Version]
- Harrison-Atlas, D.; Theobald, D.M.; Goldstein, J.H. A systematic review of approaches to quantify hydrologic ecosystem services to inform decision making. Int. J. Biodivers. Sci. Ecosyst. Serv. Manag. 2016, 12, 160–171. [Google Scholar] [CrossRef] [Green Version]
Figure 1.
The framework of the concept of managing ecosystem services for the wellbeing of society.

Figure 2.
Illustration of carbon balance based on gains and loss as well as outside factors.

© 2020 by the author. Licensee MDPI, Basel, Switzerland. This article is an open access article distributed under the terms and conditions of the Creative Commons Attribution (CC BY) license (http://creativecommons.org/licenses/by/4.0/).
Share and Cite
MDPI and ACS Style
BASKENT, E.Z. A Framework for Characterizing and Regulating Ecosystem Services in a Management Planning Context. Forests 2020, 11, 102. https://0-doi-org.brum.beds.ac.uk/10.3390/f11010102
AMA Style
BASKENT EZ. A Framework for Characterizing and Regulating Ecosystem Services in a Management Planning Context. Forests. 2020; 11(1):102. https://0-doi-org.brum.beds.ac.uk/10.3390/f11010102
Chicago/Turabian StyleBASKENT, Emin Zeki. 2020. "A Framework for Characterizing and Regulating Ecosystem Services in a Management Planning Context" Forests 11, no. 1: 102. https://0-doi-org.brum.beds.ac.uk/10.3390/f11010102
Note that from the first issue of 2016, this journal uses article numbers instead of page numbers. See further details here.