Article

The Strong and the Stronger: The Effects of Increasing Ozone and Nitrogen Dioxide Concentrations in Pollen of Different Forest Species

by
Sónia Pereira
1,
Maria Fernández-González
2,3,
Alexandra Guedes
1,2,
Ilda Abreu
2,4 and
Helena Ribeiro
1,2,*
1
Department of Geosciences, Environment and Spatial Plannings, Faculty of Sciences, University of Porto, 4169-007 Porto, Portugal
2
Earth Sciences Institute (ICT), Pole of the Faculty of Sciences, University of Porto, 4169-007 Porto, Portugal
3
CITACA-Agri-Food Research and Transfer Cluster, Campus Auga, University of Vigo, 32004 Ourense, Spain
4
Department of Biology of the Faculty of Sciences, University of Porto, 4169-007 Porto, Portugal
*
Author to whom correspondence should be addressed.
Submission received: 30 November 2020 / Revised: 6 January 2021 / Accepted: 10 January 2021 / Published: 15 January 2021
(This article belongs to the Special Issue Tree Pollen and Floral Biology)

Abstract

:
The knowledge of pollen sensitivity and tolerance to stress factors such as air pollution is important for forest sustainability, ensuring the most efficient production with the highest benefits and lowest resource losses. This study intended to evaluate the influence of common air pollutants in four forest trees species, Betula pendula Roth, Corylus avellana L., Acer negundo L. and Quercus robur L., through a comparative analysis at the same experimental conditions. We aimed to investigate the effect that may occur in pollen fertility, protein content, oxidative stress and wall composition after exposure in vitro to ozone and nitrogen dioxide at concentration levels for vegetation protection in Europe. Our results suggest changes in pollen viability, protein content and differential sensitivity related to ROS synthesis, NADPH oxidase activity, as well as in wall composition. The results indicate that NO2 exposure affected more the pollen species studied mostly at the highest concentration exposure. As for ozone, there were less significant differences between samples; however, a different behavior occurs in O3 expositions, where the most influence happens at the legal limit for vegetation protection in Europe. Our study showed that significant pollen functions could be compromised even at common air pollutant’s concentrations.

1. Introduction

The forest ecosystem is one of the most diverse in nature providing food, resources, energy, and services that benefit humans, animals, as well as the economy and the environment [1,2]. Forests are suggested to improve life quality providing physical and physiological well-being [3,4,5]. They are also providing water and soil purification and management of waterflow in storms and extreme climate events [6], improving air quality [7,8] for carbon storage and sequestration [9] and as a climate regulator and energy saver. However, forest ecosystems are dynamic, and when exposed to stress conditions, they can suffer disturbances in their balance. It is now more evident than ever that forests are one of the most robust bioindicators of the impacts of climate change as well as of atmospheric pollution.
Air pollution has reached worrying levels, and forests play a decisive role in reducing air pollution [10]. In the past decades globally, tropospheric ozone concentrations have increased [11], even with a slight decrease observed in NOx concentration assign to environmental regulations. Regional air pollutants have been documented for the potential impact in forests, especially oxidant pollutants like NOx and ozone [12]. NOx is an anthropogenic pollutant mostly from fossil fuels’ burning, especially in motorized vehicles and some industrial processes [13]. Even being mostly released in urban areas, this pollutant can travel long distances and react to form different secondary atmospheric pollutants [14]. Ozone is a secondary air pollutant synthesized in the atmosphere in the presence of chemical precursors, hydrocarbon and nitrogen oxides, and because of this, it may be detected anywhere. According to the European Environmental Agency, many Forests ecosystems are exposed to ozone levels exceeding the EU Ambient Air Quality Directive 2008/50/EC threshold limits.
There is a wide variety of studies carried out on the impacts of pollution in forest plant traits [15], as leaf [16] and fruit [17], and the vast majority suggest the occurrence of significant effects after exposure to environmental pollutants such as O3 and NO2. A disturbance in reactive oxygen species (ROS) leads to a physiological situation of the plant called oxidative stress, which can affect its growth and development and even cause cell death [18,19]. The plants’ photosynthetic efficiency may be decreased in polluted zones [18,20]; also a high degree of air pollution can cause irregularities in the anthers, decrease their number, and end up causing male sterility [21].
Among plant features the pollen is vital for successful reproduction and plant germoplasm resources. During the flowering season, pollen is released in high quantity from the plants and carried by air, animals or water to perform the pollination, that way allowing fruit formation and future seeds. Therefore, pollen quality is important in ensuring forest survival, growth and production, and animal feeding, namely bees and other insects, that have in pollen an essential source of protein and nutrients.
When anemophilous plants release pollen, it becomes a biological aerosol [22], which can undergo modifications due to air pollutants [23,24]. Pollutants are reported to affect pollen at morphologic and physiological levels, both in vivo and in vitro (reviewed in [25,26]). However, results are sometimes contradictory among these studies, and its comparison is challenging because experimental designs are quite variable.
Anomalies in the pollen shape, reduction in their size and number at polluted environments have been described [21] as well as pollen wall differences in the amounts of Cl, Na, Mg and Si [24]. Changes affecting biological and reproductive functions such as pollen fertility, allergenic potential, oxidative stress and nutritional value have also been investigated [21,25,26,27,28,29,30,31,32,33,34,35,36]. Pollen viability and germination decreased after exposure to pollution [29,30,32,33], but protein content has been reported to increase or decrease [21,28,31]. Variations at the pollen wall’s chemical characteristics at the level of proteins, lipids and polysaccharides [25] have been documented but not quantified, and ozone exposure substantially modified pollen lipidic composition [35,36]. At the level of oxidative stress, enhancement or no change in the production of ROS, hydrogen peroxide (H2O2) and NAD(P)H oxidase activity has been described [18,27,29]. Atmospheric pollutants can also alter pollen allergenicity potential by inducing allergen modifications that can lead to an increase or decreased immunological response [28,34].
From all the above described, there is the suggestion that plant species present different tolerance to atmospheric pollution as well as to distinct exposure concentrations but very few studies compare different species at different pollutant levels under the same experimental design. So, in this study we focus on four tree species: Betula pendula, Corylus avellana, Acer negundo and Quercus robur that are common forest trees but are present in urban sites as well, as Betula is noted to be out to be one of the most allergenic species in the Europe [22]. We aimed to investigate the effects that may occur on pollen fertility, protein content, oxidative stress and wall composition after exposure to O3 and NO2 at values close to the limit concentration levels for vegetation protection in Europe (2008/50/EC).
To our knowledge, there is no study comparing several forest species at the same experimental conditions, and it is of crucial importance to know pollen sensitivity and tolerance to stress factors such air pollution since this information would contribute towards forest sustainability management, ensuring most efficient production with highest benefits and lowest resource losses.

2. Materials and Methods

2.1. Pollen Sampling

The pollen samples analyzed in this study were collected directly from the different trees during their flowering season. The trees were all located at the University Campus of the Faculty of Sciences of the University of Porto. Three plants per each species were sampled, and flowers/catkins were randomly collected from all the plants’ quadrants in different branches in 2019. After separation from other plant structures, the anthers were dried at 25 °C during 24 h, after that time, they were shivered through different grades of sieves to separate the pollen from the rest of the plant materials and pure pollen was collected and stored at −20 °C from 1 to 2 weeks until analysis [28].

2.2. Exposure Experiments of Pollen to Pollutant Gasses

Individual samples of 50 mg of pollen, were weight to Falcon tubes open in both sides and covered with a fine mesh with a pore opening size of 23 μm (SEFAR PET 1000). The tubes were placed inside a fumigation chamber, under controlled temperature and humidity conditions, for 6 h. Inside the chamber, to imitate what happens in the atmosphere during a day, was set a Solar Simulator (Newport Oriel 96,000 150W), two fans (SUNON SF23080AF) to homogenize the air, temperature and relative humidity sensors (EBI20 sensor) and gas sensors (AEROQUAL Series 500 sensors; O3 sensor range: 0–0.5 ppm, NO2 sensor range: 0–0.2 ppm) as described in Sousa et al. [30].
The samples were submitted to both pollutant gases (Table 1), having as reference the legal limit value given in the EU Ambient Air Quality Directive 2008/50/EC, corresponding to approximately half of the legal limit, the legal limit value and the double legal limit value.
To obtain these average concentration values, control injections of NO2 and O3 were done during the exposure time, both environmental condition and gas values were registered during the time of exposure. An A2ZS-1GLAB ozone system was used to generate ozone, connected to a timer (OMRON H3DK-S1) to control the gas injection. The NO2 was obtained by chemical reaction of concentrated nitric acid and solid copper mixed in a sealed bottle, at stoichiometric amounts [28]. A blank sample was obtained by subjecting the pollen to the same conditions as the remaining samples without exposure to any gas.

2.3. Pollen Viability

Pollen viability was assayed using a fluorochromatic reaction using the fluorescein diacetate (FDA) method described by Heslop-Harrison [37]. If the pollen vegetative cell membrane is intact, the fluorescein diacetate enters in the cell and associates with enzymes (esterases) inducing fluorescence temporarily [37]. Viable pollen grains appear with strong fluorescence while non-fluorescence pollen grains are non-viable.
The pollen grains (5 mg) were suspended in an FDA solution (1 µL/mL in PBS) during 15 min in obscurity, and 50 µL of the solution was placed on a slide and observed. To calculate the pollen viability, the counting of viable grains was carried out using a fluorescence microscope (DMLB; Leica Microsystems, Wetzlar, Germany) equipped with a mercury lamp of 50 W and a filter for blue light. Three random fields per sample (each containing at least 100 pollen grains) were considered and the viability percentage was expressed as the average percentage rate of the three counts.

2.4. Pollen Protein Extraction and Quantification

Pollen samples (10 mg) were suspended in Eppendorf tubes with 12 mg of zirconia beads (0.5 nm), 200 µL of phosphate buffered saline (1:20 w/v) at pH 7.4 and 10 μL of protease inhibitor cocktail (Sigma, St. Louis, MO, USA). Then, each tube was stirred using a Mini-BeadbeaterTM at 4 °C (3 cycles each with the duration of 30 s with pause intervals of 15 s at 16,100 g). Subsequently, the samples were kept at 4 °C under constant (orbital) stirring for 2 h, centrifuged twice (16,100 g for 20 min at 4 °C) and the supernatant was filtered (0.45 μm Millipore filter) and centrifuged again in the conditions previously described.
The soluble protein content of all pollen extracts was quantified through a colorimetrical reaction with the Coomassie Protein Assay Reagent (sigma-Aldrich) in microtiter plates (300 µL/well at 595 nm) according to the Bradford method [38]. Different BSA concentrations (0–2000 μg/mL) were used to estimate a standard curve for protein calibration.

2.5. Pollen Oxidative Stress Analysis

2.5.1. Detection of Reactive Oxygen Species (ROS)

ROS detection was determined using the fluorescent ROS indicator dye 2′,7′-dichlorodihydrofluorescein diacetate (DCFH2-DA). To each pollen sample (2 mg) was added 100 µL of 2.5 mM DCFH2-DA in PBS, kept in the obscurity for 15 min at 25 °C and then centrifuged for 3 min at 16,100 g, the supernatant was discarded and PBS was added twice [29].
ROS content was determined using a fluorescence microscope (DMLB; Leica Microsystems, Wetzlar, Germany) equipped with a 450–490 mm excitation filter and a 515emission filter. The percentages of fluorescent pollen grains relative to the total pollen grains were determined per each sample, counting three random fields in the same sample, containing at least 100 pollen grains each expressed as the three counts’ average percentage rate.

2.5.2. NADPH Oxidase Enzymatic Activity

NADPH oxidase activity was quantified by spectrophotometry, based on the nitro blue tetrazolium assay (NBT). The pollen samples (1 mg/assay) were hydrated in PBS solution (1 mL), agitated gently for 30 min at 4 °C and centrifuged at 7300× g for 3 min. After that, the supernatant was discarded and was added 2 mM nitroblue tetrazolium (NBT) with and without nicotinamide adenine dinucleotide phosphate (reduced) (NADPH) (1 mMol/L). The samples were then incubated at 37 °C for 30 min and washed with PBS. To dissolve the formazan precipitate, pure methanol was added, and the samples were agitated at room temperature for 20 min followed by centrifugation. Then a PBS was added for a final wash. Finally, the supernatants’ absorbance was measured, in triplicates, in a microtiter plate at 530 nm (200 µL/well). All centrifugations were performed at 7300 g for 3 min.

2.5.3. Western Blotting Analysis of Superoxide Dismutase (SOD)

Proteins were separated under reducing conditions in 12.5% (w/v) polyacrylamide gels (10 μg of pollen protein extracts per lane) and were electroblotted (TE22 Mighty small transfer unit-GE Healthcare) onto nitrocellulose membranes (Protran, Whatman® Schleicher & Schuell, Germany) using transfer buffer (192 mM glycine, 25 mM Tris and 20% methanol) during 2 h at 200 mA. The blots were blocked in TBS-T (20 mM Tris, 150 mM NaCl with 0.1% Tween-20) with 5% defatted milk for 1 h. Afterwards they were incubated overnight at 4 °C with a customized pollen anti-Cu/Zn SOD Ab (sequence accession nº EU250769.1) diluted 1:2500 in TBS-T solution [35].
After incubation overnight, the membranes were washed with TBS-T and immunodetection was performed using goat anti-rabbit IgG Ab HRP conjugated (Thermo Fisher Scientific, NY, USA) (1:2000) for one hour. Protein bands were detected using an ECL solution (Luminata™ Crescendo, Western HRP substrate), visualized in a Chemidoc™ XRS + system (Bio-rad Laboratories) and quantified using the ImageLab™ v5.2 software. The reactivity changes to the different pollen extracts were evaluated through the optic density values of the reactive bands.

2.6. Raman Microspectroscopy

The pollen samples, stored at −20 °C, were kept 10 min at room temperature before being distributed on a glass slide. For each specie and essay, four spectra/pollen in four different pollen grains were collected. Spectra acquisition was made using an XploRA™ Raman microscope (Horiba Scientific, New York, NY, USA) that combines optical microscopy with a Raman spectroscopy using laser radiation which allows a “one-shot” analysis. A 100× objective lens was used to focus the laser beam on the sample and collect the Raman scattered radiation in back-scattering geometry. The Raman signal was detected on a highly sensitive cooled charge-coupled device (CCD) detector to collect the Raman spectra.
The wavenumber of the Raman spectrum, before each use, was calibrated with Silicon referent standard (520.6 ± 0.1 cm−1). An excitation wavelength of 785 nm from a diode laser at a power of 25 mW with a range of diffraction gratings with 1200 lines mm−1 and slit of 300 μm was used for acquisition. Extended scans were performed, with five scans of fifty seconds being measured on each spectra acquisition, in a spectral region of 1000 to 1800 cm−1 with approximately 1 cm−1 resolution.
For spectral acquisition and pre-processing, the software Labspec 5 was used. All spectra were processed with an automatic polynomial baseline correction to attenuate the fluorescence influence followed by a noise reduction using the Savitsky-Golay algorithm to increase spectra quality. The spectra were then normalized to a constant area, where the area under the curve is set to 100 (a.u.). To obtain a lower signal-to-noise ratio, average spectra for each sample were calculated and compared using the KnowItAll ® Software.

2.7. Statistical Analysis

The results obtained in the different experiments are presented as means ± standard deviation and the Shapiro-Wilk test was used to test the normality of the data. To evaluate the quantitative effect of the O3 and NO2 pollutant gases, a one-way ANOVA was applied, followed by the Turkey post hoc test (p < 0.05) when significant differences were detected to perform comparisons. Statistical analysis was conducted using a Microsoft Office Excel 2013 spreadsheet and IBM SPSS statistics version 24 (IBM, New York, NY, USA).

3. Results

3.1. Pollen Viability

Figure S1 and Table S1 shows the results of viability rates of A. negundo, B. pendula, C. avellana and Q. robur pollen before and after exposure to pollutants. Average pollen viability of non-exposed pollen ranged between 76.3% ± 2.1% for C. avellana, 72.0% ± 2.0% for Q. robur, 69.3% ± 0.6% for B. pendula and 68.7% ± 1.2% for A. negundo.
The overall trend pointed to a significant statistical reduction (p < 0.05) in pollen viability induced by O3 and NO2 but the percentage loss varied depending on pollen species, gas tested and their concentrations (Table 2).
The highest decrease in pollen viability was registered for C. avellana (average of 15% when exposed to O3 and 11% to NO2) followed by B. pendula (average of 9% when exposed to O3 and 13% to NO2), Q. robur (average of 5% when exposed to O3 and 7% to NO2) and finally A. negundo (average of 8% to NO2).
For C. avellana and Q. robur pollen, regardless of the NO2 concentration, a significant decrease in pollen viability was observed while for A. negundo and B. pendula, only the limit and the double legal limit value for the protection of vegetation induced a significant reduction.
Regarding the O3 influence in pollen viability, no significant changes were observed for A. negundo, for B. pendula only the limit and the double legal limit concentrations induced a significant decrease, while for C. avellana and Q. robur O3 always had a significant negative effect on pollen viability.

3.2. Pollen Total Soluble Protein Content

The average content of total soluble protein (TSP) in the different pollen species was quite distinct. It ranged between 8536.5 ± 3.15 µg/mL for A. negundo, 7241.9 ± 173.9 µg/mL for Q. robur, 3256.2 ± 64.1 µg/mL for C. avellana and 1410.9 ± 64.6 µg/mL for B. pendula (Figure S2 and Table S1).
A. negundo pollen registered a significant decrease in TSP after pollutant exposure (p < 0.05) compared with the blank sample (Table 2), but the influence observed amongst the distinct treatments (O3 vs NO2) was not consistently statistically significant (Figure S2). A significant decrease in TSP was also observed for Q. robur pollen except for the pollen samples exposed to O3 at half the limit value and NO2 at the limit values for vegetation protection.
For B. pendula, we observed either an increase or decrease in TSP content compared with the blank sample (Figure S2), however, these differences were only significant for the pollen sample exposed to O3 at the limit concentration value. For C. avellana, either no change or a significant increase in TSP were observed after exposure to NO2 at the limit and twice the limit values and at O3 limit value concentration. The exception was the O3 concentration corresponding to half the limit value that induced a decrease in TSP. If we do not consider the statistical analysis results, these last two pollen species show a similar pattern in the TSP increase and decrease towards the distinct gas concentrations tested.

3.3. Pollen Oxidative Stress

3.3.1. Detection of Reactive Oxygen Species (ROS)

The ROS baseline rate detected at the four pollen species analyzed was very distinct, being the lowest observed for A. negundo (14.3% ± 2.1%), followed by B. pendula and Q. robur with similar percentages (25.7% ± 1.5% and 25.0% ± 2.7%) and the highest was registered for C. avellana (45.7% ± 1.5%) (Figure S3).
The overall trend pointed to an increase in ROS percentage after pollen exposure to the pollutants (Table 2) although not always statistically significant for B. pendula and C. avellana. The highest average increase was observed for A. negundo (14%) and the lowest for B. pendula (4%).
Observing the results of each pollen species individually (Figure S3 and Table S1) and considering the differences among pollutant’s treatments, for A. negundo pollen no significant differences in ROS percentage were observed between the distinct concentrations of O3 and NO2, the exception was pollen exposed to NO2 at twice the limit values for the protection of vegetation that induced a significant increase in ROS. Similar behavior was observed for Q. robur pollen, although in this case, the exceptions were for pollen exposed to concentrations of O3 and NO2 corresponding to half the limit value that induced a significantly lower increase in ROS when compared with the other pollutant’s treatments. For B. pendula, pollen exposure to O3 and NO2 at half the limit value did not induce a significant increase in ROS percentage, all other concentrations did. Contrariwise, for C. avellana only O3 levels at the limit values and NO2 at twice the limit value for vegetation protection induced a significant ROS percentage increase.

3.3.2. NADPH Oxidase Enzymatic Activity

Opposite to the trends observed for the other pollen traits tested, overall NADPH oxidase enzymatic activity was the parameter with the lowest change induced by the pollutant gases, being towards the increase in the enzymatic activity (Table 2 and Table S1).
As shown in Figure S4, C. avellana pollen NADPH activity was not significantly influenced by none of the gasses tested. For A. negundo, only the pollen exposed to the highest NO2 concentration levels presented a significant statistical change (p < 0.05). Ozone only appears to significantly influence (positively) the NADPH activity in Q. robur and B. pendula pollen but only at half the limit value.

3.3.3. Superoxide Dismutase (SOD) Expression

SOD (superoxide dismutase) isoforms expressed in each pollen species using specific antibody can be observed in Figure 1. Differences in expression induced by O3 and NO2 were observed and varied depending on the isoform nature, but also among the same isoform between pollen species and gas tested.
Not all pollen species presented the same SOD isoforms. Based on their theoretical molecular weights [39] the bands around 15 KDa (peroxisomal CuZn-SOD), 35–36 KDa (chloroplastidic Fe-SOD) were common to all species and the one around 25 KDa (mitochondrial Mn-SOD) was only absent in A. negundo. One band around 45–46 KDa, absent only in B. pendula, and 60 KDa, present only in A. negundo, can be assigned to multimeric forms of the CuZn-SOD.
The band of 15 KDa presented increase expression trend in pollen after exposure to O3 for A. negundo, B. pendula and Q. robur. Considering NO2 the effect was dissimilar, inducing increased expression for B. pendula and Q. robur pollen and decreased for A. negundo and C. avellana.
The behavior for the band around 35–36 KDa changed depending on the species. For C. avellana and Q. robur, NO2 was the only gas with visible influence but with contrary effect, decreased expression in the first case and increased in the second one. For B. pendula, O3 had a minor effect decreasing the band expression while NO2 induced a small increase. Finally, for A. negundo pollen, both gases induced an increased expression, but no expression was observed at the highest NO2 concentration.
Considering the band around 25 KDa, Q. robur and C. avellana pollen presented increased expression after exposure to both gases, but for this last pollen species, only the levels at the limit values and twice the limit value induced the increase. For B. pendula, NO2 induced a remarkable expression decrease while a negative influence of O3 was only detected at the highest concentration levels.

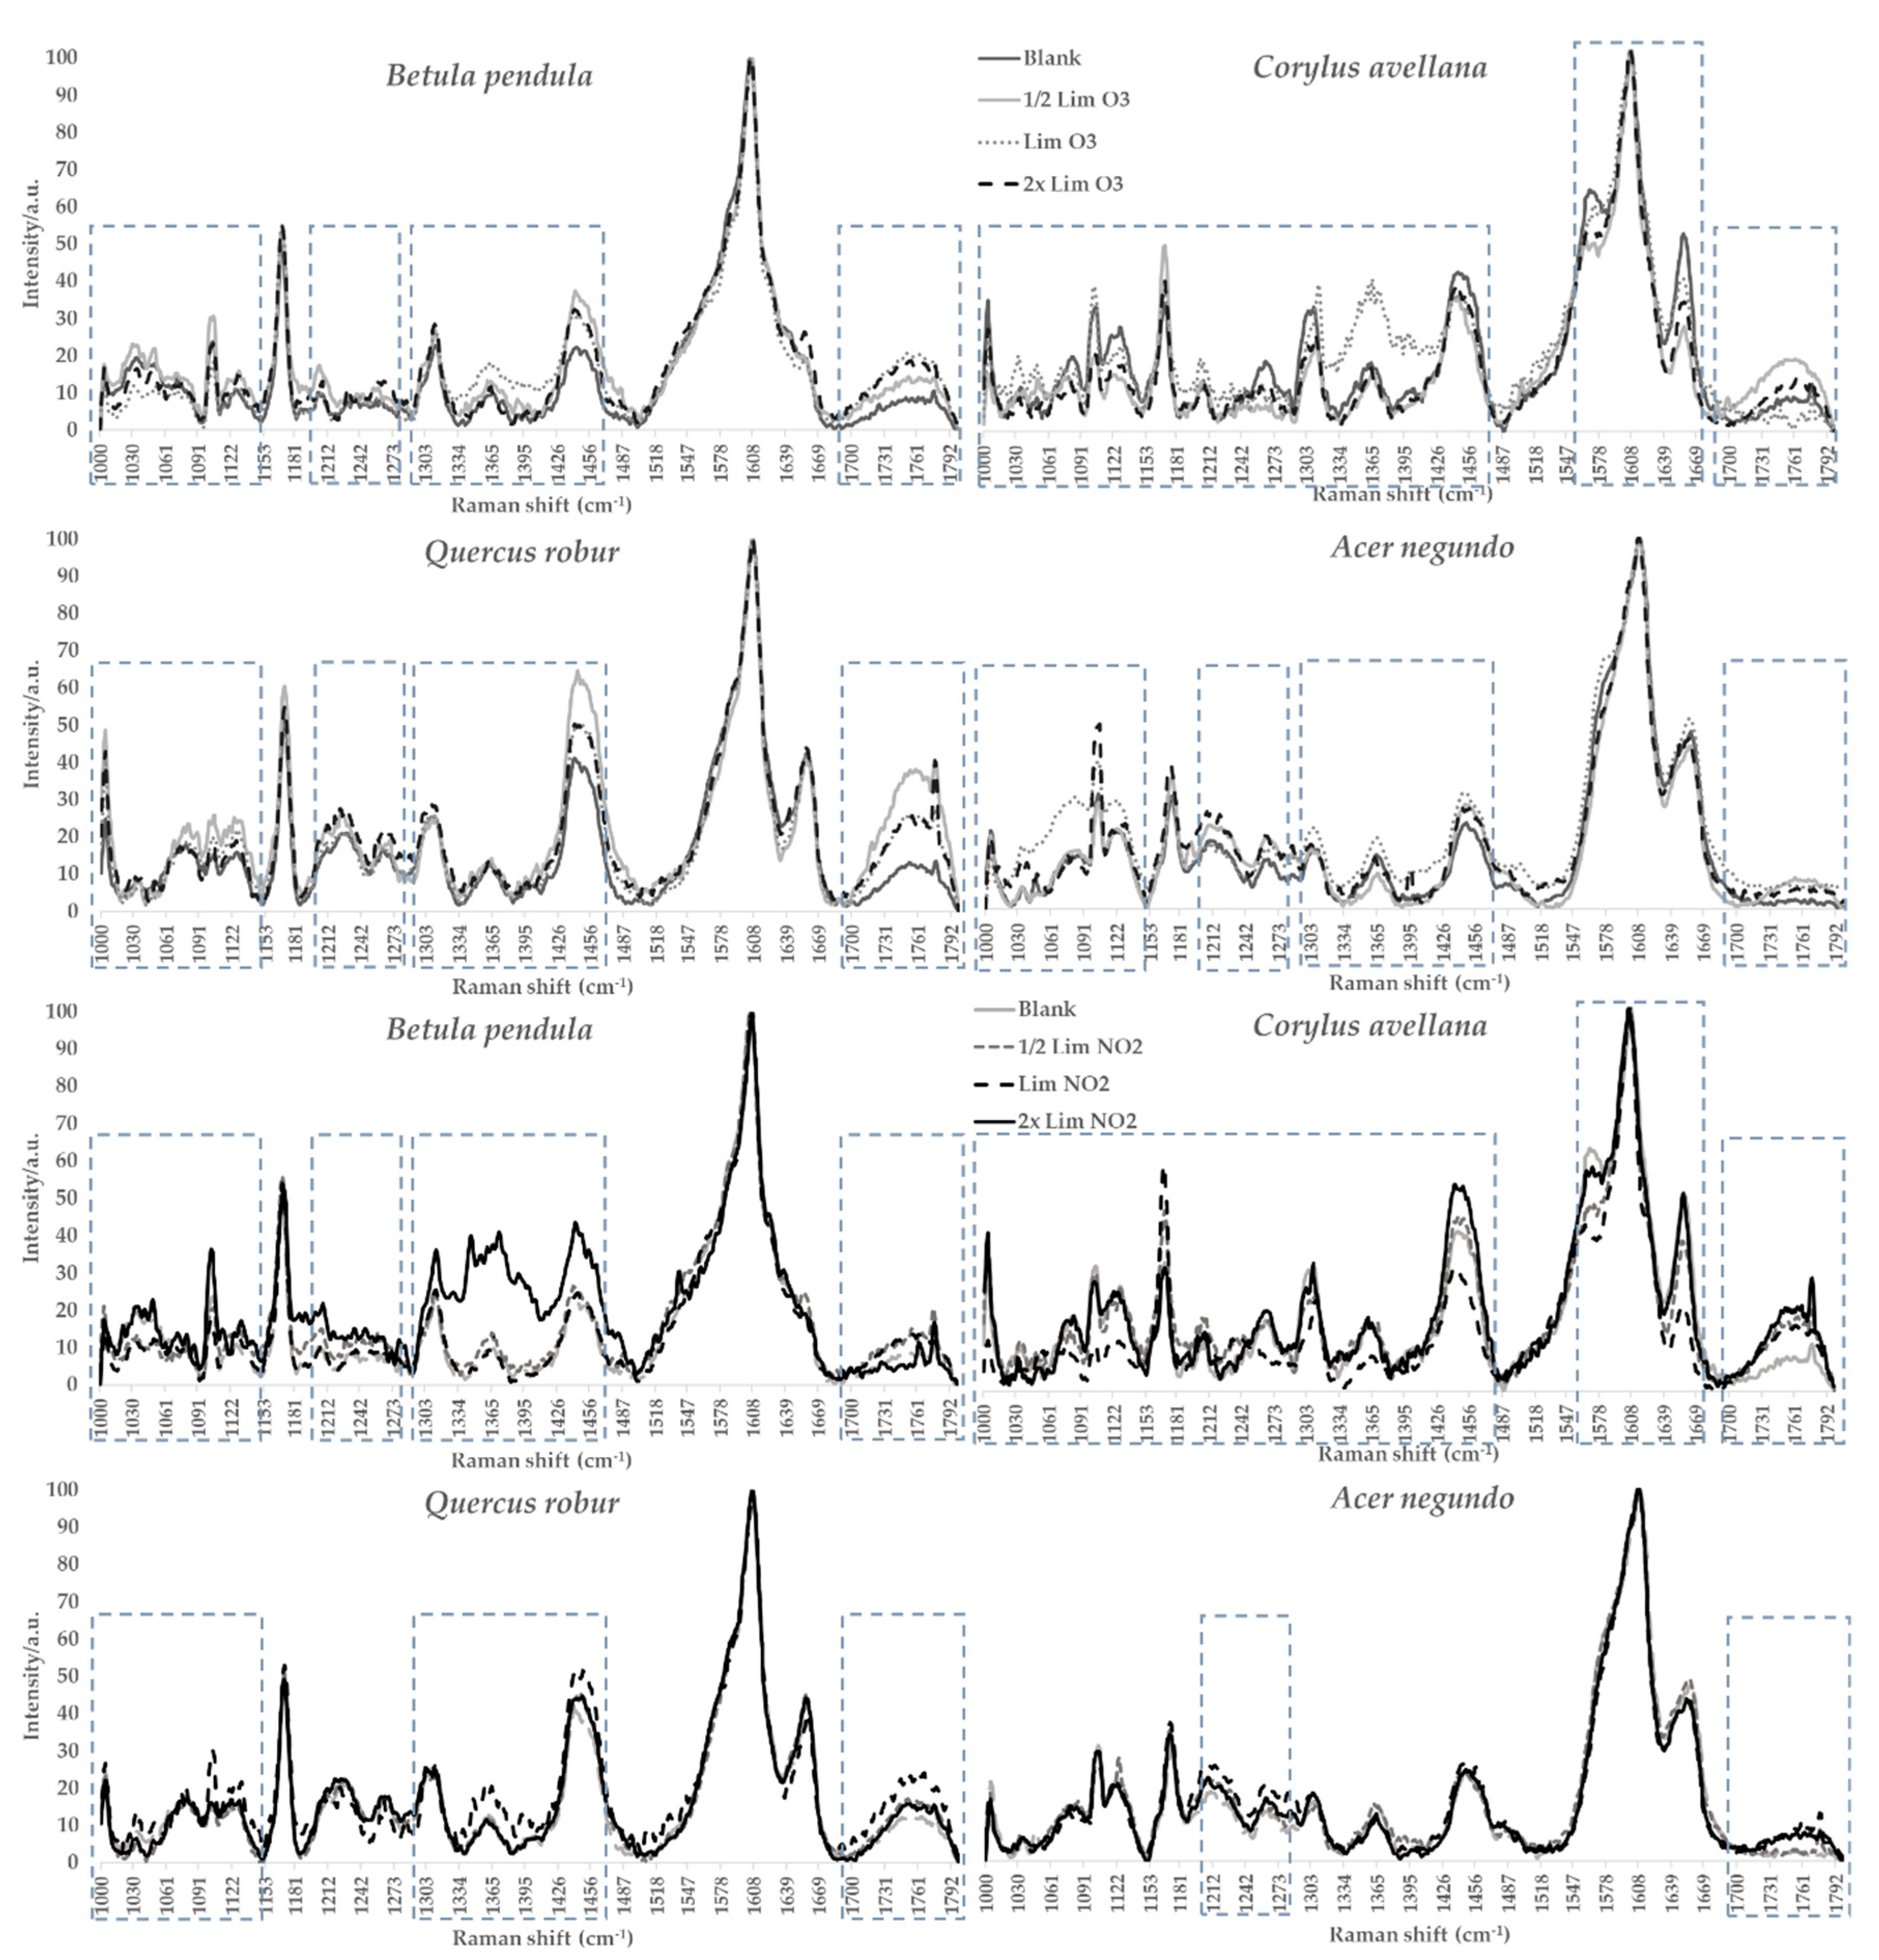
3.4. Raman Microspectroscopy

Our results showed small changes in the pollen wall chemical structure after exposure to NO2 and O3 (Figure 2). Magnitude shifts varied between species and gas type, but they generally occurred at the same wavenumber area. Visible changes can be observed at ≈ 1700–1800 cm−1, at ≈ 1550–1650 cm−1 at ≈ a triplet region between 1300–1460 cm−1 (particular emphasis on one peak at ≈ 1440 cm−1), at ≈ 1210–1270 cm−1 and ≈ 1000–1150 cm−1 wavenumber. These changes occur in the intensity of the spectra, and the flattening of some peaks into shoulders.
A. negundo pollen wall was the less affected by the pollutants while C. avellana pollen showed the biggest changes in the spectra of exposed samples compared with the blank one. Overall, the highest concentration of NO2 has the greatest impact on B. pendula pollen while for the other species O3 seems to be the gas with the greatest effect.
It was observed that no bands were shifted from their original position and no new bands appeared, meaning that there was no passage from one molecular component to another.

4. Discussion

In our study, the interactions between O3 and NO2 air pollutants and pollen of four forest species were evaluated in vitro. Overall, at the present observed atmospheric gas concentration levels, NO2 affected all species more than O3. For this last gas, it was possible to observe that the greater effect occurred for pollen exposed to the limit value concentration, which could mean that for some species the tolerance threshold (maximum limit of exposure for a species), occurs at this concentration level.
Our pollen viability results showed that A. negundo pollen is the most resilient in terms of viability to O3 and NO2 compared to the other species. Also, C. avellana pollen viability is more sensitive to O3 than to NO2. At the same time, Q. robur has an equal sensibility to both pollutants. However, both species’ pollen viability is affected even at the level below the limit value according to the EU Directive 2008/50/EC. Overall, the gas with the most negative effect on pollen viability was NO2, particularly in those samples exposed to the highest concentration.
Pollen viability is an important trait directly influencing plant reproduction. The evaluation of pollen viability after exposure to pollutants, in situ or under laboratory-controlled conditions, has been a topic addressed by many studies such as in Pasqualini et al. [29] for ragweed pollen after exposure to ozone or Leghari et al. [21] for in situ assessment on sweet cherry pollen grains exposed to vehicular exhaust pollution on a road site compared with a control sample apart from the polluted site. In this previous study, it was also reported changes in pollen grains size and number. Indeed, a decrease in pollen viability has been consistently reported in the literature, despite the different analyses of plant species, pollutant gases, concentrations and conditions of exposure. Although anemophilous trees, like the ones in our study, produce large amounts of pollen to balance the loss due to air transport, the decrease in pollen viability can attain levels not able to compensate the excess pollen production, and therefore some loss in fruit production may occur in crop forests if during pollination high pollutants atmospheric concentrations occur. This situation impacts not only plant reproduction but also animal feeding.
In our study, the pollutants’ effects on pollen total soluble protein (TSP) were contradictory compared to the blank samples. In A. negundo and Q. robur pollen, almost all samples exposed to the gas pollutants presented no change or a significant decrease in TSP content relative to the blank sample. The other species showed similar behavior, with most of the samples having equal or higher TSP content than the blank samples. In the literature, an increase and decrease in protein content have been observed in different species [26]. It has been argued that the effects are dependent on species and pollutant, but comparisons among the different studies are always relative because distinct experimental conditions are present. In our study, we compared the same batches of pollen from four different species subjected to two gases at distinct concentrations to overcome this issue. Our results confirm that the pollen species present different behavior in terms of TSP concentration when exposed to pollutant gases, and the reaction is not always positively correlated with concentration. These findings support the different trends reported in the literature concerning pollen protein content and exposure to pollution. The influence of air pollution on pollen’s TSP can also impact pollen’s nutritional value as food for animals, although the study species are anemophilous and therefore their pollen and flowers are less attractive to insects like bees or birds.
The samples of pollen exposure to the pollutant gases, especially at the limit and two times limit concentration value for vegetation protection presented significant changes especially related to stress conditions and oxidative damage, with increased ROS production, NADPH oxidase activity and SOD expression.
We determined the basal ROS activity values before pollen exposition to the pollutants and observed an increase after. The gases tested have a similar effect on ROS production, inducing an increase, without any standing out within the species. ROS as the superoxide ion, the hydrogen peroxide and hydroxyl radical, has been reported as an important signaling toll in plants, controlling major processes like growth and development, and is essential in response to abiotic and biotic environmental stimulus [27]. Sénéchal et al. [26] referred that air pollutants may diffuse into plant cells leading to ROS production and consequently increasing stress, that it was overall observed in our study. Gases like ozone and nitrogen dioxide are oxidant pollutants, which can stimulate ROS production by the pollen grain as a defense mechanism to face the stressful environmental conditions induced. In our study, we observed that B. pendula and C. avellana pollen behave in a similar way where the gases seem to induce less ROS production than in the case of A. negundo and Q. robur. This shows that the defense mechanism reaction towards the induced stress conditions and its efficiency can be different between the tested species.
The basal percentage of pollen producing ROS was much lower compared to the viability results. This may indicate that although viable the pollen grains could be metabolically less active when in low oxidative stress, they increased their metabolic activity when exposed to abiotic stress like pollution. Nonetheless, the higher values in basal ROS percentage corresponded to the species having higher basal viability percentages. A similar trend has been reported in Luria et al. [40] where the authors analyzed the pollen fitness of Arabidopsis and tomato pollen by flow cytometry using a ROS probe (dichlorodihydrofluorescein diacetate H2DCFDA-staining) and reported that the high-ROS pollen germinated with a frequency that was 35-fold higher than the low-ROS pollen.
In our experiments with O3, we also observed that the percentage of pollen producing ROS was the highest at the limit value and decreased afterwards. This can be related with excess O3 concentration inducing the accumulation of ROS beyond the optimal range, and therefore the efficiency of the defense mechanism reaction is inhibited with consequences to pollen physiology seen for example at the viability rate that was lower at limit values than at two times the limit for three of the four studied species.
The NADPH oxidase enzymatic activity, was the parameter with the lowest significant change induced by the pollutant gases, despite being responsible for the increase in ROS within the plant cells by mediating an oxidative burst to respond to stress [18,41], with only the higher levels of concentration inducing an increase in the activity and NO2 being the most important. This suggests that other enzymatic systems influence ROS dynamic at lower pollution levels and that this enzyme was not potentiated by average levels of pollution but by the higher levels. Therefore, other stress indicators should be explored in the future to understand better the mechanisms underlying pollen stress tolerance to pollution.
From the results of SOD expression we observed, as in all tests performed in our study, we observed differential band reactivity occurred depending on the pollen species, showing that for some of the studied species (e.g., Q. robur) were more stress-tolerant. Both increase and decrease in band reactivity were observed indicating oxidative stress at the level of pollen SOD located in the peroxisomes and mitochondria, with NO2 having the greatest effect. This oxidative stress promoted by the exposure to the pollutant gases may induce pollen oxidative defenses by promoting SOD enzymatic activity, which protects cells against oxygen toxicity by scavenging the superoxide radicals and promoting the free radical detoxification process [42], until a threshold level after which its activity is reduced. Several shreds of evidence show that SOD, as well as other enzymes, are involved in stress tolerance in plants exposed to air pollutants serving as primary defense to avoid cell injury [43,44] and pollen is not an exception being observed that NO2 has the greatest effect than O3.
CuZn-SOD bands are also reported as major pollen allergens this meaning that the increase in the expression observed in our study may suggest an increase in pollen allergenic potency after daily exposure to air pollution [43].
This study analyzed the pollen of two species of Betulaceae, namely B. pendula and C. avellana with both species showing a similar trend towards the pollutant’s exposure. These species seem to be more sensitive to increasing NO2 concentration levels; however, a different behavior occurred in O3, where the most influence occurred at the legal limit concentration, indicating that this concentration might be the breaking point for this type of pollen exposure because, after that, the stress indicators show a minor decrease. Compared with the other species analyzed, it is possible to see different behaviors, especially for Q. robur pollen, where lower levels of exposure, of both gases, seem to have more effects on the pollen. This confirms the hypothesis that each plant species may have a different susceptibility/tolerance to the atmosphere’s pollution levels.
The pollen wall composition is another feature where changes induced by the pollutant gases can be observed by Raman microspectroscopy. As it happened with the other pollen features investigated in this study, A. negundo pollen seems to be less affected by the two pollutants analyzed. B. pendula and C. avellana show similar behavior, although as it happens in pollen viability, C. avellana is more sensitive to O3 than to NO2 while B. pendula is more affected by NO2 exposure.
The wavenumbers where visible changes are observed can be assigned to nucleic acids adenine and guanine (~1360 cm−1) [45], amide bands of proteins (amide I, II and III corresponding to C = O stretch ~1650 cm−1, N–H and C–N deformation ~1550 cm−1 and 1300 cm−1), and deformation made of C-H2 groups of aliphatic carbon chains [46], sporopollenin or lipids (1440 cm−1) [47]. The pollen wall has a complex chemical composition, which is important to the pollen wall’s structural maintenance and protection of reproductive nuclei. DNA degradations, sporopollenin degradation, and a change in the pollen wall’s carbon structures can be determinant in the resilience and resistance of pollen grains to environmental pollution. Other authors also suggested changes in the same compounds, such as proteins, lipids, carbohydrates, sporopollenin after pollen exposure to O3 and NO2 [48,49]. Among the primary target of ROS attack are membrane lipids, nucleic acids and proteins that can suffer structural and conformational modifications resulting in its dysfunction [50,51], and the increased levels of ROS observed in our study could potentiate some of these changes. Nonetheless, we mainly observed differences in the spectra intensity indicating principally changes to the molecular species concentration.
Ribeiro et al. [28], using FT-IR also reported changes in the pollen wall of Platanus pollen, at the same components observed in our study after exposure to NO2 and O3 even at below the limit concentration. The same was reported for Corylus pollen collected in areas with high air pollution levels compared to pollen from areas with lower levels of pollution [52]. It is important to highlight that, for each species, we have compared spectra of pollen from the same batch, so the changes we are observing can occur when pollen is airborne exposed to peak pollution episodes. Additionally, each species shows different behaviors depending on the gas type and concentration. However, their effect occurs consistently at similar wavenumbers, meaning always at the same pollen wall constituents, pointing once again to species-specific resilience to pollution.
Finally, air pollution can also potentiate pollen allergies by altering the allergen potential of pollen. This can have a particular impact on population living close to forest zones or due to medium-long range transport of pollen from these areas.

5. Conclusions

In this study, pollen of four forest species was analyzed after exposure to NO2 and O3 gases, at three different concentrations. Our results suggest that changes in pollen viability, protein content and oxidative stress occurred after exposure, which may affect plant reproduction and growth.
For Quercus robur, Acer negundo, Betula pendula and Corylus avellana different behaviors were reported, with differential sensitivity related to ROS synthesis and NADPH oxidase activity well as in pollen viability and wall composition. Most species studied seem to be more affected by NO2 gas exposure, with the samples exposed to the highest concentration being the ones more affected. For the samples exposed to ozone, a different behavior was observed where the most influence happened at the legal limit for vegetation protection in Europe, however, in O3 exposition there were fewer significant differences between samples. This seems to be the breaking point for exposure because the pollen’s stress indicators show a minor decrease after that. It was also observed that common air pollutant’s concentrations stimulated the pollen oxidative defenses.
Overall, Acer negundo pollen seems to be the most resilient species, Betula pendula and Corylus avellana pollen present several similar responses to pollution. However, these results and the overall effects of air pollutants on trees must also be considered in the context of vegetation adaptation plasticity and the influence of meteorological conditions.

Supplementary Materials

The following are available online at https://0-www-mdpi-com.brum.beds.ac.uk/1999-4907/12/1/88/s1, Figure S1: Average and standard deviation in pollen viability of A. negundo, B. pendula, C. avellana and Q. robur. Figure S2: Average and standard deviation in pollen soluble protein content of A. negundo, B. pendula, C. avellana and Q. robur. Figure S3: Average and standard deviation in pollen reactive oxygen species (ROS) content of A. negundo, B. pendula, C. avellana and Q. robur. Figure S4: Average and standard deviation in pollen NADPH oxidase enzymatic activity in A. negundo, B. pendula, C. avellana and Q. robur. Table S1: Average and standard deviation in pollen viability, pollen soluble protein content, reactive oxygen species (ROS) content and NADPH oxidase enzymatic activity in A. negundo, B. pendula, C. avellana and Q. robur.

Author Contributions

Conceptualization, H.R., I.A. methodology, S.P., M.F.-G., A.G., H.R.; formal analysis, H.R., M.F.-G., I.A.; investigation, S.P., M.F.-G.; writing—original draft preparation, S.P.; writing—review and editing, H.R., M.F.-G., A.G., I.A.; supervision, H.R. and I.A.; project administration, H.R.; funding acquisition, H.R. All authors have read and agreed to the published version of the manuscript.

Funding

This research was funded by National Funds through FCT-Fundação para a Ciência e a Tecnologia for the project PTDC/ATP-EAM/0817/2014. ICT-Earth Sciences Institute is funded by National Funds through FCT projects UIDB/04683/2020 e UIDP/04683/2020.

Institutional Review Board Statement

The study did not require ethical approval.

Informed Consent Statement

Not applicable.

Data Availability Statement

Data is contained within the article or supplementary material.

Acknowledgments

The authors thank Pereira C. for her help with the laboratory work, particularly in pollen fumigation.

Conflicts of Interest

The authors declare no conflict of interest.

References

  1. Dobbs, C.; Escobedo, F.J.; Zipperer, W.C. A framework for developing urban forest ecosystem services and goods indicators. Landsc. Urban Plan. 2011, 99, 196–206. [Google Scholar] [CrossRef]
  2. Ghazoul, J. Forests: A Very Short Introduction; Oxford University Press: Oxford, UK, 2015. [Google Scholar]
  3. Rajoo, K.S.; Karam, D.S.; Abdullah, M.Z. The physiological and psychosocial effects of forest therapy: A systematic review. Urban For. Urban Green. 2020, 54, 126744. [Google Scholar] [CrossRef]
  4. Ostoić, S.K.; Salbitano, F.; Borelli, S.; Verlič, A. Urban forest research in the Mediterranean: A systematic review. Urban For. Urban Green. 2018, 31, 185–196. [Google Scholar] [CrossRef]
  5. Vujcic, M.; Tomicevic-Dubljevic, J.; Živojinović, I.; Tošković, O. Connection between urban green areas and visitors’ physical and mental well-being. Urban For. Urban Green. 2019, 40, 299–307. [Google Scholar] [CrossRef]
  6. Berland, A.; Shiflett, S.A.; Shuster, W.D.; Garmestani, A.; Goddard, H.; Herrmann, D.L.; Hopton, M.E. The role of trees in urban stormwater management. Landsc. Urban Plan. 2017, 162, 167–177. [Google Scholar] [CrossRef] [PubMed] [Green Version]
  7. Xu, C.; Dong, L.; Yu, C.; Zhang, Y.; Cheng, B. Can forest city construction affect urban air quality? The evidence from the Beijing-Tianjin-Hebei urban agglomeration of China. J. Clean. Prod. 2020, 264, 121607. [Google Scholar] [CrossRef]
  8. Nowak, D.J.; Hirabayashi, S.; Bodine, A.; Greenfield, E. Tree and forest effects on air quality and human health in the United States. Environ. Pollut. 2014, 193, 119–129. [Google Scholar] [CrossRef] [Green Version]
  9. Nowak, D.J.; Crane, D.E. Carbon storage and sequestration by urban trees in the USA. Environ. Pollut. 2002, 116, 381–389. [Google Scholar] [CrossRef]
  10. Douglas, A.N.; Irga, P.J.; Torpy, F.R. Determining broad scale associations between air pollutants and urban forestry: A novel multifaceted methodological approach. Environ. Pollut. 2019, 247, 474–481. [Google Scholar] [CrossRef]
  11. Shiraiwa, M.; Selzle, K.; Pöschl, U. Hazardous components and health effects of atmospheric aerosol particles: Reactive oxygen species, soot, polycyclic aromatic compounds and allergenic proteins. Free. Radic. Res. 2012, 46, 927–939. [Google Scholar] [CrossRef]
  12. Smith, W.H. Forests, Crops, and Air Quality. BioScience 1990, 40, 781–782. [Google Scholar] [CrossRef]
  13. Wielgosinski, G. Pollutant Formation in Combustion Processes. In Advances in Chemical Engineering; Nawaz, Z., Naveed, S., Eds.; IntechOpen: London, UK, 2012; p. 30. [Google Scholar]
  14. Najjar, Y.S.H. Gaseous Pollutants Formation and Their Harmful Effects on Health and Environment. Innov. Energy Policies 2011, 1, 1–9. [Google Scholar] [CrossRef]
  15. Mijnsbrugge, K.V.; Turcsán, A.; Moreels, S.; Van Goethem, M.; Meeus, S.; Van Der Aa, B. Does Drought Stress on Seedlings Have Longer Term Effects on Sapling Phenology, Reshooting, Growth and Plant Architecture in Quercus robur, Q. petraea and Their Morphological Intermediates? Forests 2019, 10, 1012. [Google Scholar] [CrossRef] [Green Version]
  16. Sgrigna, G.; Baldacchini, C.; Dreveck, S.; Cheng, Z.; Calfapietra, C. Relationships between air particulate matter capture efficiency and leaf traits in twelve tree species from an Italian urban-industrial environment. Sci. Total. Environ. 2020, 718, 137310. [Google Scholar] [CrossRef] [PubMed]
  17. Hoshika, Y.; Carrari, E.; Mariotti, B.; Martini, S.; De Marco, A.; Sicard, P.; Paoletti, E. Flux-Based Ozone Risk Assessment for a Plant Injury Index (PII) in Three European Cool-Temperate Deciduous Tree Species. Forests 2020, 11, 82. [Google Scholar] [CrossRef] [Green Version]
  18. Lucas, J.A.; Gutierrez-Albanchez, E.; Alfaya, T.; Brito, F.F.; Gutierrez-Mañero, F.J. Oxidative stress in ryegrass growing under different air pollution levels and its likely effects on pollen allergenicity. Plant Physiol. Biochem. 2019, 135, 331–340. [Google Scholar] [CrossRef] [PubMed]
  19. Gill, S.S.; Tuteja, N. Plant Physiology and Biochemistry Reactive oxygen species and antioxidant machinery in abiotic stress tolerance in crop plants. Plant Physiol. Biochem. 2010, 48, 909–930. [Google Scholar] [CrossRef] [PubMed]
  20. Yamaguchi, M.; Kinose, Y.; Matsumura, H.; Izuta, T. Evaluation of O3 Effects on Cumulative Photosynthetic CO2 Uptake in Seedlings of Four Japanese Deciduous Broad-Leaved Forest Tree Species Based on Stomatal O3 Uptake. Forests 2019, 10, 556. [Google Scholar] [CrossRef] [Green Version]
  21. Leghari, S.K.; Saeed, S.; Asrar, M.; Ahmed, A.; Tariq, I.; Marri, A.A.; Sadiq, N.; Baloch, A.; Latif, A.; Shawani, N.A. Response of sweet cherry (Prunus avium L.) pollen grains to vehicular exhaust pollution at quetta, balochistan, pakistan. Appl. Ecol. Environ. Res. 2018, 16, 4387–4399. [Google Scholar] [CrossRef]
  22. Fröhlich-Nowoisky, J.; Kampf, C.J.; Weber, B.; Huffman, J.A.; Pöhlker, C.; Andreae, M.O.; Lang-Yona, N.; Burrows, S.M.; Gunthe, S.S.; Elbert, W.; et al. Bioaerosols in the Earth system: Climate, health, and ecosystem interactions. Atmos. Res. 2016, 182, 346–376. [Google Scholar] [CrossRef] [Green Version]
  23. Colls, J. Air Pollution, 2nd ed.; Spon Press: London, UK, 2002. [Google Scholar]
  24. Duque, L.; Guimarães, F.M.G.; Ribeiro, H.; Sousa, R.; Abreu, I. Elemental characterization of the airborne pollen surface using Electron Probe Microanalysis (EPMA). Atmos. Environ. 2013, 75, 296–302. [Google Scholar] [CrossRef] [Green Version]
  25. Oduber, F.; Calvo, A.; Blanco-Alegre, C.; Castro, A.; Vega-Maray, A.; Valencia-Barrera, R.; Fernández-González, D.; Fraile, R. Links between recent trends in airborne pollen concentration, meteorological parameters and air pollutants. Agric. For. Meteorol. 2019, 264, 16–26. [Google Scholar] [CrossRef]
  26. Sénéchal, H.; Visez, N.; Charpin, D.; Shahali, Y.; Peltre, G.; Biolley, J.-P.; Lhuissier, F.; Couderc, R.; Yamada, O.; Malrat-Domenge, A.; et al. A Review of the Effects of Major Atmospheric Pollutants on Pollen Grains, Pollen Content, and Allergenicity. Sci. World J. 2015, 2015, 1–29. [Google Scholar] [CrossRef] [PubMed] [Green Version]
  27. Das, K.; Roychoudhury, A. Reactive oxygen species (ROS) and response of antioxidants as ROS-scavengers during environmental stress in plants. Front. Environ. Sci. 2014, 2, 53. [Google Scholar] [CrossRef] [Green Version]
  28. Ribeiro, H.; Costa, C.; Abreu, I.; Da Silva, J.C.E. Effect of O3 and NO2 atmospheric pollutants on Platanus x acerifolia pollen: Immunochemical and spectroscopic analysis. Sci. Total. Environ. 2017, 291–297. [Google Scholar] [CrossRef] [PubMed]
  29. Pasqualini, S.; Tedeschini, E.; Frenguelli, G.; Wopfner, N.; Ferreira, F.; D’Amato, G.; Ederli, L. Ozone affects pollen viability and NAD(P)H oxidase release from Ambrosia artemisiifolia pollen. Environ. Pollut. 2011, 159, 2823–2830. [Google Scholar] [CrossRef] [PubMed] [Green Version]
  30. Sousa, R.; Duque, L.; Duarte, A.J.; Gomes, C.R.; Ribeiro, H.; Cruz, A.; Da Silva, J.C.G.E.; Abreu, I. In Vitro Exposure of Acer negundo Pollen to Atmospheric Levels of SO2 and NO2: Effects on Allergenicity and Germination. Environ. Sci. Technol. 2012, 46, 2406–2412. [Google Scholar] [CrossRef] [Green Version]
  31. Lu, S.; Ren, J.; Hao, X.; Liu, D.; Zhang, R.; Wu, M.; Yi, F.; Lin, J.; Shinich, Y.; Wang, Q. Characterization of protein expression of Platanus pollen following exposure to gaseous pollutants and vehicle exhaust particles. Aerobiologia 2014, 30, 281–291. [Google Scholar] [CrossRef] [Green Version]
  32. Silva, M.; Ribeiro, H.; Oliveira, M.; Cruz, A.; Da Silva, J.C.G.E. Effects of CO2 on Acer negundo pollen fertility, protein content, allergenic properties, and carbohydrates. Environ. Sci. Pollut. Res. 2014, 22, 6904–6911. [Google Scholar] [CrossRef]
  33. Cuinica, L.G.; Abreu, I.; Gomes, C.R.; Da Silva, J.C.G.E. Exposure of Betula pendula Roth pollen to atmospheric pollutants CO, O3 and SO2. Grana 2013, 52, 299–304. [Google Scholar] [CrossRef]
  34. Chassard, G.; Choël, M.; Gosselin, S.; Vorng, H.; Petitprez, D.; Shahali, Y.; Tsicopoulos, A.; Visez, N. Kinetic of NO2 uptake by Phleum pratense pollen: Chemical and allergenic implications. Environ. Pollut. 2015, 196, 107–113. [Google Scholar] [CrossRef] [PubMed]
  35. Farah, J.; Choël, M.; De Nadaï, P.; Gosselin, S.; Petitprez, D.; Baroudi, M.; Visez, N. Extractable lipids from Phleum pratense pollen grains and their modifications by ozone exposure. Aerobiologia 2019, 36, 171–182. [Google Scholar] [CrossRef]
  36. Zhu, C.; Farah, J.; Choël, M.; Gosselin, S.; Baroudi, M.; Petitprez, D.; Visez, N. Uptake of ozone and modification of lipids in Betula Pendula pollen. Environ. Pollut. 2018, 242, 880–886. [Google Scholar] [CrossRef] [PubMed]
  37. Heslop-Harrison, J.; Heslop-Harrison, Y.; Shivanna, K.R. The evaluation of pollen quality, and a further appraisal of the fluorochromatic (FCR) test procedure. Theor. Appl. Genet. 1984, 67, 367–375. [Google Scholar] [CrossRef] [PubMed]
  38. Bradford, M.M. A Rapid and Sensitive Method for the Quantitation of Microgram Quantities of Protein Utilizing the Principle of Protein-Dye Binding. Anal. Biochem. 1976, 72, 248–254. [Google Scholar] [CrossRef]
  39. Zafra, A.; Castro, A.J.; Alché, J.D.D. Identification of novel superoxide dismutase isoenzymes in the olive (Olea europaea L.) pollen. BMC Plant Biol. 2018, 18, 114. [Google Scholar] [CrossRef] [PubMed]
  40. Luria, G.; Rutley, N.; Lazar, I.; Harper, J.F.; Miller, G. Direct analysis of pollen fitness by flow cytometry: Implications for pollen response to stress. Plant J. 2019, 98, 942–952. [Google Scholar] [CrossRef]
  41. Marino, D.; Dunand, C.; Puppo, A.; Pauly, N. A burst of plant NADPH oxidases. Trends Plant Sci. 2012, 17, 9–15. [Google Scholar] [CrossRef]
  42. Ren, R.; Li, Z.; Zhang, L.; Zhou, H.; Jiang, X.; Liu, Y. Enzymatic and nonenzymatic antioxidant systems impact the via-bility of cryopreserved Paeonia suffruticosa pollen. Plant Cell Tissue Organ Cult. 2020. [Google Scholar] [CrossRef]
  43. Uka, U.N.; Hogarh, J.; Belford, E.J.D. Morpho-Anatomical and Biochemical Responses of Plants to Air Pollution. Int. J. Mod. Bot. 2017, 7, 1–11. [Google Scholar]
  44. Rao, M.; Dubey, P. Biochemical aspects (antioxidants) for development of tolerance in plants growing at different low levels of ambient air pollutants. Environ. Pollut. 1990, 64, 55–66. [Google Scholar] [CrossRef] [PubMed]
  45. Diehn, S.; Zimmermann, B.; Tafintseva, V.; Seifert, S.; Bağcıoğlu, M.; Ohlson, M.; Weidner, S.; Fjellheim, S.; Kohler, A.; Kneipp, J. Combining Chemical Information from Grass Pollen in Multimodal Characterization. Front. Plant Sci. 2020, 10, 1788. [Google Scholar] [CrossRef] [PubMed] [Green Version]
  46. Guedes, A.; Ribeiro, H.; Fernández-González, M.; Aira, M.; Abreu, I. Pollen Raman spectra database: Application to the identification of airborne pollen. Talanta 2014, 119, 473–478. [Google Scholar] [CrossRef] [PubMed]
  47. Ivleva, N.P.; Niessner, R.; Panne, U. Characterization and discrimination of pollen by Raman microscopy. Anal. Bioanal. Chem. 2005, 381, 261–267. [Google Scholar] [CrossRef] [PubMed]
  48. Kanter, U.; Heller, W.; Durner, J.; Winkler, J.B.; Engel, M.; Behrendt, H.; Holzinger, A.; Braun, P.; Hauser, M.; Ferreira, F.; et al. Molecular and Immunological Characterization of Ragweed (Ambrosia artemisiifolia L.) Pollen after Exposure of the Plants to Elevated Ozone over a Whole Growing Season. PLoS ONE 2013, 8, e61518. [Google Scholar] [CrossRef] [PubMed]
  49. Zhao, F.; Elkelsih, A.; Durner, J.; Lindermayr, C.; Winkler, J.B.; Ruëff, F.; Behrendt, H.; Traidl-Hoffmann, C.; Holzinger, A.; Kofler, W.; et al. Common ragweed (Ambrosia artemisiifolia L.): Allergenicity and molecular characterization of pollen after plant exposure to elevated NO2. Plant Cell Environ. 2015, 39, 147–164. [Google Scholar] [CrossRef] [PubMed]
  50. Møller, I.M.; Jensen, P.E.; Hansson, A. Oxidative Modifications to Cellular Components in Plants. Annu. Rev. Plant Biol. 2007, 58, 459–481. [Google Scholar] [CrossRef] [Green Version]
  51. Gupta, M.K.; Uhm, S.J.; Lee, H.T. Effect of vitrification and beta-mercaptoethanol on reactive oxygen species activity and in vitro development of oocytes vitrified before or after in vitro fertilization. Fertil. Steril. 2010, 93, 2602–2607. [Google Scholar] [CrossRef]
  52. Depciuch, J.; Kasprzyk, I.; Sadik, O.; Parlińska-Wojtan, M. FTIR analysis of molecular composition changes in hazel pollen from unpolluted and urbanized areas. Aerobiologia 2017, 33, 1–12. [Google Scholar] [CrossRef] [Green Version]
Figure 1. Immunodetection of SOD enzymes in pollen protein extracts (10 μg per lane) from A. negundo, B. pendula, C. avellana and Q. robur non exposed pollen, blank sample (B) and exposed for 6 h to O3 and NO2 at concentrations corresponding to half the limit (1/2), the limit (Lim) and the double limit (2 × Lim) values for the protection of vegetation according to the EU Directive 2008/50/EC on ambient air quality and cleaner air for Europe. Top figures correspond to Western blot probed with a customized anti-olive pollen Cu/Zn SOD Ab (sequence accession n. EU250769.1) and bottom graphics to differences in optical density of reactive bands. “*” aggregates the results of two molecular bands, which are different depending on the species.
Forests 12 00088 g001
Figure 2. Average Raman spectra of A. negundo, B. pendula, C. avellana and Q. robur pollen, exposed for 6 h to O3 (upper figure) and NO2 at concentrations corresponding to half the limit (1/2), the limit (Lim) and the double limit (2 × Lim) values for the protection of vegetation according to the EU Directive 2008/50/EC on ambient air quality and cleaner air for Europe. The grey squares highlight the regions where visible changes occur.
Forests 12 00088 g002
Table 1. Average and standard deviation values of temperature, relative humidity and gas concentrations obtained inside the fumigation chamber for each assay.
BlankOzoneNO2
½ LimLim2 × Lim½ LimLim2 × Lim
Acer negundo
Δ T (°C)24.5 ± 0.39125.4 ± 1.55425.2 ± 0.23623.7 ± 0.90525.3 ± 0.42424.6 ± 0.64524.2 ± 0.259
Δ RH (%)59.1 ± 0.65461.2 ± 1.64161.9 ± 0.96861.4 ± 1.27462.3 ± 0.24161.2 ± 1.23860.2 ± 0.427
(Gas) (ppm)---0.031 ± 0.0020.064 ± 0.0140.125 ± 0.0160.051 ± 0.0100.113 ± 0.0370.197 ± 0.039
Betula pendula
Δ T (°C)25.6 ± 0.88025.6 ± 0.97521.5 ±1.18224.6 ± 1.08028.4 ± 0.70625.6 ± 0.68025.4 ±0.866
Δ RH (%)59.6 ± 0.99160.7 ± 0.93259.1 ± 1.39860.9 ± 0.94458.2 ± 1.09860.3 ± 1.31059.8 ± 1.285
(Gas) (ppm)---0.030 ± 0.0010.061 ± 0.0150.120 ± 0.0300.055 ± 0.0210.104 ± 0.0170.195 ± 0.036
Corylus avellana
Δ T (°C)24.4 ± 0.64325.3 ± 0.89924.8 ±0.71424.6 ± 0.62825.0 ± 0.86825.3 ± 0.64524.0 ± 0.882
Δ RH (%)59.9 ± 0.92556.2 ± 1.80260.9 ± 2.01059.9 ± 1.00057.4 ± 0.37757.4 ± 1.52763.2 ± 0.575
(Gas) (ppm)---0.030 ± 0.0050.059 ± 0.0130.119 ± 0.0900.057 ± 0.0220.105 ± 0.0440.203 ± 0.060
Quercus robur
Δ T (°C)24.0 ± 0.97924.9 ± 1.52925.5 ± 1.10325.0 ± 1.57724.6 ± 0.92324.6 ± 0.90324.9 ± 0.557
Δ RH (%)60.7 ± 2.21861.4 ± 1.40758.5 ±1.56862.1 ± 1.67059.0 ± 1.18961.2 ± 1.57261.0 ± 1.157
(Gas) (ppm)---0.029 ± 0.0100.060 ± 0.0170.120 ± 0.0150.059 ± 0.0180.112 ± 0.0270.220 ± 0.046
Δ T: average temperature, Δ RH: average relative humidity and [Gas]: average gas concentration registered along with the experiments.
Table 2. Statistically significant percentage loss (arrows down) or increase (arrows up) in average pollen viability, total soluble protein content, reactive oxygen species (ROS) content and NADPH oxidase enzymatic activity, for A. negundo, B. pendula, C. avellana and Q. robur non exposed pollen, blank sample (B) and exposed for 6 h to O3 and NO2 at concentrations corresponding to values close to the half the limit (1/2), the limit (Lim) and the double limit (2 × Lim) for the protection of vegetation according to the EU Directive 2008/50/EC on ambient air quality and cleaner air for Europe. Statistically significant differences given by the ANOVA test followed by the Tukey’s post-hoc test (p < 0.05).
OzoneNO2
½ LimLim2 × Lim½ LimLim2 × Lim
Viability
Acer negundo7%↓9%↓
Betula pendula9%↓8%↓8%↓17%↓
Corylus avellana12% ↓21%↓13%↓5%↓13%↓16%↓
Quercus robur4% ↓5%↓7%↓3%↓7%↓12%↓
Total Soluble Protein content
Acer negundo13%↓18%↓22%↓19%↓6%↓19%↓
Betula pendula22%↑
Corylus avellana20%↓10%↑16%↑28%↑
Quercus robur19%↓13%↓29%↓53%↓
ROS content
Acer negundo12%↑13%↑12%↑12%↑12%↑23%↑
Betula pendula6%↑3%↑2%↑6%↑
Corylus avellana12%↑7%↑
Quercus robur8%↑12%↑11%↑12%↑10%↑
NADPH oxidase enzymatic activity
Acer negundo28%↑
Betula pendula15%↑15%↑14%↑
Corylus avellana
Quercus robur21%↑20%↑
Publisher’s Note: MDPI stays neutral with regard to jurisdictional claims in published maps and institutional affiliations.

