Article

Age-Dependent Changes in Soil Respiration and Associated Parameters in Siberian Permafrost Larch Stands Affected by Wildfire

by
Oxana V. Masyagina
1,*,
Svetlana Y. Evgrafova
1,2,3,
Oleg V. Menyailo
1,
Shigeta Mori
4,
Takayoshi Koike
5,† and
Stanislav G. Prokushkin
1
1
Sukachev Institute of Forest SB RAS, Federal Research Center “Krasnoyarsk Science Center SB RAS”, 50/28 Akademgorodok St., 660036 Krasnoyarsk, Russia
2
Institute of Fundamental Biology and Biotechnology, Siberian Federal University, 79 Svobodny Avenue, 660041 Krasnoyarsk, Russia
3
Melnikov Permafrost Institute SB RAS, 36 Merzlotnaya St., 677010 Yakutsk, Russia
4
Faculty of Agriculture, Yamagata University, Wakabamachi 1-23, Tsuruoka, Yamagata 997-8555, Japan
5
Research Faculty of Agriculture, Hokkaido University, Sapporo 060-8589, Japan
*
Author to whom correspondence should be addressed.
Present address: Research Center for Eco-Environmental Science, Beijing 100085, China.
Submission received: 24 November 2020 / Revised: 7 January 2021 / Accepted: 14 January 2021 / Published: 19 January 2021
(This article belongs to the Special Issue Forest Soil Carbon and Climate Changes)

Abstract

:
The observed high spatial variation in soil respiration (SR) and associated parameters emphasized the importance of SR heterogeneity at high latitudes and the involvement of many factors in its regulation, especially within fire-affected areas. The problem of estimating CO2 emissions during post-fire recovery in high-latitude ecosystems addresses the mutual influence of wildfires and climate change on the C cycle. Despite its importance, especially in permafrost regions because of their vulnerability, the mutual influence of these factors on CO2 dynamics has rarely been studied. Thus, we aimed to understand the dynamics of soil respiration (SR) in wildfire-affected larch recovery successions. We analyzed 16-year data (1995–2010) on SR and associated soil, biological, and environmental parameters obtained during several field studies in larch stands of different ages (0–276 years) in the Krasnoyarsk region (Russia). We observed a high variation in SR and related parameters among the study sites. SR varied from 1.77 ± 1.18 (mean ± SD) µmol CO2 m−2 s−1 in the 0–10-year-old group to 5.18 ± 2.70 µmol CO2 m−2 s−1 in the 150–276-year-old group. We found a significant increasing trend in SR in the 88–141-year old group during the study period, which was related to the significant decrease in soil water content due to the shortage of precipitation during the growing season. We observed a high spatial variation in SR, which was primarily regulated by biological and environmental factors. Different parameters were the main contributors to SR in each group, an SR was significantly affected by the inter-relationships between the studied parameters. The obtained results can be incorporated into the existing SR databases, which can allow their use in the construction and validation of C transport models as well as in monitoring global fluctuations in the C cycle in response to climate change.

Graphical Abstract

1. Introduction

SR is an essential component in C cycle in terrestrial ecosystems; however, there is still little information on it available in Siberia (Russia) [1]. With rapid progress in climate change, the pattern and amount of precipitation at boreal regions has been changing, and, consequently, SR fluctuates drastically even after recovery process after forest fires [2]. Wildfires in boreal forests are important for the sustainable functioning of these northern ecosystems because they regulate the successional processes of permafrost forest ecosystem formation [3,4], and they are often considered as the main stand-renewing agents [5].
Climate change can shift the balance in forest–fire interaction, which can have irreversible consequences. In their review, Balshi et al. (2007) [6] indicated that forest fires play a key role in interannual and interdecadal changes in C source/sink ratios of northern terrestrial ecosystems, and they suggested that in addition to climate change (e.g., elevated temperature, shortage of precipitation, increase in vapor pressure deficit) and fires, atmospheric CO2 response to these factors may be important too. Consequently, the mutual influence of forest fires and climate change at high latitudes, especially in permafrost regions because of their proven vulnerability [7,8], complicates the estimation of CO2 emissions over post-fire recovery processes. In addition, the variability in soil respiration (SR) can be 100-fold as a consequence of bioclimatic and soil environmental differences and disturbance of impact degree [9]. Moreover, large concern of the SR changes at high latitudes was aggravated by the uncertainties in the response of permafrost, loaded with large amounts of C, to both climate change and wildfires [10]. Thus, because of the mutual effects of wildfires, climate change, and high SR variability at high latitudes, it is complicated to develop models for simulating the response of permafrost ecosystems to these factors, which can be highly uncertain, as they require a higher frequency of field research for the validation of such models. The increase in fire frequency and damaged areas exacerbates this problem every year [11,12]. Some studies have linked the increased frequency of fires and burned areas in boreal ecosystems to climate change [6,13,14], and concluded that their combined effects would lead to permafrost degradation [15,16]. For example, according to IPCC (2014) [17], in the northern regions of Asia, a 1 °C increase in air temperature can prolong the wildfire season by 30%. Bergner et al. (2004) [18] showed a positive effect of experimental soil warming (0.4–0.9 °C) on soil C flux in post-fire soils of the boreal region (Alaska).
After forest fires, the depth of available soil layers increase and root growth of regenerated trees develops; however, it decreases with the development of a forest canopy, which is attributed to an increase in the competition among roots [8]. Consequently, it is predicted that SR per unit area will decrease. Wildfires alone can completely modify the SR process [19]. The decadal effects of wildfires in the Northern hemisphere, especially on permafrost soils and their CO2 emissions, are still not well understood [1], even though their importance in the global climate change scenario is well recognized. The effect of the length of post-fire succession on SR dynamics has been studied in Canada [20,21], USA (Alaska) [18,22,23], Estonia [24,25], and Russia [2,26,27,28,29]. Studies on the impact of forest fires on SR in northern, arctic, and subarctic ecosystems, which were mainly carried out during summer field investigations, showed that forests newly affected by fire are C sources, whereas old forests recovered after fires are C sinks [22,30,31,32] or are almost C-neutral [33] during the growing season. Studies have assessed the spatial and temporal variation in SR and associated parameters, such as changes in soil temperature, soil water content, albedo, heat-modified soil organic matter composition, and autotrophic and heterotrophic activity [34,35,36,37,38]. However, because of their remoteness and poor accessibility, only a few studies have been carried out in the northern taiga forest ecosystems of the Yenisei River basin in central Siberia, which is the studied area of the presented study [28,33].
In the present study, we evaluated the SR rates along a chronosequence of post-fire successions in permafrost larch ecosystems located in central Siberia (Tura) during the period of 1995–2010. To understand the role of forest fire in the SR dynamics of northern ecosystems, it is also important to evaluate changes in fire disturbance in the context of other environmental factors. Therefore, we evaluated the most influential factors among soil, biological, and environmental parameters that could affect the SR dynamics (including soil temperature, soil water content, soil C and N contents, soil C/N, soil microbial activity, root biomass, height of the vegetation cover, and litter (i.e., soil organic layer) depth). We hypothesized that as the fire-disturbed forests recover, the SR rates would change because the related parameters would vary over time due to wildfire disturbance, inherited landscape heterogeneity, and the influence of continuous permafrost. Moreover, we hypothesized that SR will have an increasing trend along the recovery succession during the period of 1995–2010 due to well-documented and modeled effects of climate change on high-latitude ecosystems via increased temperature [6] or soil water balance changes [39]. Our third hypothesis was that permafrost ecosystems represent self-sustaining systems which may adapt to different disturbances (e.g., wildfire) via compensating for the disturbed ecosystem functions (i.e., parameters) by other parameters in order to achieve ecosystem functional stabilization. Therefore, our main objectives were (1) to determine how wildfires affect the SR and to evaluate fire-induced changes in SR rates along the post-fire succession in 0–276 year-old wildfire-affected larch forest ecosystems; (2) to understand the most influential factors affecting the dynamics of SR at different stages of the recovery succession; and (3) to estimate the SR trends at different stages of succession during the period of 1995–2010.

2. Materials and Methods
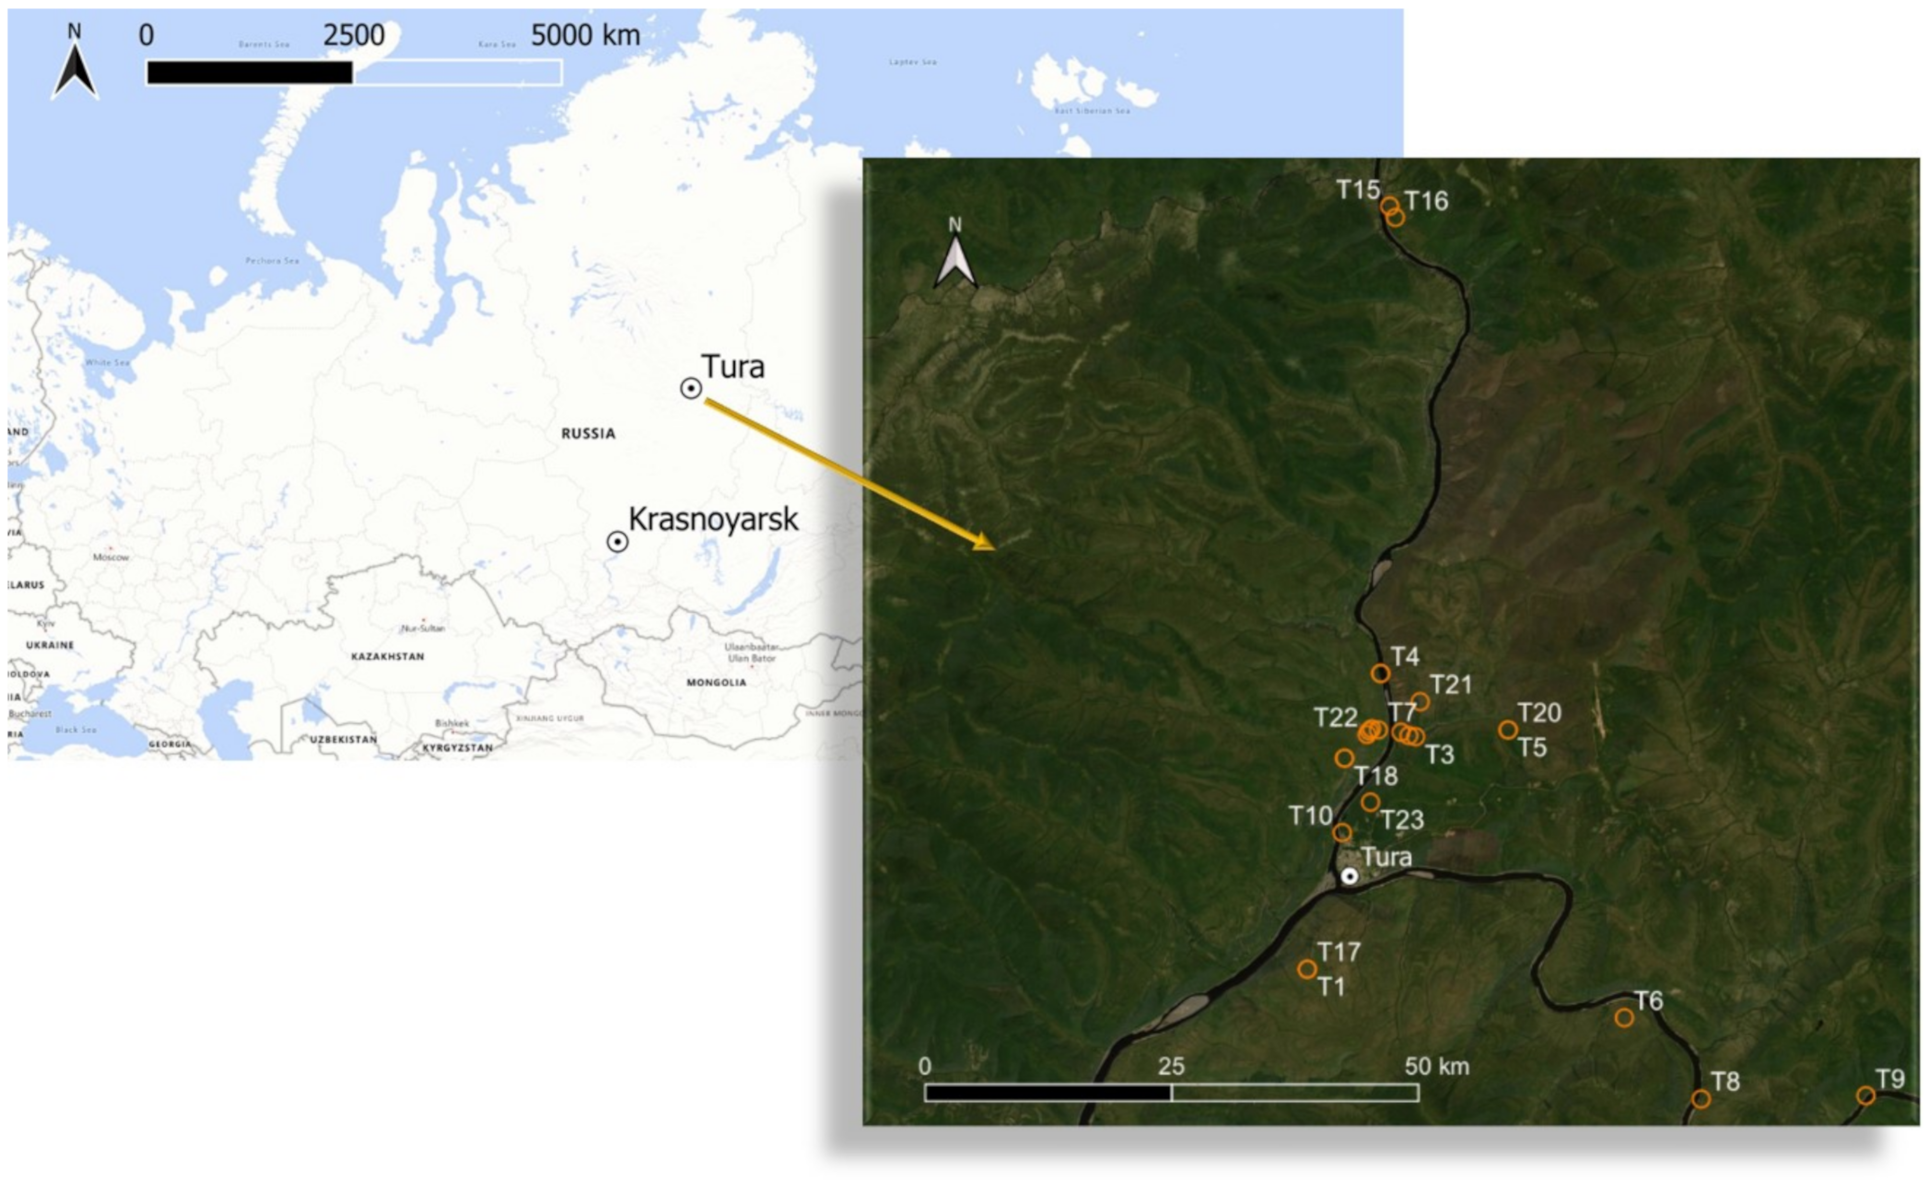
2.1. Study Location

The area adjacent to the research site (Tura, Krasnoyarsk region, Russia) was characterized as highly burnable (the average fire recurrence time is 60–90 years; [40]). The study sites included 23 permanent wildfire-affected plots in northern taiga forests of different ages located within a 100-km radius from the Evenkian Field Station in Tura (Figure 1 and Figure 2, Table 1). The sites were examined in parallel at the same time to infer the status of the ecosystem as a function of age (i.e., time since fire disturbance). We used this chronosequence approach [22,36,41] to acquire age-related data in a short period, and we repeated it every 4–5 years. The advantage of this approach was that it took less time than long-term observations. In addition, fire prediction and prevention measures are less developed in remote areas such as Tura than in populated areas; thus, there is no certainty about the future safety of the research sites with such a high probability of fire hazards.
The climate in the Tura area is continental (mean annual air temperature −9.5 °C) with wide temperature amplitudes and precipitation distribution. Cold winters (mean air temperature in January is −36.7 °C) and moderately warm summers (mean air temperature in July is 16.3 °C) with the annual precipitation range of about 250–548 mm are typical for the studied region. The study sites are characterized by underlying continuous permafrost. The vegetative period lasts 69–80 days [2]. The area belongs to the northern taiga, which is dominated by the deciduous tree species Larix gmelinii (Rupr.) Kuzen with occasional Betula pubescens Ehrh., Picea obovata Ledeb., and shrub Duschekia fruticosa (Rupr.) Pouzar. The characteristics of each study site are presented in Table 1. The ground vegetation consists of mosses, lichens, and dwarf shrubs, such as Sphagnum sp., Cladonia sp., Vaccinium vitis-idaea L., Vaccinium uliginosum L., Ledum palustre L., Pleurozium schreberi (Willd. ex Brid.) Mitt., Aulacomnium palustre (Hedw.) Schwaegr., Cladina spp., and Cetraria spp.

2.2. Field Measurements

At each site, we set a 20 m transect where we placed 6 to 20 polyvinylchloride (PVC) collars (D = 10 cm) for subsequent setting of the chamber of the IR gas analyzer Li-Cor 6200 (LI-COR, Lincoln, NE, USA). The measurements of SR (µmol CO2 m−2 s−1) were carried out from June to September over 1995–2010 (Table 1). Measured in the present study, SR included several sources of CO2 emission, e.g., soil microbial respiration, root respiration associated with mycorrhiza, and CO2 diffusion as the driving source of chemical-physical processes [37]. SR collars were laid into the soil organic layer at the depth of 1–2 cm to prevent gas leaking, which can disturb the results. The SR measurements were started 24 h after this to achieve the equilibrium of the gas rate. Along with SR measurements, mineral soil temperature at the depth of 5 cm (ST5, °C) was recorded using an electronic thermometer Checktemp 1 (CheckTemp, Hanna, USA), as described by Masyagina et al. (2020) [2]. Measurements of the vegetation cover height (mosses and lichens, VegH) and litter depth (organic soil layer, LitD) were performed near the SR collar.

2.3. Field Sampling

To assess the water content at the depth of 5 cm (SWC5, %) in the mineral soil, we collected mineral soil samples with a steel corer at the same depth (5 cm) within each collar. SWC was calculated after drying the samples at 105 °C to a constant weight.
To understand how SR is related to chemical and biological soil parameters, we collected soil samples for subsequent analyses of C and N contents and for conducting the incubation experiments to assess the soil heterotrophic basal respiration (BR, mg CO2-C kg−1 of soil day−1) and substrate-induced respiration (SIR, mg CO2-C kg−1 of soil day−1). In August, mineral soil samples were collected near the SR collars from below the top 5 cm of soil (i.e., the mineral soil layer) with 3–4 repetitions, and they were then placed in the refrigerator and kept at 4 °C until transportation. The samples were then transported to the laboratory and processed according to previously described methods [28].

2.4. Laboratory Analyses and Incubations

Mineral Soil C and N Contents

Before analysis, soil samples were dried at 60 °C for 48 h and sieved to obtain fractions of < 2 mm. Then, the soil C and N contents were determined with the Elemental Carbon and Nitrogen Analyzer (Vario EL III, Elementar, Langenselbold, Germany).

Microbial Soil BR and SIR

As the representatives of soil microbiological activity, we determined microbial BR and SIR during the soil incubation experiments. The soil samples were air-dried, and the roots with D > 1 mm were removed from the soil. The root material that remained after soil sieving was used for root biomass evaluation after drying at 60 °C for 48 h. The dried soil material was homogenized and then sieved through a 2 mm mesh. To assess the BR and SIR, fresh mineral soil (5 g) with absolute soil moisture of 60% was placed in 250 mL glass flasks. In the flasks for SIR determination, we added 0.1 mL of a glucose-mineral solution to obtain soil glucose concentration of 10 mg g−1. The flasks were then hermetically closed with resin stoppers and incubated at 22 °C. The soil gases were sampled twice from the flasks: the first time after the flasks were sealed, and the second time 24 (in case of BR) or 3 h later (in case of SIR). CO2 concentrations were analyzed using a gas chromatography (Agilent 6890N (Santa Clara, CA, USA); [28]).

2.5. Data Analyses

Our dataset included > 1000 measurements from the 23 study sites (Table 1) with different post-fire histories and ages. The studied parameters (age of the burned area, SR, ST5, SWC5, and VegH) were analyzed using principal component analysis (PCA) using the “factoextra” R package. Four age classes (Figure 3; 0–10, 11–54, 88–141, and 150–276 years old) of the burned areas were used for further analysis.
The studied parameters (SR, ST5, SWC5, C and N contents, C/N, BR, SIR, VegH, LitD, and root biomass) were tested for normality prior to analysis. Due to non-normally distributed data, the Kruskal–Wallis chi-squared test (p < 0.05, R package “dplyr”) was used to test the main effects of stand age class and month of the growing season (June, July, August, and September) on all studied parameters. The Kruskal–Wallis test by rank is a non-parametric alternative to one-way analysis of variance (ANOVA). We performed pairwise comparisons using the Wilcoxon rank sum test (p < 0.05) in analyses of more than two groups of variables. PCA was used to study the correlations between parameters (SR, ST5, SWC5, C and N contents, C/N, BR, and SIR) among various burnt area age groups. Comparisons of post-fire successions between different age groups for the 16-year period (1995–2010) were performed using the Kruskal–Wallis test extended with the Wilcoxon test. Pearson’s product-moment correlation coefficients (significant at p < 0.05 or p < 0.01) were used for correlation analysis between all studied parameters. Kα is a criterion assessing the permafrost sensitivity to climate change [44]. It was calculated as the ratio of ST5 to air temperature measured at the same time in the same plot [44]. The R package “aplpack” with the function “faces” was used to generate the Chernoff faces (presented at Figure A1, Appendix A) [45]. The analyses of the obtained data were performed using RStudio version 1.3.1073-© 2009-2020 RStudio, Inc (Boston, MA, USA).

3. Results

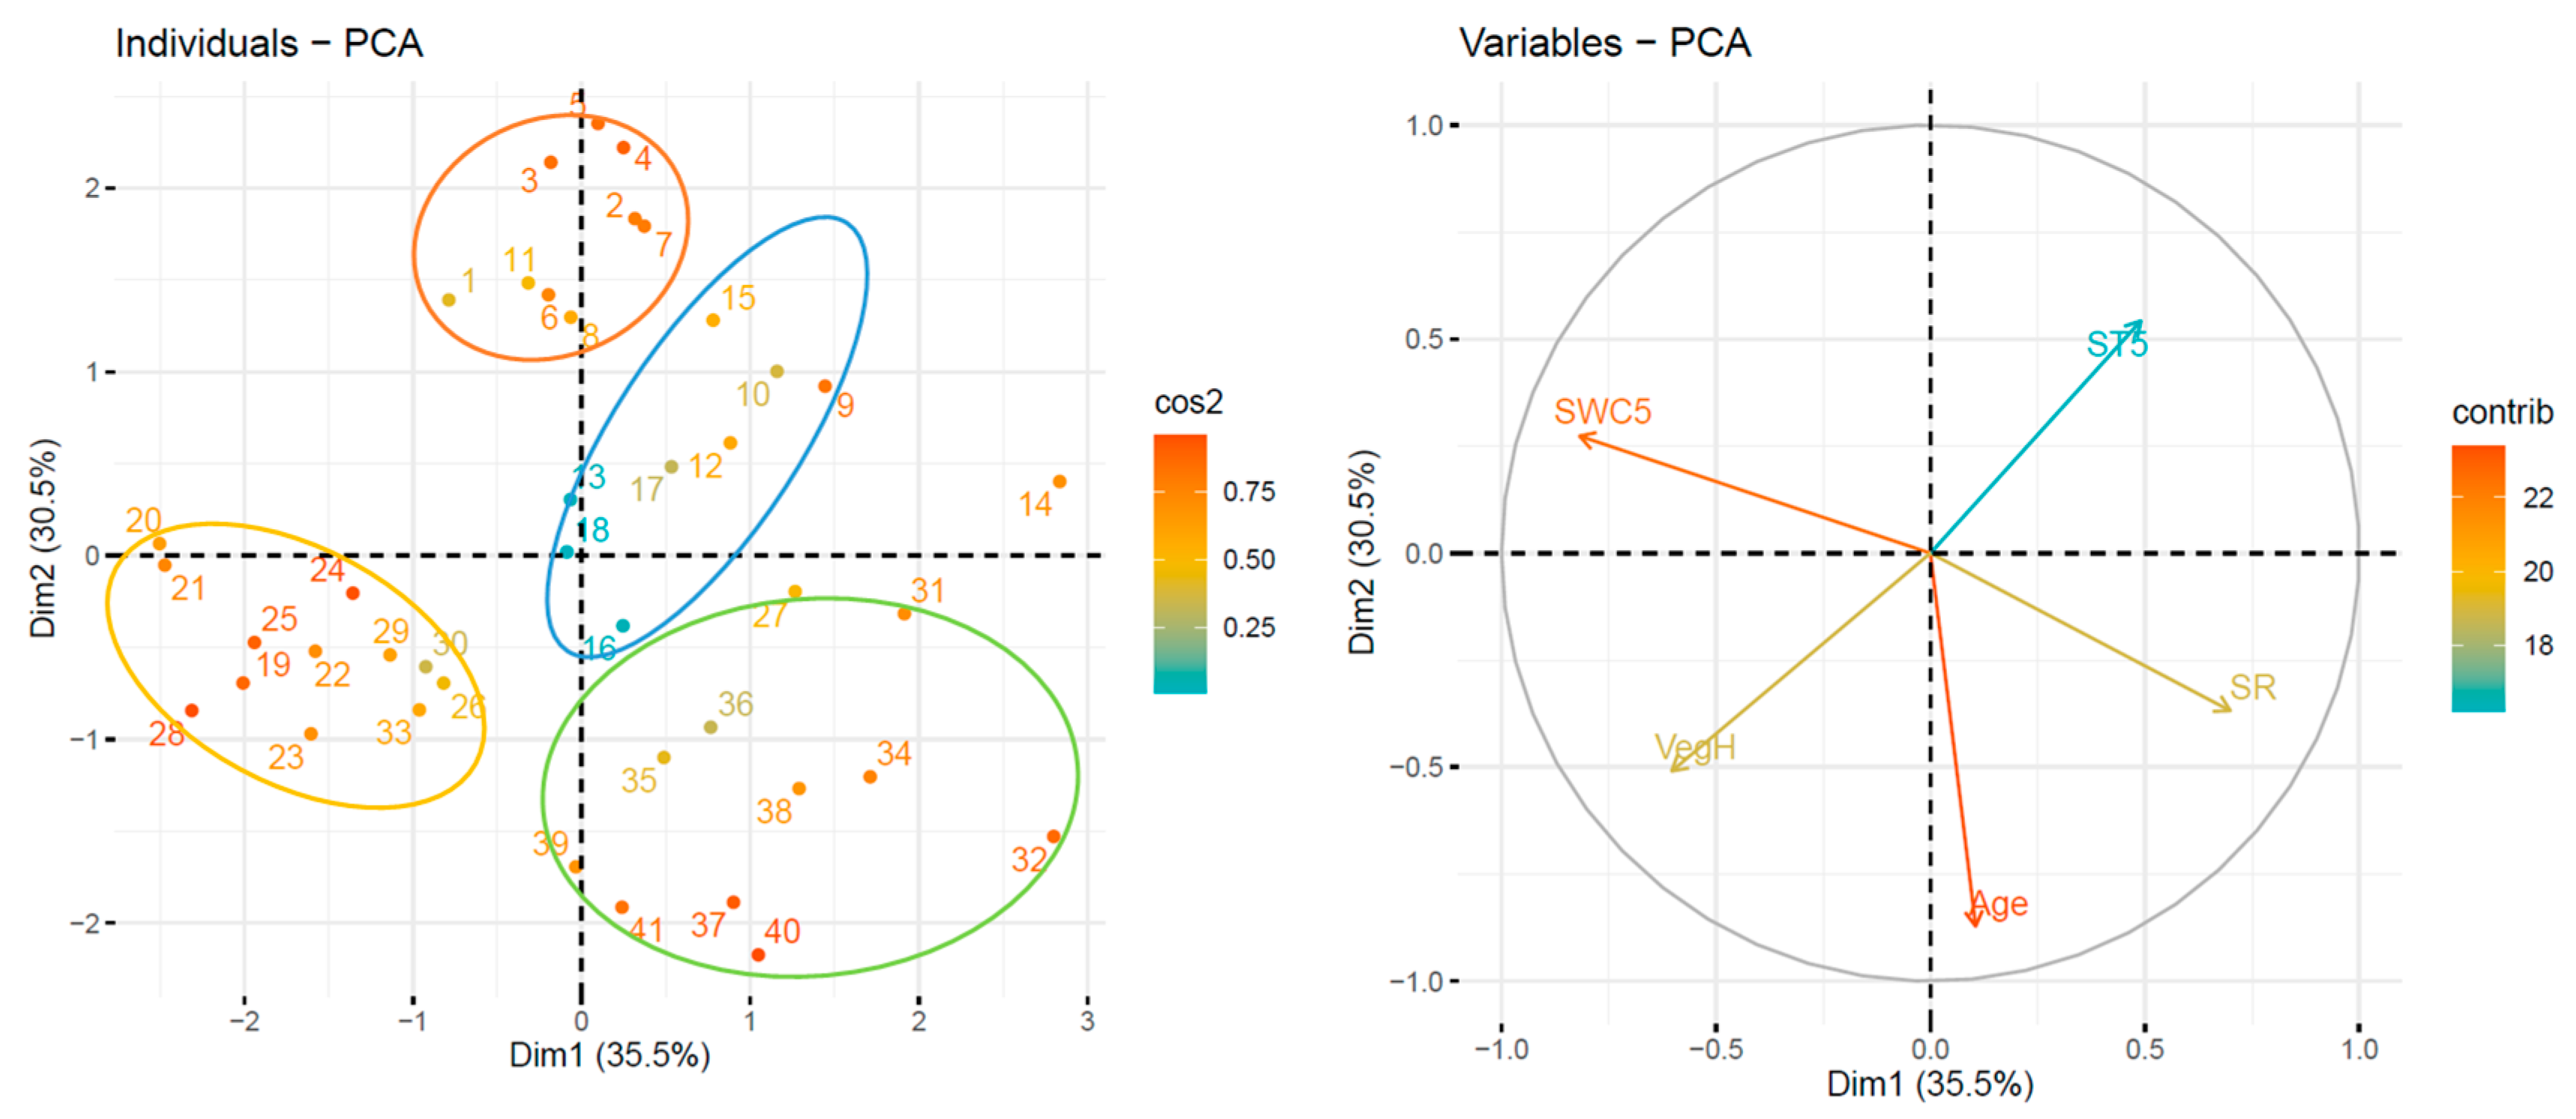
3.1. Postpyrogenic SR Data Clustering Using PCA

Before analysis, the SR data were classified into groups according to the age of post-fire forest successions, ST5, SWC5, VegH, and SR using PCA (Figure 3), which classified the original 41 age gradations of wildfire-affected sites into four main groups (0–10, 11–54, 88–141, and 150–276 years old). These four groups were used for further analyses.

3.2. Temporal and Spatial Variation in SR and Associated Factors, and Their Correlations

The analysis of SR data in the studied post-pyrogenic successions of different ages showed commonly high heterogeneity of SR rates (coefficient of variation, CV > 52%, Table 2) in both the sites recently disturbed by fires (CV = 67%) and in old successional sites (CV = 52–67%). The measured SR varied from 0.12 to 12.21 µmol CO2 m−2 s−1 (mean ± SD, 3.16 ± 2.30) seasonally and within the studied period (1995–2010). Among different stand age groups, the SR varied between 0.12 and 7.16 µmol CO2 m−2 s−1 (mean ± SD, 1.77 ± 1.18, CV = 67%) in 0–10 years old burnt areas, from 1.08 to 12.02 µmol CO2 m−2 s−1 (mean ± SD, 4.65 ± 2.73, CV = 59%) in 11–54 years old burnt areas, from 0.40 to 11.02 µmol CO2 m−2 s−1 (mean ± SD, 2.83 ± 1.89, CV = 67%) in 88–141 years old burnt areas, and from 1.08 to 12.21 µmol CO2 m−2 s−1 (mean ± SD, 5.18 ± 2.7, CV = 52%) in 150–276 years old burnt areas.
Recent wildfire disturbance (0–10 age group) resulted in a 20–30% increase in the variation in SR, LitD, and root biomass (Table 2) compared to those in the 150–276-year-old group. In the majority of the studied parameters (BR, SIR, SWC5, C and N contents, C/N, VegH, July ST5, and September ST5), the variation was 13-102% decreased in the 0–10-year-old group due to wildfire compared to their values in the 150–276-year-old group.
The age of larch stands affected by forest fires (0–10, 11–54, 88–141, and 150–276 year groups) and month of the growing season (June, July, August, and September) significantly affected the studied variables (Table 3). We found that the relationships between variables influenced by the age of the burnt area, month of the growing season, and interannual changes are very complex, which is possibly related to climate change in the study area. The 0–10 age group was characterized by significantly lower values of SR, root biomass, and BR than those in the other groups, as well as high values of ST5 (averaged over the growing season), ST5 in August, and SWC5 (Table 2). In the 11–54 and 150–276 age groups, similar features were observed, such as the same high SR values (mean SR values of 4.65 and 5.18 μmol m−2 s−1, respectively), the same low SWC5 (39%), and similar root biomass (1.65 and 3.18 g, respectively) (Table 2). However, these similar SR rates were likely a consequence of different combinations of the processes involved (autotrophic and heterotrophic respiration). For example, in the 11–54 age group, low root respiration due to low root biomass was offset by high BR (135 mg CO2-C kg−1 day−1). In contrast, in the 150–276 age group, the significantly low BR (41.3 mg CO2-C kg−1 day−1) was compensated? by high root activity. In terms of SR, the 88–141 age group values were between the values of the 0–10 group and the 11–54 and 150–276 groups. This was because, despite the high BR values (comparable to the 11–54 group) and high root biomass (similar to the 150–276 group), severe limitation in hydrothermal conditions (low ST5 = 7.53° C and high SWC5 = 73%) was presented in the 88–141 age group, and this inhibited SR. However, some of the studied variables (C and N content, C/N, and SIR) did not differ significantly among groups.
The seasonal dynamics of SR varied among different age groups of the burnt areas (Figure 4a). In the 0–10-year-old group, the maximum SR value was observed in July–August and the minimum in September. In the 11–54 years old group, SR did not differ significantly over the growing season. In the 88–141 years old group, the maximum SR value was recorded at the beginning of the growing season (June), after which it gradually decreased towards the end of the season. In the oldest 150–276 year-old forest successional group, the maximum SR value was recorded in July, and the minimum in August.
The seasonal dynamics of ST5 were similar in all age groups of the studied burnt areas (Figure 4b). The maximum ST5 values were observed in the middle of the growing season (July–August). In August, ST5 levels were significantly higher in the 0–10-year-old group than in the other three groups (Figure 4b). During the growing season, SWC5 did not differ significantly among the age groups (Figure 4c), and the highest SWC5 values were recorded in the 88–141 years old group.
As shown in Figure 5, the four age groups defined in the preliminary PCA (Figure 3) were ordinated at significant distances from each other; thus, they differed based on the measured environmental variables. The main variation was captured by two components (PC1 and PC2), which described 79.6% of all variations (Figure 5). The main contributors to PC1 were the C and N contents, ST5, and root biomass, which had the highest impact, and SIR, and VegH (Table 4), whereas the main contributors to PC2 were mean SWC5 and SR, which had the highest impact, and LitD, and VegH. For PC3, the main contributors were soil C/N (highest impact), BR, and root biomass, whereas for PC4–the minimum principal component—these were ST5 (highest impact) and soil C/N (Table 4). As indicated by the PCA, SR was negatively correlated with LitD and SWC5 (Figure 5). The parameter most positively related to SR was soil N content.
In the correlation analysis (Table 5) of wildfire-affected successions of different ages showed within each group, SR was correlated with various factors. In the 0–10-year-old group, SR was negatively correlated with BR and SIR (r = −0.54 and r = −0.69, Table 5) and positively correlated with stand age (or period after disturbance, r = 0.31, p<0.01). In the 11–54-year-old group, SR was significantly positively correlated with ST5 and SIR, and negatively correlated with VegH and stand age. In the 88–141-year-old group, SR was negatively correlated with SWC5 and VegH, and positively correlated with LitD, ST5, and stand age. In the 150–276-year-old group, SR was positively correlated with soil C and N contents, SIR, and LitD. These results were in accordance with the PCA results regarding the most influential factors inferred by the principal components (Figure 5, Table 4).
If we consider the correlations between all parameters within each age group, the strongest correlations were found between soil C and N contents in all groups (Table 5). In the 0–10-year-old group, the greatest correlations were found between SIR and BR (r = 0.96, p < 0.01), stand age and LitD (r = −0.78, p < 0.01), ST5 and BR (r = 0.73, p < 0.05), and ST5 and SWC5 (r = −0.55, p < 0.01). In the 11–54-year-old group, the strongest correlations were found between C and C/N (r = 0.87, p < 0.05), BR and LitD (r = 0.87, p < 0.05), N and C/N (r = 0.84, p < 0.01), stand age and LitD (r = 0.82, p < 0.01), and BR and N (r = 0.78, p < 0.05). In the 88–141-year-old group, the strongest correlations were found between C content and C/N (r = 0.99, p < 0.01), N content and C/N (r = 0.99, p < 0.01), BR and SIR (r = 0.76, p < 0.01), stand age and root biomass (r = −0.5, p < 0.01), and stand age and ST5 (r = −0.49, p < 0.01). In the 150–276-year-old group, the strongest correlations were found between C and LitD (r = −0.89, p<0.05), N and LitD (r = −0.89, p < 0.05), stand age and C content (r = −0.79, p < 0.01), stand age and N (r = −0.76, p < 0.01), stand age and VegH (r = 0.68, p < 0.01), and ST5 and BR (r = 0.5, p < 0.05).

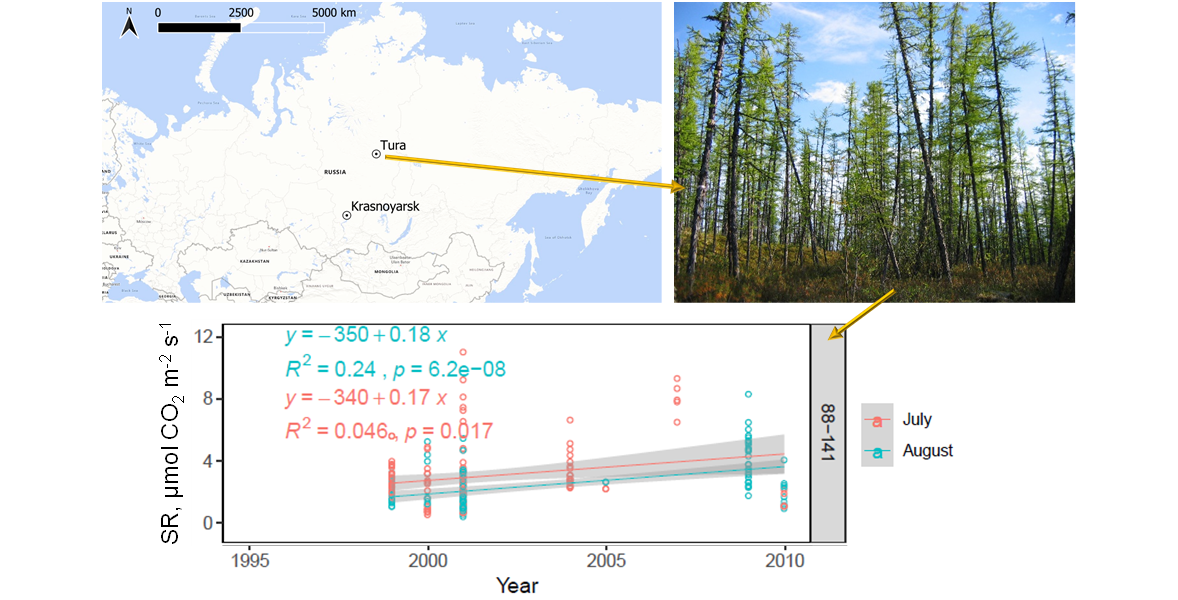
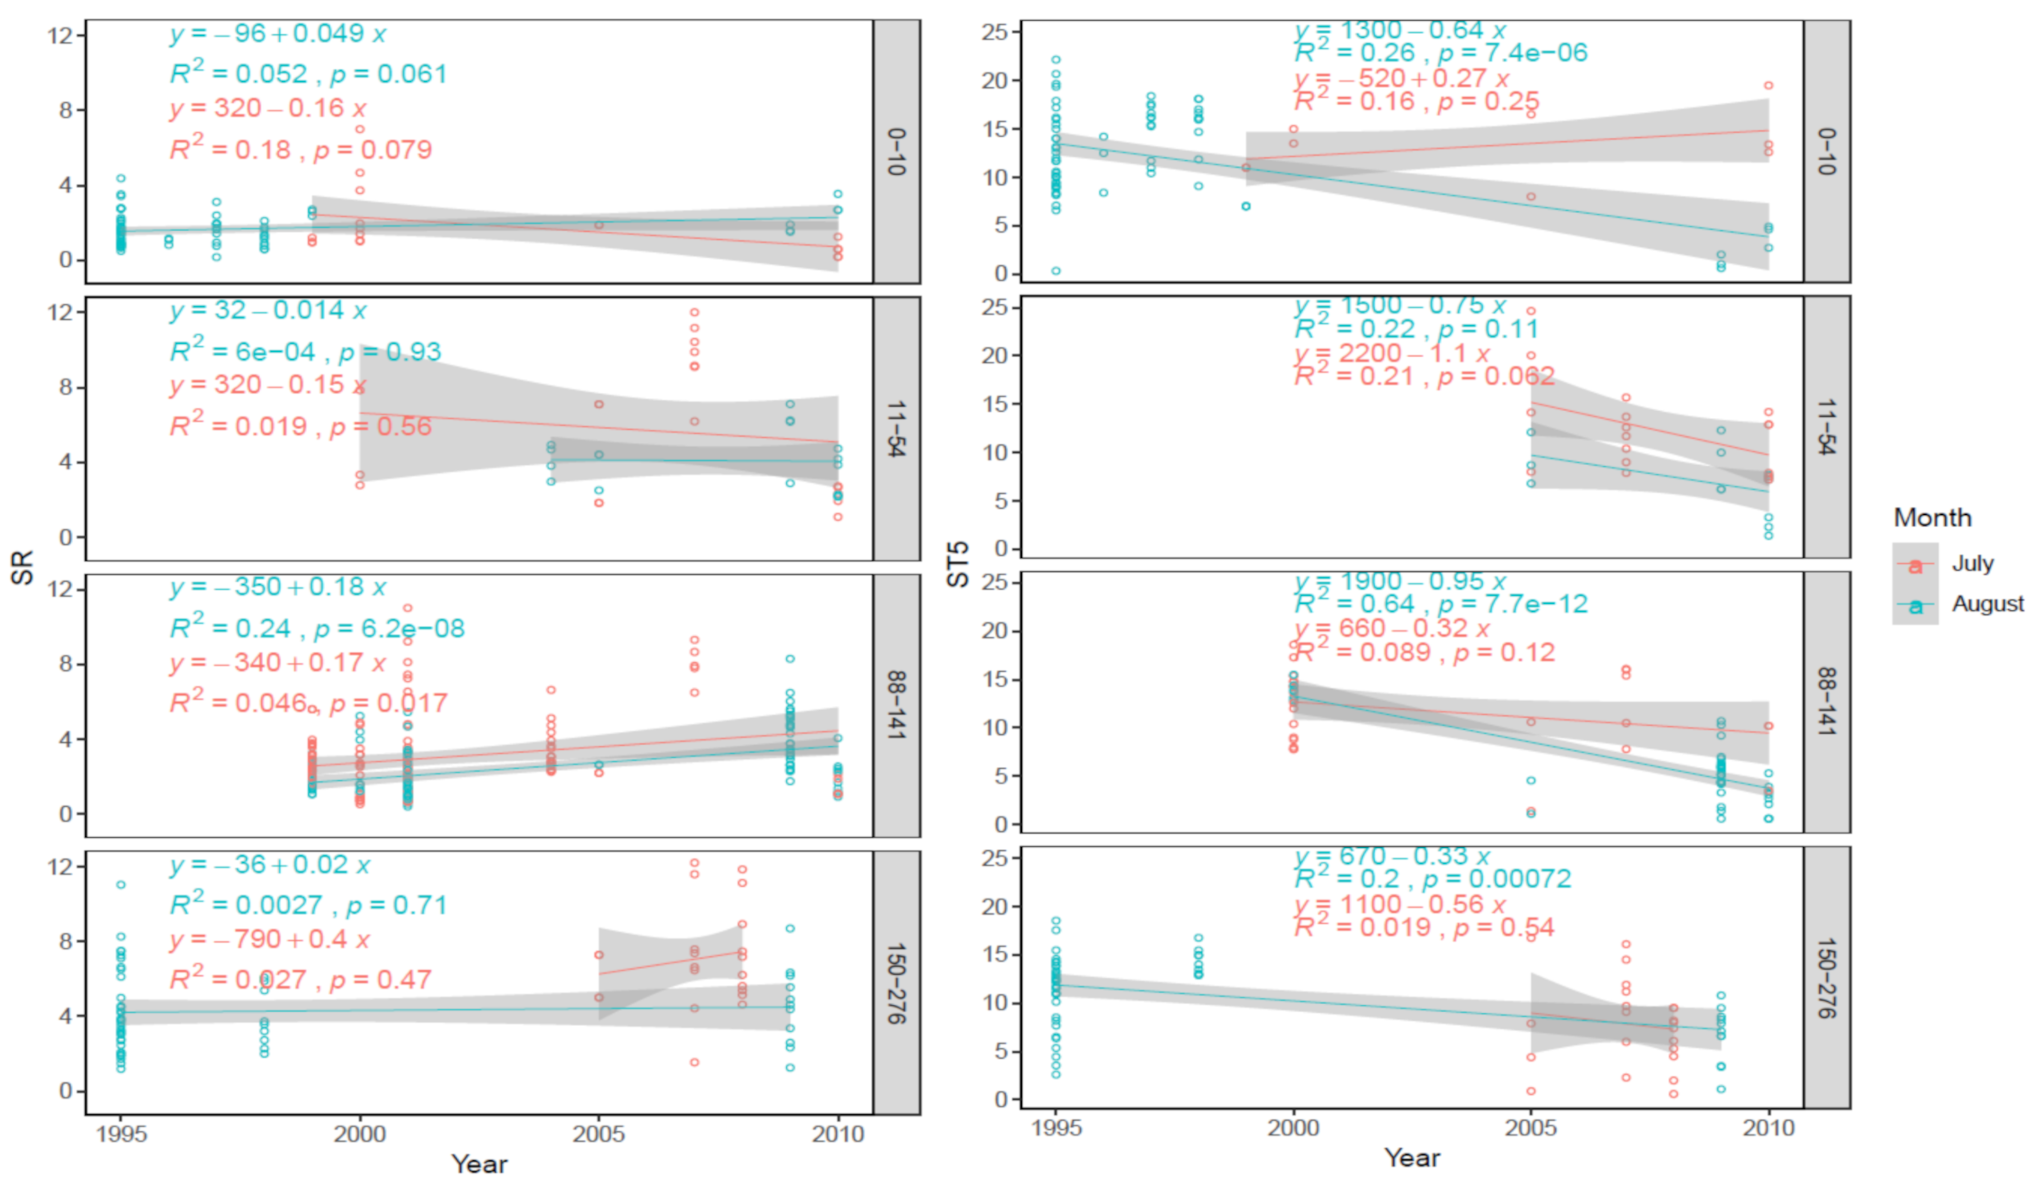
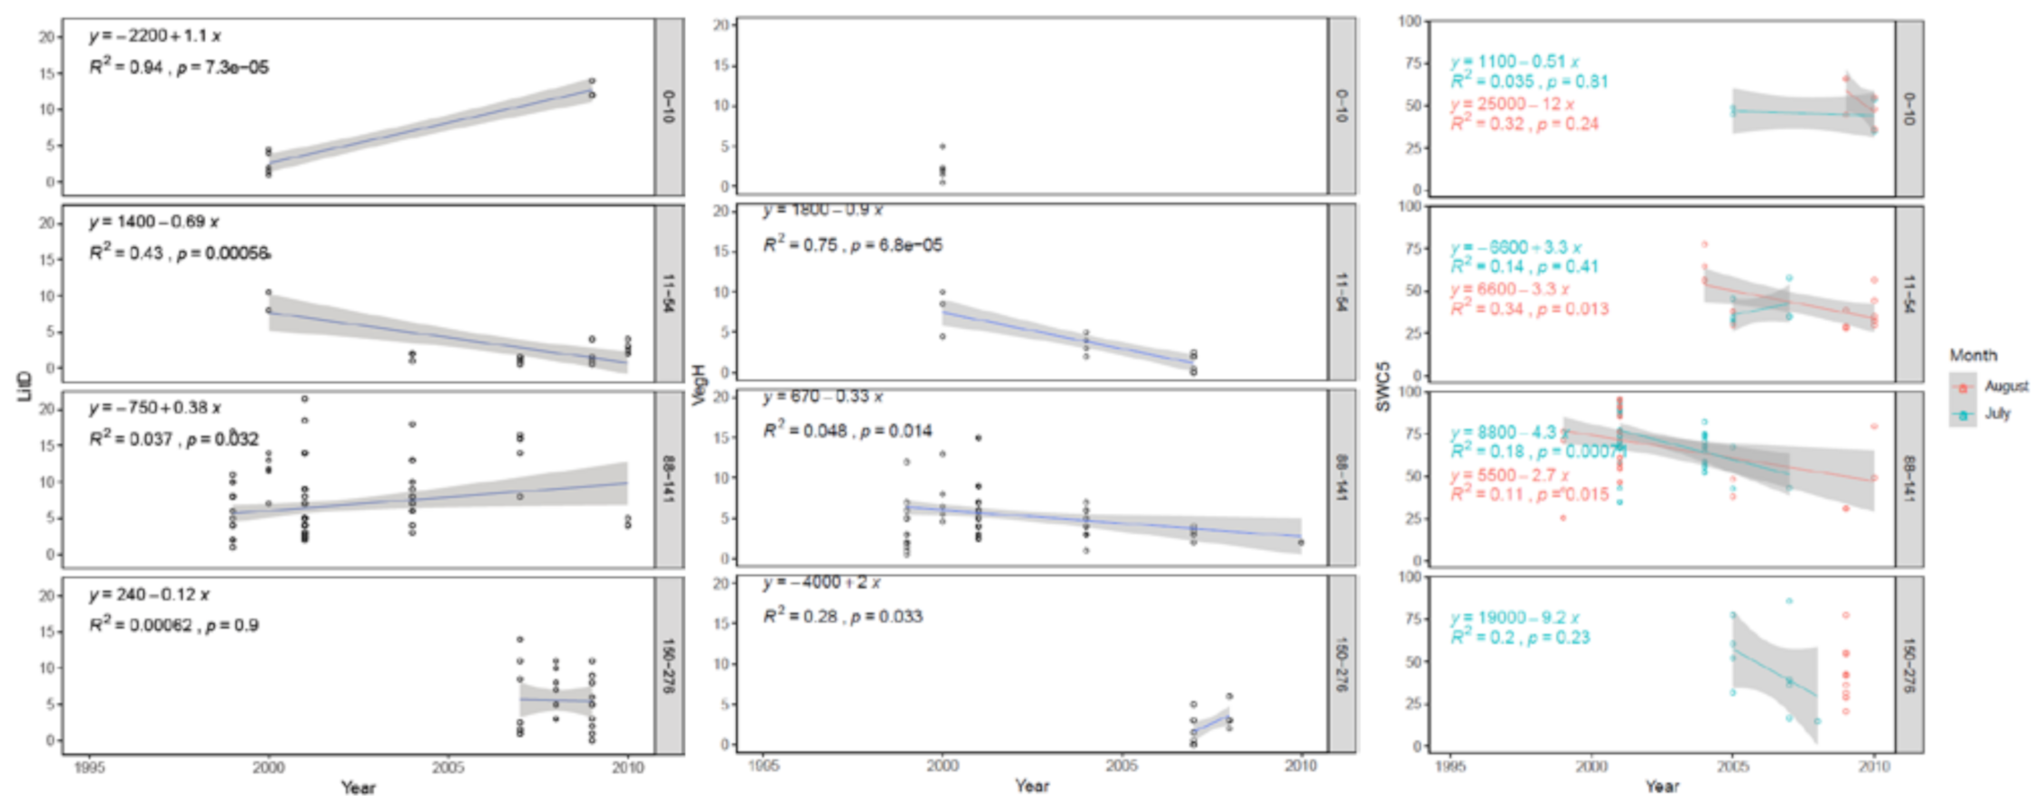
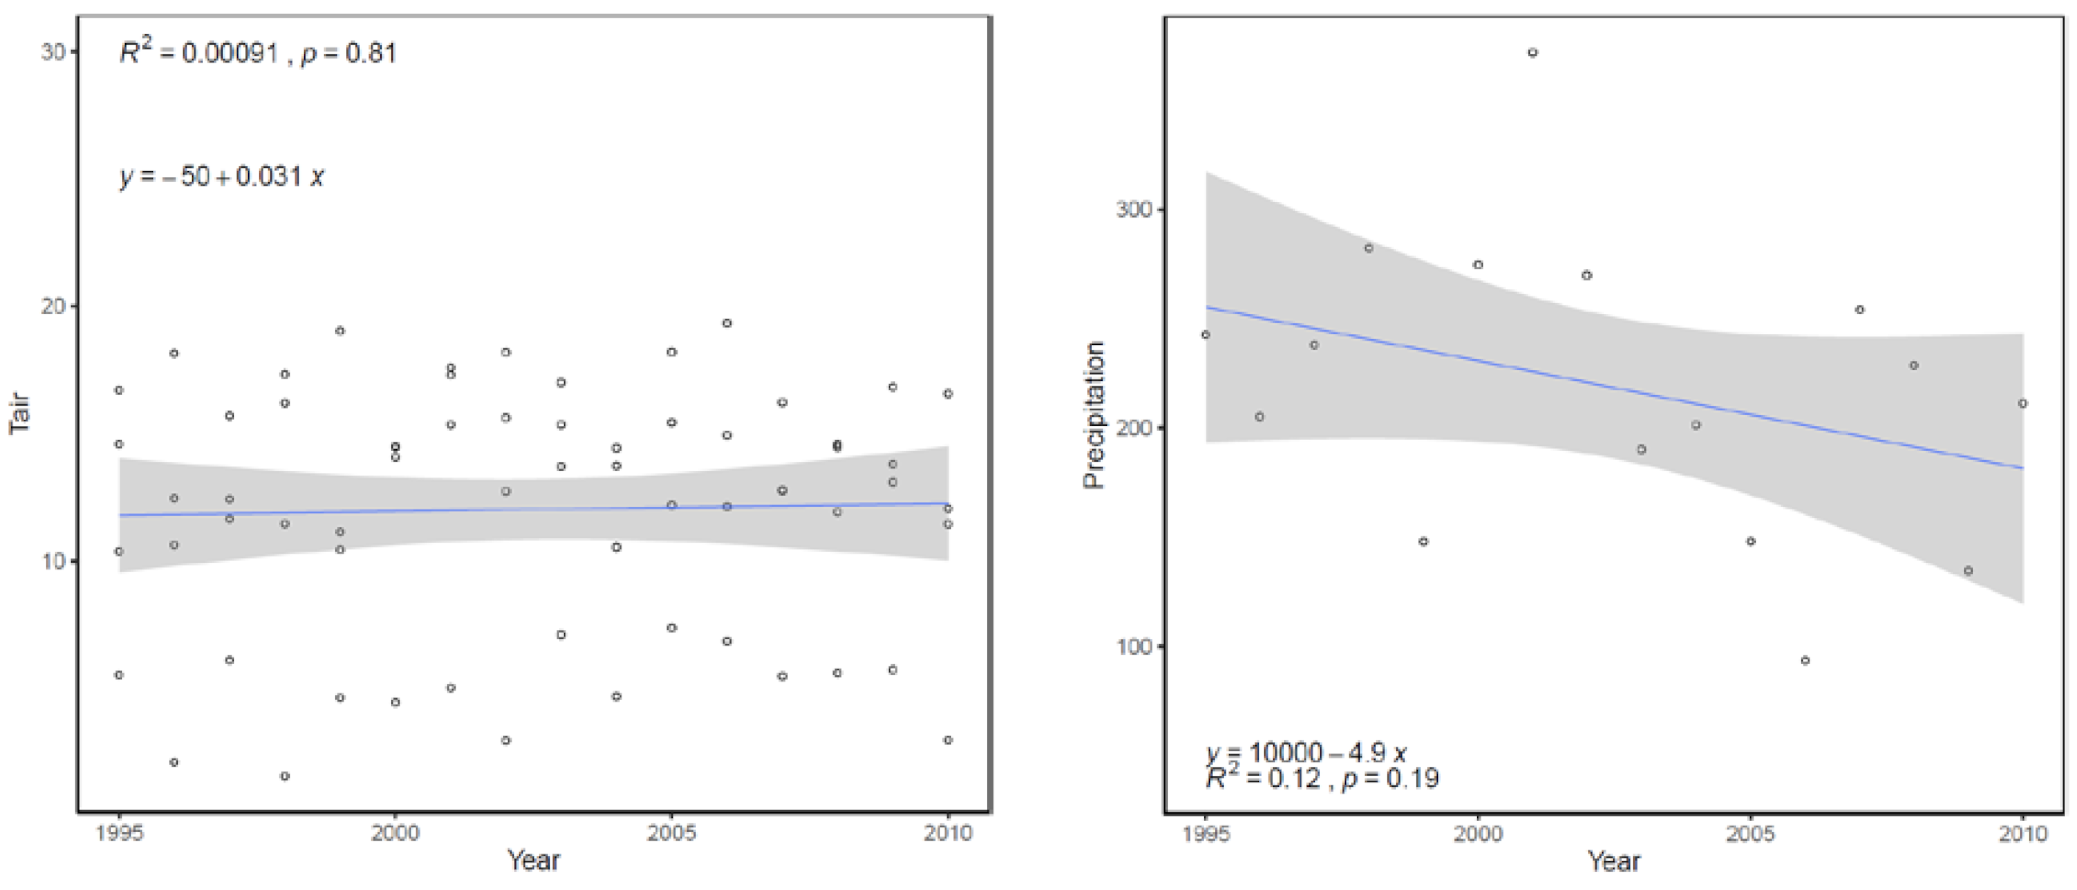
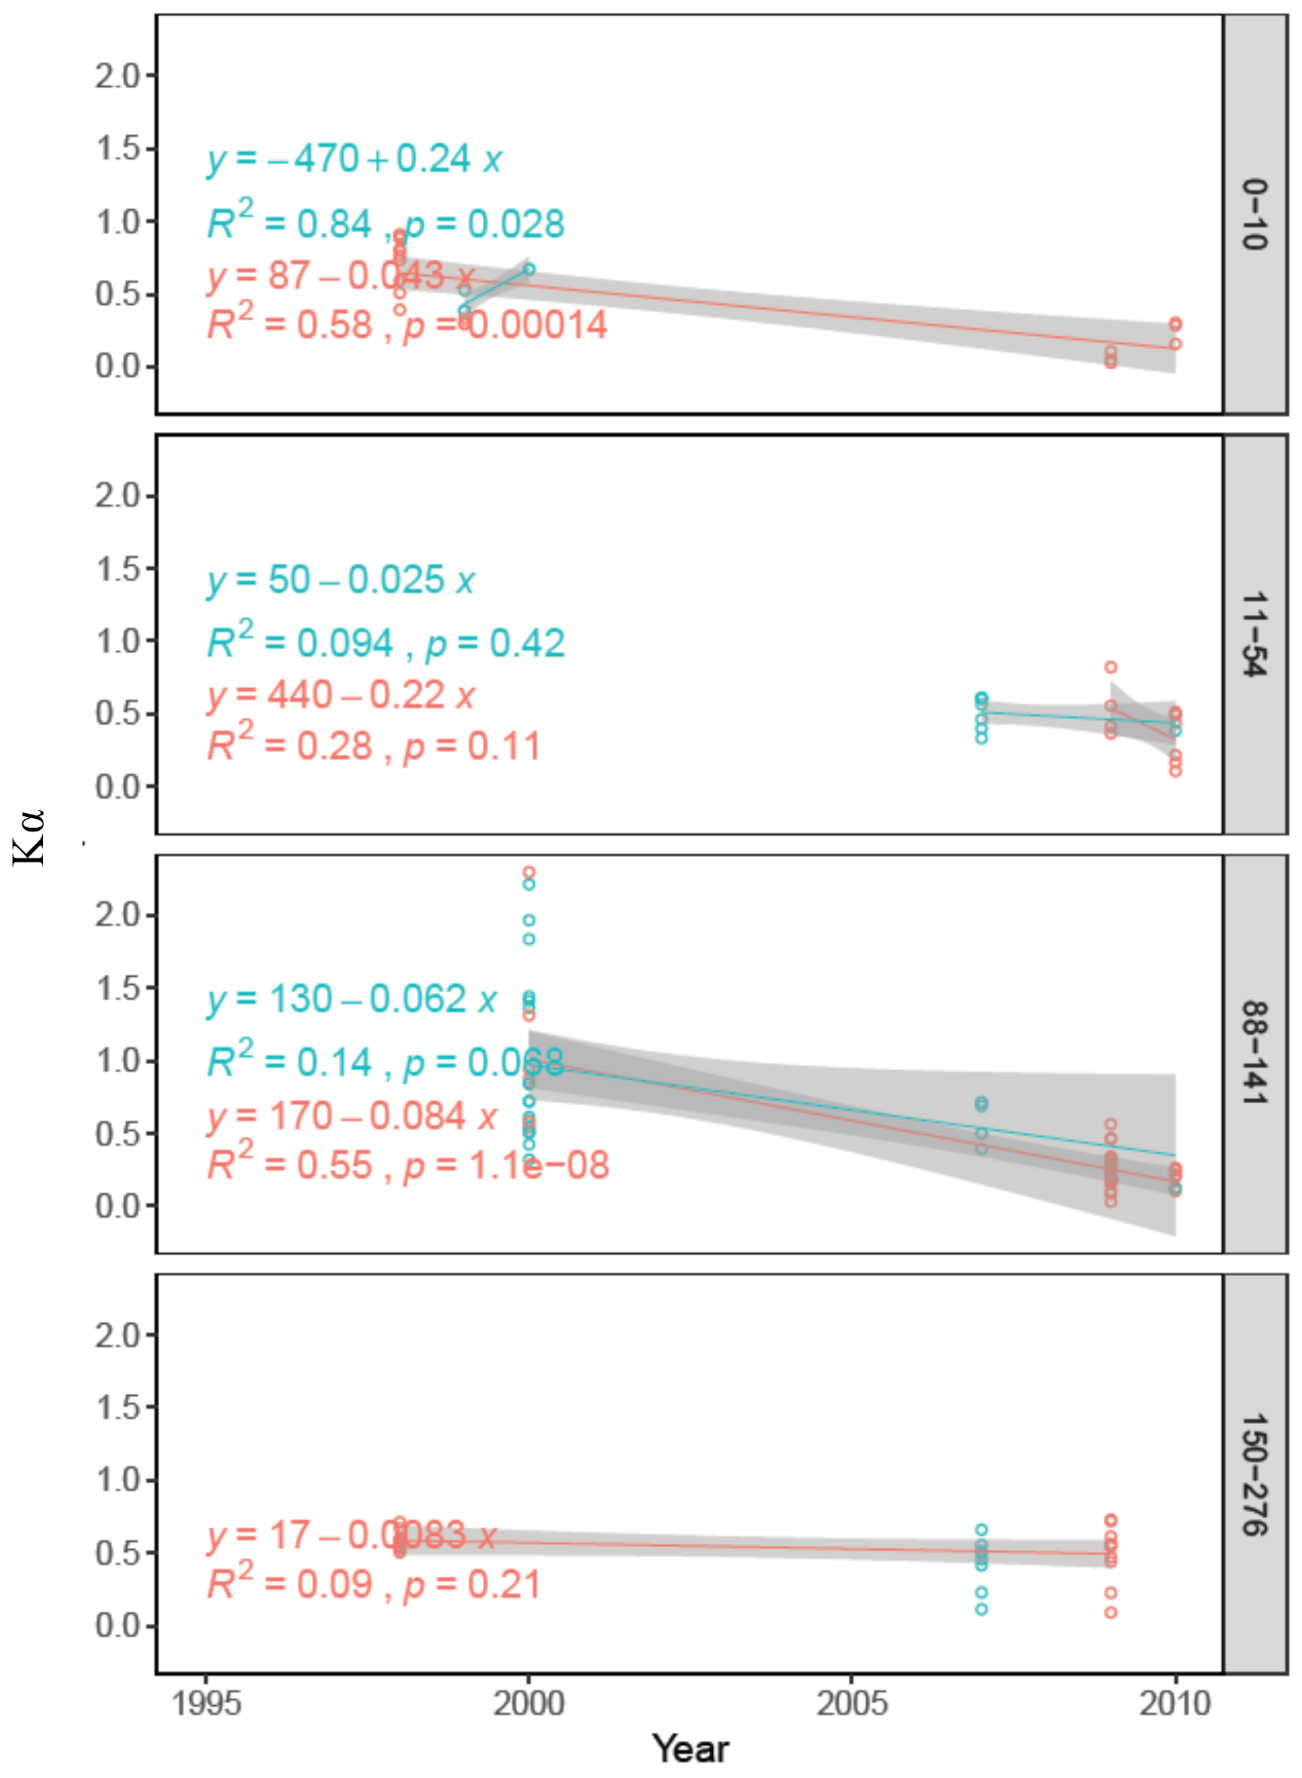
3.3. Long Term (1995–2010) Observation of Postpyrogenic SR and Associated Parameters in Permafrost Larch Forest Successions of Various Ages

A comparison of SR dynamics among the investigated stands during 16 years (1995–2010) showed that in all stand age groups, except for the 88–141-year-old group, SR was at the same level during the study period (Figure 6). Significant linear increasing trends in July and August, as well as SR escalation, were observed in the 88–141-year-old group (Figure 6). We assessed the dynamics of ST5 over this 16-year period and found that according to the August data, ST5 showed a significant downward trend in the period of 1995–2010 in the 0–10 and 150–276-year-old groups as well as in the period of 2000–2010 in the 88–141-year-old group (Figure 6, p < 0.01). The observed decreasing trend of ST5 in August in the 88–141-year-old group did not inhibit the SR during the period of 1999–2010. Moreover, in this group, we found significant decreasing trends of SWC5 and VegH and an increasing trend of LitD (Appendix A, Figure A2). The total precipitation during the growing season in Tura (data from the Tura Weather Station, www.meteo.ru) visually (non-significantly) decreased from 1995 to 2010 (Appendix A, Figure A3).
Kα is a measure of permafrost sensitivity to climate change [44]. We calculated Kα over the study period to understand the extent to which permafrost in the study area is susceptible to climate change. As shown in Figure A4 (Appendix A), Kα had a significant decreasing trend in the 0–10 and 88–141-year-old groups, indicating a decrease in permafrost sensitivity to climate change (ST5 and SWC5 decreasing trends, Figure 6 and Figure A2 in Appendix A) over the study period.

4. Discussion

4.1. Spatial and Temporal Variation in SR

High environmental heterogeneity and wide variation in the studied parameters complicated the analysis of SR data in the study area consisted of wildfire-affected larch stands of different ages located in the permafrost zone of central Siberia (Figure 1 and Figure 2, Table 1). To overcome this problem, we grouped the data into four age classes using PCA (Figure 3). We assessed the spatial and temporal patterns of SR in the four groups (0–10, 11–54, 88–141, and 150–276-year-old stands, Figure 3). We found great variations in SR (from 0.12 to 12.21 µmol CO2 m−2 s−1, mean ± SD=3.16 ± 2.30) across all sites within the spatial CV range of 52–67% (Table 2). The range of these values is considered high according to Warrick and Nielsen (1980) [46], who classified CV > 24% as high, CV between 12 and 20% as intermediate, and CV < 12% as low, but rather stable. Such a high variation can be caused by both wildfire disturbance and naturally inherited environmental heterogeneity, including the effect of permafrost on SR. A similar wide variation in SR has been reported in studies carried out in postpyrogenic forest formations in permafrost habitats. For example, SR varied from 5.68 to 17.03 µmol CO2 m−2 s−1 in 3–100-year-old post-fire pine forests in Canada [21], and from 1.11 to 6.24 µmol CO2 m−2 s−1 in 1–100-year-old fire-affected larch succession in Tura (Siberia, Russia; [29]). In 8–179-year-old fire-affected pine stands in Estonia, SR varied from 1.95 to 6.82 µmol CO2 m−2 s−1 during the growing season [25]. Yanagihara et al. (2000) [47] reported a wide range of SR in Tura larch stands in 2000 (0.6–12.6. µmol CO2 m−2 s−1), which was similar to the range that we observed in the present study. In our study, the observed high variation in SR was attributed to the high heterogeneity of the studied soil and environmental factors (Table 2). Some parameters, such as VegH (54%–100%), BR (73%–117%), and root biomass (72%–248%), were very variable. Despite the high variability in SR-associated factors, the variability in SR itself was not as high (52%–67%, Table 2). This confirmed our third hypothesis, which stated that permafrost ecosystems are well-adapted to wildfire disturbance, and certain factors compensate for the disturbances in other factors in order to stabilize the ecosystem functions.
We found that temporal variability in SR occurred on both a seasonal and an interannual scale. The seasonal variability in SR was assessed during the growing season (June–September). Most stand age groups had similar patterns of seasonal SR dynamics, with peak SR values at the beginning (June) or in the middle (July) of the growing season (Figure 4), and the lowest SR values in September. ST5 was significantly higher in the middle of the growing season (July–August) than in September, whereas SWC5 did not differ significantly within the growing season (Figure 4). Ribeiro-Kumara et al. (2020) [25] observed a similar pattern of seasonal dynamics in SR, which increased towards summer and decreased towards autumn in all successional stages except in the stage eight years after the fire.

4.2. SR Associated Factors, and Their Correlations

Multiple factors affect SR after a forest fire. This issue of complexity is critical for estimating the response of SR to the combined effects of fires and climate change at high latitudes. To address this issue, we studied the correlations between SR and associated factors (stand age, ST5, SWC5, C and N contents, C/N, BR, SIR, root biomass, VegH, and LitD) to explain the observed high variation in SR (Table 5). We found that in different age groups, SR was correlated with different factors. Most of the studied sites were considered as different stages of recovery succession after wildfire disturbance, as it is known that forest fires are the main disturbing factor that shapes northern permafrost ecosystems. The primary factor influencing SR in the permafrost area is supposed to be ST5. However, the effects of ST5 on SR were not that clear in the studied age groups because the highest contribution of ST5 was found only in two groups: 0–10 and 150–276 groups (Table 4), and moderate/weak correlations between SR and ST5 were observed in 11–54 and 88–141 groups (Table 5). Bergner et al. (2004) [18] did not observe changes in ST5 and SWC5 after a fire in Alaska. In the present study, the differences in ST5 between the studied groups and weak correlations between ST5 and SR were a consequence of the high heterogeneity of ST5 in the permafrost area and were mostly driven by differences in radiation penetration to the ground due to different canopy density and vegetation recovery. Therefore, at a certain age of postpyrogenic larch succession, various environmental and biological factors can control the SR rates. We confirmed our first hypothesis that the SR changed along the fire chronosequence of permafrost larch forests in central Siberia due to the influence of different factors that regulate the processes of autotrophic and heterotrophic respiration.
Thus, in the youngest larch stands (0–10-year-old group), which are usually freshly burned-out areas, we found a negative correlation between SR and the parameters of soil microbial activity (BR and SIR, Table 5). This is because wildfires eliminate the vegetation cover and partially or completely destroy the soil organic layer (litter), which caused a decrease in SR rates in the youngest group compared to those in the other age groups. Pyrogenic C developed in the soil after wildfires represents recalcitrant compounds [48], which are difficult to decompose by soil microbiota and may reduce SR for extended periods. Wildfires have a negative effect on soil CO2 emissions in the first years after disturbance [23,28,49,50]. The SR rates observed in the post-fire plots in Alaska within three years after a fire (0.56–0.62 µmol CO2 m−2 s−1, [18]) were within the range we observed in the present study. Ribeiro-Kumara et al. (2020) [25] found that in Estonia, the SR rate in an 8-year-old pine stand (1.95 µmol CO2 m−2 s−1) was significantly lower than the SR rate in 179-year-old pine stands (4.31 µmol CO2 m−2 s−1). Sawamoto et al. (2000) [26] reported lower SR rates in recently burned larch forests in northeastern Siberia (1.07–1.50 µmol CO2 m−2 s−1) than that in intact larch forests (4.16–4.20 µmol CO2 m−2 s−1) due to low rates of root and microbial respiration. In the present study, in the 0–10 age group, the main processes involved in SR (e.g., soil microbial activity and root respiration) were changed due to wildfire disturbance. Thus, in this group, we found significantly (8–10-fold) lower values of root biomass (mean value = 0.23 g) compared to those in the other groups, which probably led to the decrease in root respiration. In contrast, soil microbial activity (particularly SIR) in the 0–10 group was at the same level as that in all other groups, and BR in the 0–10 group (mean value = 67.38 mg CO2-C kg−1 day−1) was comparable with that in the 150–276 group (Table 2). This was consistent with the suggestion of Smith et al. (2010) [20] that the high soil microbial activity after a fire can offset the decrease in autotrophic respiration caused by fire. Zhou et al. (2020) [51] found that potential functional genes responsible for C degradation were more frequent in soil microbiota of 3-year-old burnt areas than in older (25–100-year-old) stands in the permafrost region of Canada. In addition, as wildfire causes soil organic matter transformation through vegetation burning and heat-induced chemical transformation of litter, it often results in the increase in soil nutrients and has a stimulating effect on soil microbial activity (SIR) [52]. However, we did not observe significant differences in C and N contents and C/N among the different stand age groups; there was only a slight (non-significant) decrease in C and N contents in the 0–10 group compared to that in the other groups (Table 3). Similar to our results, Ribeiro-Kumara et al. (2020) [25] did not find significant differences in C and N contents in organic and mineral soil layer among different age classes of postpyrogenic pine stands. Another reason for active SIR is that the soil microbial species that colonize post-fire areas have high respiration rates [18,53]. Thus, in the 0–10 group from the present study, wildfire-disturbed root respiration was partially offset by high soil microbial activity in the presence of the necessary substrate. Hu et al. (2017) [54] also reported that the components of SR, heterotrophic and root respiration, could act controversially (increase or decrease) after fire disturbance. In addition, in the 0–10-year-old group, we found a strong positive correlation between SIR and BR. Soil microbial activity is an important process contributing to SR remains highly uncertain in its response to disturbances and environmental changes [55]. In the present study, we analyzed how soil microbial activity (BR and SIR) is related to the other studied parameters. A strong negative correlation between stand age and LitD and an important significant positive correlation between ST5 and BR was found (Table 5). Aaltonen (2020) [56] concluded that even if permafrost thaw was apparent after fire, the soil organic matter (SOM) stored in the permafrost would not be especially labile or temperature-sensitive. This supports the conclusion by Anisimov et al. (2012) [44] that permafrost in the Tura area is moderately sensitive to changes in temperature, and it is in accordance with our calculations of Kα (Figure A4). Thus, CO2 emissions were limited after the fire due to suppressed root respiration, likely reduced quality of fire-affected SOM, and limited biodegradability of permafrost SOM.
In the 11–54-year-old group, a significant positive correlation was found between SR and SIR. In the larch recovery successions 11–54 years after wildfire disturbance, SR was 2.6 times higher than that in the previous successional stage (0–10 group) due to the rapid proliferation and growth of tree root systems (Figure 2, [57]). According to Kajimoto et al. (2010) [57], in the Tura area, belowground C stock increases sharply with the development of coarse roots during earlier stages of plant growth (<30 years), showing a trend similar to that of the aboveground C stock. We observed significantly (7-fold) higher root biomass in the 11–54 group than in the 0–10 group (Table 2). This explained the significant positive correlation (Table 5) between SR and SIR observed in this age group (11–54-year-old group), as increased root exudates originating from actively proliferating root systems contributed to soil microbial activity, which stimulated SR. In the 11–54-year-old group, the strong correlations between C and C/N, N and C/N, and BR and LitD also resulted in high SR rates (Table 5). In turn, litter accumulation due to vegetation recovery promoted soil BR and SR. Thus, both root respiration and soil microbial activity contributed to the high SR level in the 11–54 group.
In the 88–141-year-old group, SR was positively correlated with LitD and ST5, and negatively correlated with SWC5 and VegH. A negative correlation between SR and SWC5 was also observed by Morishita et al. (2010) [27] in a 105-year-old larch stand near the Tura site. In the present study, in the 88–141-year-old group, the strongest correlations were found between BR and SIR and between LitD and ST5. The negative correlation between SR and VegH observed in this group showed that abundant post-fire vegetation regeneration could re-assimilate CO2 released from the soil, thereby reducing the overall SR value. In the 88–141 group, despite similar soil microbial activity and 1.9 times higher root biomass than that in the 11–54 group, SR was significantly (1.6 times) lower than that in the 11–54 group. This was because of the harsher environmental conditions in the 88–141 group than in all other groups, including significantly lower ST5 (<6 °C in August, Table 2) and waterlogged soils (SWC5 > 73%). Morishita et al. (2010) [27] reported similar low SR rates (2.03 µmol CO2 m−2 s−1) in a 105-year-old larch stand near Tura. Together, these two factors decreased the SR in this group (mean value, 2.83 µmol CO2 m−2 s−1), as both of them can negatively affect soil microbial activity and root respiration. Thus, in the 88–141 group, SR was controlled and suppressed to a great extent by environmental factors.
In the 150–276-year-old group, SR positively correlated with SIR, soil C and N contents, and LitD (Table 5). In addition, the greatest correlation was found between C and LitD, N and LitD, C and stand age, N and stand age, VegH and stand age, and ST5 and BR. A strong negative correlation between stand age and C and N contents indicated that in the climax associations, as a consequence of litter accumulation (increased LitD), the main nutrients (C and N) are trapped in the litter layer (soil organic horizon) and do not migrate into mineral soil layers. This was confirmed by the weak and insignificant negative correlation between the stand age and C and N contents in the 11–54 group (Table 5). The SR values were found to be the highest in the 150–276 group (mean value = 5.18 µmol CO2 m−2 s−1) and did not differ from the SR rates in the 11–54 group. Because of the highest root biomass (mean value = 3.18 g) among all groups, root respiration was considered to be the main contributor to SR in this group. This finding was consistent with that of Ribeiro-Kumara et al. (2020) [25], who found that due to high root biomass, the autotrophic component of SR had higher contribution to SR than soil microbial activity in old (> 179 years) pine stands, which remained constant throughout the chronosequences.
In conclusion, we observed an increase in SR with the increase in time since the fire. We hypothesized that this was mainly due to differences in autotrophic respiration rather than changes in heterotrophic respiration because SIR was rather stable during the post-fire succession.

4.3. Long-Term (1995–2010) Observation of Postpyrogenic SR Rates and Associated Parameters in Permafrost Larch Forest Successions of Various Ages after Wildfire Disturbance

Wildfires complicate the assessment of greenhouse gas dynamics in permafrost habitats at high latitudes due to many interrelationships between soil, landscape, biological, and environmental factors, which, in response to fire disturbance, can be contradictory and can be influenced by the high heterogeneity of these factors. Our second hypothesis appeared to be partially correct. Long-term observations (1995–2010) of the SR rates in Tura fire-affected forest ecosystems showed a significant increasing SR trend in the 88–141-year-old group (Figure 6). It was revealed that under conditions of progressive litter accumulation (a significant increasing trend of LitD, Figure A2), along with a significant decrease in ST5 (Figure 6), drying of the upper soil horizons (a significant decreasing trend in SWC5, Figure A2) resulted in higher SIR and BR via the development of more favorable conditions for soil microbes (Table 2), which ultimately contributed to SR in the 88–141-year old group. The observed significant decreasing trend of SWC5 was supported by the decreasing (non-significant, Figure A3, Appendix A) trend of precipitation during the growing season (June–September) for the period of 1995–2010. As shown by PCA (Figure 5), the most important factors shaping the ecosystems in the 88–141 group were SWC5, VegH, and SIR (which had the highest impact). This important finding indicated that climate change affected the SR (in the 88–141 group) at high latitudes of central Siberia not through direct heating of the soil and transformation of the thermal regime, as reported by Berger et al. (2004) [18], but through the improvement of waterlogged conditions in permafrost soils (a significant decrease in SWC5 was probably related to a long-term decrease in precipitation). Similar to our results, Feurdean et al. (2019) [58] found that a recent decline in peatland moisture caused a decrease in carbon accumulation in peatlands of western Siberia (Vasyugan Mire, Tomsk region). This conclusion also clarified the significant increase in SR in 41–276-year old larch stands in the period of 2005–2010 due to the increase in soil heterotrophic respiration in 2007–2010, as described in our recent paper [2]. This is pointed to the successful postfire regeneration of ground vegetation and the higher contribution of root systems to SR in studied larch ecosystems, which represent the different stages of postfire succession. Moreover, as indicated by Kα trends (Figure A4, Appendix A), the permafrost became less susceptible to climate change in the period of 2007–2010 than in the period of 2000-2001 due to that compensatory effect of regenerated vegetation. This was partially supported by similar values of Kα = 0.6 reported by Anisimov et al. (2012) [44] for the Tura area over the 1965–2007 period; they concluded that the permafrost in Tura territories was moderately susceptible to climate change. We found an improvement in the soil hydrothermal conditions in the 88–141-year-old group in 2005–2010, which provided an additional substrate for the soil aerobic microbiota, which was not available previously due to soil waterlogging. Even if the permafrost in the investigated area is not yet showing signs of sensitivity to climate change, the soil microbiota that are flourishing because of the additional substrate can increase the C emissions from the soil, which can change permafrost sensitivity. These findings emphasized the importance of postpyrogenic successions of 88–141-year-old larch stands in terms of SR dynamics related to environmental changes (drying of the upper soil horizons in the period of 1995–2010) in permafrost-affected high-latitude boreal ecosystems. A positive trend of SR in the permafrost area of central Siberia during the same period based on 20 published studies was reported in a recent meta-analysis study [59].

5. Conclusions

SR and associated soil, biological, and environmental parameters were studied in a long chronology of wildfire-affected larch ecosystem successions in the permafrost area of Central Siberia. Data from the 23 sites showed a high spatial variation in SR, which was primarily regulated by biological and environmental factors. However, along the post-fire recovery succession, different factors had a different influence on SR, and their inter-relationships varied, which further complicated the investigation of this successional process.
SR varied significantly among groups, and in the 88–141 group, it was significantly different from that in the other groups. The observed high variation in SR resulted from the specific combination of dominant factors during each stage of postpyrogenic succession. The number of factors influencing the SR in each group, which represented a certain post-fire successional stage, increased from three to six from the youngest post-fire successions to the old ones. Thus, the complexity of the effects of different factors on SR increased along with post-fire succession. In the 0–10 group, the SR was the lowest and it was negatively correlated with BR and SIR; thus, the significantly low SR rates were due to the wildfire effect on root systems and soil microbial associations. In the 11–54 group, 2.6-fold higher SR rates compared to that in the 0–10 group were associated with activated soil microbiota (positive correlation with SIR) and favorable soil thermal regime developed during post-fire recovery succession. A negative correlation between SR and VegH indicated that vegetation regeneration may play an important role in the re-assimilation of CO2 emitted from the soil, thus decreasing the SR. In the 88–141 group, SR was considered to be suppressed due to the negative influence of soil hydrothermal conditions (low ST5 and high SWC5) on both main contributors–root systems and soil microbiota. SR was correlated with four factors (LitD, VegH, ST5, and SWC5) in this group. Maximum SR was recorded in the 150–276 group, and was correlated with soil C and N content, SIR, root biomass, and LitD. Both soil microbial activity and root respiration (due to the highest root biomass) positively contributed to the SR rates in the presence of favorable environmental conditions.
The most important age group in terms of recent promotion of SR in the studied ecosystems due to environmental changes (e.g., decrease in ST5 and SWC5) was the 88–100-year-old group. It is highly likely that the decrease in ST5 favored litter accumulation (e.g., increasing trend of LitD) in this group during the period of 1995–2010. However, substantial drying of the upper soil layer made litter a valuable substrate for soil microbiota, thus supporting higher levels of SR due to increased soil microbial activity. Long-term (1999–2010) SR promotion in the group of 88–141-year-old burnt areas was correlated with the significant decrease in ST5, SWC5, VegH, and an increase in LitD.
The observed high spatial variation in SR and associated parameters highlighted the importance of SR heterogeneity at high latitudes and the involvement of many factors in its regulation, especially within fire-affected areas. Therefore, we concluded that this topic requires to be studied more thoroughly in the future.

Author Contributions

Conceptualization, O.V.M. (Oxana V. Masyagina); Data curation, O.V.M. (Oxana V. Masyagina); Formal analysis, O.V.M. (Oxana V. Masyagina); Funding acquisition, S.Y.E., O.V.M. (Oxana V. Masyagina) and S.M.; Investigation, O.V.M. (Oxana V. Masyagina), S.Y.E., S.M., T.K. and S.G.P.; Methodology, O.V.M. (Oxana V. Masyagina), S.Y.E., S.M., T.K. and S.G.P.; Project administration, S.Y.E., O.V.M. (Oleg V. Menyailo), S.M. and T.K.; Visualization, O.V.M. (Oxana V. Masyagina); Writing—original draft, O.V.M. (Oxana V. Masyagina); Writing—review and editing, O.V.M., S.Y.E., O.V.M. (Oleg V. Menyailo), S.M. and T.K. All authors have read and agreed to the published version of the manuscript.

Funding

The research was funded by the Russian Foundation of Basic Research (project No. 18-54-52005, 18-05-60203, 19-29-05122), and the Japan Society for the Promotion of Science “KAKENHI” (grant number 19H02987 and 19H01161).

Institutional Review Board Statement

Not applicable.

Informed Consent Statement

Not applicable.

Data Availability Statement

Data is contained within the article.

Acknowledgments

The research was performed using the subject of a basic project No. 0356-2019-0009. We are grateful to Anatoly Prokushkin for fruitful discussion and the provided data. We thank anonymous reviewers for their helpful comments which improved the manuscript.

Conflicts of Interest

The authors declare no conflict of interest.

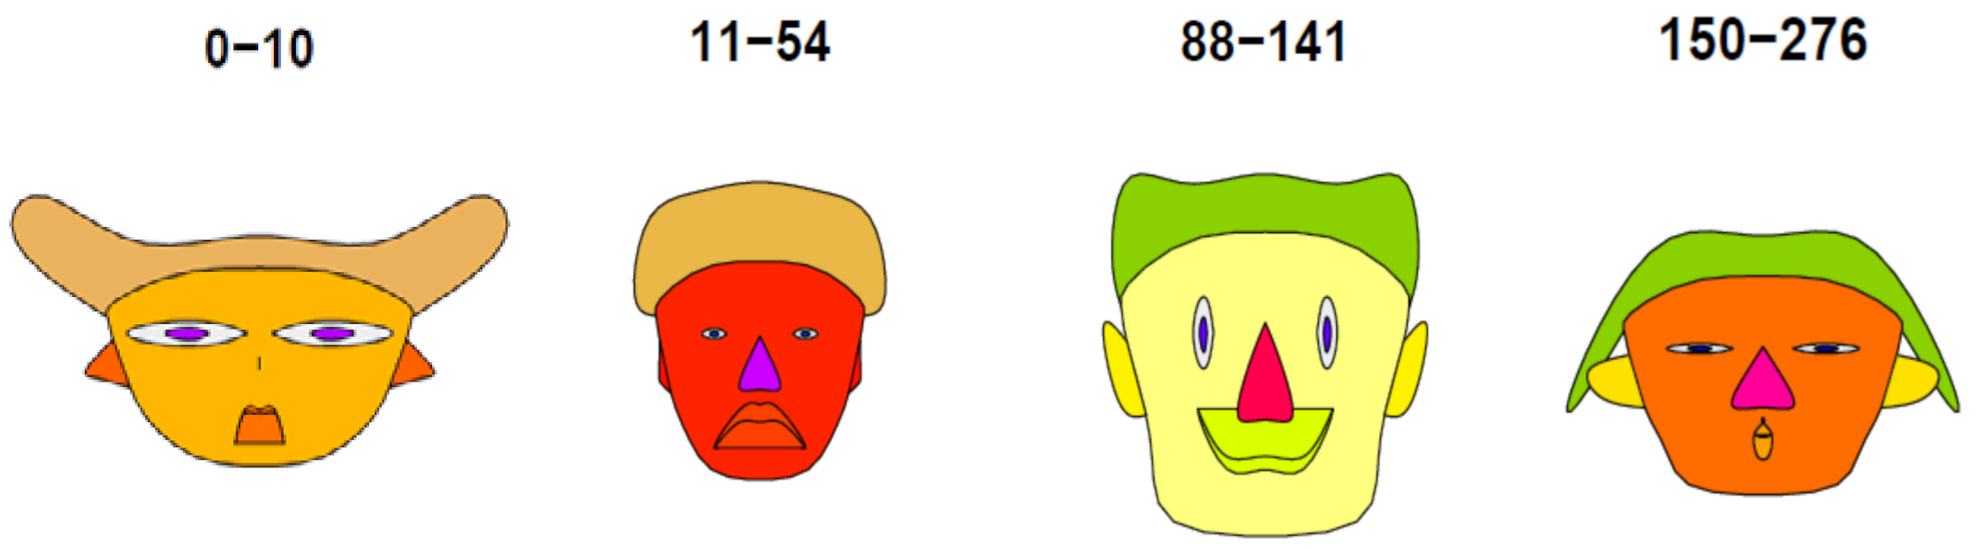
Appendix A. A Drop of Humor

Figure A1. The Chernoff faces diagram, which reflects the parameters and some key processes in the soil of wildfire-affected larch stands of different age (0–14, 15–54, 78–100, 119–276-year-old stands) and describes them as characteristics of the human face: face height—vegetation cover height (VegH), face width—litter thickness (LitD), face shape—root biomass (roots), mouth height —mean soil respiration (SR), mouth width—mean soil basal respiration (BR), smile curve—mean soil substrate-induced respiration (SIR), eye height—mean summer soil water content at the depth of 5 cm (SWC5), eye width—mean summer soil temperature (ST5), hair height—mean September ST5, hair width—mean August ST5, hair styling—mean July ST5, nose height—mean C content, nose width—mean N content, ear width—C/N, ear height—VegHLitD (VegH and LitD).
Forests 12 00107 g0a1
Figure A2. Litter thickness (LitD, cm), vegetation cover height (VegH, cm), and soil water content (SWC5, %) at wildfire-affected sites of different ages in the 1995–2010 study period. Grey areas represent standard errors. The figure in the grey bar at the right side indicates the age interval of larch stands.
Forests 12 00107 g0a2
Figure A3. Monthly air temperature (Tair, °C) and precipitation (mm) over the growing season (June–September) at wildfire-affected sites of different ages in the 1995–2010 study period according to Tura Weather Station (www.meteo.ru). Grey areas represent standard errors. Blue line represents linear regression.
Forests 12 00107 g0a3
Figure A4. Permafrost sensitivity criterion (Kα) in July (blue open circles and linear regression lines) and August (red open circles and linear regression lines) at wildfire-affected sites of different ages in the 1995–2010 study period. Grey areas represent standard errors. The figure in the grey bar at the right side indicates the age interval of larch stands.
Forests 12 00107 g0a4

References

  1. Schulze, E.-D.; Beck, E.; Buchmann, N.; Clemens, S.; Müller-Hohenstein, K.; Scherer-Lorenzen, M. Plant Ecology, 2nd ed.; Springer: Heidelberg/Berlin, Germany, 2019. [Google Scholar]
  2. Masyagina, O.V.; Menyailo, O.V.; Prokushkin, A.S.; Matvienko, A.I.; Makhnykina, A.V.; Evgrafova, S.Y.; Mori, S.; Koike, T.; Prokushkin, S.G. Soil respiration in larch and pine ecosystems of the Krasnoyarsk region (Russian Federation): A latitudinal comparative study. Arab. J. Geosci. 2020, 13, 954. [Google Scholar] [CrossRef]
  3. Abaimov, A.P.; Prokushkin, S.G.; Sukhovol’skii, V.G.; Ovchinnikova, T.M. Evaluation and prediction of postfire condition of Gmelin larch on permafrost soils in Middle Siberia. Lesovedenie 2004, 2, 3–11. (In Russian) [Google Scholar]
  4. Abaimov, A.P. Geographical Distribution and Genetics of Siberian Larch Species. In Permafrost Ecosystems. Ecological Studies (Analysis and Synthesis); Osawa, A., Zyryanova, O., Matsuura, Y., Kajimoto, T., Wein, R., Eds.; Springer: Dordrecht, The Netherlands, 2010; Volume 209. [Google Scholar]
  5. Stocks, B.J.; Mason, J.A.; Todd, J.B.; Bosch, E.M.; Wotton, B.M.; Amiro, B.D.; Flannigan, M.D.; Hirsch, K.G.; Logan, K.A.; Martell, D.L.; et al. Large forest fires in Canada, 1959–1997. J. Geophys. Res. 2003, 108, 814910. [Google Scholar] [CrossRef]
  6. Balshi, M.S.; McGuire, A.D.; Zhuang, Q.; Melillo, J.; Kicklighter, D.W.; Kasischke, E.; Wirth, C.; Flannigan, M.; Harden, J.; Clein, J.S.; et al. The role of historical fire disturbance in the carbon dynamics of the pan-boreal region: A process-based analysis. J. Geophys. Res. 2007, 112, G02029. [Google Scholar] [CrossRef] [Green Version]
  7. Kattenberg, A.; Giorgi, F.; Grassl, H.; Meehl, G.A.; Mitchell, J.F.B.; Stouffer, R.J.; Tokioka, T.; Weaver, A.J.; Wigley, T.M.L. Climate models-projections of future climate. In Climate Change 1995: The Science of Climate Change 2nd Assessment Report of The Intergovernmental Panel on Climate, Change; Houghton, J.T., Meiro Filho, L.G., Callender, B.A., Henris, N., Kattenberg, A., Maskell, K., Eds.; Cambridge University Press: Cambridge, UK, 1996; pp. 285–357. [Google Scholar]
  8. Permafrost Ecosystems; Osawa, A.; Zyryanova, O.A.; Matsuura, Y.; Kajimoto, T.; Wein, R.W. (Eds.) Ecological Studies; Springer: Dordrecht, The Netherlands, 2010; Volume 209. [Google Scholar]
  9. Bond-Lamberty, B.; Thompson, A. A global database of soil respiration data. Biogeosciences 2010, 7, 1915–1926. [Google Scholar] [CrossRef] [Green Version]
  10. Casper, J.K. Greenhouse Gases: Worldwide Impacts; Facts on File; An imprint of InfoBase Publishing, Inc.: New York, NY, USA, 2010; p. 287. [Google Scholar]
  11. Kharuk, V.I.; Ponomarev, E.I. Spatiotemporal characteristics of wildfire frequency and relative area burned in larch-dominated forests of central Siberia. Russ. J. Ecol. 2017, 48, 507–512. [Google Scholar] [CrossRef]
  12. NSW Fire and the Environment 2019–20: Summary; Department of Planning, Industry and Environment: Parramatta, Australia, 2020.
  13. Flannigan, M.D.; Logan, K.A.; Amiro, B.D.; Skinner, W.R.; Stocks, B.J. The future area burned in Canada. Clim. Chang. 2005, 72, 1–16. [Google Scholar] [CrossRef]
  14. Pechony, O.; Shindell, D.T. Driving forces of global wildfires over the past millennium and the forthcoming century. Proc. Natl. Acad. Sci. USA 2010, 107, 19167–19170. [Google Scholar] [CrossRef] [Green Version]
  15. Strauss, J.; Schirrmeister, L.; Grosse, G.; Fortier, D.; Hugelius, G.; Knoblauch, C.; Romanovsky, V.; Schädel, C.; Schneider von Deimling, T.; Schuur, E.A.G.; et al. Deep Yedoma permafrost: A synthesis of depositional characteristics and carbon vulnerability. Earth-Sci. Rev. 2017, 172, 75–86. [Google Scholar] [CrossRef] [Green Version]
  16. Veraverbeke, S.; Rogers, B.M.; Goulden, M.L.; Jandt, R.R.; Miller, C.E.; Wiggins, E.B.; Randerson, J.T. Lightning as a major driver of recent large fire years in North American boreal forests. Nat. Clim. Chang. 2017, 7, 529–534. [Google Scholar] [CrossRef]
  17. Pachauri, R.K.; Allen, M.R.; Barros, V.R.; Broome, J.; Cramer, W.; Christ, R.; Church, J.A.; Clarke, L.; Dahe, Q.; Dasgupta, P.; et al. IPCC: Climate Change 2014: Synthesis Report. Contribution of Working Groups I, II, and III to the Fifth Assessment Report of the Intergovernmental Panel on Climate Change; Pachauri, R.K., Meyer, L.A., Core Writing Team, Eds.; IPCC: Geneva, Switzerland, 2014; 151 p. [Google Scholar]
  18. Bergner, B.; Johnstone, J.; Treseder, K.K. Experimental warming and burn severity alter soil CO2 flux and soil functional groups in a recently burned boreal forest. Glob. Chang. Biol. 2004, 10, 1996–2004. [Google Scholar] [CrossRef] [Green Version]
  19. Abbott, B.W.; Jones, J.B. Permafrost collapse alters soil carbon stocks, respiration, CH4, and N2O in upland tundra. Glob. Chang. Biol. 2015, 21, 4570–4587. [Google Scholar] [CrossRef] [PubMed]
  20. Smith, D.R.; Kaduk, J.D.; Balzter, H.; Wooster, M.J.; Mottram, G.N.; Hartley, G.; Lynham, T.J.; Studens, J.; Curry, J.; Stocks, B.J. Soil surface CO2 flux increases with successional time in a fire scar chronosequence of Canadian boreal jack pine forest. Biogeosciences 2010, 7, 1375–1381. [Google Scholar] [CrossRef] [Green Version]
  21. Köster, E.; Köster, K.; Berninger, F.; Aaltonen, H.; Zhou, X.; Pumpanen, J. Carbon dioxide, methane, and nitrous oxide fluxes from a fire chronosequence in subarctic boreal forests of Canada. Sci. Total Environ. 2017, 601–602, 895–905. [Google Scholar]
  22. Amiro, B.D.; Barr, A.G.; Barr, J.G.; Black, T.A.; Bracho, R.; Brown, M.; Chen, J.; Clark, K.L.; Davis, K.J.; Desai, A.R.; et al. Ecosystem carbon dioxide fluxes after disturbance in forests of North America. J. Geophys. Res. 2010, 115, G00K02. [Google Scholar] [CrossRef]
  23. Morishita, T.; Noguchi, K.; Kim, Y.; Matsuura, Y. CO2, CH4, and N2O fluxes of upland black spruce (Picea mariana) forest soils after forest fires of different intensities in interior Alaska. Soil Sci. Plant Nutr. 2015, 61, 98–105. [Google Scholar] [CrossRef] [Green Version]
  24. Köster, K.; Köster, E.; Orumaa, A.; Parro, K.; Jõgiste, K.; Berninger, F. How time since forest fire affects stand structure, soil physical-chemical properties, and soil CO2 efflux in hemiboreal scots pine forest fire chronosequence? Forests 2016, 7, 201. [Google Scholar]
  25. Ribeiro-Kumara, C.; Pumpanen, J.; Heinonsalo, J.; Metslaid, M.; Orumaa, A.; Jõgiste, K.; Berninger, F.; Köster, K. Long-term effects of forest fires on soil greenhouse gas emissions and extracellular enzyme activities in a hemiboreal forest. Sci. Total Environ. 2020, 718, 135291. [Google Scholar] [CrossRef]
  26. Sawamoto, T.; Hatano, R.; Yajima, T.; Takahashi, K.; Isaev, A.P. Soil respiration in Siberian taiga ecosystems with different histories of forest fire. Soil Sci. Plant Nutr. 2000, 46, 31–42. [Google Scholar] [CrossRef]
  27. Morishita, T.; Masyagina, O.V.; Koike, T.; Matsuura, Y. Soil respiration in arch forests. In Permafrost Ecosystems: Siberian Larch Forests. Ecological Studies; Osawa, A., Zyryanova, O.A., Matsuura, Y., Kajimoto, T., Wein, R.W., Eds.; Springer: Dordrecht, The Netherlands, 2010; Volume 209, pp. 165–182. [Google Scholar]
  28. Masyagina, O.V.; Evgrafova, S.Y.; Titov, S.V.; Prokushkin, A.S. Dynamics of soil respiration at different stages of pyrogenic restoration succession with different-aged burns in Evenkia as an example. Rus. J. Ecol. 2015, 46, 27–35. [Google Scholar] [CrossRef]
  29. Köster, E.; Köster, K.; Berninger, F.; Prokushkin, A.; Aaltonen, H.; Zhou, X.; Pumpanen, J. Changes in fluxes of carbon dioxide and methane caused by fire in Siberian boreal forest with continuous permafrost. J. Environ. Manag. 2018, 228, 405–415. [Google Scholar] [CrossRef] [PubMed] [Green Version]
  30. Meroni, M.; Mollicone, D.; Belelli, L.; Manca, G.; Rosellini, S.; Stivanello, S.; Tirone, G.; Zompanti, R.; Tchebakova, N.; Schulze, E.; et al. Carbon and water exchanges of regenerating forests in central Siberia. For. Ecol. Manag. 2002, 169, 115–122. [Google Scholar] [CrossRef]
  31. Amiro, B.D.; MacPherson, J.I.; Desjardins, R.L.; Chen, J.M.; Liu, J. Post-fire carbon dioxide fluxes in the western Canadian boreal forest: Evidence from towers, aircraft, and remote sensing. Agric. For. Meteorol. 2003, 115, 91–107. [Google Scholar] [CrossRef]
  32. Litvak, M.; Miller, S.; Wofsy, S.C.; Goulden, M. Effect of stand age on whole ecosystem CO2 exchange in Canadian boreal forests. J. Geophys. Res. 2003, 108, 822510. [Google Scholar] [CrossRef] [Green Version]
  33. Schulze, E.D.; Lloyd, J.; Kelliher, F.M.; Wirth, C.; Rebmann, C.; Luhker, B.; Mund, M.; Knohl, A.; Milyukova, I.M.; Schulze, W.; et al. Productivity of forests in the Eurosiberian boreal region and their potential to act as a carbon sink—A synthesis. Glob. Chang. Biol. 1999, 5, 703–722. [Google Scholar] [CrossRef]
  34. Amiro, B.D. Paired-tower measurements of carbon and energy fluxes following disturbance in the boreal forest. Glob. Chang. Biol. 2001, 7, 253–268. [Google Scholar] [CrossRef]
  35. Bond-Lamberty, B.; Wang, C.K.; Gower, S.T. Net primary production and net ecosystem production of a boreal black spruce wildfire chronosequence. Glob. Chang. Biol. 2004, 10, 473–487. [Google Scholar] [CrossRef]
  36. Amiro, B.D.; Barr, A.G.; Black, T.A.; Iwashita, H.; Kljun, N.; McCaughey, J.H.; Morgenstern, K.; Murayama, S.; Nesic, Z.; Orchansky, A.L.; et al. Carbon, energy and water fluxes at mature and disturbed forest sites, Saskatchewan, Canada. Agric. For. Meteorol. 2006, 136, 237–251. [Google Scholar] [CrossRef]
  37. Czimczik, C.I.; Trumbore, S.E.; Carbone, M.S.; Winston, G.C. Changing sources of soil respiration with time since fire in a boreal forest. Glob. Chang. Biol. 2006, 12, 957–971. [Google Scholar] [CrossRef] [Green Version]
  38. Luo, Y.; Zhou, X. Soil Respiration and the Environment.; Academic Press: New York, NY, USA, 2006; p. 333. [Google Scholar]
  39. Churakova-Sidorova, O.V.; Corona, C.; Fonti, M.V.; Guillet, S.; Saurer, M.; Siegwolf, R.T.W.; Stoffel, M. Recent atmospheric drying in Siberia has not been unprecedented over the last 1,500 years. Sci. Rep. 2020, 10, 15024. [Google Scholar]
  40. Sofronov, M.A.; Volokitina, A.V.; Shvidenko, A.Z. Wildland fires in the north of Central Siberia. Commonw. For. Rev. 1998, 77, 124–127. [Google Scholar]
  41. Hiyama, T.; Ueyama, M.; Kotani, A.; Iwata, H.; Nakai, T.; Okamura, M.; Ohta, T.; Harazono, Y.; Petrov, R.E.; Maximov, T.C. Lessons learned from more than a decade of greenhouse gas flux measurements at boreal forests in eastern Siberia and interior Alaska. Polar Sci. 2020, 100607. [Google Scholar] [CrossRef]
  42. IUSS Working Group WRB. World Reference Base for Soil Resources 2014, update 2015 International soil classification system for naming soils and creating legends for soil maps. In World Soil Resources Reports No. 106; FAO: Rome, Italy, 2015. [Google Scholar]
  43. Kajimoto, T.; Matsuura, Y.; Osawa, A.; Prokushkin, A.S.; Sofronov, M.A.; Abaimov, A.P. Root system development of Larix gmelinii trees affected by micro-scale conditions of permafrost soils in central Siberia. Plant Soil 2003, 255, 281–292. [Google Scholar] [CrossRef]
  44. Anisimov, O.A.; Anokhin, Y.A.; Lavrov, S.A.; Malkova, G.V.; Myach, L.T.; Pavlov, A.V.; Romanovskii, V.A.; Streletskii, D.A.; Kholodov, A.L.; Shiklomanov, N.I. Continental permafrost. In Methods of Assessment of Climate Change Consequences for Physical and Biological Systems; Semenov, S.M., Ed.; Gidrometeoizdat: Moscow, Russia, 2012; pp. 301–359. [Google Scholar]
  45. Chernoff, H. The use of faces to represent statistical associations. J. Am. Stat. Assoc. 1973, 68, 361–368. [Google Scholar] [CrossRef]
  46. Warrick, A.W.; Nielsen, D.R. Spatial variability of soil physical properties in the field. In Applications of Soil Physics; Hillel, D., Ed.; Academic Press: New York, NY, USA, 1980; pp. 319–344. [Google Scholar]
  47. Yanagihara, Y.; Koike, T.; Matsuura, Y.; Mori, S.; Shibata, H.; Satoh, F.; Masyagina, O.V.; Zyryanova, O.A.; Prokushkin, A.S.; Prokushkin, S.G.; et al. Soil respiration rate on the contrasting north- and south-facing slopes of a larch forest in central Siberia. Eurasian J. For. Res. 2000, 1, 19–29. [Google Scholar]
  48. Knicker, H. How does fire affect the nature and stability of soil organic nitrogen and carbon? A review. Biogeochemistry 2007, 8, 91–118. [Google Scholar] [CrossRef]
  49. Burke, R.A.; Zepp, R.G.; Tarr, M.A.; Miller, W.L.; Stocks, B.J. Effect of fire on soil-atmosphere exchange of methane and carbon dioxide in Canadian boreal forest sites. J. Geophys. Res. Atmos. 1997, 102, 29289–29300. [Google Scholar] [CrossRef]
  50. Köster, K.; Berninger, F.; Heinonsalo, J.; Lindén, A.; Köster, E.; Ilvesniemi, H.; Pumpanen, J. The long-term impact of low-intensity surface fires on litter decomposition and enzyme activities in boreal coniferous forests. Int. J. Wildland Fire. 2016, 25, 213–223. [Google Scholar] [CrossRef]
  51. Zhou, X.; Sun, H.; Sietiö, O.-M.; Pumpanen, J.; Heinonsalo, J.; Köster, K.; Berninger, F. Wildfire effects on soil bacterial community and its potential functions in a permafrost region of Canada. Appl. Soil Ecol. 2020, 156, 103713. [Google Scholar] [CrossRef]
  52. Wang, C.; Bond-Lamberty, B.; Gower, S.T. Soil surface CO2 flux in a boreal black spruce fire chronosequence. J. Geophys. Res. 2002, 108, 8224. [Google Scholar] [CrossRef]
  53. Pietikäinen, J.; Fritze, H. Clear-cutting and prescribed burning in coniferous forest: Comparison of effects on soil fungal and total microbial biomass, respiration activity, and nitrification. Soil Biol. Biochem. 1995, 27, 101–109. [Google Scholar] [CrossRef]
  54. Hu, T.; Sun, L.; Hu, H.; Weise, D.R.; Guo, F. Soil Respiration of the Dahurian Larch (Larix gmelinii) forest and the response to fire disturbance in Da Xing’an Mountains, China. Sci. Rep. 2017, 7, 2967. [Google Scholar] [CrossRef] [PubMed] [Green Version]
  55. Zhou, T.; Phi, P.; Hui, D.; Luo, Y. Global pattern of temperature sensitivity of soil heterotrophic respiration (Q10) and its implications for carbon-climate feedback. J. Geophys. Res. Biogeosci. 2009, 114, G02016. [Google Scholar] [CrossRef] [Green Version]
  56. Aaltonen, H. Carbon dynamics in forest fire affected permafrost soils. Diss. For. 2020, 288, 54. [Google Scholar] [CrossRef]
  57. Kajimoto, T. Root system development of larch trees growing on Siberian permafrost. In Permafrost Ecosystems: Siberian Larch Forests. Ecological Studies; Osawa, A., Zyryanova, O.A., Matsuura, Y., Kajimoto, T., Wein, R.W., Eds.; Springer: Dordrecht, The Netherlands, 2010; Volume 209, pp. 99–122. [Google Scholar]
  58. Feurdean, A.; Gałka, M.; Florescu, G.; Diaconu, A.-C.; Tant, I.; Kirpotin, S.; Hutchinson, S.M. 2000 years of variability in hydroclimate and carbon accumulation in western Siberia and the relationship with large-scale atmospheric circulation: A multi-proxy peat record. Quat. Sci. Rev. 2019, 226, 105948. [Google Scholar] [CrossRef]
  59. Masyagina, O.V.; Menyailo, O.V. The impact of permafrost on carbon dioxide and methane fluxes in Siberia: A meta-analysis. Environ. Res. 2020, 182, 109096. [Google Scholar] [CrossRef]
Figure 1. Study site locations and layout.
Forests 12 00107 g001
Figure 2. Study sites in Tura. (A), T20 in 2009 (0-year-old); (B), T20 in 2011 (2-year-old); (C), T21 in 2001 (7-year-old); (D), T21 in 2011 (17-year-old); (E), T23 in 2007 (27-year-old); (F), T22 in 2010 (29-year-old); (G), T1 in 2011 (101-year-old); (H), T3 in 2009 (107-year-old); (I), T4 in 2010 (108-year-old); (J), T6 in 2010 (141-year-old); (K), T2 in 2001 (253-year-old); (L), T2 in 2011 (272-year-old).
Forests 12 00107 g002
Figure 3. Correlation principal component analysis (PCA) of the studied environmental parameters (variables PCA; right) and various age groups of the burnt areas (individuals PCA; left). Individuals PCA: (1), 0.25-year-old burnt areas; (2), 1-year-old burnt areas; (3), 2-year-old burnt areas; (4), 3-year-old burnt areas; (5), 4-year-old burnt areas; (6), 5-year-old burnt areas; (7), 6-year-old burnt areas; (8), 10-year-old burnt areas; (9), 11-year-old burnt areas; (10), 13-year-old burnt areas; (11), 14-year-old burnt areas; (12), 15-year-old burnt areas; (13), 16-year-old burnt areas; (14), 17-year-old burnt areas; (15), 21-year-old burnt areas; (16), 22-year-old burnt areas; (17), 29-year-old burnt areas; (18), 54-year-old burnt areas; (19), 88-year-old burnt areas; (20), 89-year-old burnt areas; (21), 90-year-old burnt areas; (22), 97-year-old burnt areas; (23), 99-year-old burnt areas; (24), 100-year-old burnt areas; (25), 101-year-old burnt areas; (26), 103-year-old burnt areas; (27), 105-year-old burnt areas; (28), 110-year-old burnt areas; (29), 140-year-old burnt areas; (30), 141-year-old burnt areas; (31), 150-year-old burnt areas; (32), 151-year-old burnt areas; (33), 153-year-old burnt areas; (34), 200-year-old burnt areas; (35), 260-year-old burnt areas; (36), 263-year-old burnt areas; (37), 270-year-old burnt areas; (38), 272-year-old burnt areas; (39), 274-year-old burnt areas; (40), 275-year-old burnt areas; (41), 276-year-old burnt areas. Variables PCA: SR, mean soil respiration; Age, burnt area age; ST5, mean summer soil temperature; SWC5, mean summer water content; VegH, vegetation cover height. cos2, the squared cosine which represents the quality of representation for variables on the factor map. contrib, the contributions (in %) of the variables to the principal components.
Forests 12 00107 g003
Figure 4. (a) Soil respiration (SR, µmol CO2 m−2 s−1); (b) soil temperature (ST5, °C); (c) soil water content (SWC5, %) in wildfire-affected stands of different ages during the growing season. The horizontal line within the box indicates the median, box boundaries indicate 25th and 75th percentiles, whiskers indicate highest and lowest values, and dots above or below the whiskers indicate the outliers. Medians followed by different letters in the same plot are significantly different at p < 0.05 according to the Kruskal–Wallis test extended with the Wilcoxon test. Lowercase letters indicate significant differences between the SR values of same age group during the growing season (between different months within one panel, e.g., within 0-10). Uppercase letters indicate significant differences in the SR of different age groups within the same month (e.g., June). The figure in the grey bar at the top side indicates the age interval of larch stands.
Forests 12 00107 g004
Figure 5. Principal component analysis (PCA) of the correlations between the studied parameters (variables PCA, right) and different age groups of burnt areas (individuals PCA, left). Individual PCA: (1), 0–10-year-old burnt areas; (2), 11–54-year-old burnt areas; (3), 88–141-year-old burnt areas; (4), 150–276-year-old burnt areas. Variables PCA: SR, mean soil respiration; ST5, mean summer soil temperature; SWC5, mean summer soil water content; C, mean soil C content; N, mean soil N content; C.N, soil C/N ratio; BR, mean soil basal respiration; SIR, mean soil substrate-induced respiration; roots, root biomass; VegH, vegetation cover height; LitD, litter thickness. cos2, the squared cosine which represents the quality of representation for variables on the factor map. contrib, the contributions (in %) of the variables to the principal components.
Forests 12 00107 g005
Figure 6. Soil respiration (SR, µmol CO2 m−2 s−1) and soil temperature (ST5, °C) at wildfire-affected sites of different ages in the 1995–2010 study period. Grey areas represent standard errors. The figure in the grey bar at the right side indicates the age interval of larch stands.
Forests 12 00107 g006
Table 1. Site characteristics.
SiteVegetation Types (Species, Structure)CoordinatesStudy Period (Number of Measurements)Vegetation Cover Height (cm)Stand *Reference Soil Groups
Tree Composition (Age, Years)AverageStock (m3 ha−1)
H (m)DBH (cm)
T1Dwarf-shrub-green moss larch stand with Dushekia understory. Control site of the 2009 burnt area64.23N 100.17E, 260 m a.s.l.2009 (6), 2010 (6)10–2510L (80–100 as of 2010)6.97.231.0CM
T2Vaccinium-green moss-lichen larch stand. Control site of the 1994 burnt area64.32N 100.20E, 230 m a.s.l.1995 (40), 1998 (18), 2005 (6), 2007 (10), 2009 (7)3–2710L (271 ** as of 2010)8.310.343.2CR
T3Dwarf-shrub-Sphagnum larch stand64.33N 100.27E, 230 m a.s.l.1999 (30), 2001 (14)10–2510L (104 as of 2006)4.14.19.6HS
T4Dwarf-shrub-green moss larch stand. Control site of the 1981 burnt area64.35N 100.23E, 204 m a.s.l.1994 (30); 2005 (4); 2010 (18)8–1610L (104 as of 2006)7.36.326.5CM
T5Vaccinium-Ledum-green moss larch stand. Control site of the 1990 burnt area64.32N, 100.27E, 215 m a.s.l.1999 (20), 2004 (33), 2005 (6), 2007 (10)15–2310L (104 as of 2006)7.45.832.2CM
T6Dwarf-shrub-lichen-green moss larch stand (near the soil warming experimental plot). Burnt area of 186964.21N 100.46E, 190 m a.s.l.2009 (56), 2010 (14)6–2510L (141 as of 2010)4.24.029.4CR
T7Vaccinium-dry moss-larch stand dominated by Rhytidium rugosum (Hedw.) Kindb. Control site of the landslide of 200964.33N 100.23E2009 (6)ND7L3P (100–200 as of 2010)12.020.0110.0CM
T8Ledum-Vaccinium-green moss larch stand dominated by Pleurozium schreberi (Brid.) Mitt. Control site of the landslide of 200164.18N 100.53E2007 (6), 2008 (6)2–410L (150 as of 2007)13.014.050.0CM
T9Ledum-Vaccinium-green moss larch stand dominated by Pleurozium schreberi (Brid.) Mitt. Control site of the landslide of 197264.18N 100.68E2007 (6), 2008 (6)3.5–510L (90–150 as of 2007)9.010.090.0CM
T10Dwarf shrub-Carex-green moss larch stand with Salix spp. understory (Tura Station)64.29N, 100.20E1999 (29), 2000(71), 2001 (160), 2010 (6)5–22.59L1B (105 as of 2013)4.94.442.6CM
T11Dwarf-shrub-green moss larch stand. South-exposed control plot of the 1993 burnt area (S93)64.33N, 100.22E, 160 m a.s.l.2008 (7), 2009 (6)2–810L (188 as of 2008)10.511.039.0CM
T12Vaccinium-green moss-larch stand. Northern exposition of the control plot of the burnt area of 1993 (N93)64.33N, 100.22E, 160 m a.s.l.2008 (9), 2009 (6)5–1010L (228–275 as of 2008)6.97.832.0CR
T13Vaccinium-Ledum-green moss larch stand. North-facing slope of the control plot of the 1990 burnt area (N90)64.33N, 100.26E, 176 m a.s.l.1999 (21), 2004 (34), 2007 (11)9–1110L (104 as of 2006)7.75.841.7CR
T14Dwarf-shrubs-larch stand. PP1-264.33N, 100.25E1999 (20)2.5–69L1B (83 as of 2001)6.16.210.7CM
T15Burnt area of 200564.53N, 100.24E2005 (6)-10L (1 as of 2006)00-CR
T16Dwarf shrub-lichen-green moss larch stand, control plot of the burnt area of 200564.53N, 100.25E2005 (6)ND10L (154 as of 2006)9.610.653.1CR
T17Dwarf shrub-green moss-larch stand with Dushekia understory, burnt area of 2009, ground wildfire64.23N 100.17E, 260 m a.s.l.2009 (6), 2010 (21)3–1010L (1 as of 2010)0.20.0-CM
T18Vaccinium-green moss-lichen-larch stand, burnt area of 1994, a steady ground fire of moderate intensity64.32N 100.20E, 230 m a.s.l.1995 (40), 1996(7), 1997 (21), 1998 (21), 1999 (10), 2000 (12), 2005 (6), 2007 (10), 2009 (7), 2010 (24)2–1010L (16 as of 2010)1.40.466.0CR
T19Dwarf-shrub-green moss larch stand, burnt area of 1981, strong rapid ground fire64.35N 100.23E, 203 m a.s.l.2005 (6), 2010 (24)4–710L (29 as of 2010)4.12.422.2CR
T20Vaccinium-Ledum-green moss-larch stand, burnt area of 1990, strong running ground fire64.33N 100.35E2000 (6), 2004 (8), 2005 (6), 2007 (8)8–1010L (26 as of 2010)2.91.514.4CM
T21Ledum-Vaccinium-green moss-larch stand, burnt area of 1978, strong running ground fire64.34N, 100.27E2000 (6)13–2010L (32 as of 2010)4.82.732.0CR
T22Dwarf-shrub-green moss shrubland with Salix spp. and D. fruticosa, sparse Larix, burnt area of 1993, a ground fire of high intensity64.33 N, 100.22E1995 (30)ND0L (17 as of 2010)00-CR
T23Ledum-Vaccinium-green moss-larch stand with Dushekia understory, burnt area of 1951, strong running ground fire after winter selective cutting64.30N, 100.22E2005 (6)ND10L (55 as of 2006)9.56.873.3CM
CM, Cambisols; CR, Cryosols; HS, Histosols [42]; ND, no data available; * living trees; ** Kajimoto et al. (2003) [43].
Table 2. Descriptive statistics of soil respiration (SR, μmol m−2 s−1), soil temperature (ST5, °C), soil water content (SWC5, %), basal respiration (BR, mg CO2-C kg−1 day−1), substrate-induced respiration (SIR, mg CO2-C kg−1 day−1), C and N contents (%), C/N, root biomass (roots, g), vegetation cover height (VegH, cm), and litter thickness (LitD, cm) in the four stand age groups (0–10, 11–54, 88–141, and 150–276 years old). SD, standard deviation of the mean; CV, coefficient of variation (%). Same letters in each row indicate no significant differences among values.
Variable Stand Age (Years)0–1011–5488–141150–276Mean
Statistics
SRmean1.77 a4.65 b2.83 c5.18 b3.16
SD1.182.731.892.7
CV66.758.766.852.1
BRmean67.38 a134.99 b151.87 b41.3 a98.89
SD51.8999.09140.5248.29
CV77.073.492.5116.9
SIRmean245.39 a262.51 a465.86 a354.63 a332.10
SD177.07126.92318.98290.65
CV72.248.368.582.0
SWC5 over the growing seasonmean53.62 a39.90 b73.02 c39.41 b51.49
SD13.812.0717.5417.19
CV25.730.324.043.6
ST5 over the growing seasonmean11.69 a8.15 b7.53 b9.69 c9.27
SD5.24.864.774.3
CV44.559.663.344.4
LitDmean7.54 a2.84 b6.46 a5.29 a5.53
SD6.762.573.913.37
CV89.790.560.563.7
Cmean2.52 a3.82 a4.35 a4.06 a3.69
SD0.882.812.962.07
CV34.973.668.051.0
Nmean0.11 a0.175 a0.18 a0.184 a0.16
SD0.0370.1020.1020.089
CV33.658.356.748.4
C/Nmean18.83 a17.175 a18.7 a19.94 a18.66
SD1.574.054.013.28
CV8.323.621.416.4
rootsmean0.23 a1.65 b3.15 c3.18 b2.05
SD0.571.182.696.25
CV247.871.585.4196.5
VegHmean2.36 a2.83 a5.49b2.47 a3.29
SD1.32.832.981.83
CV55.1100.054.374.1
ST5 in Julymean12.84 a10.99 a11.54 a8.01 b10.85
SD3.394.924.134.27
CV26.444.835.853.3
ST5 in Augustmean12.01 a7.68 b6.16 c10.36 d9.05
SD4.993.383.974.14
CV41.544.064.440.0
ST5 in Septembermean0.63 a4.1 b1.13 a1 a1.72
SD0.191.290.60.45
CV30.231.553.145.0
Table 3. Statistical results of the Kruskal-Wallis chi-square test for some physical, chemical, and biological parameters on the study sites during the growing season (June-September), depending on the age group of the sites. ST5, soil temperature; SWC5, soil water content; SR, soil respiration; BR, basal respiration; SIR, substrate-induced respiration.
ParameterKruskal-Wallis Chi-Square
Age Group of the Burnt AreasMonth of the Growing Season
ST5 (°C)63.47 *80.34 *
SWC5 (%)152.91 *38.67 *
Total soil C at a 0–5 cm horizon (%)0.93NA
Total soil N at a 0–5 cm horizon (%)1.45NA
C/N at a 0-5 cm soil horizon3.56NA
SR (µmol CO2 m−2 s−1)237.30 *73.24 *
Microbial BR in the 0–5 cm mineral soil horizon (mg CO2-C kg−1 day−1)22.01 *NA
Microbial SIR in the 0–5 cm mineral soil horizon (mg CO2-C kg−1 day−1)4.64NA
Root biomass (roots, g)21.88 *NA
Vegetation cover height (VegH, cm)66.13 *17.66 *
Litter thickness (LitD, cm)65.23 *57.66 *
* p < 0.01; NA, data not available.
Table 4. The parameter contribution to the PCs in the PCA plot (Figure 5). Mean SR, mean soil respiration; Mean summer ST5, mean summer soil temperature; Mean summer SWC5, mean summer soil water content; C/N, soil C/N ratio; Mean soil BR, mean soil basal respiration; Mean soil SIR, mean soil substrate-induced respiration; roots, root biomass; VegH, vegetation cover height; LitD, litter thickness.
VariablesContribution to PC
Dim 1Dim 2Dim 3Dim 4
Mean SR3.7522.922.185.28
Mean summer ST516.440.084.1451.62
Mean summer SWC51.8427.470.270.93
Mean soil C content17.240.741.235.55
Mean soil N content15.044.471.228.02
C/N0.180.9242.7221.54
Mean soil BR6.852.8223.650.19
Mean soil SIR11.766.855.803.44
roots13.860.2110.253.40
VegH10.1613.060.730.01
LitD2.8920.467.820.03
The main contributions are shown in bold.
Table 5. Correlation analysis performed on various age groups (0–10, 11–54, 88–141, and 150–276-years-old groups) by the means of Pearson’s product-moment correlation coefficients (significant at p < 0.05 and at p < 0.01). SR, soil respiration; ST5, soil temperature; SWC5, soil water content; C, soil C content; N, soil N content; C/N, soil C/N ratio; BR, soil basal respiration; SIR, soil substrate-induced respiration; roots, root biomass; VegH, vegetation cover height; LitD, litter thickness; Age, stand age; NA, no data available.
0–10-Year-Old Group
AgeSRST5SWC5CNC/NBRSIRrootsVegHLitD
Age p < 0.01p < 0.01p = 0.054 p < 0.01
SR0.31 p < 0.05p < 0.05
ST50.32−0.04 p < 0.05 p < 0.01
SWC5−0.440.04−0.55 p = 0.085
CNANA0.090.99
NNANA0.180.920.96
C/NNANA0.940.540.430.17
BR−0.16−0.540.73−0.06−0.23−0.490.78 p < 0.01
SIRNA−0.690.520.47NANANA0.96
rootsNA0.14−0.530.69NANANANANA
VegH0.450.47NANANANANANANANA
LitD−0.78−0.23−0.740.60NANANANANA0.500.33
11–54-Year-Old Group
AgeSRST5SWC5CNC/NBRSIRrootsVegHLitD
Age p < 0.01 p < 0.05 p < 0.01p < 0.01
SR−0.29 p < 0.01 p < 0.05 p < 0.05
ST5−0.070.35 p = 0.056 p < 0.01
SWC5−0.210.01−0.21 p < 0.01
C−0.110.080.430.004 p < 0.01p < 0.05p < 0.05
N−0.110.170.430.080.99 p < 0.01p < 0.05
C/N0.28−0.210.200.110.870.84
BR−0.12−0.040.380.190.760.780.64 p < 0.05
SIR0.600.590.440.21NANANA0.34 p = 0.058
roots−0.240.230.640.22NANANANANA
VegH0.64−0.44−0.090.74NANANANANA−0.10 p < 0.01
LitD0.82−0.14−0.52−0.14NANANA0.870.80−0.110.59
88–141-Year-Old Group
AgeSRST5SWC5CNC/NBRSIRrootsVegHLitD
Age p < 0.01p < 0.01p < 0.01 p < 0.01p < 0.01p < 0.05
SR0.17 p < 0.05p < 0.01 p < 0.01p < 0.01
ST5−0.490.15 p < 0.01
SWC5−0.38−0.280.3 p = 0.064 p < 0.05
CNA−0.020.140.25 p < 0.01p < 0.01p = 0.073
NNA−0.050.160.280.99 p < 0.01p = 0.078
C/NNA−0.050.080.260.990.99
BR−0.17−0.210.40.270.840.840.79 p < 0.01
SIR0.15−0.25−0.390.55NANANA0.76
roots−0.500.100.160.15NANANANANA
VegH−0.27−0.220.360.11NANANANANA−0.31 p < 0.01
LitD0.120.390.580.09NANANANANA0.09−0.15
150–276-Year-Old Group
AgeSRST5SWC5CNC/NBRSIRrootsVegHLitD
Age p < 0.01 p < 0.01p < 0.01 p = 0.063p < 0.01p = 0.052
SR−0.27 p < 0.05p < 0.05 p < 0.05p = 0.06 p < 0.05
ST50.040.08 p = 0.07 p < 0.05
SWC5−0.004−0.2−0.29
C−0.790.64−0.130.29 p < 0.01 p = 0.085p = 0.061 p < 0.05
N−0.760.70−0.020.250.99 p = 0.055p = 0.073p = 0.079 p < 0.05
C/N-0.43-0.09-0.39-0.130.420.38
BR0.42−0.170.50−0.03−0.50−0.51−0.46
SIR−0.600.890.65−0.170.790.760.03−0.44
roots0.270.440.15−0.005NANANANANA
VegH0.68−0.220.110.005NANANANANANA
LitD−0.260.29−0.050.21−0.89−0.89−0.5−0.03−0.830.330.16
Publisher’s Note: MDPI stays neutral with regard to jurisdictional claims in published maps and institutional affiliations.

