Article

Effects of Throughfall Exclusion on Photosynthetic Traits in Mature Japanese Cedar (Cryptomeria japonica (L. f.) D. Don.)

1
Department of Plant Ecology, Forestry and Forest Products Research Institute, Tsukuba 305-8687, Japan
2
Forestry Division, Japan International Research Center for Agricultural Sciences, Tsukuba 305-8686, Japan
3
Department of Forest Soils, Forestry and Forest Products Research Institute, Tsukuba 305-8687, Japan
4
Kansai Research Center, Forestry and Forest Products Research Institute, Kyoto 612-0855, Japan
*
Author to whom correspondence should be addressed.
Submission received: 26 May 2021 / Revised: 5 July 2021 / Accepted: 15 July 2021 / Published: 22 July 2021
(This article belongs to the Special Issue Ecophysiology of Forest Succession under Changing Environment)

Abstract

:
As climate change progresses, it is becoming more crucial to understand how timber species respond to increased drought frequency and severity. Photosynthetic traits in a 40-year-old clonal Japanese cedar (Cryptomeria japonica) plantation were assessed under artificial drought stress using a roof to exclude rainfall and a control with no exclusion. C. japonica is a commercial tree that is native to Japan and has high growth on mesic sites. The maximum carboxylation rate (Vcmax), maximum electron transfer rate (Jmax), and dark respiration rate (Rd) in current-year shoots in the upper canopy were determined from spring to autumn over two growing seasons. In addition, the photosynthetic rate at light saturation (Pmax), stomatal conductance (gs), and intrinsic water use efficiency (WUEi) were measured in the morning and afternoon during the same period. Leaf mass per unit area (LMA) and nitrogen concentration (N) were also measured. The values of Vcmax, Jmax, Rd, N, and LMA did not differ between the two plots. By contrast, significantly lower Pmax and gs and higher WUEi were found in the drought plot, and the reduction in Pmax was accompanied by low gs values. Midday depressions in Pmax and gs were more pronounced in the drought plot relative to the control and were related to higher WUEi. Under drought conditions, mature Japanese cedar experienced little change in photosynthetic capacity, foliar N, or LMA, but they did tend to close the stomata to regulate transpiration, thus avoiding drought-induced damage to the photosynthetic machinery and improving WUEi.

1. Introduction

Predicted changes in precipitation patterns and an increased intensity of drought frequency will negatively affect tree growth and health [1]. Because photosynthetic traits are directly linked to tree growth, understanding photosynthetic trait responses to drought events is critical to predicting future growth patterns in forest trees [2,3,4,5,6]. In general, changes in photosynthetic capacity resulting from drought are related to changes in stomatal regulation, leaf morphology, and foliar nitrogen concentration [2,6,7,8,9]. However, the magnitude of these changes tends to differ among tree species [2,3,10,11]. For example, previous studies have revealed that when plants suffered drought stress, several tree species closed their stomata quickly, whereas other species slowly responded [2,3]. The former species was considered to tolerate drought by less water loss with strong stomatal regulation, but the regulation also caused decreases in photosynthesis and growth [2,3,10,11]. On the other hand, the later tree species maintained photosynthetic activity by their large stomatal conductance under drought [2,6,12,13,14]. However, if the drought is prolonged, there is a risk of dying via excessive loss of water [6,13,14]. Several tree species under drought conditions have shown leaf morphological adaptations such as increments in leaf dry mass per unit area (LMA) to tolerate low water potential [2,6,15,16]. Those different responses among tree species cause uncertainties in the future prediction of forest growth and functions under drought.
Japanese cedar (Cryptomeria japonica (L. f.) D. Don., Cupressaceae) is an evergreen conifer that has been widely planted in East Asia, particularly Japan, for timber production [17,18]. In its native range, this species is associated with moist, cool montane areas, where it is a dominant canopy species of late-successional forests [19,20,21]. Although these late-successional trees are usually long-lived, with lifespans of more than 1000 years, Japanese cedar also shares characteristics with early successional forest tree species, such as light wood density, fast growth, and higher photosynthetic and transpiration rates than other co-occurring late-successional conifers, such as hinoki cypress (Chamaecyparis obtusa (Sieb. et Zucc.) Endl.) [7,22,23,24]. Due to its high transpiration rate, Japanese cedar is susceptible to drought, and plantations are often situated in areas of deep soil on lower slopes to help mitigate this risk [22,25,26,27,28]. However, this attention to site moisture was foregone in Japan following World War II, when plantations were established in unsuitable areas, such as dry ridges. These plantations experience drought stress and their level of risk is expected to increase with climate change [4,26,27]. Thus, understanding the drought responses of Japanese cedar will enable us to evaluate the risks for future climate change.
Artificial drought experiments using seedlings and small saplings are commonly used to investigate drought-related responses [2,3,11,14]. However, it is unclear whether seedling responses can be applied to mature trees [6], given that many physiological characteristics shift with tree development [29,30,31,32]. Specifically, photosynthesis, stomatal conductance, and foliar nitrogen concentration decline more in mature trees than seedlings, and leaf mass per unit area (LMA) typically increases with tree height in response to drought stress [29,30,33,34]. In mature trees, increased gravitational potential and long water transport lengths from the roots to the canopy increase drought stress and lead to changes in leaf functional traits [30,35]. Although studies have reported the effects of artificially induced drought on Japanese cedar seedlings [22,23,24,36,37,38], few have tested drought responses in mature trees [39,40] despite the need to accurately predict tree growth responses under drought.
Throughfall exclusion is a common technique in artificial drought experiments that focus on the ecological and physiological response of mature trees to drought, and this technique has been applied in boreal, temperate, and tropical forests [12,13,41,42,43,44,45]. Large interspecific variations in stomatal regulation, photosynthetic traits, and growth have been reported, even within a single forest stand [46,47]. For example, two Mediterranean tree species showed contrasting photosynthetic and stomatal responses under drought conditions; Phillyrea latifolia L. showed strong stomatal regulation, which reduced transpiration and mitigated drought stress. This response was weak in Quercus ilex L., despite the fact that these species co-occur in the same environments [10]. Similar contrasting drought responses in growth and ecophysiological traits have been reported in temperate and tropical rainforest tree species [46,47,48]. In addition, several tree species have been shown to regulate foliar nitrogen concentration under drought conditions [8,49]. Presumably, this response compensates for the reduction in photosynthesis by improving the biochemical photosynthetic capacity [2,8,49]. Understanding photosynthetic function under drought stress requires evaluating leaf morphology, nitrogen concentration, and photosynthetic capacity. Understanding these parameters is also essential for process-based models that aim to estimate tree growth and the forest carbon balance [50].
To understand photosynthetic capacity in mature Japanese cedar under drought stress, we conducted a throughfall exclusion experiment over two growing seasons. We hypothesized that drought causes a reduction in photosynthesis due to reduced stomatal conductance in mature Japanese cedar. In addition, we also predicted that LMA and foliar nitrogen would both increase as leaf area declined under drought, and such changes would offset reductions in photosynthesis by increasing photosynthetic capacity on an areal basis. To test the hypothesis, we monitored ecophysiological and morphological traits in the needles of Japanese cedar in relation to photosynthesis, including photosynthetic functions and foliar characteristics such as nitrogen concentration. We also focused on how photosynthetic capacity and related foliar properties respond and contribute to adjustments to drought stress.

2. Materials and Methods

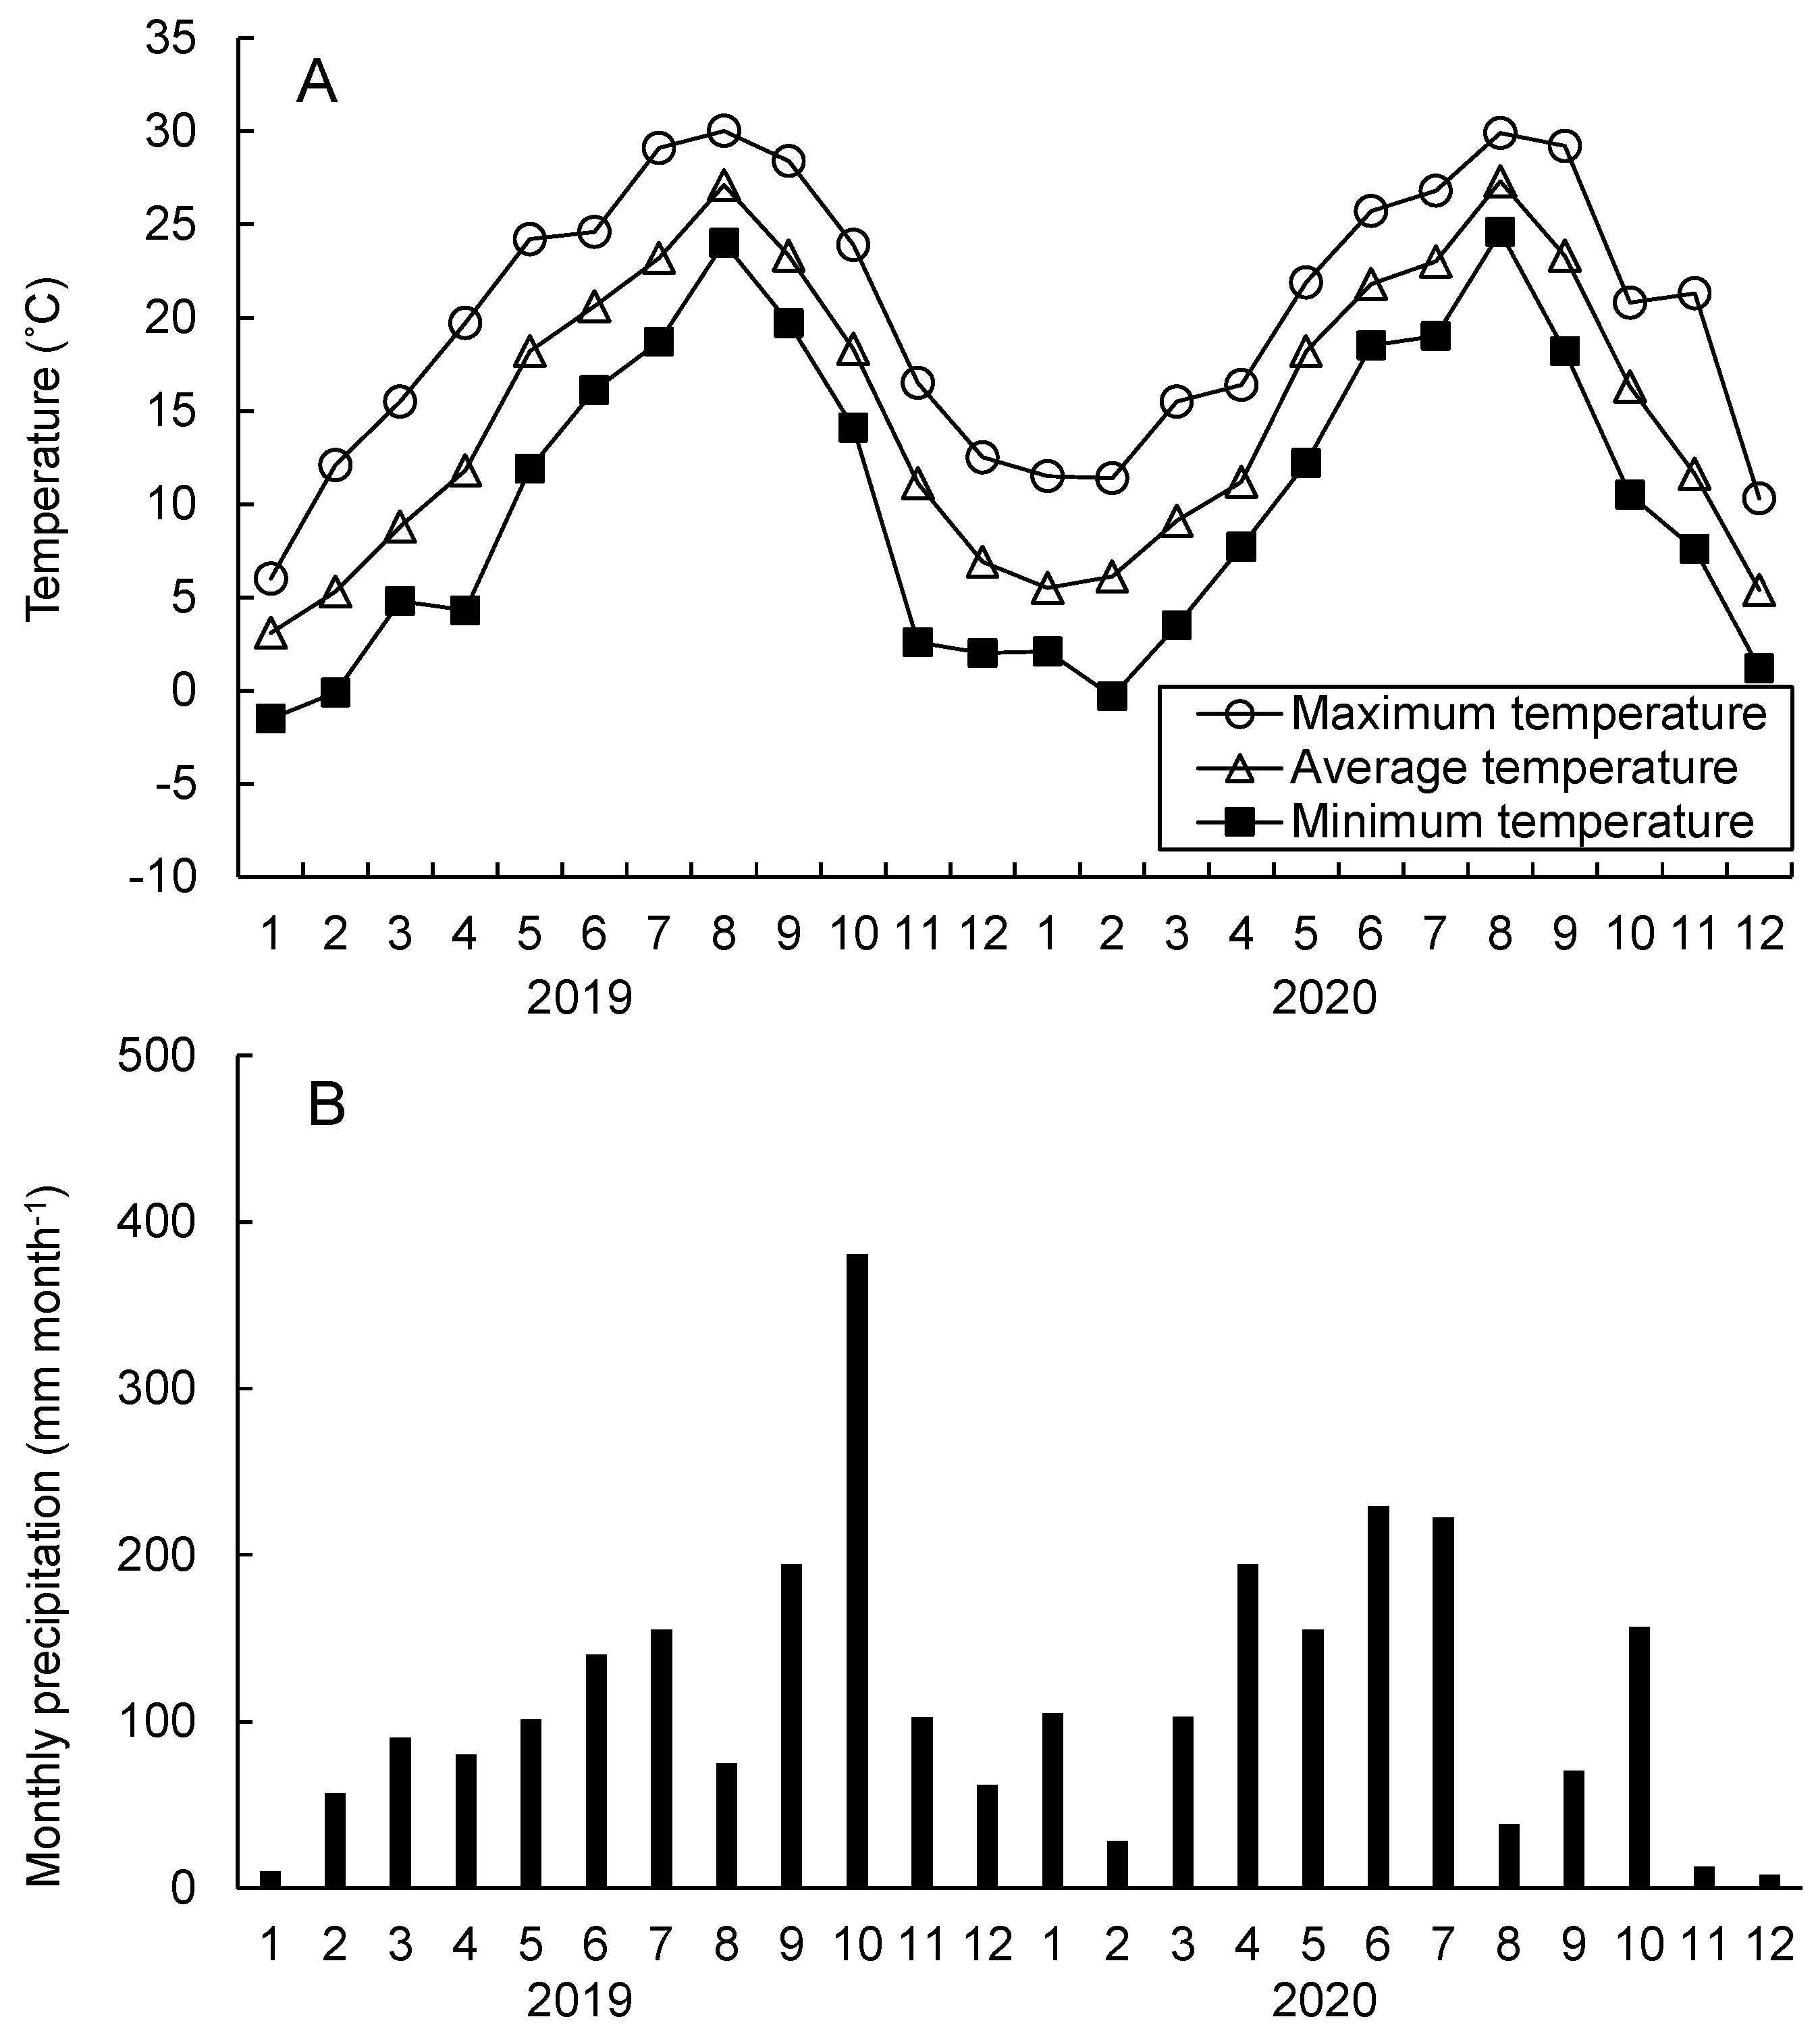
2.1. Study Site and Climate Conditions

The study plantation was 40 years of age at the time of the study, having been planted in 1978, and located in the Chiyoda Tree Nursery in Ibaraki, Japan (36°10′ N, 140°13′ E). The average canopy height was 20 m, and the average diameter at breast height (DBH) was 22 cm in 2018. The stand density was 2650 trees per hectare with no evidence of self-thinning. All study trees had healthy crowns, were not suppressed by neighboring trees, and showed no signs of disease or insect damage. The stand was an adequate harvestable size (approximately 20 cm DBH).
The average annual temperature and precipitation between 2017 and 2020 were 14.7 °C and 1301 mm, respectively, taken at a nearby meteorological station in Chiyoda, Ibaraki Prefecture. The average annual precipitation over a 30 year period (1981–2010) was approximately 1200 mm and ranged from 640 mm in 1984 to 1670 mm in 1991. Severe summer drought occurred in 1984 in the study region. Therefore, the average annual precipitation during the study period (1301 mm) was relatively normal and did not indicate drought conditions.

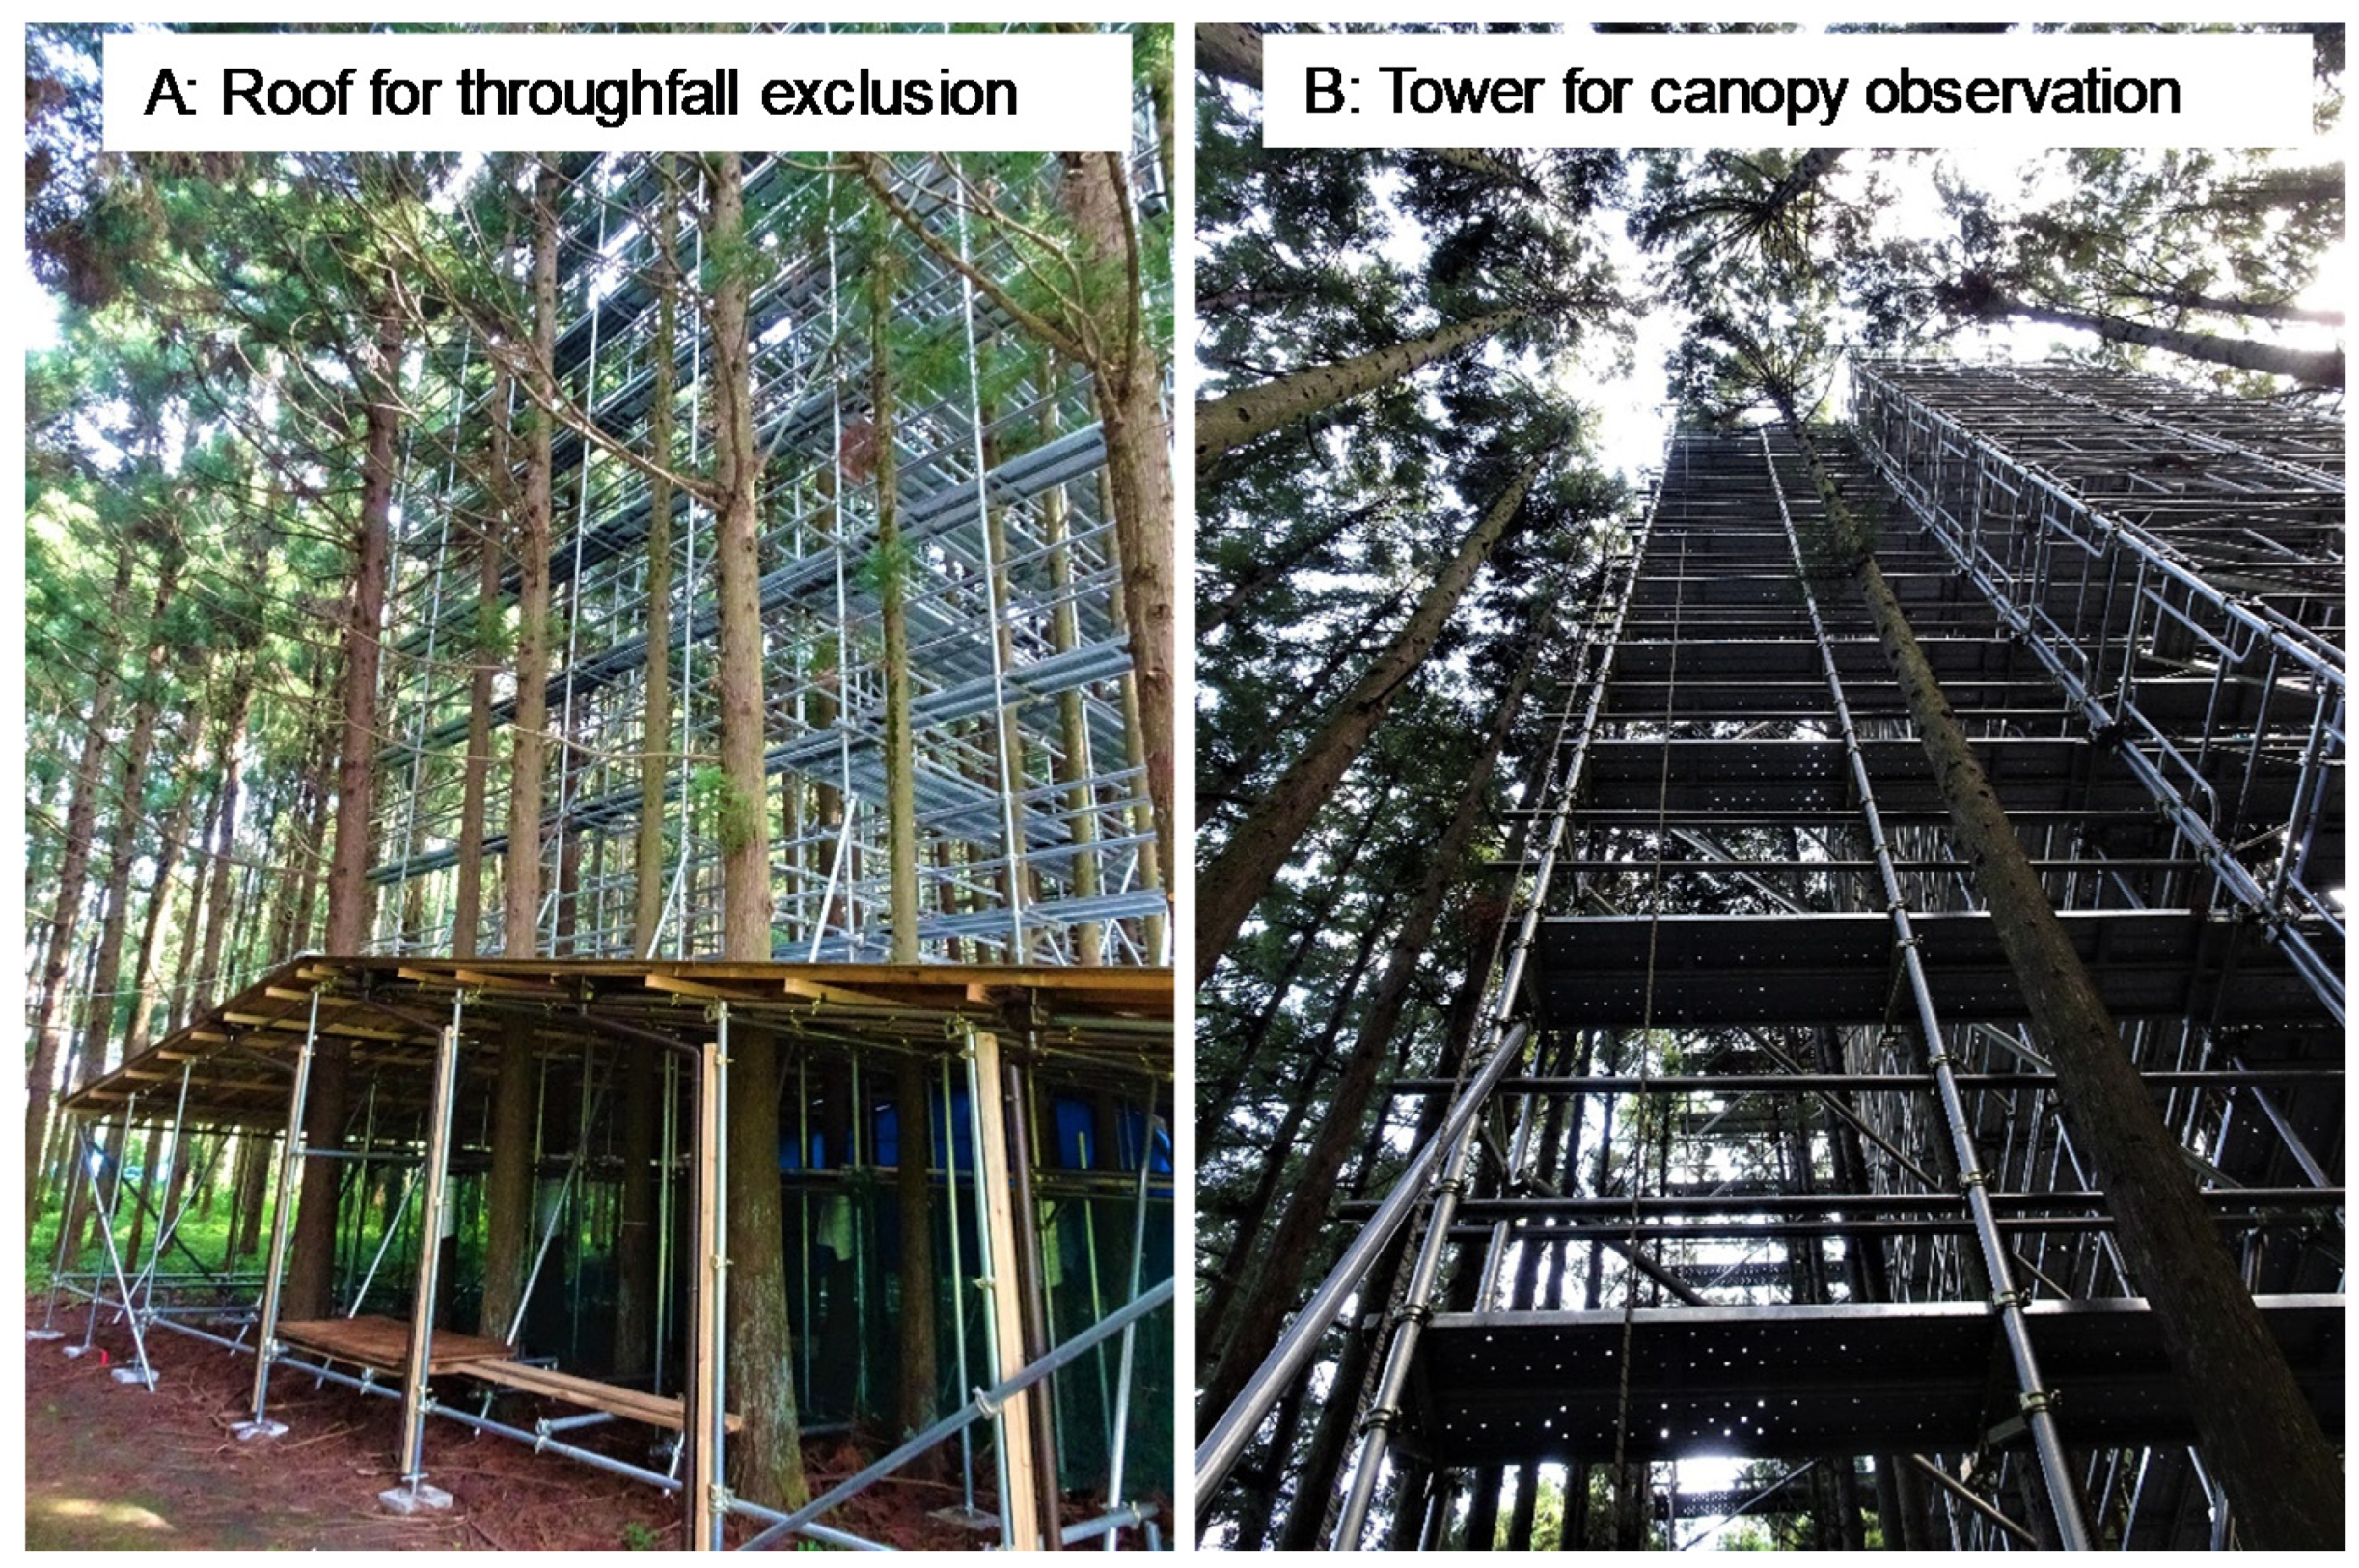
2.2. Plot Establishment and Throughfall Exclusion

Our target stand was established for testing wood quality in a clone (Kuji-18). Therefore, a flat site was selected with uniform soil conditions. The soil was a moderately moist brown forest soil with good drainage [51]. The field capacity and wilting point of the soil were approximately pF1.5 (−0.003 MPa) and pF4.2 (−1.5 MPa), respectively.
We first established a 20 × 10 m study plot within the stand (Figure 1). In late May 2018, we began excluding throughfall by constructing a roof under the canopy over half of the plot (10 × 10 m, “drought plot” hereafter), following work at the individual tree level conducted in a mature temperate forest in Basel, Switzerland [39,40] (Figure 1). The roof was constructed using corrugated sheets with gutters to eliminate throughfall. Stem flow was excluded by sealing the gap between the roof and tree stems using a nontoxic silicone sealant (Cemedine, Tokyo, Japan).
We trenched the exterior of the drought plot and backfilled it with plastic paneling to a depth of 30 cm to exclude surface soil water flow. Fine root distribution and soil thickness were similar between the plots; approximately 80% of fine roots (<1 mm in diameter) were distributed at soil depths of up to 40 cm (Sakata and Tsurita, unpublished data). Given the density of the fine roots at shallow depths, we trenched to 30 cm to reduce water absorption. To avoid negative effects from damage to the root systems during construction, we excluded the trees nearest the plot boundary from the study. In addition, we measured the maximum photosynthetic rate at light saturation (Pmax), stomatal conductance (gs), and shoot elongation between the plot boundary and interior trees in 2019; no significant differences were found (Inoue et al., unpublished data, n = 3, p > 0.05, t-test). Before beginning the drought treatment, we compared foliar ecophysiological traits such as nitrogen concentration, Pmax, gs, and A-Ci parameters from February to September 2017 between the control and drought plots (n = 5, p > 0.05, t-test, [52]), and we found no differences in these parameters. Therefore, we took an individual-tree approach between the treatment and control plots, as have previous studies in mature forest stands [39,40], given that individuals in both plots had highly similar photosynthetic traits prior to the drought treatment [52]. The average foliar nitrogen concentration in Japanese cedar plantations was reported as 1.38% (n = 2,116; range: 0.50–4.43%, [18]), similar to our study trees (1.15%, n = 130; range: 0.89–1.51%). This similarity indicates that soil nutrient conditions in the study plots are representative of typical planation conditions in terms of nitrogen [17,18,19,40].
Soil water potential was recorded at 20 min intervals at three depths (10, 40, and 80 cm) using sensors (MPS-6, Decagon Devices, Pullman, WA, USA) over three growing seasons. Three sensors were deployed at each depth in the center of each plot. The average soil water potential values from the three replicates were then obtained for each plot, and no sensor malfunctions occurred during the study period.

2.3. Foliar Ecophysiological Measurements

To estimate Vcmax and the maximum rate of photosynthetic electron transport (Jmax) in current-year shoots in the upper canopy, the A-Ci curve (A = net carbon dioxide [CO2] assimilation rate; Ci = calculated intercellular CO2 concentration) was measured using a portable photosynthesis meter (LI-6400XT Portable Photosynthesis System; LI-COR, Inc. Lincoln, NE, USA) with a conifer chamber (6400–22L Opaque Conifer Chamber; LI-COR, Inc.). The light and temperature inside the chamber were maintained at the saturating light intensity of 1500 µmol m−2 s−1 and 25 °C, respectively, using an LED light source and an air conditioner built into the LI-6400-22L. The CO2 concentration inside the cuvette in the chamber was varied using the following order, in most cases: 400, 200, 100, 50, 400, 700, 1500, and 2000 ppm. One or two current-year shoots were selected from each of three to five selected trees for measurements. We considered current-year shoots as the part of the shoot less than 1 year old, which can be readily determined from the shoot nodes in Japanese cedar [19]. Only current-year shoots were placed in the cuvette in the conifer chamber. The average leaf area in the cuvette was 16.2 ± 0.5 cm2. In our study area, new shoots emerge from late April to May and mature after June [52]. Thus, all spring measurements used current-year shoots that had emerged during the spring prior, and summer measurements used shoots that had emerged in the spring of that year. We also measured the dark respiration rate (Rd) at 25 °C in the spring (April), summer (August), and autumn (October) of 2019 and 2020, from 8:00 AM to 12:00 PM. The A-Ci curves were assessed using the mechanistic model of CO2 assimilation proposed by Farquhar et al. [53]. Using the A-Ci curve, Vcmax and Jmax were estimated using nonlinear regression techniques in the software KaleidaGraph ver. 3.52 [54,55].
We measured Pmax and gs from 8:00 to 11:00 AM using the LI-6400, with a consistent light intensity of 1500 µmol m−2 s−1 and temperature of 25 °C. We repeated these measurements in the afternoon (1:00–3:00 PM, JST) on the same shoot. All measurements were conducted on sunny days. The CO2 concentration in the leaf chamber was maintained at 400 ppm and the humidity was maintained at 50%–60%. We captured gas exchange data when the coefficient of variation (CV) was less than 0.2%. Then, we calculated the intrinsic water use efficiency (WUEi, Pmax/gs) using these measurements.

2.4. Foliar area and Nitrogen Measurements

Following ecophysiological measurements, we carefully cut the leaf tissue, i.e., needles, from inside the cuvette to calculate leaf area using a laser scanner. Only needles that had been carefully separated from the shoot were used. The relationship between the projected area estimated by the laser scanner (As) and the projected needle area (An) in the study trees (An = 1.536 × As + 0.79, r2 = 0.97, p < 0.0001, [56]) was used in further analyses. Then, we calculated LMA for each shoot based on An and the needle dry weight. The dry weight was measured after 3 days, when the weight reached equilibrium, in an oven at 60 °C. The leaf area (Narea) and mass-based (Nmass) nitrogen concentrations were determined using a Sumigraph NC-900 analyzer (Sumika Chemical Analysis Service, Tokyo, Japan, [32,34]). The dry foliar samples were ground with a mill (MM400; Retsch GmbH, Haan, Germany) and approximately 10 mg was used for each foliar estimate. Pmax and gs were measured in spring (May 2019, April 2020), summer (June and August 2019, August 2020), and autumn (October and November 2019, October 2020), respectively. All gas exchange measurements were taken from the top of the sun-exposed canopy with the needles attached condition, from an observation tower at a height of approximately 20 m (Figure 1).

2.5. Statistical Analyses

We made a linear mixed model (LMM) to test the effect of treatment and sampling season for Vcmax, Jmax, Rd, Nmass, Narea, and LMA [54]. For Pmax, gs, and WUEi, we added time of day as an explanatory variable. Tree identity was included as a random effect in all models. Type III tests were performed to evaluate the fixed effects (Wald-type test) [57]. To identify factors influencing the variation in Pmax, we used multiple regression analyses with Pmax as the dependent variable and gs, LMA, and Nmass as explanatory variables. These models were built separately for each treatment and time of day. All analyses were conducted using SPSS for Windows software ver. 23.0 (IBM Corp., Armonk, NY, USA).

3. Results

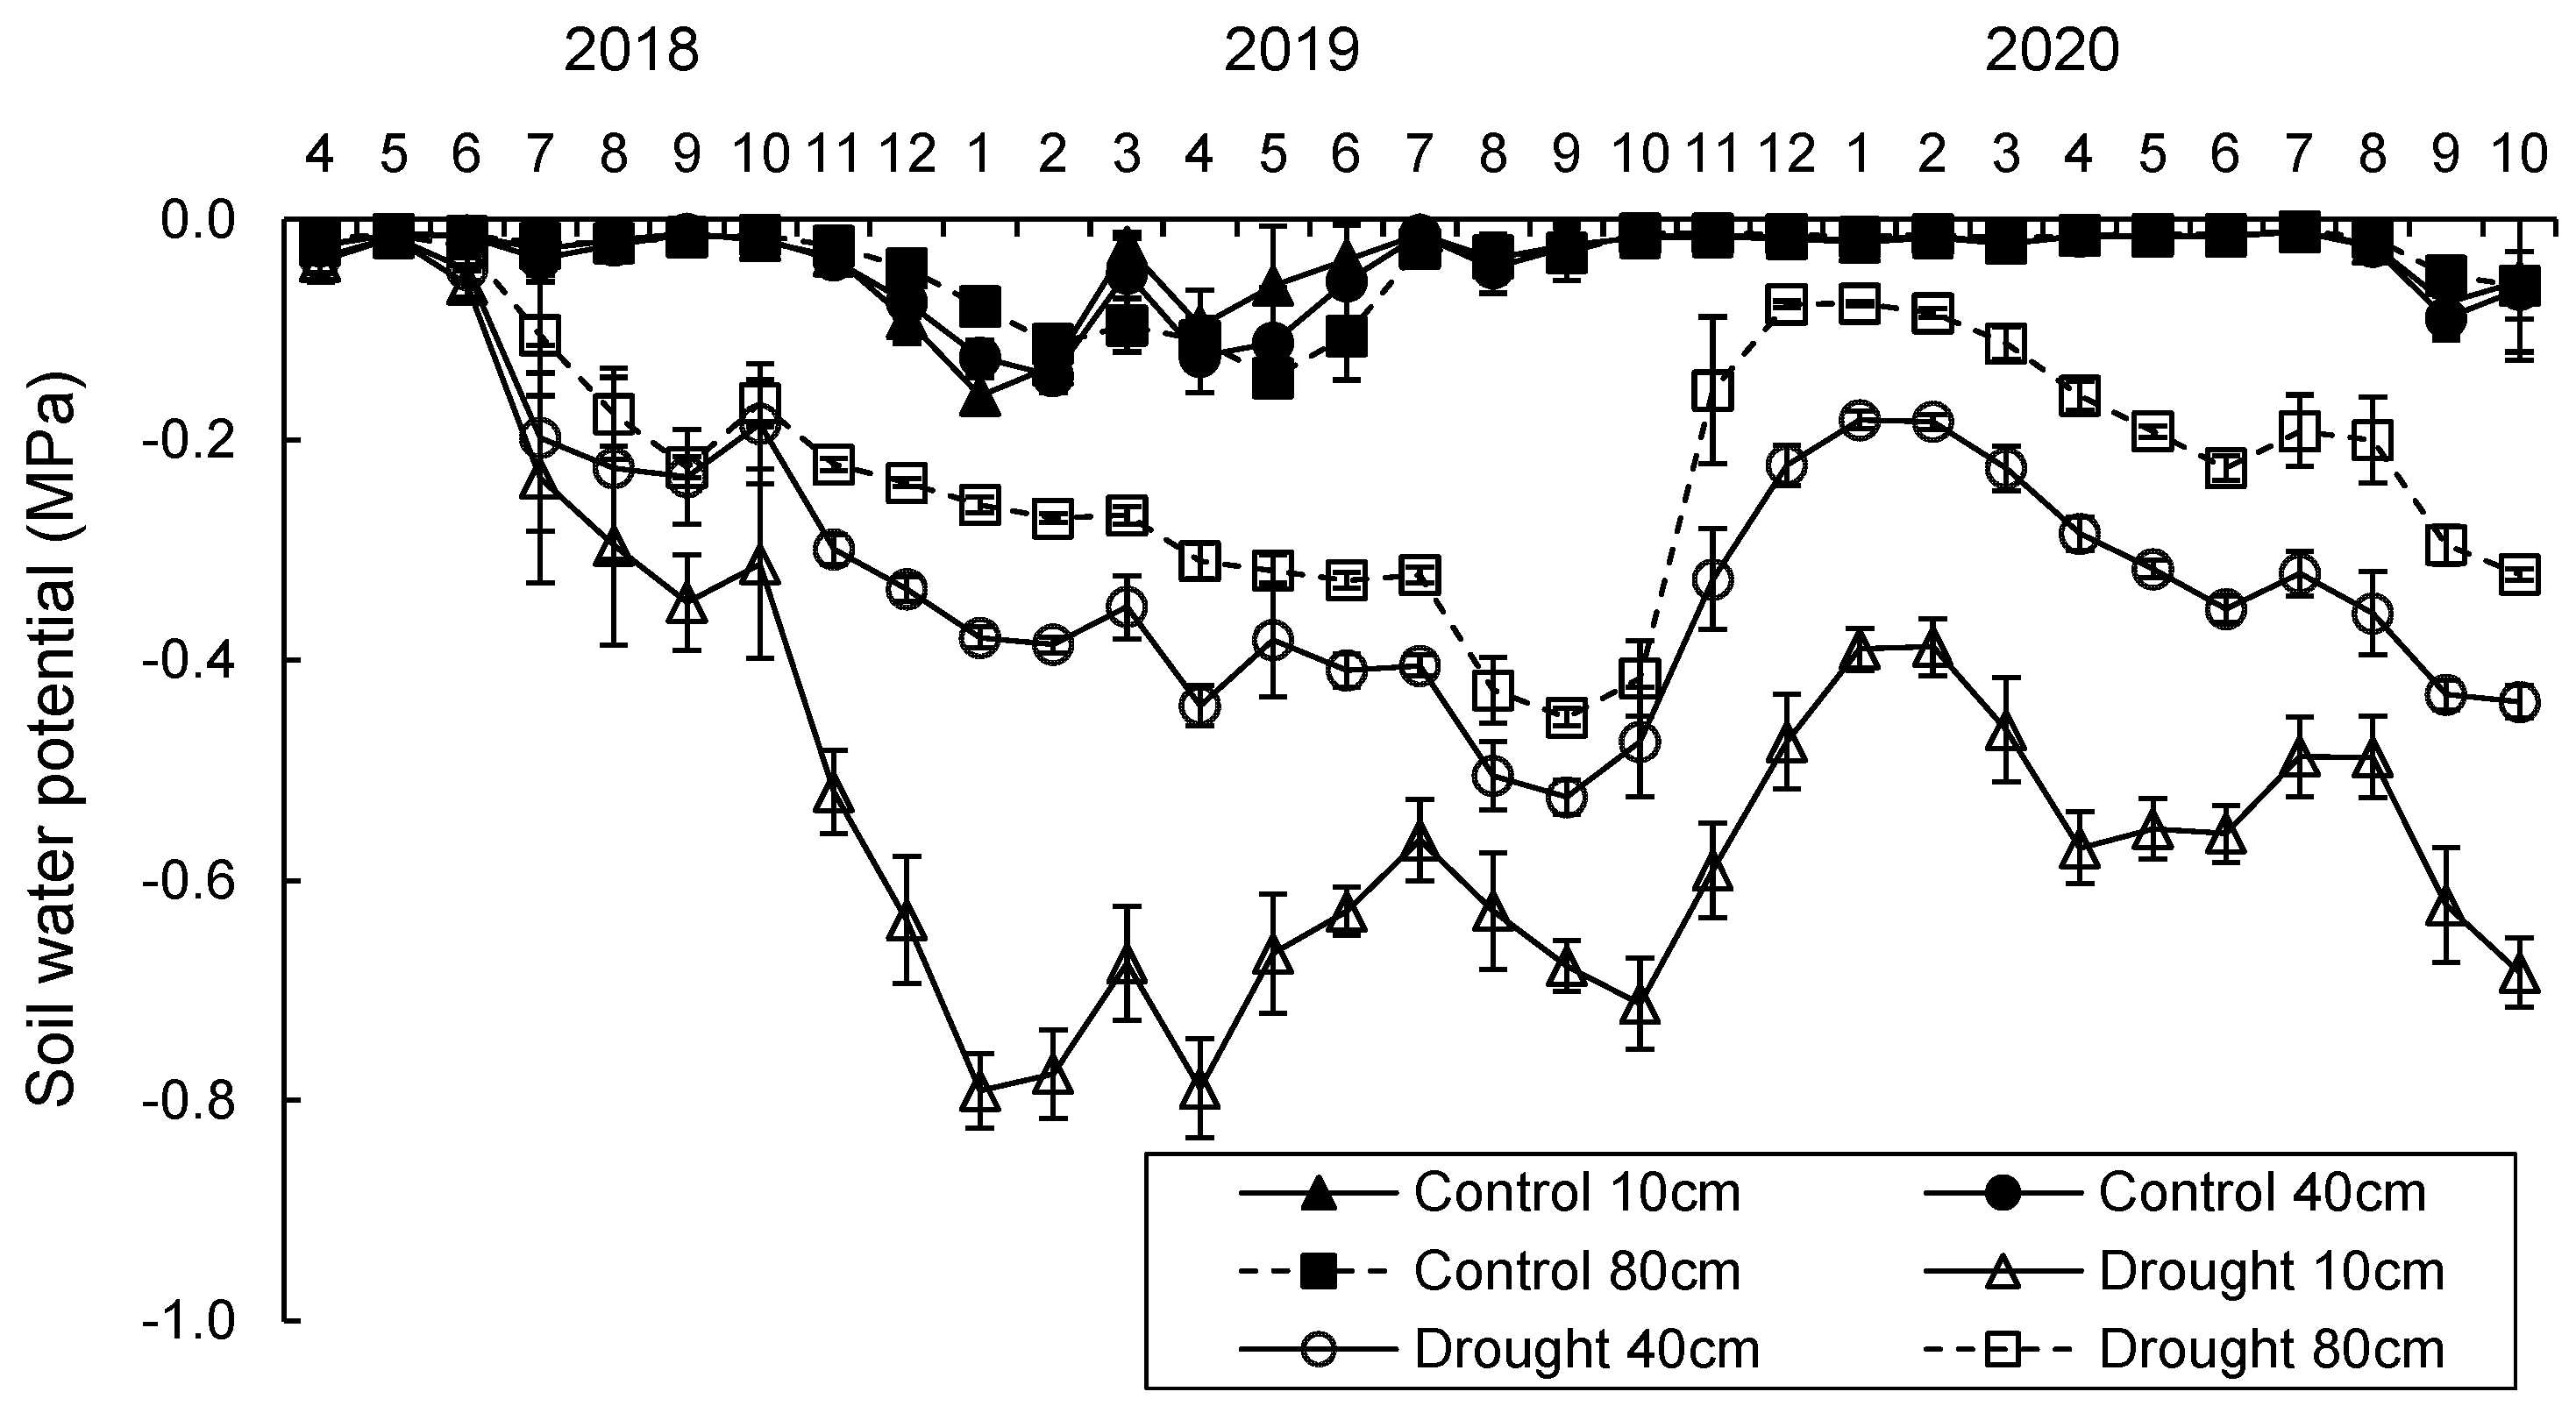
3.1. Temperature, Precipitation, and Soil Water Potential

Seasonal variations in temperature and precipitation were similar throughout the study period (2019–2020) (Figure 2). The highest temperatures occurred in July to September, with maximums of 25–30 °C (Figure 2A). Monthly precipitation was lowest in winter (December–February) and summer (August) and highest in the rainy season (June to July) and autumn (October) (Figure 2B).
The soil water potential in the drought plot declined following the onset of throughfall exclusion in May 2018 and was significantly lower than that of the control plot (Figure 3). Shallow soil layers were drier than the deeper layers. We observed a seasonal trend between 2019 and 2020, and the soil was driest during August and September. The maximum differences in soil water potential between the drought and control plot were −0.5 to −0.7 MPa at a depth of 10 cm during the summer (Figure 3). The soil water potential at the surface layer (10 cm in depth) following rain events (>10 mm per day) increased to 61.7 ± 7.1% in the control plot relative to before rainfall (t-test, p < 0.0001, n = 10), whereas differences of <1% were observed in the drought plot during the same period (t-test, 0.8 ± 0.5%, p > 0.05, n = 10). This comparison was repeated 10 times over the study period to ensure the roof was satisfactory. Based on these findings, we estimated that the vast majority of throughfall was successfully excluded.

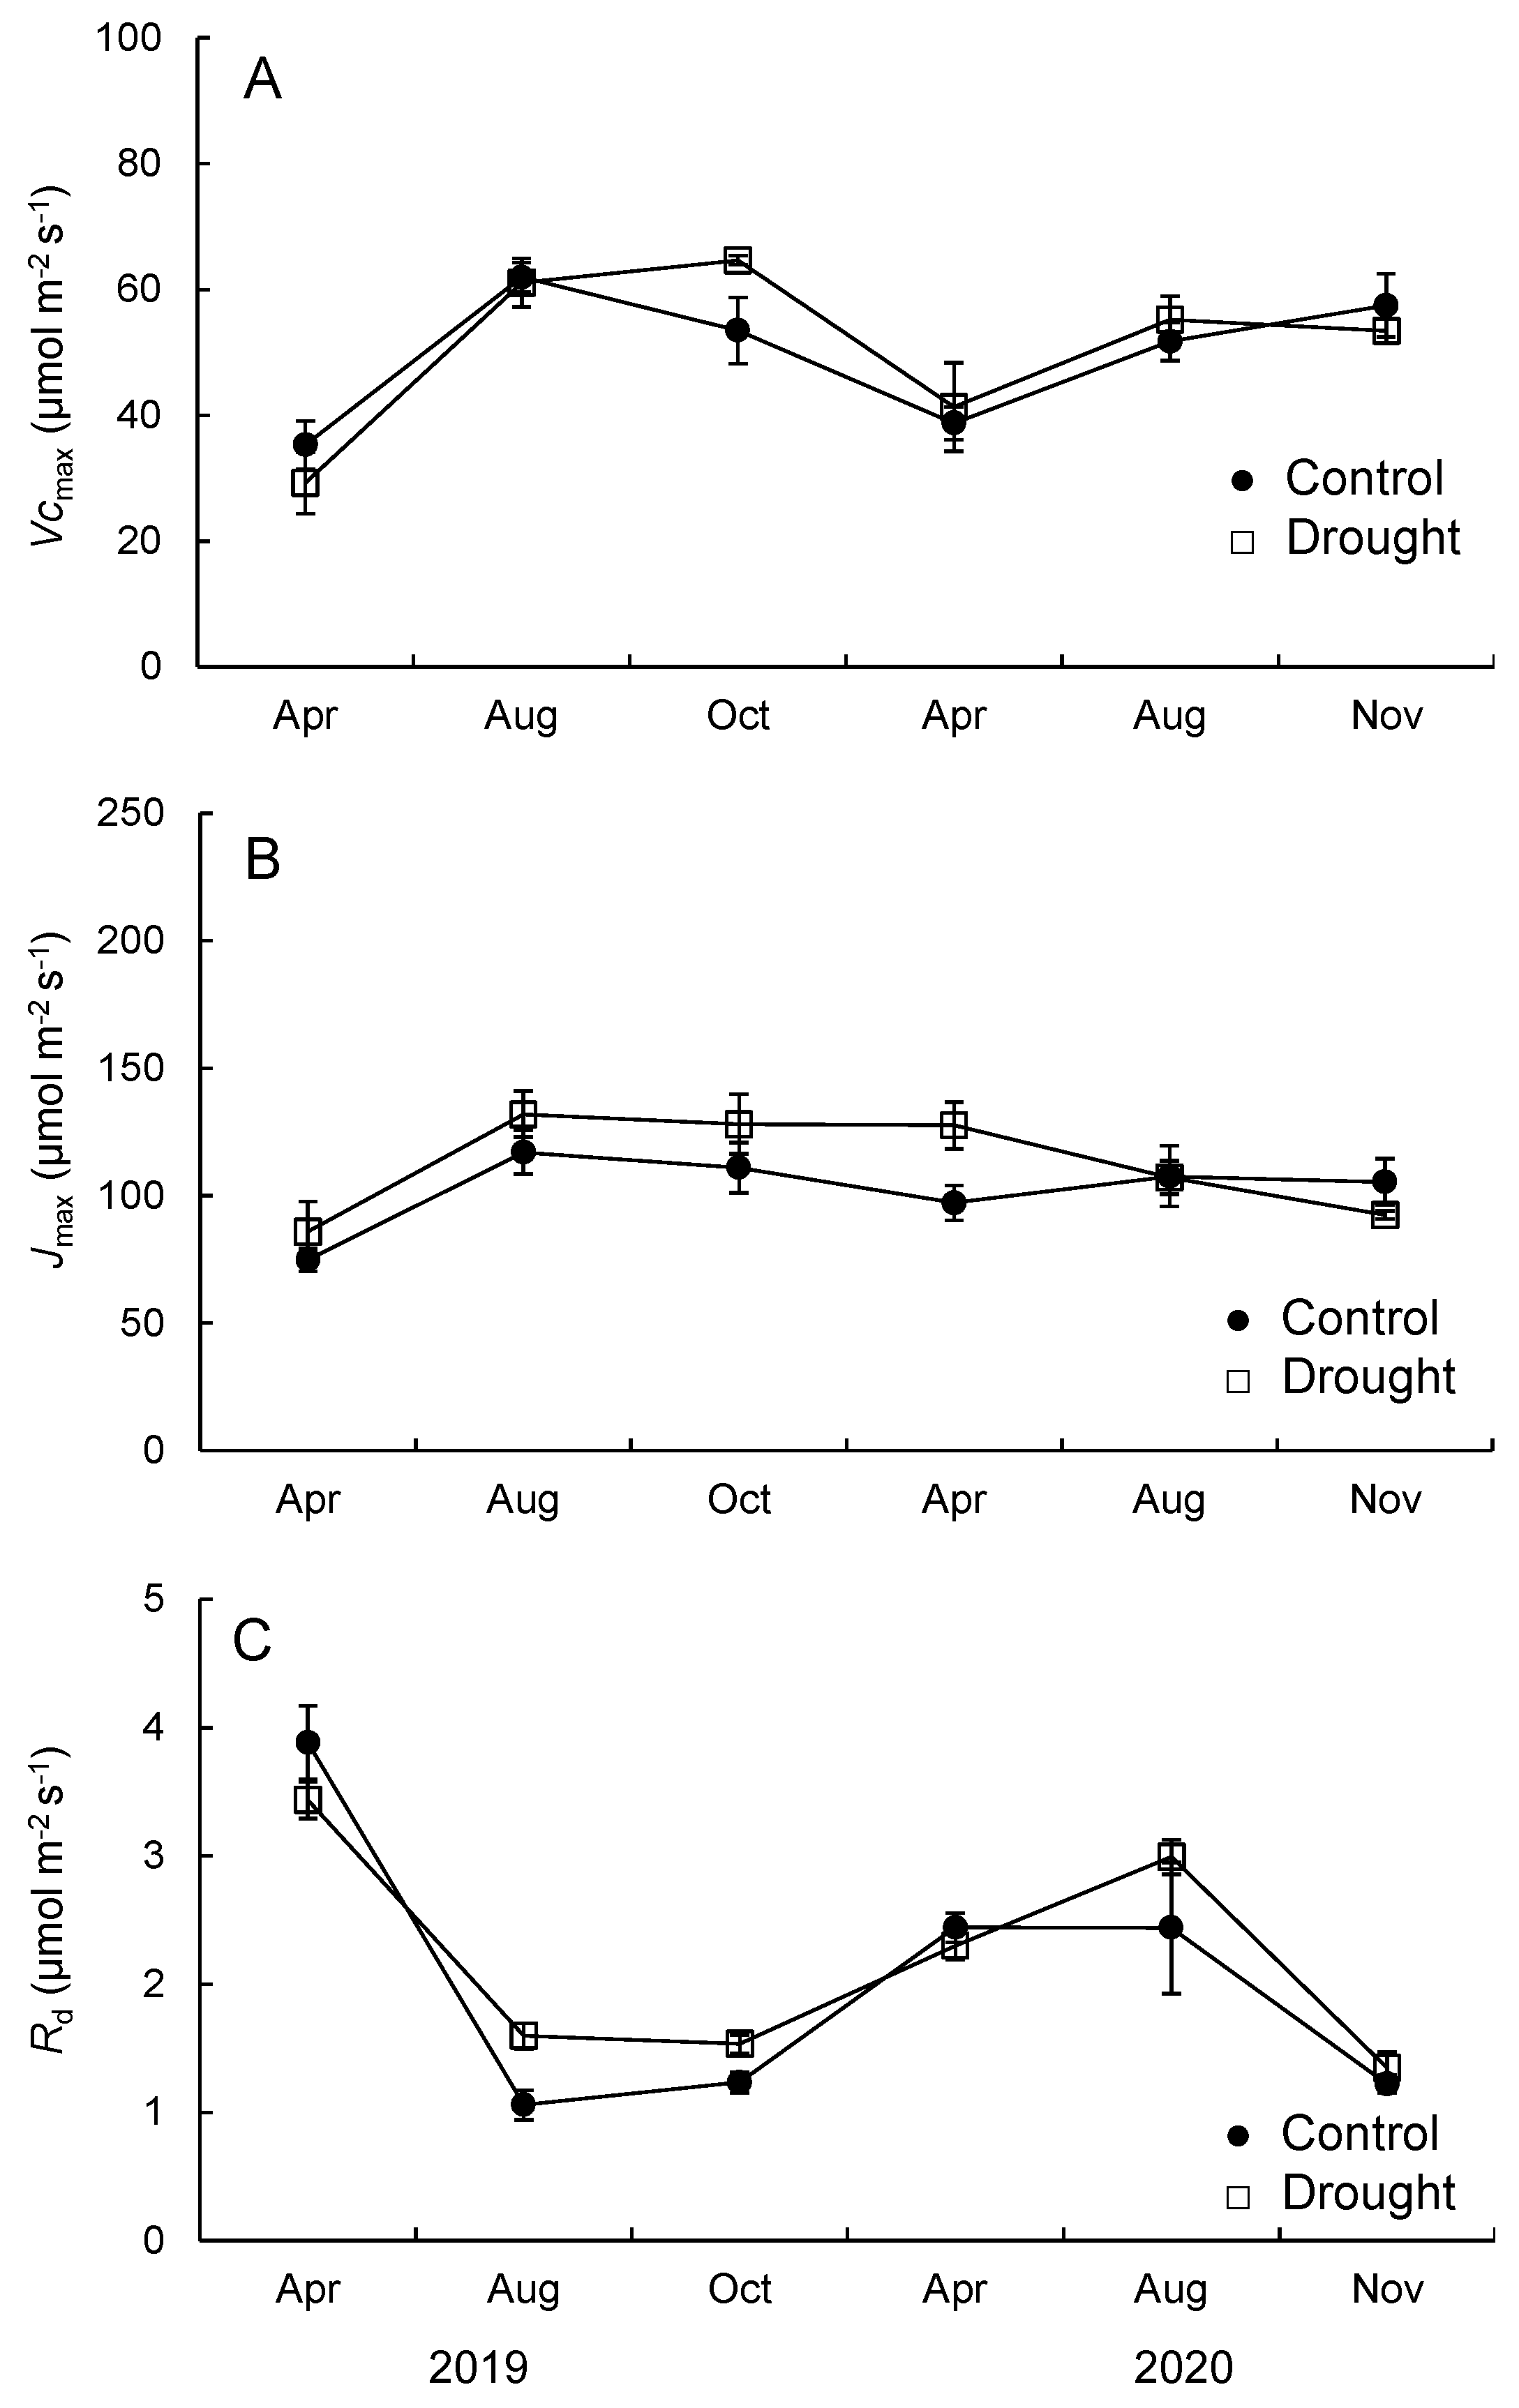
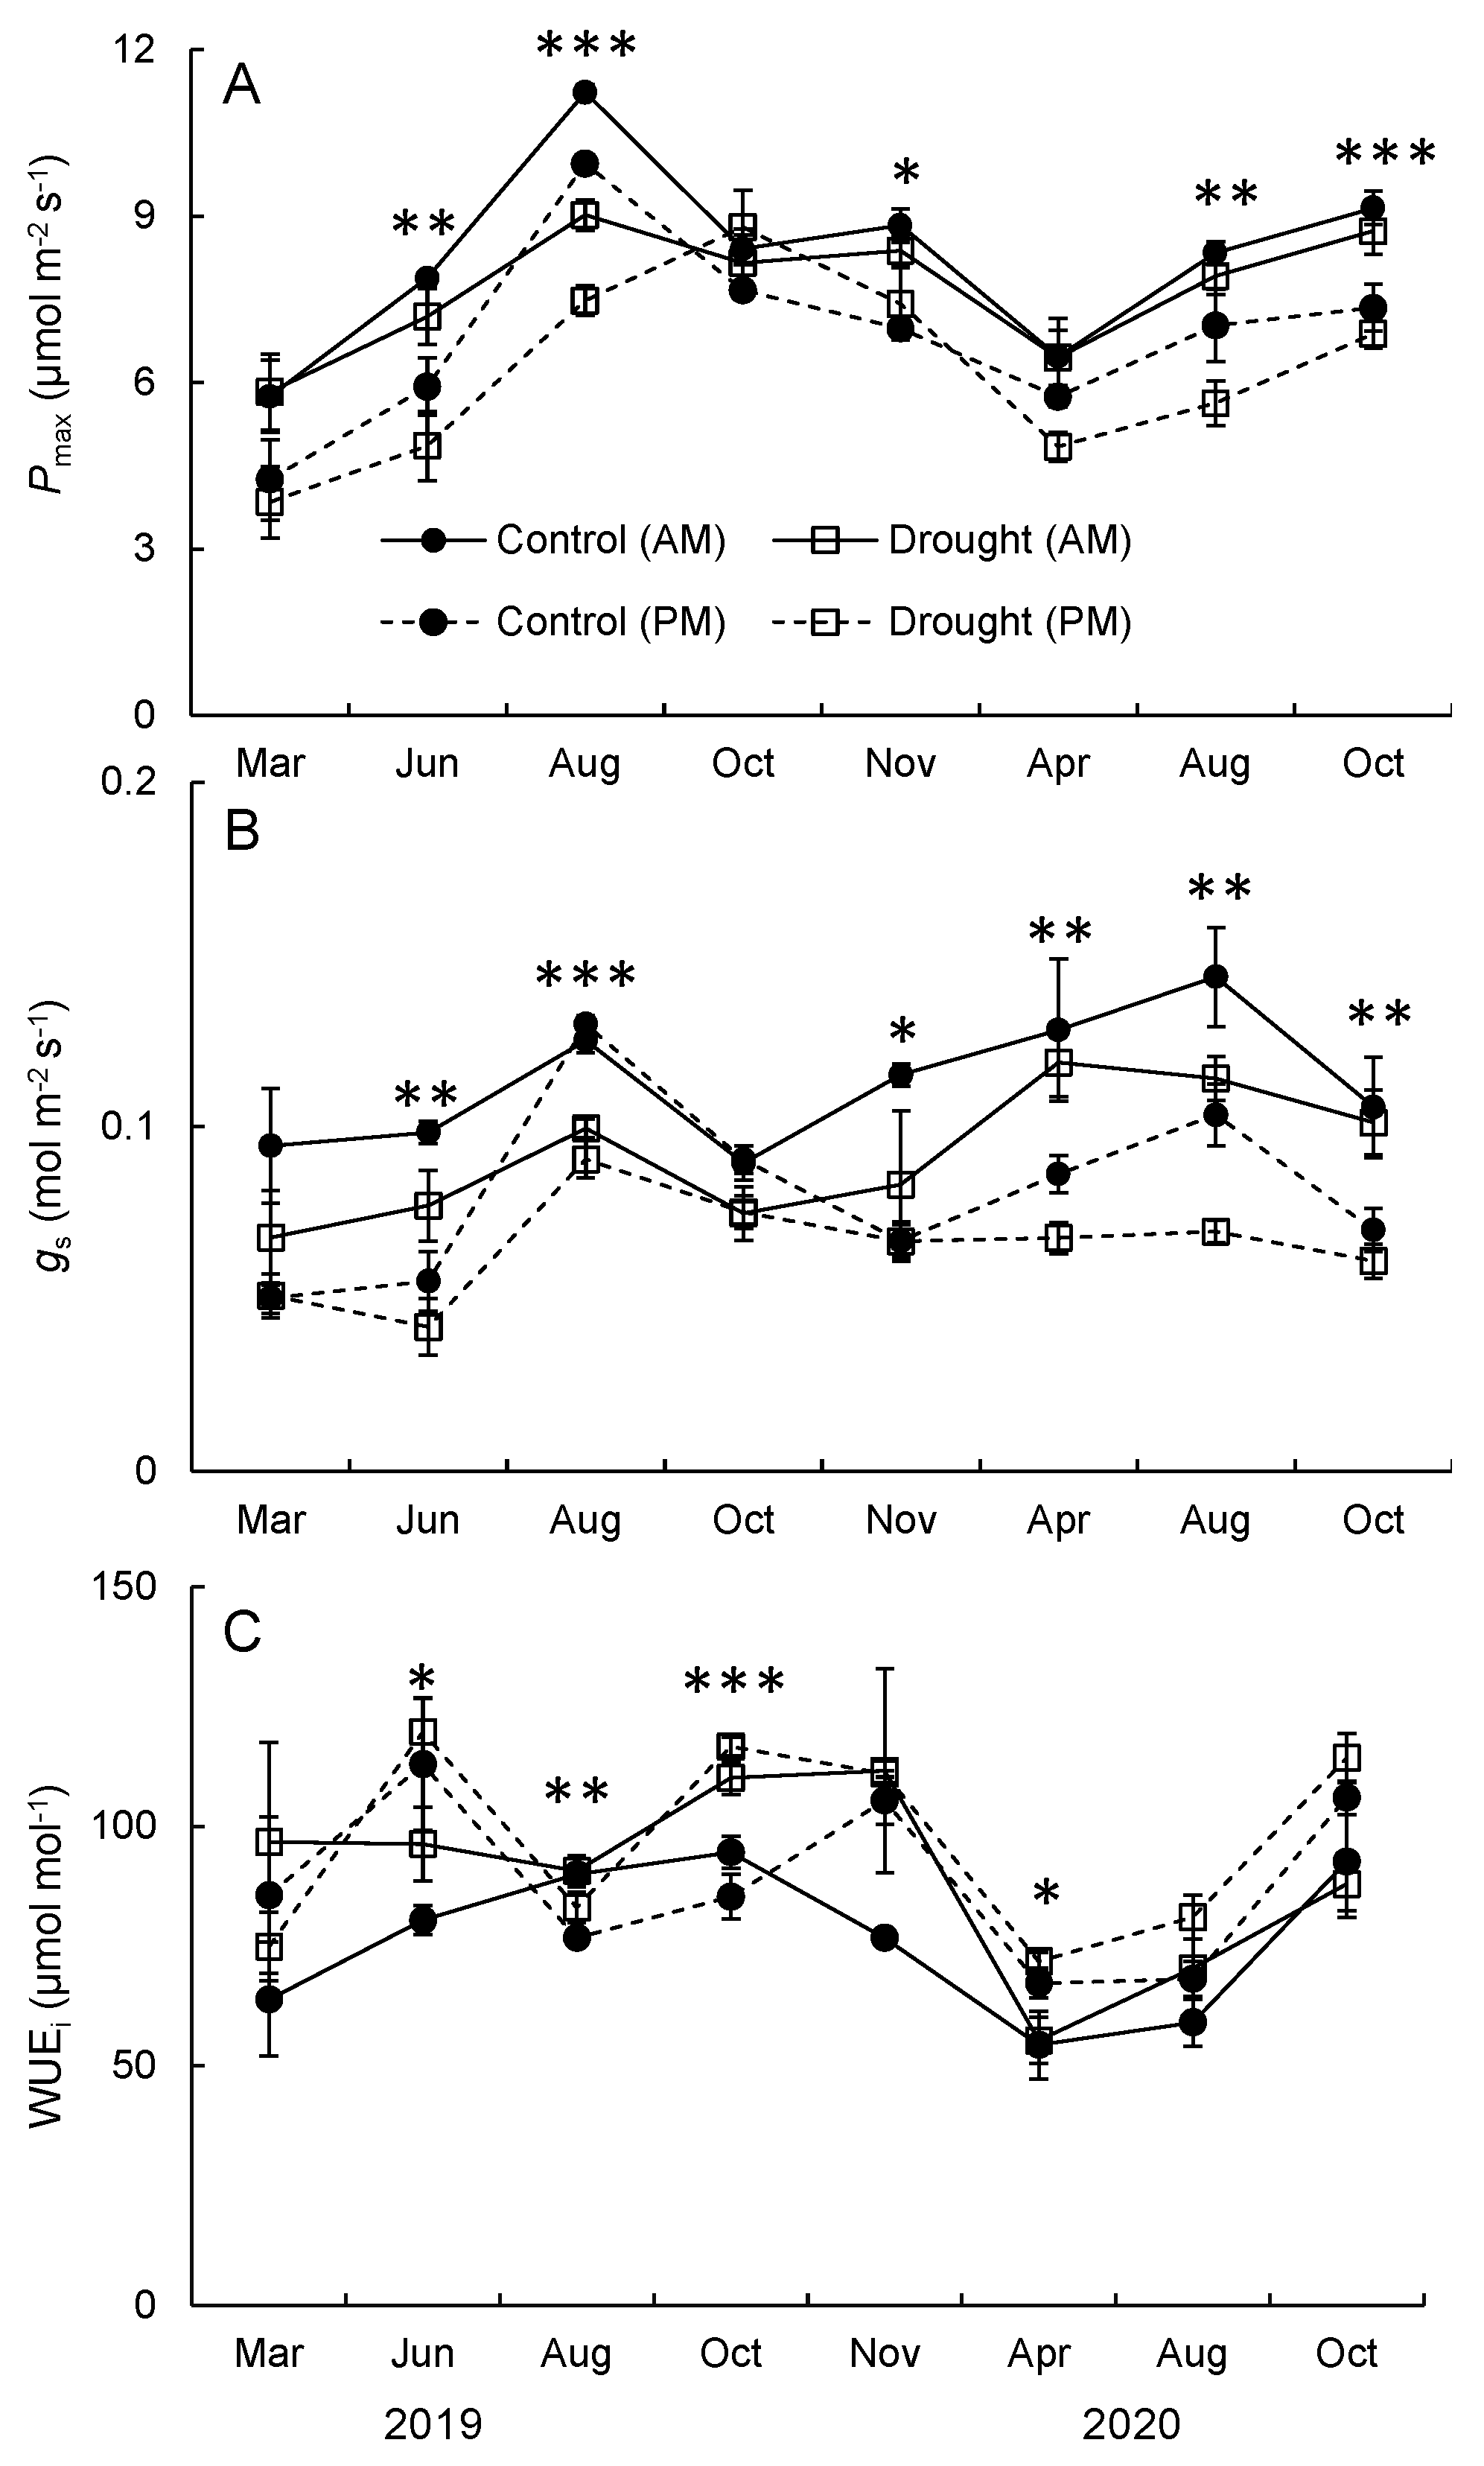
3.2. Photosynthetic Capacity, Stomatal Conductance, and Water Use Efficiency

Statistical analyses indicated significant seasonal changes in Vcmax (Type III test, p < 0.05, Table 1). Vcmax was lowest in April (Figure 4A), but we found no difference between the two plots. We found no differences in Jmax across seasons or between plots (Figure 4B, Table 1). There was evidence of a seasonal variation in Rd, but no difference between the plots (Figure 4C, Table 1).
There was a significant seasonal variation in Pmax (Type III test, p < 0.05, Figure 5A, Table 2). Pmax was higher in August and October than in March or April. Pmax was significantly lower in the drought plot relative to the control (Figure 5A, Table 2). We also found a variation in time of day, where Pmax tended to be lower in the afternoon (Figure 5A, Table 2).
There were significant seasonal changes in gs, which were similar to those in Pmax (Type III test, p < 0.05, Table 2). We also found differences between the two plots and in time of day (Table 2); gs was lower in the drought plot and in the afternoon (Figure 5B). WUEi varied significantly among seasons and was low in spring and summer and high in autumn (Figure 5C, Table 2). In addition, WUEi was higher in the drought plot and in the afternoon relative to the control and the morning measurement period (Figure 5C, Table 2).

3.3. LMA and Nitrogen Content

Seasonal changes in LMA were found and increased from summer (August) to the next spring (April) (Figure 6A, Table 1). However, we found no significant difference in LMA between the two plots. Narea showed a similar pattern to LMA and also did not differ between plots (Figure 6B, Table 1), nor did Nmass. However, both Narea and Nmass varied significantly among seasons (Figure 6C, Table 1).

3.4. Foliar Traits and Pmax

Generally, gs was significantly positively related to Pmax, excluding in the control plot in the morning. By contrast, LMA had a significant negative effect on Pmax in all models (Table 3). In the afternoon, gs had a stronger relationship than did LMA with Pmax. Nmass had little effect on Pmax in all models (Table 3).

4. Discussion

4.1. Photosynthetic Capacity and Dark Respiration Rate

Unlike our prediction, the photosynthetic capacity, as assessed by Vcmax and Jmax, was affected little by drought in mature Japanese cedar. Similar findings of low sensitivities to drought, again in terms of Vcmax and Jmax, have been reported in tropical broadleaf trees and conifers, including Pinus and Juniper, as a result of long-term throughfall experiments [15,46,58], but we note that Quercus ilex showed a significant reduction in these parameters in the Mediterranean area [7]. Although the reasons for these differences remain to be clarified, species-specific responses in foliar nutrients, such as nitrogen, and stomatal regulation may be a driving factor in regulating photosynthesis. Generally, Vcmax is positively correlated with foliar nitrogen concentration [59,60,61,62], and we found a positive relationship between Vcmax and Nmass (regression analysis, r2 = 0.15, p < 0.01). Similar Nmass and Narea values between the two plots are consistent with a stable Vcmax in the present study. Generally, Jmax shows a positive correlation with foliar phosphorus concentration, because it depends on phosphate regeneration [63]. The limited variation we saw in Jmax in this study could be related to stable phosphorus concentrations under drought conditions, but we note that we did not directly measure phosphorus.
Japanese cedar may be insensitive to changes in respiration under soil drought. Previous studies have reported interspecies variations in the response of Rd to soil drought, with both increases and decreases, even within the same stand [46,64]. Our results are consistent with a previous study that found that mature Pinus massoniana showed little change in Rd during throughfall exclusion [58]. Foliar Rd tends to increase in species with low drought tolerance, and changes in respiration may be associated with changes in leaf physiological functions, particularly photosynthesis [46,64,65]. In our study, foliar photosynthetic capacity and nitrogen concentration, both of which are strongly associated with physiological functions, did not vary under drought conditions, which may explain why we observed little sensitivity in Rd. Seedlings of Japanese cedar also show low sensitivity in their respiration rate under drought conditions [36,37].

4.2. Effects of Leaf Morphology and Nitrogen Concentration

The lack of response observed in LMA under throughfall exclusion indicates that Japanese cedar may be able to adjust to drought without major changes to their foliar morphology, although this outcome is different from our hypothesis. Typically, LMA increases under severe drought stress [29,66,67,68], and Japanese cedar may exhibit a response in LMA at greater stress than what was induced in our study. Furthermore, increased LMA with increasing tree height has been reported in very tall Japanese cedar, particularly those of 50 m in height, which is related to hydraulic limitations, causing greater drought stress [69]. Generally, increased LMA is believed to enhance drought tolerance by withstanding low water potential through physical strengthening of the leaf structure [29,30,67]. By contrast, very high LMA may be related to a reduction in Pmax, due to the increase in leaf mesophyll CO2 conductance [6,33,34,35]. In fact, a negative correlation has been found between LMA and Pmax in several conifers, including Picea abies and Pinus sylvestris [70]. We also found a negative correlation between these two parameters (r2 = 0.24, p < 0.0001), and we suggest that Pmax may have decreased due to an increase in mesophyll conductance. Alternatively, the similar LMA values observed between the control and drought plots may reflect an avoidance of a reduction in Pmax, also due to mesophyll conductance [15].

4.3. Foliar Gas Exchange and Drought Response

Drought conditions caused a reduction in Pmax, via stomatal limitation in mature Japanese cedar in our study. This reduction was more pronounced in the afternoon due to more stressful conditions, such as a high vapor pressure deficit (VPD), relative to the morning. Trees tend to close their stomata, indicated by reduced gs and reduced water consumption, when subjected to soil drought and high VPD [64]. Due to stomatal closure, various conifers show a midday depression in photosynthesis and transpiration, particularly on sunny days [3,71,72], and these reductions have also been observed in Japanese cedar seedlings under drought conditions [22,24,73]. In addition, mature conifers and broadleaved trees, including Juniperus monosperma (Engelm.) Sarg., Pinus taeda L., and Quercus ilex L., show stomatal closure and an associated reduction in photosynthesis and transpiration during throughfall exclusion; our results are consistent with those findings [7,15,41,58]. The reduction of photosynthesis by stomatal regulation may also negatively influence productivity in Japanese cedar plantations, given that the frequency and intensity of drought events should increase with climate change progresses [6].
By contrast, decreasing gs limited transpiration, leading to an improvement in WUEi. This suggests that mature Japanese cedar could respond to prolonged soil drought by maintaining photosynthetic activity while reducing transpiration by closing the stomata. Many plant species show an acclimation to drought by an increase in WUEi [5,66,74]. Mature pines under long-term soil drought conditions have shown similar improvements in WUEi to what we have reported here [9,41,75].

5. Conclusions

Unlike our prediction, the photosynthetic capacity of mature Japanese cedar, as indicated by Vcmax and Jmax and foliar traits such as nitrogen concentration and LMA, did not respond to drought conditions induced using throughfall exclusion. Although a reduction in Pmax in the afternoon may negatively influence the productivity of Japanese cedar plantations, this may be mitigated by increased WUEi as trees adjust to drought conditions. We recommend that future studies focus on drought responses in biomass allocation to the canopy and/or roots at the individual tree level, as well as responses in water use traits such as osmotic adjustment. Assessing these parameters, in addition to those investigated here, will lead to a holistic understanding of the effects of drought on productivity and drought tolerance in Japanese cedar plantations. In addition, the obtained parameters also contribute to the accurate estimation of future forest productivity in Japanese cedar stands and carbon storage under drought by applying those parameters to process-based models.

Author Contributions

T.K. (Tanaka Kenzo), Y.I., M.G.A. and S.S. conceived, designed, analyzed and wrote the paper. T.K. (Tatsuro Kawasaki), S.K., T.T. and T.S. conducted the field survey and measured the parameters. All authors have read and agreed to the published version of the manuscript.

Funding

This study was supported by the project “Research on adaptation to climate change for agriculture, forestry and fisheries (No.16808214)” from the Ministry of Agriculture, Forestry and Fisheries.

Data Availability Statement

Not applicable.

Acknowledgments

We are grateful to Naoko Kano, Chiharu Migita and Kiyosada Kawai for helping our work. Thanks should also go to Anonymous reviewers for constructive comments.

Conflicts of Interest

The authors declare no conflict of interest.

References

  1. Allen, C.D.; Macalady, A.K.; Chenchouni, H.; Bachelet, D.; McDowell, N.; Vennetier, M.; Kitzberger, T.; Rigling, A.; Breshears, D.D.; Hogg, E.H.; et al. A global overview of drought and heat-induced tree mortality reveals emerging climate change risks for forests. For. Ecol. Manag. 2010, 259, 660–684. [Google Scholar] [CrossRef] [Green Version]
  2. Bhusal, N.; Lee, M.; Lee, H.; Adhikari, A.; Han, A.R.; Han, A.; Kim, H.S. Evaluation of morphological, physiological, and biochemical traits for assessing drought resistance in eleven tree species. Sci. Total Environ. 2021, 779, 146466. [Google Scholar] [CrossRef] [PubMed]
  3. Bhusal, N.; Lee, M.; Han, A.R.; Han, A.; Kim, H.S. Responses to drought stress in Prunus sargentii and Larix kaempferi seedlings using morphological and physiological parameters. For. Ecol. Manag. 2020, 465, 118099. [Google Scholar] [CrossRef]
  4. Matsumoto, Y.; Shigenaga, H.; Miura, S.; Nagakura, J.; Taoda, H. Mapping of Japanese cedar (Cryptomeria japonica) forests vulnerable to global warming in Japan. Glob. Environ. Res. 2006, 10, 181–188. [Google Scholar]
  5. Lambers, H.; Chapin, F.S., III; Pons, T.L. Plant Physiological Ecology; Springer: New York, NY, USA, 1998. [Google Scholar]
  6. Niinemets, Ü. Responses of forest trees to single and multiple environmental stresses from seedlings to mature plants: Past stress history, stress interactions, tolerance and acclimation. For. Ecol. Manag. 2010, 260, 1623–1639. [Google Scholar] [CrossRef]
  7. Misson, L.; Limousin, J.M.; Rodriguez, R.; Letts, M.G. Leaf physiological responses to extreme droughts in Mediterranean Quercus ilex forest. Plant Cell Environ. 2010, 33, 1898–1910. [Google Scholar] [CrossRef] [PubMed]
  8. Xu, N.; Guo, W.; Liu, J.; Du, N.; Wang, R. Increased nitrogen deposition alleviated the adverse effects of drought stress on Quercus variabilis and Quercus mongolica seedlings. Acta Physiol. Plant. 2015, 37, 107. [Google Scholar] [CrossRef]
  9. Maggard, A.O.; Will, R.E.; Wilson, D.S.; Meek, C.R.; Vogel, J.G. Fertilization reduced stomatal conductance but not photosynthesis of Pinus taeda which compensated for lower water availability in regards to growth. For. Ecol. Manag. 2016, 381, 37–47. [Google Scholar] [CrossRef] [Green Version]
  10. Ogaya, R.; Peñuelas, J. Comparative field study of Quercus ilex and Phillyrea latifolia: Photosynthetic response to experimental drought conditions. Environ. Exp. Bot. 2003, 50, 137–148. [Google Scholar] [CrossRef]
  11. Ambrose, A.R.; Baxter, W.L.; Wong, C.S.; Næsborg, R.R.; Williams, C.B.; Dawson, T.E. Contrasting drought-response strategies in California redwoods. Tree Physiol. 2015, 35, 453–469. [Google Scholar] [CrossRef] [Green Version]
  12. Inoue, Y.; Ichie, T.; Kenzo, T.; Yoneyama, A.; Kumagai, T.O.; Nakashizuka, T. Effects of rainfall exclusion on leaf gas exchange traits and osmotic adjustment in mature canopy trees of Dryobalanops aromatica (Dipterocarpaceae) in a Malaysian tropical rain forest. Tree Physiol. 2017, 37, 1301–1311. [Google Scholar] [CrossRef] [PubMed] [Green Version]
  13. Nepstad, D.C.; Moutinho, P.; Dias-Filho, M.B.; Davidson, E.; Cardinot, G.; Markewitz, D.; Schwalbe, K. The effects of partial throughfall exclusion on canopy processes, aboveground production, and biogeochemistry of an Amazon forest. J. Geophys. Res. Atmos. 2002, 107, LBA-53. [Google Scholar] [CrossRef] [Green Version]
  14. Duan, H.; O’Grady, A.P.; Duursma, R.A.; Choat, B.; Huang, G.; Smith, R.A.; Jiang, Y.; Tissue, D.T. Drought responses of two gymnosperm species with contrasting stomatal regulation strategies under elevated [CO2] and temperature. Tree Physiol. 2015, 35, 756–770. [Google Scholar] [CrossRef] [Green Version]
  15. Limousin, J.M.; Bickford, C.P.; Dickman, L.T.; Pangle, R.E.; Hudson, P.J.; Boutz, A.L.; Gehres, N.; Osuna, J.L.; Pockman, W.T.; McDowell, N.G. Regulation and acclimation of leaf gas exchange in a piñon–juniper woodland exposed to three different precipitation regimes. Plant Cell Environ. 2013, 36, 1812–1825. [Google Scholar] [CrossRef] [PubMed] [Green Version]
  16. Kenzo, T.; Ichie, T.; Watanabe, Y.; Yoneda, R.; Ninomiya, I.; Koike, T. Changes in photosynthesis and leaf characteristics with tree height in five dipterocarp species in a tropical rain forest. Tree Physiol. 2006, 26, 865–873. [Google Scholar] [CrossRef] [Green Version]
  17. Tange, T. Ecophysiological study on the growth of Cryptomeria japonica planted trees. Bull. Tokyo Univ. For. 1995, 93, 65–145. [Google Scholar]
  18. Osone, Y.; Hashimoto, S.; Kenzo, T.; Araki, M.G.; Inoue, Y.; Shichi, K.; Toriyama, J.; Yamashita, N.; Tsuruta, K.; Ishizuka, S.; et al. Plant trait database for Cryptomeria japonica and Chamaecyparis obtusa (SugiHinoki DB): Their physiology, morphology, anatomy and biochemistry. Ecol. Res. 2020, 35, 274–275. [Google Scholar] [CrossRef]
  19. Sakaguchi, K. All of the Sugi (Cryptomeria japonica); Zenrinkyo: Tokyo, Japan, 1983. (In Japanese) [Google Scholar]
  20. Suzuki, E.; Tsukahara, J. Age structure and regeneration of old growth Cryptomeria japonica forests on Yakushima Island. Bot. Mag. Tokyo 1987, 100, 223–241. [Google Scholar] [CrossRef]
  21. Tsumura, Y.; Uchiyama, K.; Moriguchi, Y.; Kimura, M.K.; Ueno, S.; Ujino-Ihara, T. Genetic differentiation and evolutionary adaptation in Cryptomeria japonica. Genes Genomes Genet. 2014, 4, 2389–2402. [Google Scholar] [CrossRef] [PubMed] [Green Version]
  22. Satoo, T. Drought resistance of some conifers at the first summer after their emergence. Bull. Tokyo Univ. For. 1956, 51, 1–108, (In Japanese with English summary). [Google Scholar]
  23. Negisi, K. Photosynthesis, respiration and growth in 1-year-old seedlings of Pinus densiflora, Cryptomeria japonica and Chamaecyparis obtusa. Bull. Tokyo Univ. For. 1996, 62, 1–115. [Google Scholar]
  24. Nagakura, J.; Shigenaga, H.; Akama, A.; Takahashi, M. Growth and transpiration of Japanese cedar (Cryptomeria japonica) and Hinoki cypress (Chamaecyparis obtusa) seedlings in response to soil water content. Tree Physiol. 2004, 24, 1203–1208. [Google Scholar] [CrossRef] [PubMed]
  25. Sakata, M. Evaluation of possible causes for the decline of Japanese cedar (Cryptomeria japonica) based on elemental composition and δ13C of needles. Environ. Sci. Technol. 1996, 30, 2376–2381. [Google Scholar] [CrossRef]
  26. Shigenaga, H.; Matsumoto, Y.; Taoda, H.; Takahashi, M. The potential effect of climate change on the transpiration of Sugi (Cryptomeria japonica D. Don) plantations in Japan. J. Agric. Meteorol. 2005, 60, 451–456. [Google Scholar] [CrossRef] [Green Version]
  27. Tange, T.; Someya, M.; Norisada, M.; Masumori, M. Photosynthetic limitation of similar-height Cryptomeria japonica trees growing at different rates. Photosynthetica 2013, 51, 158–160. [Google Scholar] [CrossRef]
  28. Tange, T.; Ge, F. Topographic factors and tree heights of aged Cryptomeria japonica plantations in the Boso Peninsula, Japan. Forests 2020, 11, 771. [Google Scholar] [CrossRef]
  29. Niinemets, Ü. Global-scale climatic controls of leaf dry mass per area, density, and thickness in trees and shrubs. Ecology 2001, 82, 453–469. [Google Scholar] [CrossRef]
  30. Ryan, M.G.; Phillips, N.; Bond, B.J. The hydraulic limitation hypothesis revisited. Plant Cell Environ. 2006, 29, 367–381. [Google Scholar] [CrossRef]
  31. Thomas, S.C. Photosynthetic capacity peaks at intermediate size in temperate deciduous trees. Tree Physiol. 2010, 30, 555–573. [Google Scholar] [CrossRef] [Green Version]
  32. Kenzo, T.; Inoue, Y.; Yoshimura, M.; Yamashita, M.; Tanaka-Oda, A.; Ichie, T. Height-related changes in leaf photosynthetic traits in diverse Bornean tropical rain forest trees. Oecologia 2015, 177, 191–202. [Google Scholar] [CrossRef]
  33. Ishii, H.T.; Jennings, G.M.; Sillett, S.C.; Koch, G.W. Hydrostatic constraints on morphological exploitation of light in tall Sequoia sempervirens trees. Oecologia 2008, 156, 751–763. [Google Scholar] [CrossRef] [PubMed]
  34. Kenzo, T.; Yoneda, R.; Sano, M.; Araki, M.; Shimizu, A.; Tanaka-Oda, A.; Chann, S. Variations in leaf photosynthetic and morphological traits with tree height in various tree species in Cambodian tropical dry evergreen forest. Jpn. Agric. Res. Q. JARQ 2012, 46, 167–180. [Google Scholar] [CrossRef] [Green Version]
  35. Koch, G.W.; Sillett, S.C.; Jennings, G.M.; Davis, S.D. The limits to tree height. Nature 2004, 428, 851–854. [Google Scholar] [CrossRef] [PubMed]
  36. Negisi, K.; Satoo, T. Influence of soil moisture on photosynthesis and respiration of seedlings of Akamatu (Pinus densiflora Sieb. et Zucc.) and Sugi (Cryptomeria japonica D. Don.). J. Jpn. For. Soc. 1954, 36, 113–117. [Google Scholar]
  37. Negisi, K.; Satoo, T. Soil moisture in relation to apparent photosynthesis and respiration of Akamatu and Sugi seedlings. J. Jpn. For. Soc. 1955, 37, 100–103. [Google Scholar]
  38. Nagakura, J.; Kaneko, S.; Takahashi, M.; Tange, T. Nitrogen promotes water consumption in seedlings of Cryptomeria japonica but not in Chamaecyparis obtusa. For. Ecol. Manag. 2008, 255, 2533–2541. [Google Scholar] [CrossRef]
  39. Dietrich, L.; Hoch, G.; Kahmen, A.; Körner, C. Losing half the conductive area hardly impacts the water status of mature trees. Sci. Rep. 2018, 8, 1–9. [Google Scholar] [CrossRef] [Green Version]
  40. Leuzinger, S.; Körner, C. Tree species diversity affects canopy leaf temperatures in a mature temperate forest. Agric. For. Meteorol. 2007, 146, 29–37. [Google Scholar] [CrossRef]
  41. Tang, Z.; Sayer, M.A.S.; Chambers, J.L.; Barnett, J.P. Interactive effects of fertilization and throughfall exclusion on the physiological responses and whole-tree carbon uptake of mature loblolly pine. Can. J. Bot. 2004, 82, 850–861. [Google Scholar] [CrossRef] [Green Version]
  42. Gaul, D.; Hertel, D.; Borken, W.; Matzner, E.; Leuschner, C. Effects of experimental drought on the fine root system of mature Norway spruce. For. Ecol. Manag. 2008, 256, 1151–1159. [Google Scholar] [CrossRef]
  43. Limousin, J.M.; Misson, L.; Lavoir, A.V.; Martin, N.K.; Rambal, S. Do photosynthetic limitations of evergreen Quercus ilex leaves change with long-term increased drought severity? Plant Cell Environ. 2010, 33, 863–875. [Google Scholar]
  44. Misson, L.; Degueldre, D.; Collin, C.; Rodriguez, R.; Rocheteau, A.; Ourcival, J.-M.; Rambal, S. Phenological responses to extreme droughts in a Mediterranean forest. Glob. Chang. Biol. 2010, 17, 1036–1048. [Google Scholar] [CrossRef]
  45. Grams, T.E.; Hesse, B.D.; Gebhardt, T.; Weikl, F.; Rötzer, T.; Kovacs, B.; Pritsch, K. The KROOF experiment: Realization and efficacy of a recurrent drought experiment plus recovery in a beech/spruce forest. Ecosphere 2021, 12, e03399. [Google Scholar] [CrossRef]
  46. Rowland, L.; Lobo-do-Vale, R.L.; Christoffersen, B.O.; Melém, E.A.; Kruijt, B.; Vasconcelos, S.S.; Meir, P. After more than a decade of soil moisture deficit, tropical rainforest trees maintain photosynthetic capacity, despite increased leaf respiration. Glob. Chang. Biol. 2015, 21, 4662–4672. [Google Scholar] [CrossRef] [PubMed]
  47. Tomasella, M.; Beikircher, B.; Häberle, K.H.; Hesse, B.; Kallenbach, C.; Matyssek, R.; Mayr, S. Acclimation of branch and leaf hydraulics in adult Fagus sylvatica and Picea abies in a forest through-fall exclusion experiment. Tree Physiol. 2018, 38, 198–211. [Google Scholar] [CrossRef]
  48. Pretzsch, H.; Grams, T.; Häberle, K.H.; Pritsch, K.; Bauerle, T.; Rötzer, T. Growth and mortality of Norway spruce and European beech in monospecific and mixed-species stands under natural episodic and experimentally extended drought. Results of the KROOF throughfall exclusion experiment. Trees 2020, 34, 957–970. [Google Scholar] [CrossRef]
  49. Evans, J.R. Photosynthesis and nitrogen relationships in leaves of C3 plants. Oecologia 1989, 78, 9–19. [Google Scholar] [CrossRef]
  50. Chapin, F.S., III; Matson, P.A.; Vitousek, P. Principles of Terrestrial Ecosystem Ecology; Springer Science & Business Media: New York, NY, USA, 2011. [Google Scholar]
  51. Forest Soil Division. Classification of forest soils in Japan 1975. Bull. Gov. For. Exp. Stn. 1976, 280, 1–28, (In Japanese with English summary). [Google Scholar]
  52. Inoue, Y.; Kitaoka, K.; Araki, M.; Kenzo, T.; Saito, S. Seasonal changes in leaf water potential, photosynthetic and transpiration rates in upper canopy needles in Cryptomeria japonica. Kanto J. For. Res. 2018, 69, 19–22, (In Japanese with English summary). [Google Scholar]
  53. Farquhar, G.D.; von Caemmerer, S.; Berry, J.A. A biochemical model of photosynthetic CO2 assimilation in leaves of C3 species. Planta 1980, 149, 78–90. [Google Scholar] [CrossRef] [Green Version]
  54. Harley, P.C.; Thomas, R.B.; Reynolds, J.F.; Strain, B.R. Modeling photosynthesis of cotton in elevated CO2. Plant Cell Environ. 1992, 15, 271–282. [Google Scholar] [CrossRef]
  55. Wullschleger, S.D. Biochemical limitation to carbon assimiration in C3 plants—A retrospective analysis of the A/Ci curves from 109 species. J. Exp. Bot. 1993, 44, 907–920. [Google Scholar] [CrossRef]
  56. Inoue, Y.; Araki, M.; Kitaoka, S.; Kenzo, T.; Saito, S. Relationship between projected shoot area and projected needle area in Cryptomeria japonica D. Don trees. Nihon Shinrin Gakkaishi 2020, 102, 7–14. [Google Scholar] [CrossRef]
  57. Sokal, R.R.; Rohlf, F.J. Biometry. The Principles and Practice of Statistics in Biological Research, 3rd ed.; W. H. Freeman and Company: New York, NY, USA, 1995. [Google Scholar]
  58. Zhou, L.; Wang, S.; Chi, Y.; Li, Q.; Huang, K.; Yu, Q. Responses of photosynthetic parameters to drought in subtropical forest ecosystem of China. Sci. Rep. 2015, 5, 1–11. [Google Scholar] [CrossRef] [PubMed]
  59. Wilson, K.B.; Baldocchi, D.D.; Hanson, P.J. Spatial and seasonal variability of photosynthetic parameters and their relationship to leaf nitrogen in a deciduous forest. Tree Physiol. 2000, 20, 565–578. [Google Scholar] [CrossRef] [Green Version]
  60. Warren, C.R.; Dreyer, E.; Adams, M.A. Photosynthesis-Rubisco relationships in foliage of Pinus sylvestris in response to nitrogen supply and the proposed role of Rubisco and amino acids as nitrogen stores. Trees 2003, 17, 359–366. [Google Scholar] [CrossRef]
  61. Ripullone, F.; Grassi, G.; Lauteri, M.; Borghetti, M. Photosynthesis–nitrogen relationships: Interpretation of different patterns between Pseudotsuga menziesii and Populus×euroamericana in a mini-stand experiment. Tree Physiol. 2003, 23, 137–144. [Google Scholar] [CrossRef] [PubMed] [Green Version]
  62. Kitaoka, S.; Laiye, Q.; Watanabe, Y.; Watanabe, M.; Watanabe, T.; Koike, T. Heterophyllous shoots of Japanese larch trees: The seasonal and yearly variation in CO2 assimilation capacity of the canopy top with changing environment. Plants 2020, 9, 1278. [Google Scholar] [CrossRef]
  63. Walker, A.P.; Beckerman, A.P.; Gu, L.; Kattge, J.; Cernusak, L.A.; Domingues, T.F.; Woodward, F.I. The relationship of leaf photosynthetic traits–Vcmax and Jmax–to leaf nitrogen, leaf phosphorus, and specific leaf area: A meta-analysis and modeling study. Ecol. Evol. 2014, 4, 3218–3235. [Google Scholar] [CrossRef] [Green Version]
  64. Varone, L.; Gratani, L. Leaf respiration responsiveness to induced water stress in Mediterranean species. Environ. Exp. Bot. 2015, 109, 141–150. [Google Scholar] [CrossRef]
  65. Amthor, J.S. Respiration and Crop Productivity; Springer Science & Business Media: New York, NY, USA, 1989. [Google Scholar]
  66. Kramer, P.J.; Boyer, J.S. Water Relations of Plants and Soils; Academic Press: San Diego, CA, USA, 1995. [Google Scholar]
  67. Poorter, H.; Niinemets, Ü.; Poorter, L.; Wright, I.J.; Villar, R. Causes and consequences of variation in leaf mass per area (LMA): A meta-analysis. New Phytol. 2009, 182, 565–588. [Google Scholar] [CrossRef]
  68. Ichie, T.; Yoneyama, A.; Hashimoto, T.; Tanaka-Oda, A.; Kusin, K.; Kenzo, T. Drainage effects on leaf traits of trees in tropical peat swamp forests in Central Kalimantan, Indonesia. Tropics 2019, 28, 1–11. [Google Scholar] [CrossRef]
  69. Azuma, W.; Ishii, H.R.; Kuroda, K.; Kuroda, K. Function and structure of leaves contributing to increasing water storage with height in the tallest Cryptomeria japonica trees of Japan. Trees 2016, 30, 141–152. [Google Scholar] [CrossRef]
  70. Niinemets, Ü. Stomatal conductance alone does not explain the decline in foliar photosynthetic rates with increasing tree age and size in Picea abies and Pinus sylvestris. Tree Physiol. 2002, 22, 515–535. [Google Scholar] [CrossRef] [PubMed] [Green Version]
  71. Helms, J.A. Diurnal and seasonal patterns of net assimilation in Douglas-Fir, Pseudotsuga menziesii (Mirb). Franco, as influenced by environment. Ecology 1965, 46, 698–708. [Google Scholar] [CrossRef]
  72. Kenzo, T.; Yoneda, R.; Ninomiya, I. Seasonal changes in photosynthesis and starch content in Japanese fir (Abies firma Sieb. et Zucc.) saplings under different levels of irradiance. Trees 2018, 32, 429–439. [Google Scholar] [CrossRef]
  73. Saiki, S.T.; Ando, Y.; Yazaki, K.; Tobita, H. Drought hardening contributes to the maintenance of proportions of non-embolized xylem and cambium status during consecutive dry treatment in container-grown seedling of Japanese cedar (Cryptomeria japonica). Forests 2020, 11, 441. [Google Scholar] [CrossRef]
  74. Bacelar, E.A.; Moutinho-Pereira, J.M.; Gonçalves, B.C.; Ferreira, H.F.; Correia, C.M. Changes in growth, gas exchange, xylem hydraulic properties and water use efficiency of three olive cultivars under contrasting water availability regimes. Environ. Exp. Bot. 2007, 60, 183–192. [Google Scholar] [CrossRef]
  75. Samuelson, L.J.; Kane, M.B.; Markewitz, D.; Teskey, R.O.; Akers, M.K.; Stokes, T.A.; Qi, J. Fertilization increased leaf water use efficiency and growth of Pinus taeda subjected to five years of throughfall reduction. Can. J. For. Res. 2018, 48, 227–236. [Google Scholar] [CrossRef]
Figure 1. Images showing the roof that was constructed for throughfall exclusion in the drought plot (A) and the observation tower used for canopy sampling (B).
Forests 12 00971 g001
Figure 2. (A) Monthly temperature (maximum, average, and minimum) and (B) precipitation at the study site from 2019 to 2020.
Forests 12 00971 g002
Figure 3. Monthly average soil water potential at depths of 10, 40, and 80 cm in the control and drought plots between April 2018 and October 2020. Throughfall exclusion began in late May 2018. Bars indicate standard errors for each month (n = 3).
Forests 12 00971 g003
Figure 4. Seasonal changes in (A) Vcmax, (B) Jmax, and (C) Rd in the drought and control plots. Bars indicate standard errors (n = 3–5). The results of the associated statistical analyses are shown in Table 1.
Forests 12 00971 g004
Figure 5. Seasonal changes in (A) Pmax, (B) gs, and (C) WUEi in the drought and control plots. Bars indicate standard errors (n = 5). Closed and open symbols represent observations in the control and drought plots, respectively. Solid and dashed lines indicate morning and afternoon measurements, respectively. Asterisks indicate significant differences among treatments and time of day for each month, as assessed using a one-way ANOVA (* p < 0.05, ** p < 0.01, *** p < 0.001). The results of the associated statistical analyses are shown in Table 2.
Forests 12 00971 g005
Figure 6. (A) Seasonal changes in LMA, (B) Narea, and (C) Nmass in the drought and control plots. Bars indicate standard errors (n = 3). The results of the associated statistical analyses are shown in Table 3.
Forests 12 00971 g006
Table 1. Summary statistics for the Type III test performed for fixed effects (season and treatment) in the linear mixed model (LMM), assessing differences in Vcmax, Jmax, Rd, LMA, Narea, and Nmass.
VcmaxJmaxRdLMANareaNmass
Fixed EffectF-value, pF-value, pF-value, pF-value, pF-value, pF-value, p
Season30.5, <0.00013.0, ns51.6, <0.0001200.9, <0.0001142.7, <0.00019.1, <0.001
Treatment0.9, ns1.3, ns0.0, ns0.2, ns0.8, ns0.2, ns
Season × treatment1.0, ns1.6, ns1.7, ns1.5, ns2.6, ns0.4, ns
Table 2. Summary statistics for the Type III test performed for fixed effects (season, treatment, and morning (AM) or afternoon (PM)) in the linear mixed model (LMM), assessing differences in Pmax, gs, and WUE. “ns” indicates not significant (p > 0.05).
PmaxgsWUEi
Fixed effectd.f.,F-value, pd.f.,F-value, pd.f.,F-value, p
Season2, 50.1, <0.00012, 4.7, <0.052, 26.9, <0.0001
Treatment1, 7.6, <0.011, 17.6, <0.00011, 6.9, <0.05
AM/PM1, 44.3, <0.00011, 53.0, <0.00011, 8.9, <0.01
Season × treatment2, 4.1, ns2, 1.4, ns2, 0.5, ns
Season × AM/PM2, 0.8, ns2, 1.3, ns2, 0.1, ns
Treatment × AM/PM1, 0.1, ns1, 0.2, ns1, 0.6, ns
Season × treatment × AM/PM2, 1.0, ns2, 0.2, ns2, 0.9, ns
Table 3. Results of multiple regression analysis between Pmax and explanatory variables (LMA, gs, and Nmass) in control and dry plots in each measurement timing (morning/afternoon). The β-values are standardized regression coefficients.
TreatmentControl Drought
Measurement TimeMorningAfternoonMorningAfternoon
Β-value, pβ-value, pβ-value, pβ-value, p
gs0.24, ns0.79, <0.00010.39, <0.050.67, <0.0001
LMA−0.72, <0.001−0.31, <0.01−0.55, <0.01−0.31, <0.05
Nmass−0.17, ns0.07, ns−0.26, ns−0.08, ns
Publisher’s Note: MDPI stays neutral with regard to jurisdictional claims in published maps and institutional affiliations.

