Article

An Analysis of Atlantic White Cedar (Chamaecyparis thyoides (L.) B.S.P.) Tree Rings as Indicators of Ghost Forest Development in a Globally Threatened Ecosystem

Department of Organismal and Environmental Biology, Christopher Newport University, Newport News, VA 23606, USA
*
Author to whom correspondence should be addressed.
Submission received: 25 June 2021 / Revised: 14 July 2021 / Accepted: 14 July 2021 / Published: 22 July 2021
(This article belongs to the Special Issue Coastal Forest Dynamics and Coastline Erosion)

Abstract

:
Atlantic White Cedar (AWC) swamps are a globally threatened type of wetland ecosystem and are a new form of ghost forest in the mid-Atlantic region of the US. Hydrogeomorphic regimes foster peat formation, resulting in unique biodiversity and carbon sequestration services. Our sites include regimes that are exposed to sea-level rise and storm-driven seawater intrusion, yet other sites are protected by higher elevations. In this study, we evaluated climatic variables to discern differences in tree ring formation as an indicator of growth among nine stands including micro-tidal, oligohaline sites as well as other protected areas which served as a control. Standard dendrochronological techniques were used, and series were divided into two sub-chronologies, 1895 to 1971 (early) and 1972 to 2018 (recent). AWC growth in response to precipitation parameters, e.g., Palmer Drought Severity Index (PDSI), were largely non-significant but were somewhat reversed among sub-chronologies. Early correlations were primarily negatively correlated with PDSI, while recent correlations were mostly positive, which suggests that even though inundation may reduce photosynthate availability for growth, precipitation has begun to increase growth by alleviating osmotic and toxic stresses associated with seawater. Analysis of climatic variables and tree growth at the reference site found that other anthropogenic stressors associated with ditching exert a greater influence. Hurricane impacts on tree growth exhibited no lasting negative effects; however, an AWC ghost forest report from New Jersey connected mortality to a hurricane. Hydrogeomorphic regimes may delay rather than eliminate risks associated with sea-level rise and storm-driven seawater.

1. Introduction

Climate change affects coastal ecosystems through sea-level rise (SLR) [1] and increased storm intensity, among other mechanisms [2], impacting plant communities [3] and altering ecosystem services [4,5]. In coastal wetlands, climatic variables interact with local hydrogeomorphic conditions [6] and influence inundation and salinity, which are critical environmental determinants of wetland functions. The effects may be lethal to vegetation, and when entire forested ecosystems are affected, the standing deadwood is termed a ghost forest [3,7]. The phenomenon occurs in drowned river estuaries within two hydrogeomorphic settings: microtidal hydrologic regimes behind coastal barrier islands, where water levels are primarily influenced by wind, and macrotidal regimes, where barrier islands are lacking [8]. Due to climate change, hydroperiods and salinity are increasing in both contexts, thus understanding the role of inundation and salinity in ghost forest formation is necessary for developing predictive models and adaptive management strategies. Concerns are greater for ecosystems such as Atlantic White Cedar (AWC), Chamaecyparis thyoides (L.) B.S.P.-dominated swamps.
Within the Cupressaceae family, the genus Chamaecyparis is restricted to extreme environments but is globally distributed [9]. AWC was first described as endangered in 1748 [10] and occurs in the United States from Maine to Mississippi in a narrow coastal band [11]. The swamp exerts hydrologic control through the production of peat, resulting in acidic and anoxic soil conditions [12] and influencing primary production [13], soil respiration [14,15], and decomposition [16] functions, causing additional peat formation and carbon sequestration. The peat maintains soil saturation and acts as a seed refugium during fire. When fire kills the canopy, dense regeneration of AWC ensues such that a monoculture develops [17,18], but the ecosystem is otherwise characterized by unique biodiversity [19]. In the mid-Atlantic region, AWC extent has gradually declined due to ditching within higher elevation sites such as the Great Dismal Swamp (GDS; mean elevation 3 m above Mean Sea Level) (Figure 1). A large portion of the swamp forms the Great Dismal Swamp National Wildlife Refuge (GDSNWR), which serves as a reference site in this study. Currently, the largest remaining AWC stands occur in Alligator River National Wildlife Refuge (ARNWR) within Dare County, NC, where the low landscape position (<1 m above MSL) has protected AWC stands from drainage. However, the low elevation exposes AWC stands to inundation and seawater associated with climate change (Figure 1).
Soil saturation and inundation create anoxic soil layers to which wetland plants are variously adapted [20,21,22,23], and these stresses increase as a result of climate change [24]. Bald Cypress, Taxodium distichum (L.) Rich., and AWC historically were co-dominant species in our sites [25,26] and are classified as obligate wetland species [11], but the species diverge in their inundation tolerance. Bald Cypress persists where inundation is deep [27,28] and of long duration [29]; however, AWC is inundation-intolerant. Peatlands dominated by AWC are characterized by a micro-topography of hummocks and hollows with AWC establishing on hummocks. This pattern has been described in New Jersey [30] and in GDSNWR and ARNWR in Virginia and North Carolina [31]. Avoidance of the water table can also be achieved by shallow rooting, and Rodgers et al. [32], working within a subset of our stands, reported greater root biomass where water tables were higher. In addition, several authors have reported that young AWC exhibit reduced growth and increased mortality in response to inundation [33,34,35,36].
Seawater has osmotic and direct toxicological effects on non-halophytes [23] and enters coastal systems via chronic mechanisms such as salt wedges and tides, or more acutely as with storm-driven inputs where barrier islands otherwise protect estuaries [1,37]. Once seawater enters the sound system, dilution by watershed runoff creates a salinity gradient that is analogous to other drowned river valley estuaries, and both tidal and non-tidal wetlands plant communities are structured by the salinity gradient [38,39]. As sea level rises, the salt wedge progresses and species composition is altered [4,40]. In forested wetlands, other coniferous tree species exhibit reduced growth in response to seawater, including Loblolly Pine, Pinus taeda L. [41,42,43], and Red Spruce, Picea rubens Sarg. [44]. However, two other coniferous species in the Cupresaceae family appear to have some tolerance: Eastern Red Cedar, Juniperus virginiana, particularly J. virginiana var. silicicola ((Small) Silba) [11], although its occurrence in Virginia is not confirmed [45], and Bald Cypress, which accumulates salt in wood tissue [46] and can persist with salinity up to 3.4 ppt [47]. While no published studies of AWC salt tolerance were found, young AWC in a greenhouse study were shown to be sensitive to very low salt concentrations [48]. Early in the twentieth century, channelization of the Saint John River in Delaware decreased the growth of AWC, perhaps in response to increased salinity; however, growth rates among surviving trees recovered within 2 years [49]. AWC ghost forest formation was reported for mature AWC stands following Hurricane Sandy in New Jersey [50].
In addition to coastal peatlands along rivers, AWC swamps also occur in isolated hydrogeomorphic settings such as the Great Dismal Swamp in Virginia and North Carolina (Figure 1). These settings are not subject to sea-level rise or storm-driven seawater intrusion; however, unditched AWC peatlands were not available in the region. GDSNWR contains 254 km of ditches [51], and the lower water table allows for increased growth of conifers generally [52,53], and for AWC in GDSNWR [13] who found that growth between drained and undrained sites are similar; however, drained sites support fewer, albeit larger trees. In addition, while also working in GDSNWR [54], an evaluation of AWC tree ring growth correlated to water availability, which was modeled using the Palmer Drought Severity Index (PDSI), an indicator of monthly water availability as influenced by antecedent precipitation and temperature [55]. Correlation patterns diverged among drained and undrained stands, suggesting that PDSI can detect water stress in AWC in the mid-Atlantic region.
Extensive tree mortality in or near ARNWR has been linked to hurricane events [56], wind-driven water levels and salinity [1], local sea-level rise [3], and ditches [1,57]. AWC mortality was noted in patches of ARNWR as early as 2005 [58]. AWC tree ring growth has been found to correlate with PDSI and is influenced by ditches in GDSNWR [54] and by historic channelization in Delaware [49]. Objectives of this study were to (1) evaluate climate variables as indicators of AWC growth among 103 trees in 4 stands in the ARNWR, (2) contrast the ARNWR tree growth response with that of a reference site consisting of 42 trees in 5 stands in the GDSNWR that are not exposed to sea-level rise or storm-driven seawater, and (3) combine climatic analysis with the hydrogeomorphic setting of ARNWR in order to anticipate the response of the species to climate change.

2. Materials and Methods

2.1. Study Area

Alligator River National Wildlife Refuge (ARNWR) is located between the Albemarle Sound and Pamlico Sound about 16 km from the Atlantic Ocean on the Albemarle-Pamlico Peninsula (Figure 1). The ~61,600 ha refuge was established in 1984 [59]. ARNWR ranges in elevation above sea level from 3.8 m in the west to 0.3 m in the east [60] and water inputs in this hydrogeomorphic setting are primarily influenced by wind direction and wind tides [6]. The dominant habitat type in the refuge is pocosin wetlands and AWC stands comprise ~2700 ha, which have been considered among the largest continuous stands of AWC in the species’ range [19]. The pocosin wetlands that the refuge contains are characterized by deep mucks and peats, predominantly Pungo Muck soil series [60], which has organic horizons to a depth of 1.83 m [61]. Site selection included AWC as the dominant canopy species and Swamp Tupelo, Nyssa biflora Walt., was commonly associated in the canopy [62]. Sample sites were along Milltail Creek, a water body that flows east to west across the peninsula (Figure 1).
Great Dismal Swamp National Wildlife Refuge (GDSNWR) is located on the border of Virginia and North Carolina about 50 km from the Atlantic Ocean and adjacent to the Suffolk Scarp [19] (Figure 1). The 44,500 ha refuge was established in 1974 [63]. Elevation varies across the refuge from 4.6 m to 7.6 m above sea level in the west and gradually slopes (2 m per km) to the east, and water inputs are primarily precipitation and runoff [6,64]. AWC acreage declined following the operation of the Dismal Swamp Canal in 1805, which began to lower the water tables. Drainage increased following enhanced ditching in the 1950s [65] and ditches total 224 km in length [51]. The last 1200 AWC disappeared after Hurricane Isabel (2003) and our lab removed stem cuts in concert with salvage logging. Two peat-burning fires ensued without substantial regeneration, and remnant stands were most recently surveyed by Duberstein and Krauss [66]. Large stands of Red Maple, Acer rubrum L., and Nyssa spp. Are dominant in the refuge [67], and Red Maple and Swamp Tupelo were commonly associated with AWC in our sites in GDSNWR [62]. Soil composition in the refuge is mostly organic [68], and the soil type in our sites was a Pungo muck, as in ARNWR. Sample sites were located in the southern portion of the refuge and Corapeake, Forest Line, Cross Canal, and South were the closest ditches [69] (Figure 1).

2.2. Wood Sample Collection and Preparation

In ARNWR, we collected two cores from 20 trees within each of three stands in 2018 and cores from 54 trees in a nearby stand in 2003 [70]. In GDSNWR reference sites, stem-cut samples were collected from a total of 42 trees from five stands during 2006–2008 [69] (Figure 1). All trees were sampled at breast height on north/south and east/west axes. Core samples were dried and mounted. All samples were sanded with progressively finer sandpaper [71].

2.3. Cross-Dating and Chronology Development

Tree rings were measured for each core, and for at least 4 radii per stem cut, using a binocular microscope fitted to a Velmex TA (Velmex Inc., Bloomfield, NY, USA) micrometer system and measured to the nearest 0.001 mm and recorded using Measure J2X Software (v5.0) [72]. Patterson and Merry dated rings by visual reinspection of core and use of marker years and employed COFECHA (v6.06 P) and ARSTAN (v6.05 P) to generate master series of growth and to perform detrending of master series [69,70]. The remaining site series (3 sites in ARNWR) were cross-dated in the Dendrochronology Program Library, dplR [73], in R [74] using R Studio [75]. Detrending was also conducted in dplR using a Friedman Super Smoother, and master chronologies for ARNWR and GDSNWR of Ring Width Indexes (RWI) were produced. Reliability of each chronology was verified using Effective Average Correlation between Series (RBAR.eff), Expressed Population Signal (EPS), Mean Subsample Signal Strength (SSS), and Signal-to-Noise Ratio (SNR) thresholds [76,77].

2.4. Climatological Data

Palmer Drought Severity Index (PDSI), Palmer Hydrological Drought Index (PHDI), and average monthly temperature were retrieved from the National Centers for Environmental Information (NCEI) [78] from NOAA North Carolina Division 7 for ARNWR and Virginia Division 1 for GDSNWR. Hurricane data were obtained from an NOAA database, “Historical Hurricane Tracks”, which uses data from the NCEI International Best Track Archive for Climate Stewardship, IBTrACS, and the NOAA National Hurricane Center Best Track Data, HURDAT2 [79]. An area of interest including ARNWR with a range of 20 nautical miles (37 km) was constructed and named hurricanes passing through between 1895 and 2018 were sorted for highest intensity. The most intense named hurricanes were Gloria (1985), Donna (1960), Connie (1955), Ione (1955), and Cleo (1964) [79]. Three additional hurricanes of regional importance were also identified including Isabel (2003) [51], Hazel (1954) [37], and Irene (2011) [56] (Table 1).

2.5. Data Analysis

To better isolate the trends of sea-level rise from the late twentieth century to the present, chronologies at ARNWR and GDSNWR were divided in half based on average series age (chronologies ranged from 1895 to 2018, average age was 62 years, and the midpoint year was 1972). Thus, dataset groupings include an “early period” from 1895 to 1971 and a “recent period” from 1972 to 2018 (Table 2). Reliability of each chronology was verified by RBAR.eff, EPS, SSS, and SNR thresholds [76,77].
Correlations of monthly climatological variables and standardized annual growth were evaluated using a 24-month climate window consisting of January in the previous year to December of the current year. Climate correlations were performed on both periods in the ARNWR and in the GDSNWR study sites.
Most parameters failed normality tests both before and after transformation, so a Spearman Ranked Correlation test was used for all months in the 24-month window. Significance thresholds were evaluated using the Benjamini–Hochberg method with a false discovery rate of 20% [80].

3. Results

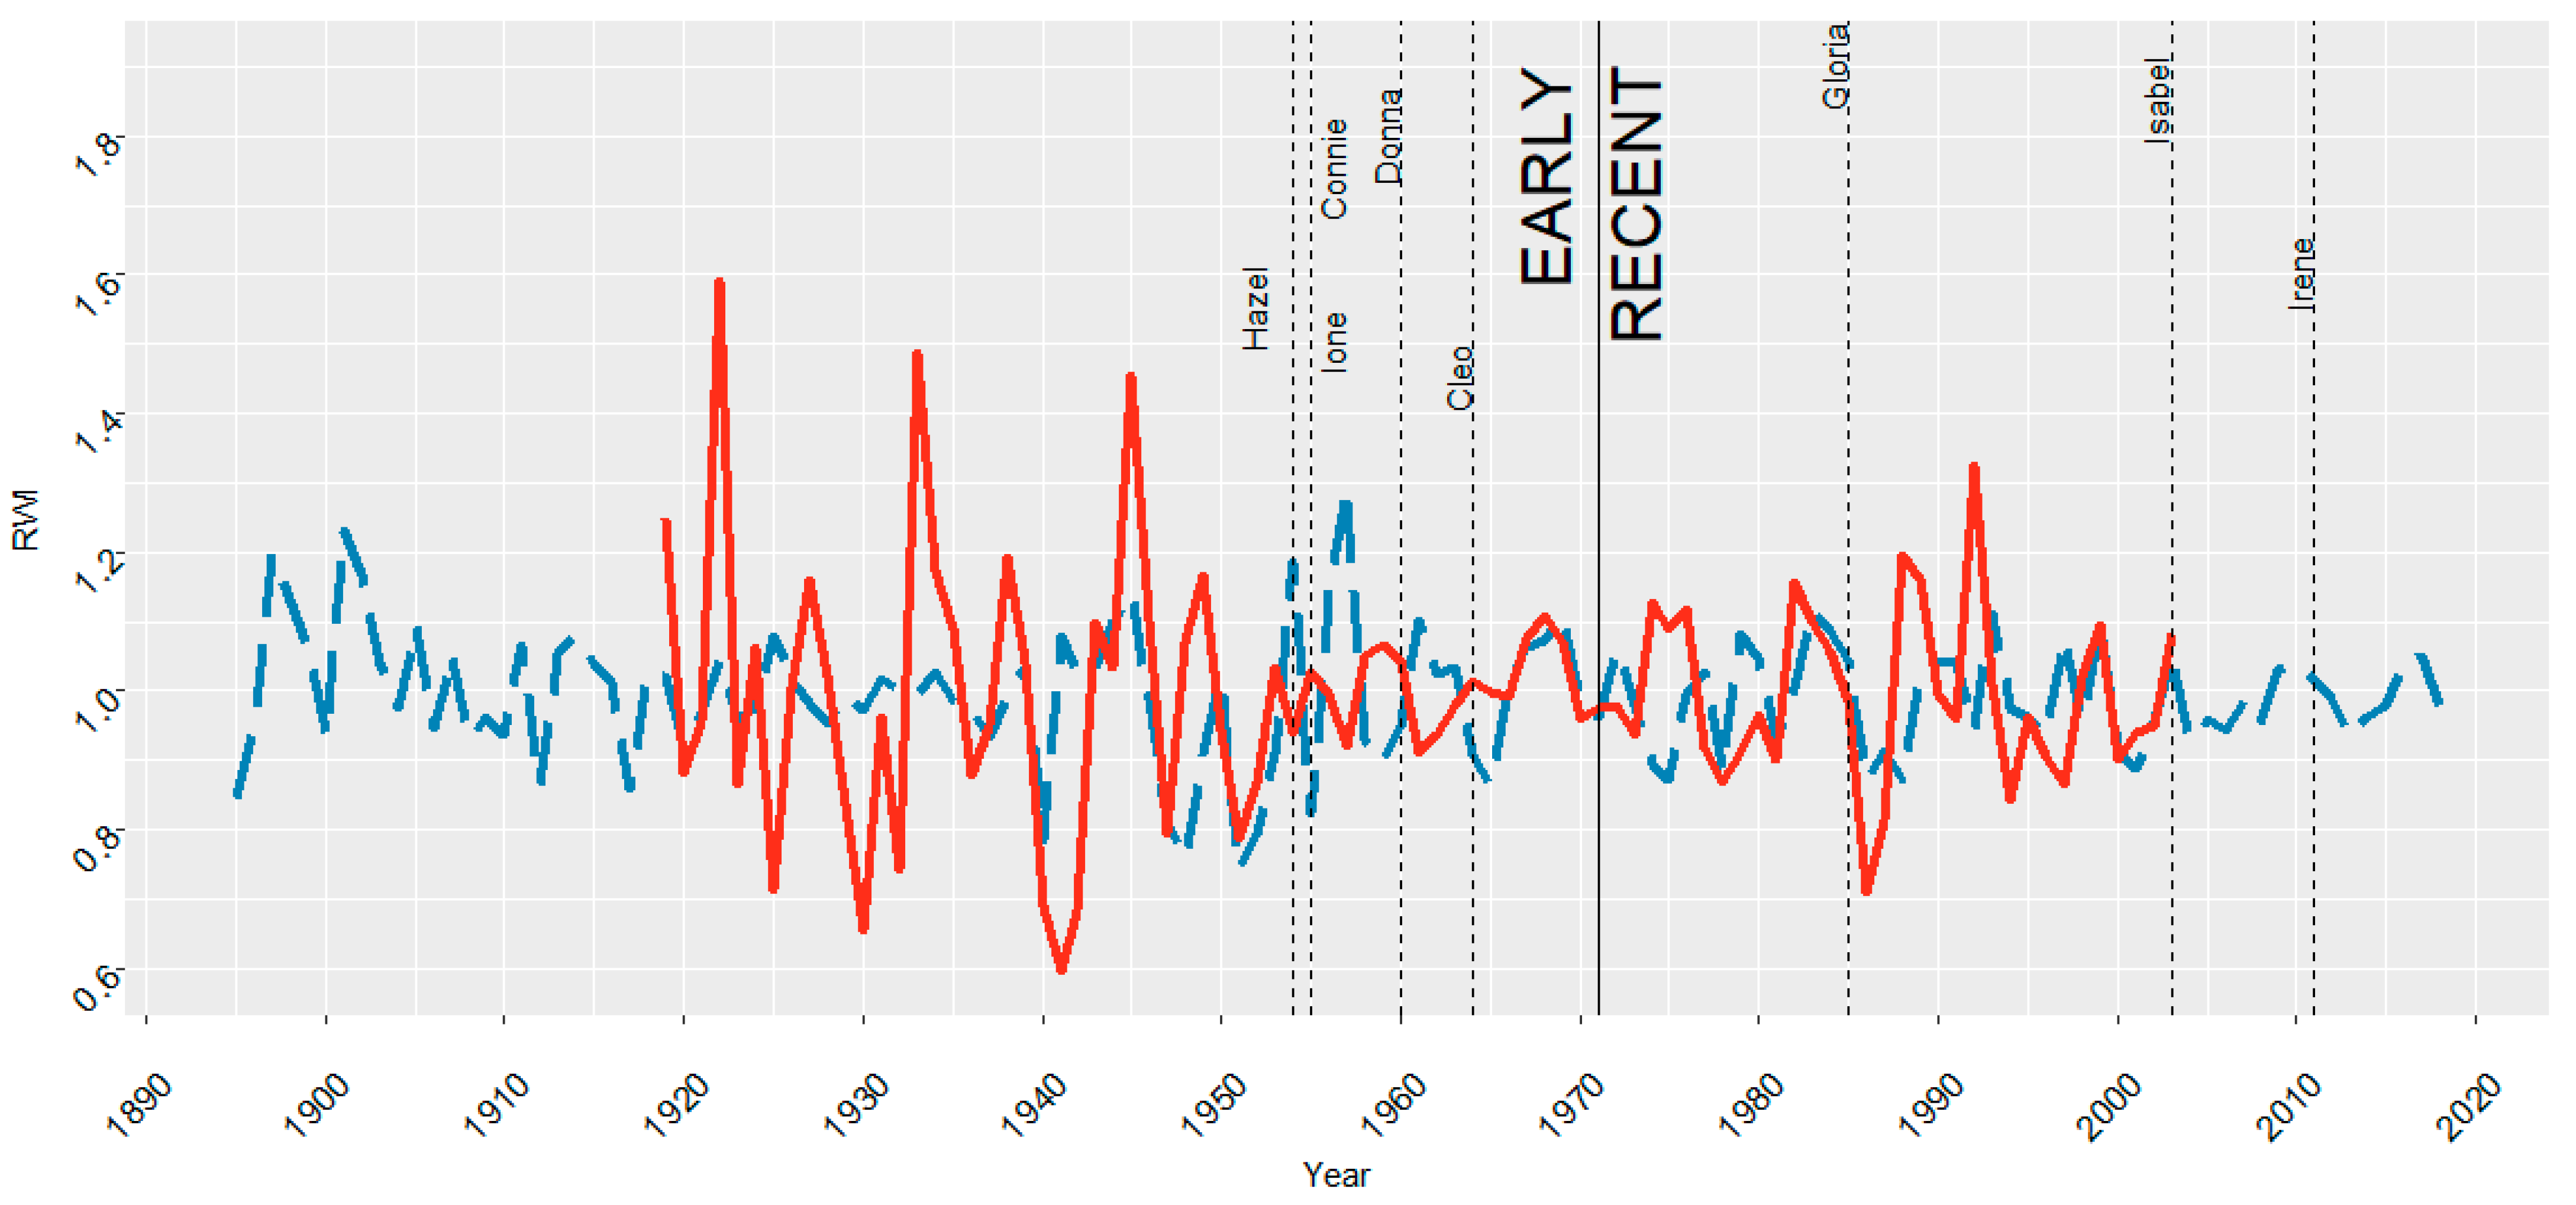
3.1. ARNWR and GDSNWR Ring Width Index Results for the Full Chronologies

The ARNWR full (undivided) chronology results were reliable based on EPS (0.969), SNR (31.147), RBAR.eff (0.184), and Mean SSS (0.8175; Table 2). Chronologies for each time period at ARNWR were similarly reliable regarding EPS (≥0.966), SNR (≥28.341), RBAR.eff (≥0.126), and Mean SSS (≥0.7859; Table 2). Mean RWI was 0.993 and ranged from 0.74 (in 1951) to 1.294 (in 1957) (Figure 2).
Major hurricane events in the early period generally increased growth at a lag of 1, 2, and 3 years but generally decreased growth for the year in which the hurricane occurred, based on comparison to a 10-year running average of RWI. Hurricane events in the recent period were generally associated with suppressed growth in 1, 2, and 3-year lags and increased growth in the year in which they occurred (Table 1).
The GDSNWR full (undivided) chronology results were reliable based on EPS (0.978), SNR (43.89), RBAR.eff (0.522), and Mean SSS (0.994; Table 2). Chronologies for each time period at GDSNWR were similarly reliable according to EPS (≥0.978), SNR (≥28.565), RBAR.eff (≥0.405), and Mean SSS (≥0.993; Table 2). Mean RWI was 0.997 and ranged from 0.595 in 1941 to 1.593 in 1922, which was considerably more variable than RWI in ARNWR (Figure 2).

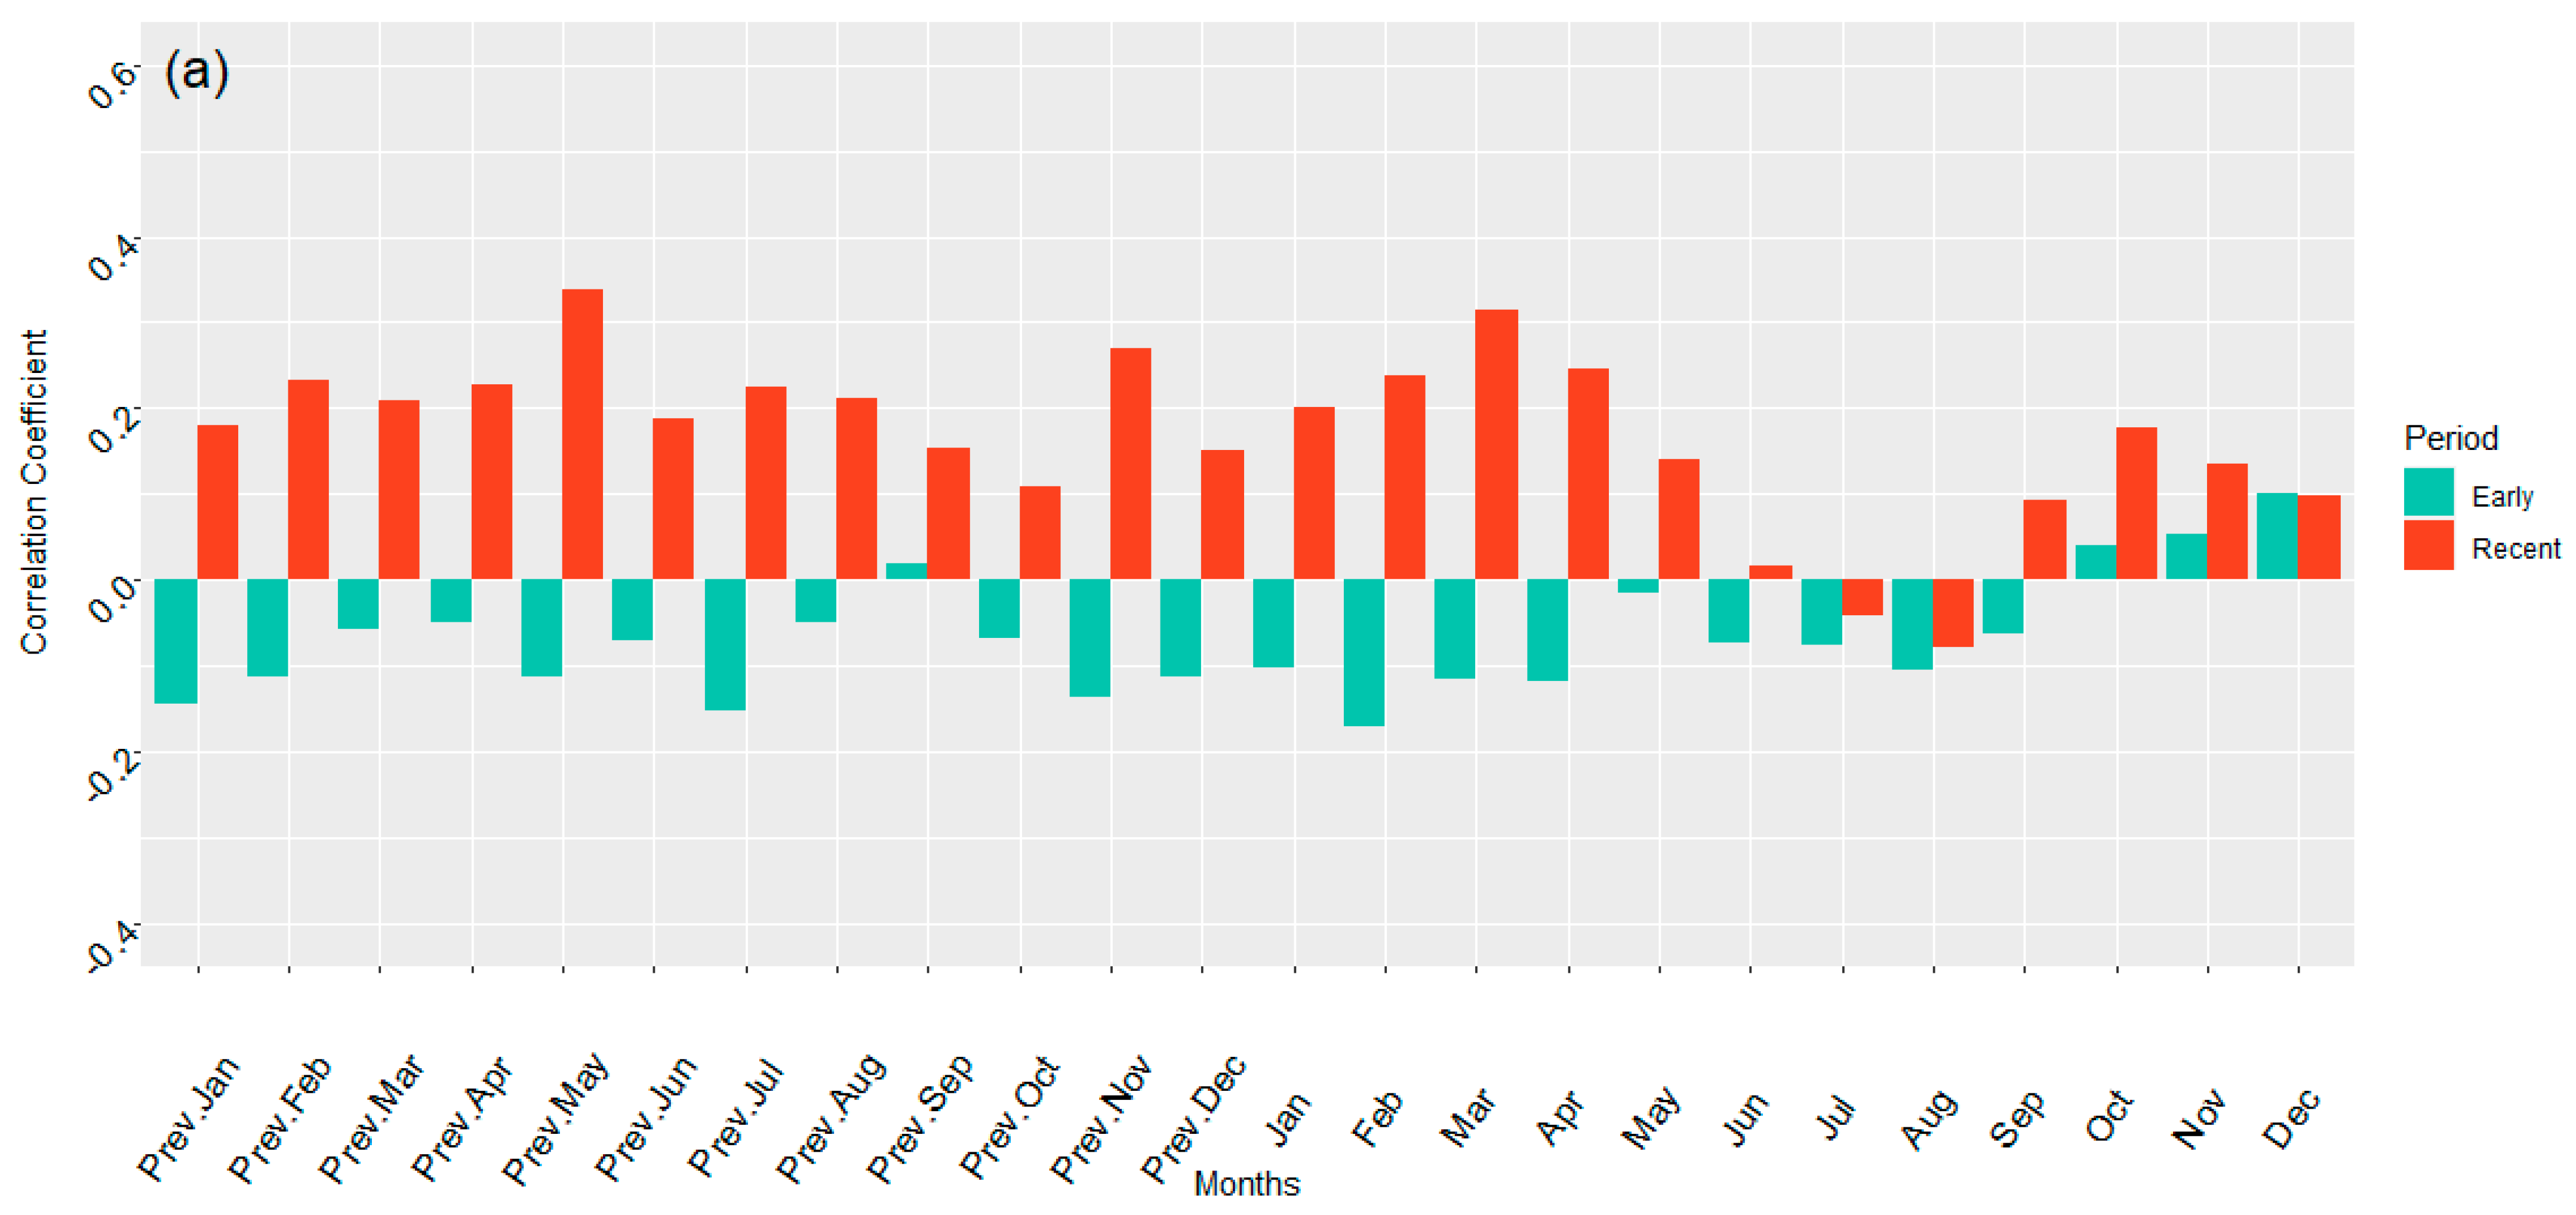
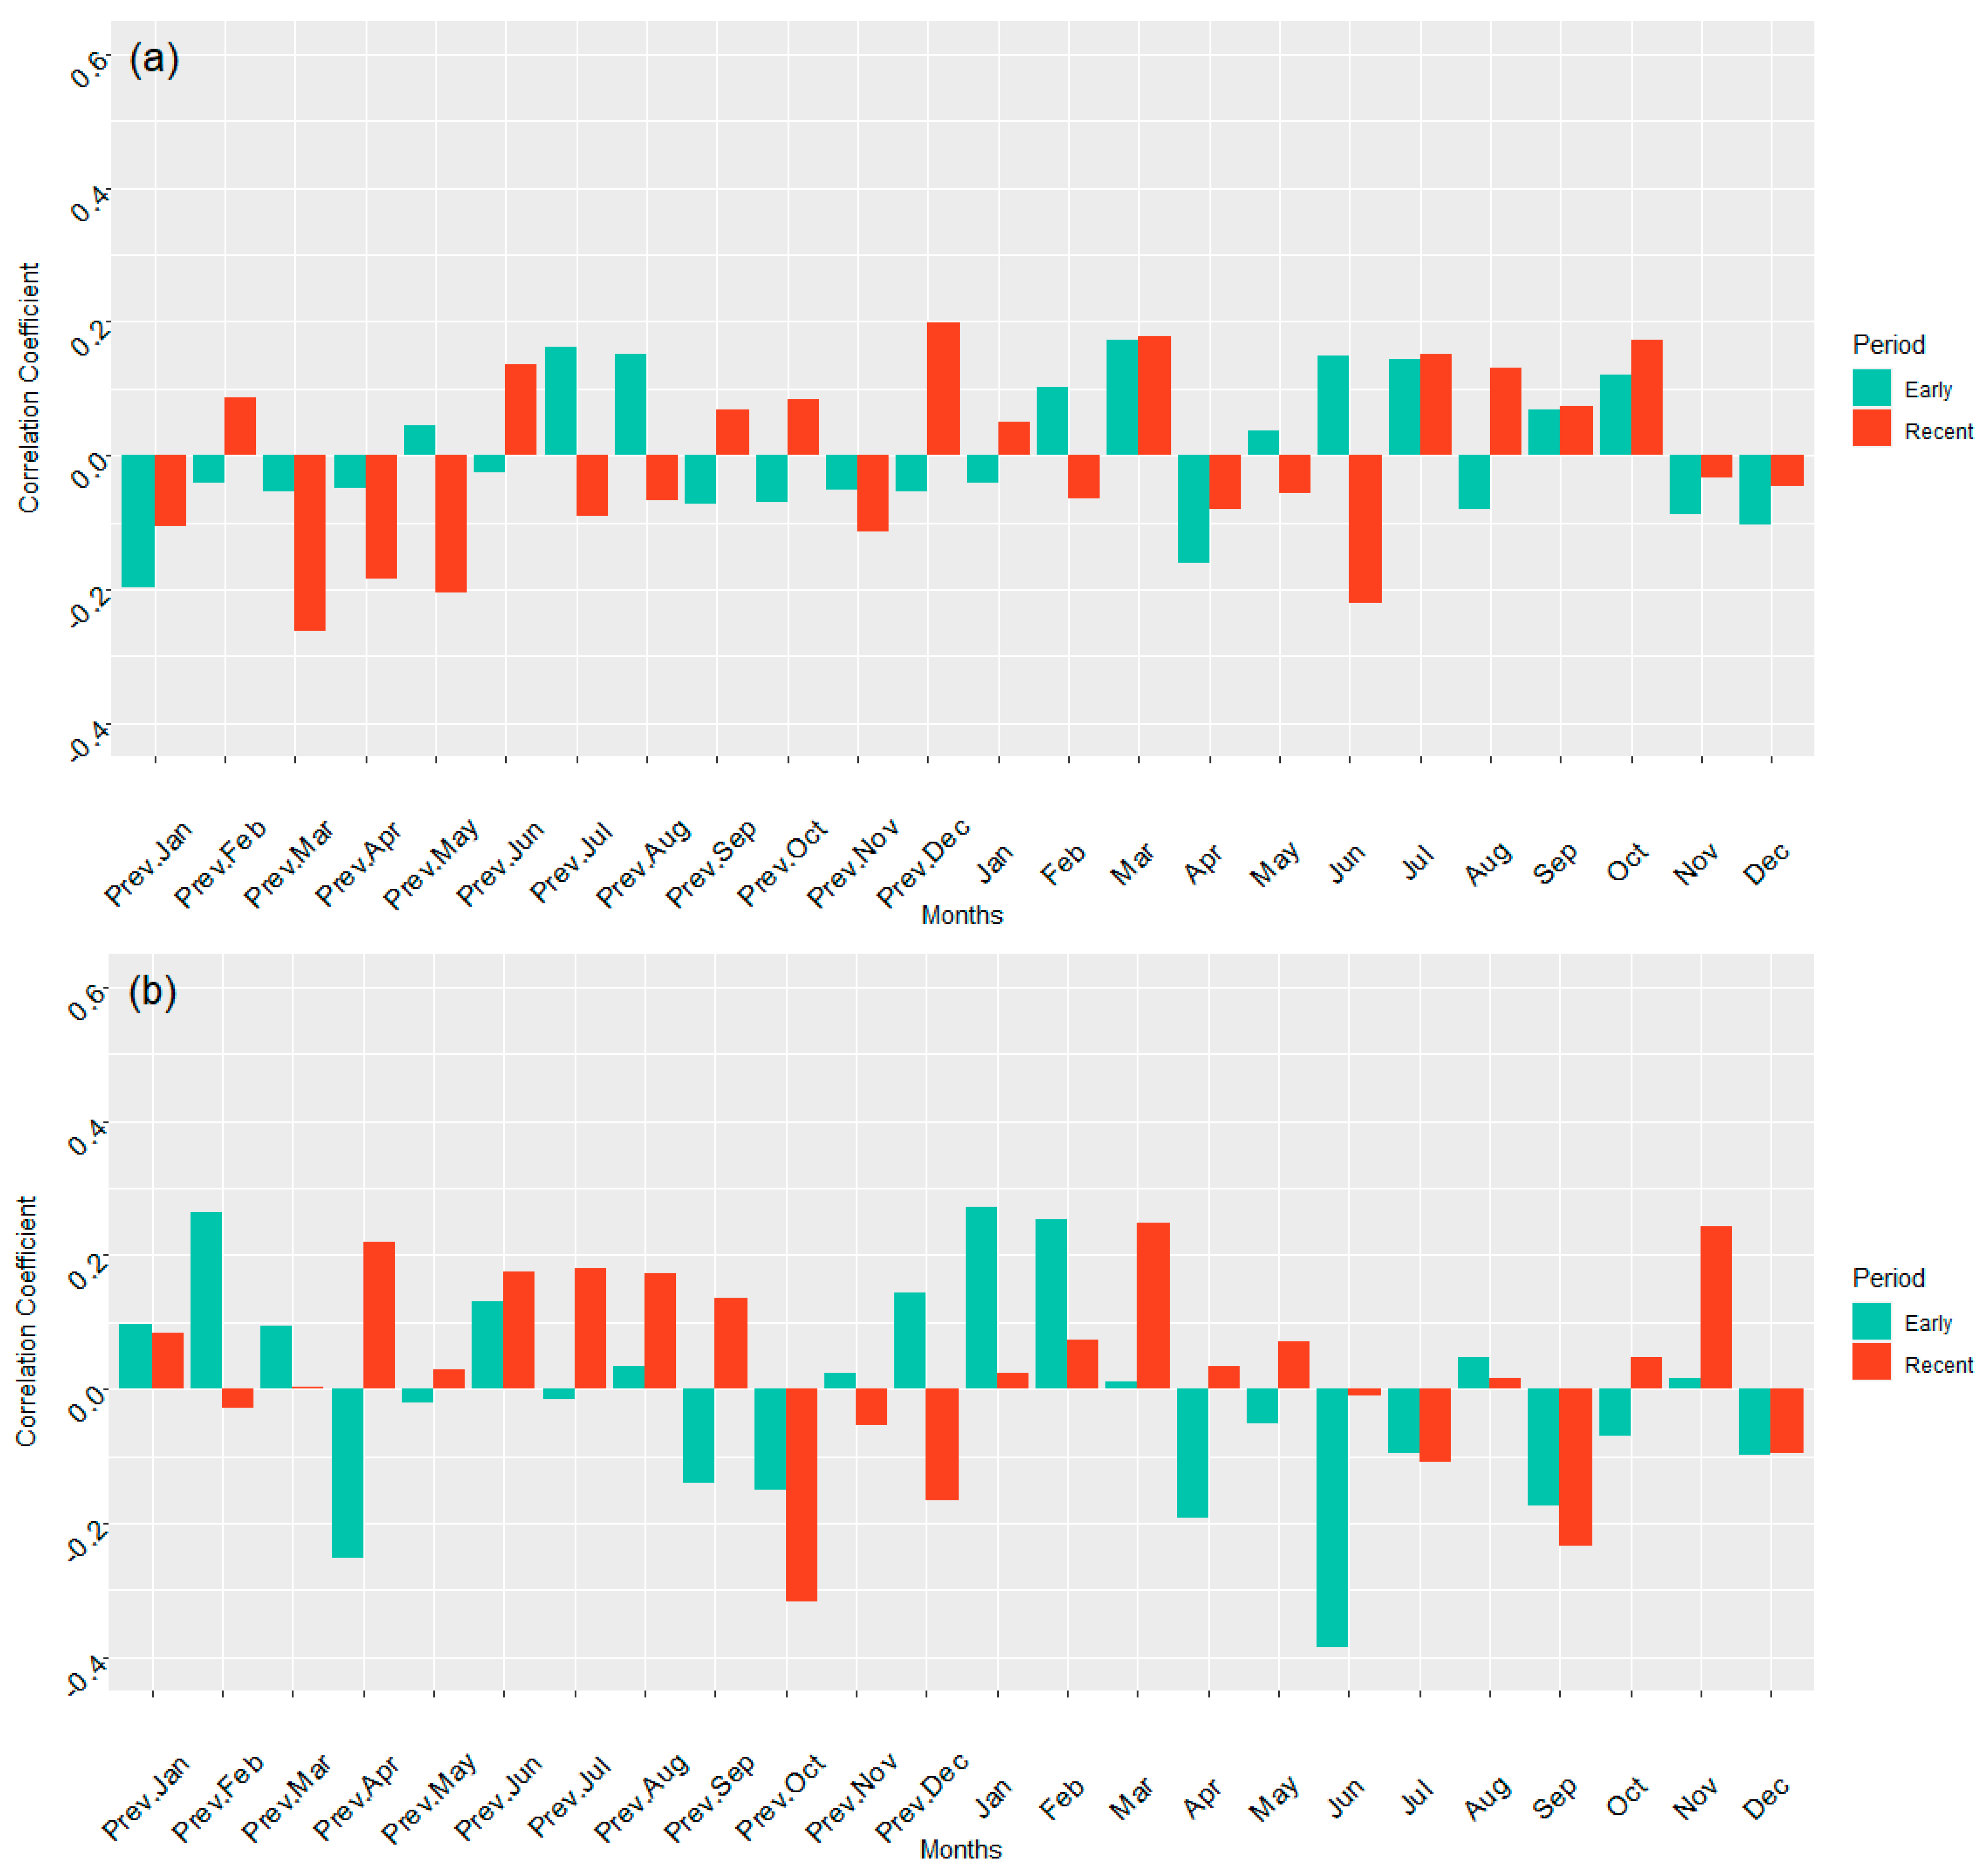
3.2. Correlations of AWC Growth and PDSI at ARNWR and GDSNWR for Divided (Early and Recent) Chronologies

In ARNWR, correlations of growth and PDSI were not statistically significant but diverged sharply among recent and early periods. PDSI and growth in the previous year were consistently negative in the early period but became consistently positive in the recent period, particularly for the previous 12 months and continued through May of the current year (Figure 3a).
In GDSNWR, correlations of growth and PDSI tended to be stronger during both periods (early and recent, maximum = 0.553) (Figure 3b), and correlations were generally higher than in ARNWR (maximum = 0.338) (Figure 3a). However, PSDI and growth correlation patterns did not diverge as they did in ARNWR. Patterns of correlations in early and recent periods were somewhat similar during the current year, and some significant correlations were detected during the previous year (early = negative; recent = positive) (Figure 3b). In the early period, the summer months of the previous year (June, July, and August) and two months of the current year (July and August) were significantly positively correlated.

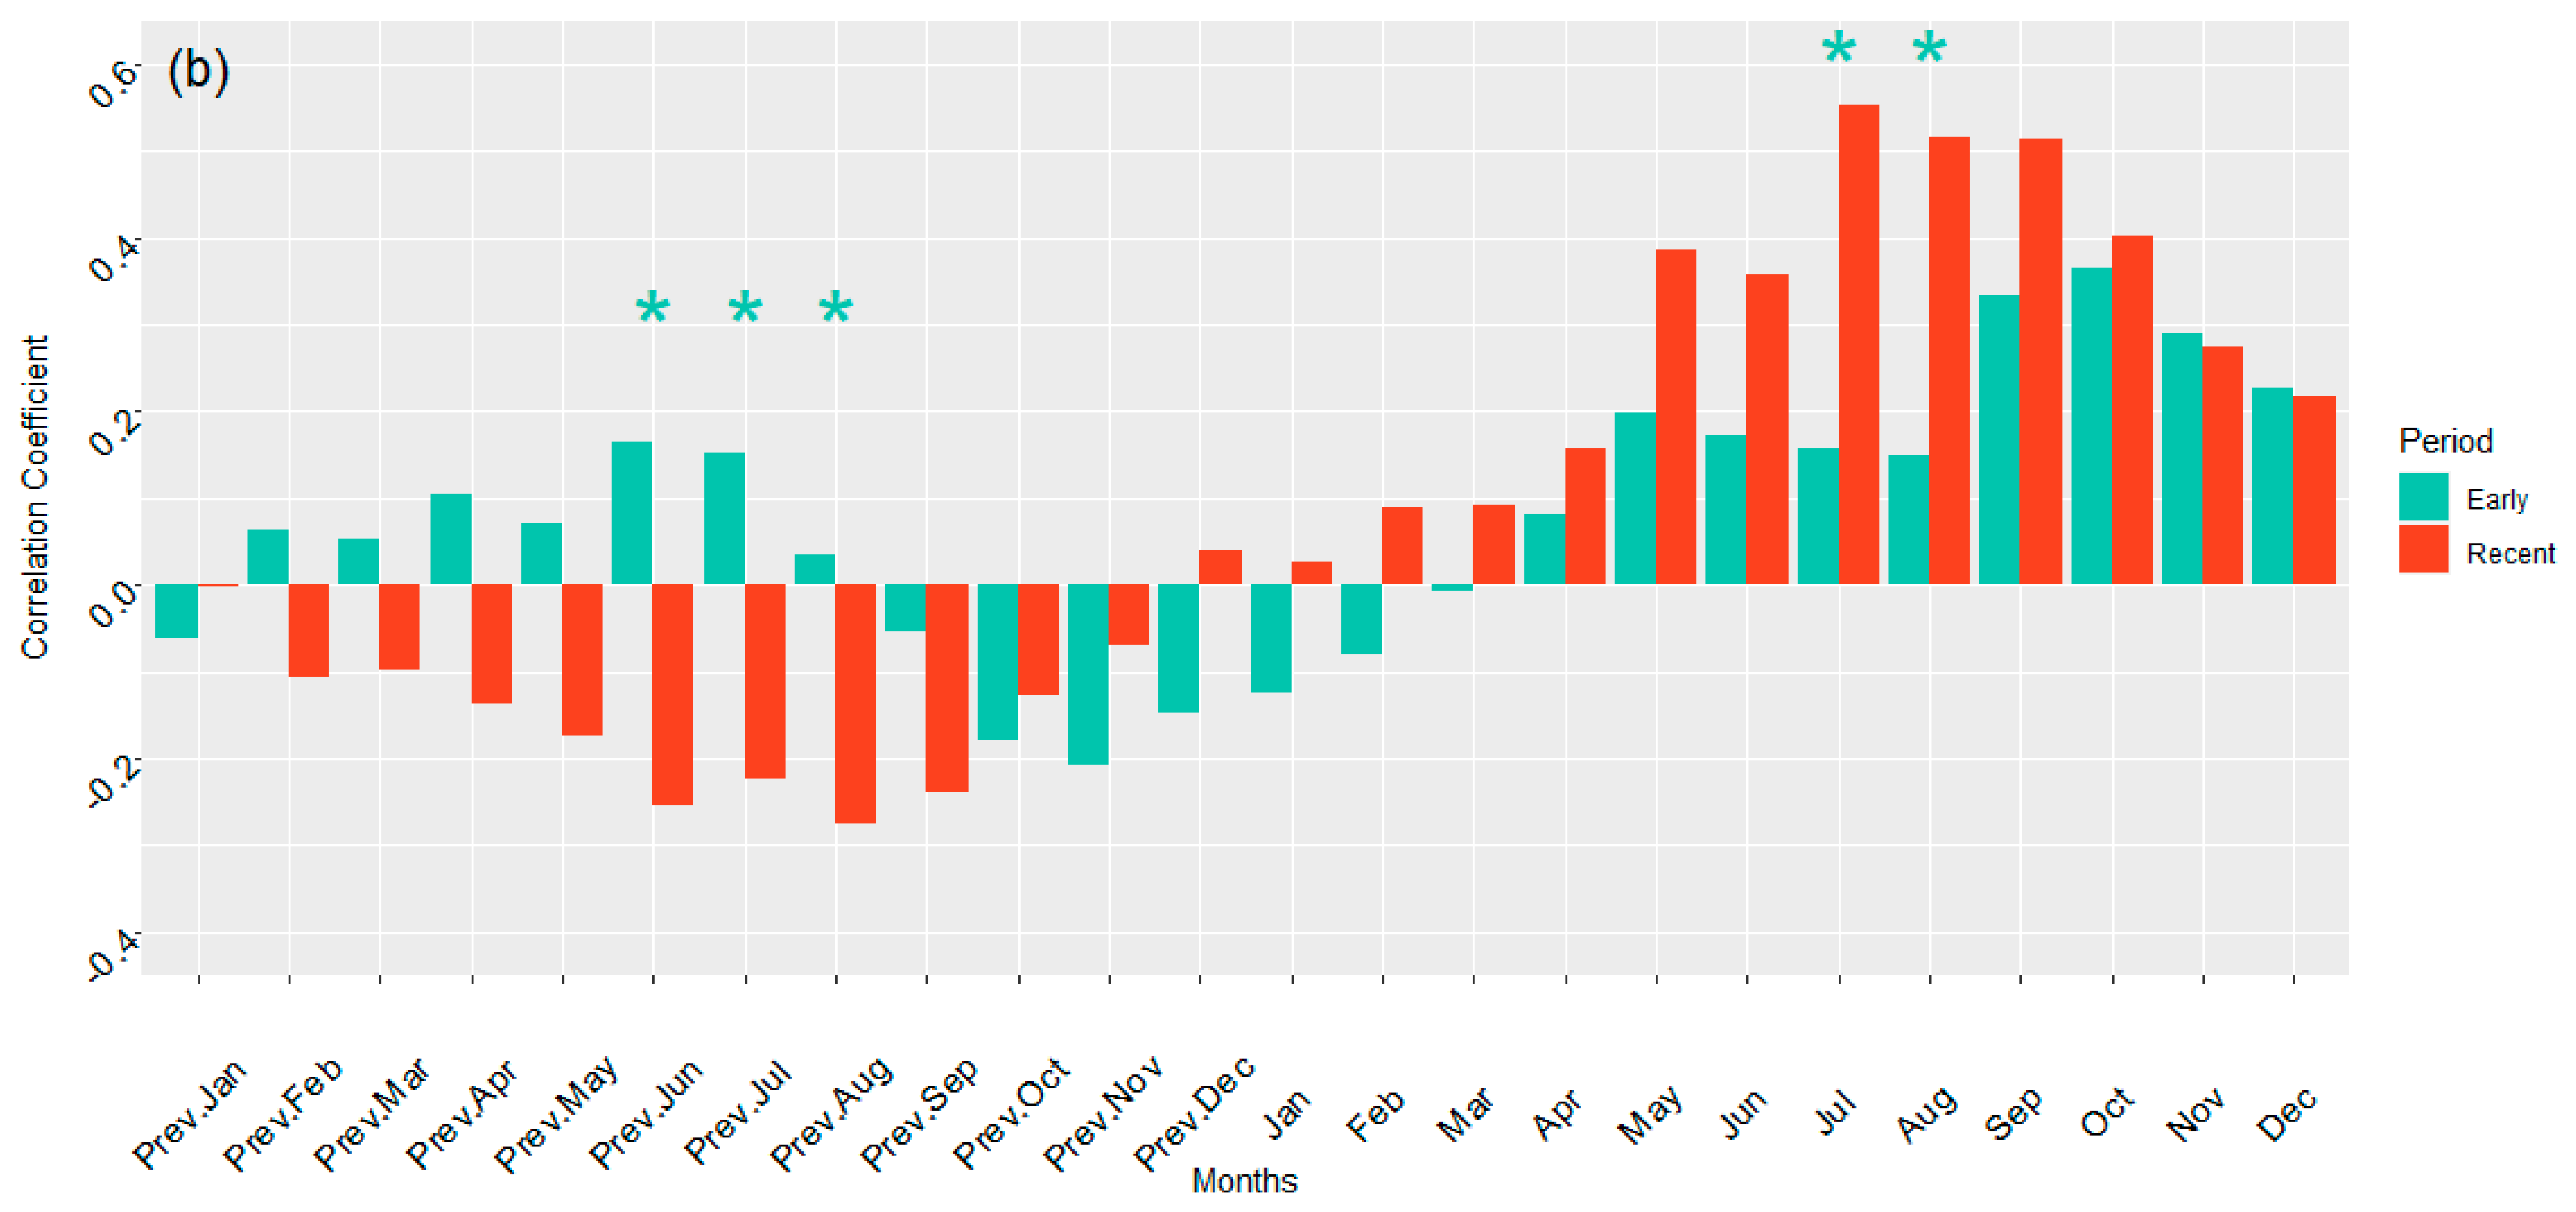
3.3. Temperature Correlation with Growth in ARNWR and GDSNWR

ARNWR average monthly temperature for the early period had the highest correlation value in March (rs = 0.173) and the lowest correlation value in previous January (rs = −0.198) (Figure 4a). Correlation values between the previous and current year lacked a clear trend. The average monthly temperature for the recent period had the highest correlation value in previous December (rs = 0.197) and the lowest correlation value in Previous March (rs= −0.262). Correlation values between previous and current years lacked a clear trend.
GDSNWR average monthly temperature for the late period had the highest correlation value in January (rs = 0.272) and the lowest correlation value in June (rs = −0.384) (Figure 4b). Correlation values between the previous and current year lacked a clear trend. Average monthly temperature and growth for the recent period had the highest correlation value in March (rs = 0.248) and the lowest correlation value in previous October (rs = −0.316), but no clear trend was detected among previous and current years with regard to temperature.

4. Discussion

4.1. Climate-Growth Relationships among Study Periods and Reference Sites

4.1.1. PDSI and Growth

The high values for EPS, interseries correlation (RBAR.eff), and mean SSS support evaluation of the four stands at ARNWR as a single chronology (Table 1). In contrast to the early period in this chronology (1908–1971), the recent period (1972–2013) exhibits a markedly different response of growth to PDSI. At ARNWR, PDSI and growth exhibited a non-significant, positive correlation in 12 of 12 months for the prior year and 9 of 12 months for the current year. We interpret the change as an indication that AWC is more sensitive to increasing seawater concentrations than to increasing inundation. Seawater intrusion into ARNWR is limited by the barrier island system and diluted by precipitation within the 4,755,000-ha Albemarle Sound watershed [37] and by the 141,000-ha Alligator River watershed [81], Goose Creek-Alligator River (HUC12: 030102050903), but salinity may have increased as a cumulative effect of SLR and storms during the 123-year tree-ring chronology. Precipitation (direct and via runoff from the watershed) dilutes salt and other soil toxins such as hydrogen sulfide [82] and alleviates these stresses on AWC. Stotts et al. [49] reported that growth was suppressed following the circa-1920 channelization of the Saint John River in Delaware, and the pattern of correlations of PDSI with growth is similar to the results reported here.
We found evidence that inundation inhibits AWC growth at ARNWR. In contrast to the ARNWR PDSI in the recent period, the early period ARNWR PDSI exhibited a non-significant, negative correlation with growth in 20 of 24 months. Inundation and soil anoxia associated with the seasonally saturated-flooded hydrologic regime [83] limit mineralization and reduce nutrient availability [84,85,86]. Furthermore, roots respire more when exposed to higher water tables in Loblolly Pine-dominated forest of the mid-Atlantic region [87], which has also been reported for our AWC stands [88]. AWC roots can tolerate long-term anoxic soil conditions [32], perhaps due to the species’ ability to create aerenchyma through ethanol production [89], which would reduce the availability of photosynthate and result in the lower growth rate we observed.
In the reference site (GDSNWR), the AWC growth rate response to climate variables diverged from that of ARNWR, perhaps due to differences among hydrogeomorphic regimes. In the recent period, and to a lesser extent in the early period, growth rates of AWC in GDSNWR exhibited a stronger, positive correlation with PDSI during the current growing season (Figure 3b). The higher landscape position (~3 m above MSL), more inland location, and extensive ditching network in GDSNWR have been shown to lower the water tables there in comparison to ARNWR, which is generally <1 m above sea level [31] (Figure 1). GDSNWR growth patterns appear to confirm that reduced water availability can limit growth both above ground [54] and below ground [32] in GDSNWR, but not in ARNWR, where peat helps to maintain soil saturation. Root depth distribution represents a morphological adaptation to water table position [32], which complicates our comparison of the two sites, as deep rooting in GDSNWR prevents desiccation in late summer but exposes roots to excess saturation during early growing season months, resulting in root mortality at GDSNWR, but not at ARNWR. In addition, GDSNWR showed a weaker but still positive response to PDSI in the recent period, which may have been influenced by more extensive ditching efforts between 1955 and 1970 [90]. Ditching within GDSNWR reduces the risk of anoxic stresses there, but lower elevation precludes drainage by ditching at ARNWR.

4.1.2. Temperature and Growth

Unlike PDSI, temperature was neither correlated with growth nor evidenced in seasonal trends in ARNWR or GDSNWR. Geographically positioned near the middle of the range for this species [19], temperature influences at both sites were expected to be minor [91] compared to sites near the northern limit of the range [92]; however, some environmental factors and responses merit discussion. During the current growing season, i.e., during early spring wood formation, growth in ARNWR is positively correlated with temperature (March of the current year) (Figure 3b), which is likely a response to extended growing seasons [93]. In addition, nutrient availability tends to be low due to sequestration within peat, and seasonal organic inputs reach a peak circa August within AWC swamps [13]. Mineralization of this more labile organic matter input may support subsequent growth.

4.2. Hurricane Responses for Both Periods in the Study Site

We found no major or lasting influence of hurricanes on AWC growth (Figure 2). Hurricanes may increase salinity through breaches in the barrier island system and by intensifying wind tides but can also lower salinity through watershed runoff [94]. Indeed, the greatest change we detected for the year after major hurricanes was positive (+26.8%, based on 10-year running average of ring width index) (Figure 2 and Table 1). Ury et al. [56] used remotely sensed data for ARNWR and found that hurricanes coincided with ghost forest formation, especially Hurricane Irene in 2011, which followed a drought. However, our trees showed no directional change in growth for 2011 or for the following 3 years, compared to a 10-year running average. Indeed, all three of the major hurricanes we considered occurred during the recent period, and all three coincided with negative trends in growth. Decreases were fairly minor except for Hurricane Gloria in 1985, after which growth declined by a total of ~15% within 3 years (Table 1). In the growth suppression analysis by Stotts et al. [49], hurricane-induced suppression of AWC was modest and persisted for less than 2 years. In contrast, AWC ghost forests formed following Hurricane Sandy in New Jersey [50,95], and the protection afforded AWC in the hydrogeomorphic regime at ARNWR may be limited.

4.3. Self-Maintenance Implications of Water Level and Salinity

For some wetlands, sediment accretion can keep pace with sea-level rise and maintain pre-disturbance inundation rates. Allochthonous mineral inputs accrete in response to local conditions in swamps [96] and both macro-tidal marshes [97] and micro-tidal marshes [98] and may offset relative sea-level rise, which is also locally variable [99]. Autochthonous organic inputs and peatland formation occur in some settings, and peat accumulation approached 10 m during the last 10,000–12,000 years in GDSNWR [100]. In the microtidal hydrogeomorphic setting at ARNWR, mineral sediment deposits are restricted to storm events [98], and AWC peat accumulation may be limited by seawater intrusion, which suggests that these stands may experience increased exposure to seawater intrusion as sea level continues to rise.
Ury [56] reported 11% of ARNWR forests have been converted into ghost forests, but those losses occurred on the eastern side of the peninsula and may have excluded AWC. Salinity decreases as one travels north and west on the peninsula and declines still further within the Alligator River, probably as a result of dilution by runoff from the 1479.50 km2 watershed [101]. AWC stands are therefore protected by the hydrogeomorphic regime in which the barrier island system restricts tidal exchange in the sounds, the eastern half of the peninsula buffers storms, and salinity in the Alligator River is diluted by riverine discharges. However, Manda et al. [1] and Ferrell et al. [57] contend that sea water can extend from Alligator River to peatlands when wind-driven tides flow through natural and artificial ditches, and the change in monthly PDSI correlations with growth that we detected (Figure 2) supports their claim.

5. Conclusions

Water levels above those needed to saturate soil horizons are stressful to AWC, as detected in the early period (prior to 1972); however, we demonstrated a shift during the recent period, which implies a greater sensitivity to salt. In 2045, sea-level rise across North Carolina is expected to range from 6.1 to 13.7 cm [102], and storm intensity is expected to increase [2]. Given the projections for sea-level rise and probability of increasing storm intensity, it seems likely that geographic position and dilution provide little more than a delay in the loss of these stands and natural resource managers should plan for westward migration of species where higher elevations occur on Pocosin Lakes National Wildlife Refuge and Emily and Richardson Preyer Buckridge Coastal Reserve.

Author Contributions

J.M.D. and R.B.A. conceived and designed the study. J.M.D. performed the field work. J.M.D. and K.E.E. performed the laboratory work and analyzed the data. J.M.D. and R.B.A. interpreted the results and wrote the manuscript. Conceptualization, J.M.D. and R.B.A.; Data curation, J.M.D. and K.E.E.; Formal analysis, J.M.D., K.E.E. and R.B.A.; Funding acquisition, J.M.D., K.E.E. and R.B.A.; Investigation, J.M.D.; Methodology, J.M.D. and R.B.A.; Project administration, J.M.D. and R.B.A.; Resources, J.M.D. and R.B.A.; Software, J.M.D. and K.E.E.; Supervision, J.M.D. and R.B.A.; Validation, J.M.D. and R.B.A.; Visualization, J.M.D. and K.E.E.; Writing—original draft, J.M.D. and R.B.A.; Writing—review and editing, J.M.D. and R.B.A. All authors have read and agreed to the published version of the manuscript.

Funding

This work was supported in part by the U.S. Environmental Protection Agency STAR Grant No. R825799 and by Christopher Newport University.

Institutional Review Board Statement

Not Applicable.

Informed Consent Statement

Not Applicable.

Data Availability Statement

The data presented in this study are available on request from the corresponding author.

Acknowledgments

Dahria Kalmbach assisted with the preparation of the manuscript, Lucas Sharrett constructed the site map, and Matthew Lattanzio and Janet Steven provided statistical support and reviewed an earlier draft of the manuscript. Thanks also go to Chris Cater, Zoë Churchill, Donna Creque, Selena Dejani, Astrid Garcia, Trevor Goodwin, Nicole Guajardo, Heather Harwell, Madison Hodges, Rachel Jenkins, Rebecca Litt, Matt Martwinski, Michael Meyer, Jane Oswalt, David Salomon, Jessica Thompson, Gary Whiting, and Olivia Eden Wong. We appreciate assistance from the Department of Organismal and Environmental Biology and comments provided by the anonymous reviewers.

Conflicts of Interest

The authors declare no conflict of interest.

References

  1. Manda, A.K.; Giuliano, A.S.; Allen, T.R. Influence of artificial channels on the source and extent of saline water intrusion in the wind tide dominated wetlands of the southern Albemarle estuarine system (USA). Env. Earth Sci. 2014, 71, 4409–4419. [Google Scholar] [CrossRef]
  2. Church, J.A.; Clark, P.U.; Cazenave, A.; Gregory, J.M.; Jevrejeva, S.; Levermann, A.; Merrifield, M.A.; Milne, G.A.; Nerem, R.S.; Nunn, P.D.; et al. Sea level change. In Climate Change 2013: The Physical Science Basis; Contribution of Working Group I to the Fifth Assessment Report of the Intergovernmental Panel on Climate Change; IPCC: Geneva, Switzerland, 2013; pp. 1–1535. [Google Scholar]
  3. Magolan, J.; Halls, J. A multi-decadal investigation of tidal creek wetland changes, water level rise, and ghost forests. Remote Sens. 2020, 12, 1141. [Google Scholar] [CrossRef] [Green Version]
  4. Craft, C.; Clough, J.; Ehman, J.; Joye, S.; Park, R.; Pennings, S.; Guo, H.; Machmuller, M. Forecasting the effects of accelerated sea-level rise on tidal marsh ecosystem services. Front. Ecol. Environ. 2009, 7, 73–78. [Google Scholar] [CrossRef] [Green Version]
  5. Conner, W.H.; Day, J.W. The ecology of forested wetlands in the southeastern United States. In Wetlands Ecology and Management; National Institute of Ecology and International Scientific Publications: Jaipur, India, 1982; pp. 69–87. [Google Scholar]
  6. Brinson, M.M. A Hydrogeomorphic Classification of Wetlands; U.S. Army Engineer Waterways Experiment Station: Vicksburg, MS, USA, 1993; pp. 1–103. [Google Scholar]
  7. Kirwan, M.; Gedan, K. Sea-level driven land conversion and the formation of ghost forests. Nat. Clim. Chang. 2019, 9, 450–457. [Google Scholar] [CrossRef] [Green Version]
  8. Schieder, N.W.; Kirwan, M.L. Sea-level driven acceleration in coastal forest retreat. Geology 2019, 47, 1151–1155. [Google Scholar] [CrossRef]
  9. Laderman, A.D. Why does the Freshwater Genus Chamaecyparis Hug Marine Coasts? In Proceedings of the Atlantic White Cedar Restoration Ecology and Management Symposium, Christopher Newport University, Newport News, VA, USA, 31 May–2 June 2000; Atkinson, R.B., Belcher, R.T., Brown, D.A., Perry, J.E., Eds.; VIMS Publication Center: Gloucester Point, VA, USA, 2003; pp. 1–30. [Google Scholar]
  10. Kalm, P.; Forster, J.R.; Joseph Meredith Toner Collection. Travels into North America; Containing Its Natural History, and a Circumstantial Account of Its Plantations and Agriculture in General, with the Civil, Ecclesiastical and Commercial State of the Country, the Manners of the Inhabitants, and Several Curious and Important Remarks on Various Subjects, 2nd ed.; Longman, Hurst, Rees, and Orme; Biodiversity Heritage Library: London, UK, 1812; Volume 1, pp. 1–452. [Google Scholar]
  11. USDA Plants Database. Available online: https://plants.usda.gov/home (accessed on 19 June 2021).
  12. Thompson, G.; Belcher, R.T.; Atkinson, R.B. Soil biogeochemistry in Virginia and North Carolina Atlantic white cedar swamps. In Proceedings of the Atlantic White Cedar Restoration Ecology and Management Symposium, Christopher Newport University, Newport News, VA, USA, 31 May–2 June 2000; Atkinson, R.B., Belcher, R.T., Brown, D.A., Perry, J.E., Eds.; VIMS Publication Center: Gloucester Point, VA, USA, 2003; pp. 113–124. [Google Scholar]
  13. DeBerry, J.W.; Atkinson, R.B. Aboveground forest biomass and litter production patterns in Atlantic white cedar swamps of differing hydroperiods. Southeast. Nat. 2014, 13, 673–690. [Google Scholar] [CrossRef]
  14. Weiser, J.L. The Effect of Water Levels on Carbon Dioxide Emissions from Soil Microcosms in the Great Dismal Swamp. Master’s Thesis, Christopher Newport University, Newport News, VA, USA, 2014. [Google Scholar]
  15. Duttry, P.M.; Thompson, G.; Belcher, R.T.; Atkinson, R.B. Soil respiration response to fluctuating water levels in laboratory columns of soils from AWC peatlands and mitigation sites in Virginia and North Carolina. In Proceedings of the Atlantic White Cedar Restoration Ecology and Management Symposium, Christopher Newport University, Newport News, VA, USA, 31 May–2 June 2000; Atkinson, R.B., Belcher, R.T., Brown, D.A., Perry, J.E., Eds.; VIMS Publication Center: Gloucester Point, VA, USA, 2003; pp. 165–174. [Google Scholar]
  16. Crawford, E.R.; Day, F.P.; Atkinson, R.B. Decomposition dynamics in an Atlantic white cedar restoration site. In Proceedings of the Arlington Echo Symposium, Asheville, NC, USA, 2–4 June 2003; Burke, M.K., Sheridan, P., Eds.; Department of Agriculture Forest Service: Asheville, NC, USA, 2005; pp. 11–16. [Google Scholar]
  17. Korstian, C.F.; Brush, W.D. Southern White Cedar, 1st ed.; U.S. Department of Agriculture: Washington, DC, USA, 1931; pp. 1–1485.
  18. Little, S., Jr. Ecology and Silviculture of Whitecedar and Associated Hardwoods in Southern New Jersey; Yale University School of Forestry Bulletin: New Haven, CT, USA, 1950; pp. 1–134. [Google Scholar]
  19. Laderman, A.D. The Ecology of Atlantic White Cedar Wetlands: A Community Profile; U.S. Fish and Wildlife Service: Washington, DC, USA, 1989; Volume 85, pp. 1–125.
  20. Ponnamperuma, F.N. The chemistry of submerged soils. Adv. Agron. 1972, 24, 29–92. [Google Scholar]
  21. Mitsch, W.J.; Gosselink, J.G. Wetlands, 5th ed.; Wiley: Hoboken, NJ, USA, 1993; p. 736. [Google Scholar]
  22. Tiner, R.W. Wetland Indicators: A Guide to Wetland Formation, Identification, Delineation, Classification, and Mapping, 2nd ed.; CRC Press: New York, NY, USA, 2017; pp. 1–631. [Google Scholar]
  23. Kozlowski, T.T. Responses of woody plants to flooding and salinity. Tree Physiol. 1997, 17, 490. [Google Scholar] [CrossRef]
  24. Conner, W.; Song, B.; Williams, T.; Vernon, J. Long-term tree productivity of a South Carolina coastal plain forest across a hydrology gradient. J. Plant Ecol. 2011, 4, 67–76. [Google Scholar] [CrossRef] [Green Version]
  25. Shaler, N.S. General Account of the Fresh-Water Morasses of the United States; with a Description of Virginia and North. Carolina, 10th Annual Report for 1888–1889; U.S. Government Printing Office: Washington, DC, USA, 1890; pp. 1–124.
  26. Lilly, J.P. The Blackland Soils of North Carolina, Their Characteristics and Management for Agriculture; N.C. Agricultural Research Service technical bulletin no. 270; North Carolina State University: Raliegh NC, USA, 1981; pp. 1–70. [Google Scholar]
  27. Megonigal, J.P.; Day, F.P. Effects of flooding on root and shoot production of bald cypress in large experimental enclosures. Ecology 1992, 73, 1182–1193. [Google Scholar] [CrossRef]
  28. Conner, W.H.; Day, J.W. Productivity and composition of a bald cypress-water tupelo site and a bottomland hardwood site in a Louisiana swamp. Am. J. Bot. 1976, 63, 1354–1364. [Google Scholar] [CrossRef]
  29. Conner, W.H.; Gosselink, J.G.; Parrondo, R.T. Comparison of the vegetation of three Louisiana swamp sites with different flooding regimes. Am. J. Bot. 1981, 68, 320–331. [Google Scholar] [CrossRef]
  30. Ehrenfeld, J.G. Microtopography and vegetation in Atlantic white cedar swamps; the effects of natural disturbances. Can. J. Bot. 1995, 73, 474–484. [Google Scholar] [CrossRef]
  31. Atkinson, R.B.; Loomis, D.T.; DeBerry, J.W.; Crawford, E.R.; Belcher, R.T. Water tables in Atlantic white cedar swamps: Implications for restoration. In Proceedings of the Atlantic White Cedar Restoration Ecology and Management Symposium, Christopher Newport University, Newport News, VA, USA, 31 May–2 June 2000; Atkinson, R.B., Belcher, R.T., Brown, D.A., Perry, J.E., Eds.; VIMS Publication Center: Gloucester Point, VA, USA, 2003; pp. 137–150. [Google Scholar]
  32. Rodgers, H.L.; Day, F.P.; Atkinson, R.B. Fine root dynamics in two Atlantic white-cedar wetlands with contrasting hydroperiods. Wetlands 2003, 23, 941–949. [Google Scholar] [CrossRef]
  33. Brown, D.A.; Atkinson, R.B. Remote sensing interpretation of twenty-five years of Atlantic white cedar clearcutting in North Carolina. In Proceedings of the Atlantic White Cedar Restoration Ecology and Management Symposium, Christopher Newport University, Newport News, VA, USA, 31 May–2 June 2000; Atkinson, R.B., Belcher, R.T., Brown, D.A., Perry, J.E., Eds.; VIMS Publication Center: Gloucester Point, VA, USA, 2003; pp. 55–66. [Google Scholar]
  34. Harrison, J.M.; DeBerry, J.W.; Belcher, R.T.; Loomis, D.T.; Atkinson, R.B. Effects of water table on survival and growth of Atlantic white cedar in two young planted sites. In Proceedings of the Atlantic White Cedar Restoration Ecology and Management Symposium, Christopher Newport University, Newport News, VA, USA, 31 May–2 June 2000; Atkinson, R.B., Belcher, R.T., Brown, D.A., Perry, J.E., Eds.; VIMS Publication Center: Gloucester Point, VA, USA, 2003; pp. 181–196. [Google Scholar]
  35. Cook, J.W.B.; Foster, E.M.; Atkinson, R.B. Effect of hydrology on post-fire survival and growth of containerized seedlings, rooted cuttings, and naturally-regenerated Atlantic white cedar in the Great Dismal Swamp National Wildlife Refuge. In Proceedings of the Restoration and Management of Atlantic White Cedar Swamps Symposium, Suffolk, VA, USA, 12–14 June 2012; Belcher, R.T., Hudson, H.W., Eds.; Great Dismal Swamp National Wildlife Refuge: Suffolk, VA, USA, 2015; pp. 1–15. [Google Scholar]
  36. Foster, E.M.; Cook, J.W.B.; Atkinson, R.B. Post-fire survival and growth of containerized seedlings, rooted cuttings, and natural regenerants of Atlantic white cedar (Chamaecyparis thyoides) in the Great Dismal Swamp National Wildlife Refuge. In Proceedings of the Restoration and Management of Atlantic White Cedar Swamps Symposium, Suffolk, VA, USA, 12–14 June 2012; Belcher, R.T., Hudson, H.W., Eds.; Great Dismal Swamp National Wildlife Refuge: Suffolk, VA, USA, 2015; pp. 16–27. [Google Scholar]
  37. Giese, G.L.; Wilder, H.B.; Parker, G.G., Jr. Hydrology of Major Estuaries and Sounds of North Carolina; U.S. Government Printing Office: Washington, DC, USA, 1985; pp. 1–119.
  38. Anderson, R.R.; Brown, R.G.; Rappleye, R.D. Water quality and plant distribution along the upper Patuxent River, Maryland. Chesap. Sci. 1968, 9, 145–156. [Google Scholar] [CrossRef]
  39. Atkinson, R.B.; Bodkin, N.L.; Perry, J.E. New county records collected in tidal wetlands of four coastal plain counties along the James River, Virginia. Castanea 1990, 55, 55–64. [Google Scholar]
  40. Perry, J.E.; Atkinson, R.B. York River Tidal Marshes. J. Coast. Res. 2009, 10057, 40–49. [Google Scholar] [CrossRef]
  41. Kirwan, M.; Kirwan, J.; Copenheaver, C. Dynamics of an estuarine forest and its response to rising sea level. J. Coast. Res. 2007, 23, 457–463. [Google Scholar] [CrossRef]
  42. Poulter, B.; Christensen, N.L.; Qian, S.S. Tolerance of Pinus taeda and Pinus serotina to low salinity and flooding: Implications for equilibrium vegetation dynamics. J. Veg. Sci. 2008, 19, 15–22. [Google Scholar] [CrossRef]
  43. Bowen, B.D. Dendroecological Assessment of Loblolly Pine (Pinus taeda) along a Salinity Gradient within the York River Subestuary in Virginia. Master’s Thesis, Christopher Newport University, Newport News, VA, USA, 2016. [Google Scholar]
  44. Robichaud, A.; Bégin, Y. The effects of storms and sea-level rise on a coastal forest margin in New Brunswick, Eastern Canada. J. Coast. Res. 1997, 13, 429–439. [Google Scholar]
  45. Weakley, A.S.; Ludwig, J.C.; Townsend, J.F. Flora of Virginia; Crowder, B., Ed.; Botanical Research Institute of Texas Press: Fort Worth, TX, USA, 2012. [Google Scholar]
  46. Yanosky, T.; Hupp, C.; Hackney, C. Chloride concentrations in growth rings of Taxodium distichum in a saltwater-intruded estuary. Ecol. Appl. 1995, 5, 785–792. [Google Scholar] [CrossRef]
  47. Krauss, K.W.; Duberstein, J.A.; Doyle, T.W.; Conner, W.H.; Day, R.H.; Inabinette, L.W.; Whitbeck, J.L. Site condition, structure, and growth of Bald cypress along tidal/non-tidal salinity gradients. Wetlands 2009, 29, 505–519. [Google Scholar] [CrossRef]
  48. Hinesley, E.; North Carolina State University, Raleigh, NC, USA. Personal communication, 2021.
  49. Stotts, S.; Callahan, J.; Gulledge, O. Impact of channel dredging and straightening in an Atlantic white cedar (Chamaecyparis thyoides L. (B.S.P.)) freshwater tidal wetland. J. Coast. Res. 2021, 1, 1–14. [Google Scholar]
  50. Williams, B.; Pine Creek Forestry, Laurel Springs, NJ, USA. Personal communication, 2020.
  51. Reddy, A.; Hawbaker, T.; Wurster, F.; Zhu, Z.; Ward, S.; Newcomb, D.; Murray, R. Quantifying soil carbon loss and uncertainty from a peatland wildfire using multi-temporal LiDAR. Remote Sens. Environ. 2015, 170, 306–316. [Google Scholar] [CrossRef] [Green Version]
  52. Trettin, C.; Jurgensen, M.F.; Grigal, D.F.; Gale, M.R.; Jeglum, J.K. Northern Forested Wetlands: Ecology and Management, 1st ed.; Lewis Publishers: New York, NY, USA, 1997; pp. 1–512. [Google Scholar]
  53. Keeland, B.D.; Sharitz, R.R. Seasonal growth patterns of Nyssa sylvatica var. Biflora, Nyssa aquatica, and Taxodium distichum as affected by hydrologic regime. Can. J. For. Res. 1995, 25, 1084–1096. [Google Scholar] [CrossRef]
  54. Atkinson, R.B. Growth rates of Atlantic white cedar depend on hydrologic regimes at two time scales. Wetlands 2020, 40, 1–12. [Google Scholar] [CrossRef]
  55. Heddinghaus, T.R.; Sabol, P.A. Review of the Palmer drought severity index and where do we go from here? In Proceedings of the 7th conference on Applied Climatology, Salt Lake City, UT, USA, 10–13 September 1991; pp. 242–246. [Google Scholar]
  56. Ury, E.A.; Yang, X.; Wright, J.P.; Bernhardt, E.S. Rapid deforestation of a coastal landscape driven by sea-level rise and extreme events. Ecol. Appl. 2021, 31, e2339. [Google Scholar] [CrossRef] [PubMed]
  57. Ferrell, G.M.; Strickland, A.G.; Spruill, T.B. Effects of canals and roads on hydrologic conditions and health of Atlantic white cedar at the Emily and Richardson Preyer Buckridge Coastal Reserve, North Carolina, 2003–2006. Geol. Surv. 2007, 1–188. [Google Scholar] [CrossRef]
  58. Stewart, D.; Alligator River National Wildlife Refuge, Manteo, NC, USA. Personal communication, 2003.
  59. Alligator River National Wildlife Refuge Annual Narrative Report; U.S. Fish and Wildlife Service: Washington, DC, USA, 2007; pp. 1–110.
  60. Alligator River National Wildlife Refuge Comprehensive Conservation Plan; U.S. Fish and Wildlife Service: Washington, DC, USA, 2008; pp. 1–260.
  61. Official Series Description—PUNGO Series. Available online: https://soilseries.sc.egov.usda.gov/OSD_Docs/P/PUNGO.html (accessed on 20 June 2021).
  62. Shacochis, K.M.; DeBerry, J.W.; Loomis, D.T.; Belcher, R.T.; Atkinson, R.B. Vegetation importance values and weighted averages of Atlantic white cedar stands in Great Dismal Swamp and Alligator River National Wildlife Refuges. In Proceedings of the Atlantic White Cedar Restoration Ecology and Management Symposium, Christopher Newport University, Newport News, VA, USA, 31 May–2 June 2000; Atkinson, R.B., Belcher, R.T., Brown, D.A., Perry, J.E., Eds.; VIMS Publication Center: Gloucester Point, VA, USA, 2003; pp. 227–234. [Google Scholar]
  63. Great Dismal Swamp—U.S. Fish and Wildlife Service. Available online: https://www.fws.gov/refuge/great_dismal_swamp/ (accessed on 21 June 2021).
  64. Carter, A.R. Cedar Restoration in the Dismal Swamp of Virginia and North. Carolina; Laderman, A.D., Ed.; Westview Press: Boulder, CO, USA, 1987; pp. 323–325. [Google Scholar]
  65. Atkinson, R.B.; Morgan, T.E.; Belcher, R.T.; Brown, D.A. The role of historical inquiry in the restoration of Atlantic white cedar swamps. In Proceedings of the Atlantic White Cedar Restoration Ecology and Management Symposium, Christopher Newport University, Newport News, VA, USA, 31 May–2 June 2000; Atkinson, R.B., Belcher, R.T., Brown, D.A., Perry, J.E., Eds.; VIMS Publication Center: Gloucester Point, VA, USA, 2003; pp. 43–54. [Google Scholar]
  66. Duberstein, J.; Krauss, K.W. Forest Community Biomass and Growth in Great Dismal Swamp, Virginia and North Carolina, USA [Data Set]; U.S. Geological Survey: Reston, VA, USA, 2018.
  67. Day, F.P. Litter accumulation in four plant communities in the Dismal Swamp, Virginia. Am. Midl. Nat. 1979, 102, 281–289. [Google Scholar] [CrossRef]
  68. Great Dismal Swamp National Wildlife Refuge and Nansemond National Wildlife Refuge Final Comprehensive Conservation Plan; U.S. Fish and Wildlife Service: Washington, DC, USA, 2006; pp. 1–272.
  69. Patterson, C.L.; Atkinson, R.B. Radial growth of peatland Atlantic white cedar (Chamaecyparis thyoides) in Great Dismal Swamp National Wildlife Refuge and its association with Lake Drummond water levels. In Proceedings of the Restoration and Management of Atlantic White Cedar Swamps Symposium, Suffolk, VA, USA, 12–14 June 2012; Belcher, R.T., Hudson, H.W., Eds.; Great Dismal Swamp National Wildlife Refuge: Suffolk, VA, USA, 2015; p. 102. [Google Scholar]
  70. Merry, S.D. Factors Affecting Tree Ring Width in Atlantic White Cedar, Chamaecyparis thyoides (L.) B.S.P., within Great Dismal Swamp National Wildlife Refuge and Alligator River National Wildlife Refuges. Master’s Thesis, Christopher Newport University, Newport News, VA, USA, 2005. [Google Scholar]
  71. Stokes, M.A.; Smiley, T.C. An Introduction to Tree-Ring Dating; The University of Arizona Press: Tucson, AZ, USA, 1996; pp. 1–73. [Google Scholar]
  72. Copenheaver, C.A.; Kyle, K.H.; Stevens, G.N.; Kamp, M.H. Comparing Juniperus virginiana tree-ring chronologies from forest edge vs. forest interior positions in the Cedars Natural Area Preserve in Virginia, USA. Dendrochronologia 2005, 23, 39–45. [Google Scholar] [CrossRef]
  73. Bunn, A.; Korpela, M.; Biondi, F.; Campelo, F.; Mérian, P.; Qeadan, F.; Zang, C.; Buras, A.; Cecile, J.; Mudelsee, M.; et al. DplR: Dendrochronology Program Library in R; R package version 1.7.2. 2021. Available online: https://cran.r-project.org/web/packages/dplR/index.html (accessed on 21 June 2021).
  74. The R Project for Statistical Computing. Available online: https://www.R-project.org/ (accessed on 21 June 2021).
  75. RStudio: Integrated Development Environment for R. RStudio. Available online: http://www.rstudio.com/.http://www.rstudio.com (accessed on 21 June 2021).
  76. Cook, E.; Pederson, N. Uncertainty, emergence, and statistics in dendrochronology. Dendroclimatol. Prog. Prospect. 2011, 11, 77–112. [Google Scholar]
  77. Wigley, T.M.L.; Briffa, K.R.; Jones, P.D. On the average value of correlated time series, with applications in dendroclimatology and hydrometeorology. J. Appl. Meteorol. Climatol. 1984, 23, 201–213. [Google Scholar] [CrossRef]
  78. Divisional Data Select. Available online: https://www7.ncdc.noaa.gov/CDO/CDODivisionalSelect.jsp# (accessed on 21 June 2021).
  79. Historical Hurricane Tracks. Available online: https://coast.noaa.gov/hurricanes/#map=4/32/-80 (accessed on 21 June 2021).
  80. Benjamini, Y.; Hochberg, Y. Controlling the false discovery rate: A practical and powerful approach to multiple testing. J. Royal Stat. Soc. B 1995, 57, 289–300. [Google Scholar] [CrossRef]
  81. EnviroAtlas. Available online: https://enviroatlas.epa.gov/enviroatlas/interactivemap/ (accessed on 18 June 2021).
  82. Hackney, C.T.; Avery, G.B. Tidal wetland community response to varying levels of flooding by saline water. Wetlands 2015, 35, 227–236. [Google Scholar] [CrossRef]
  83. Wetlands Subcommittee. Classification of Wetlands and Deepwater Habitats of the United States; Federal Geographic Data Committee: Reston, VA, USA, 2013; pp. 1–91.
  84. Reddy, K.R.; Patrick, W.H. Effect of alternate aerobic and anaerobic conditions on redox potential, organic matter decomposition and nitrogen loss in a flooded soil. Soil Biol. Biochem. 1975, 7, 87–94. [Google Scholar] [CrossRef]
  85. Moore, T.R.; Dalva, M. Methane and carbon dioxide exchange potentials of peat soils in aerobic and anaerobic laboratory incubations. Soil Biol. Biochem. 1997, 29, 1157–1164. [Google Scholar] [CrossRef]
  86. Vompersky, S.E.; Sirin, A.J. Hydrology of drained forested wetlands. In Northern Forested Wetlands Ecology and Management, 1st ed.; Trettin, C.C., Jurgensen, M.F., Grigal, D.F., Gale, M.R., Jeglum, J.K., Eds.; CRC Press: Boca Raton, FL, USA, 1996; pp. 189–211. [Google Scholar]
  87. Mirda, C.G. The Effects of Water Table on Soil Carbon Dioxide Emissions in Cavalier Wildlife Management Area: The Contributions of Root and Microbial Respiration. Master’s Thesis, Christopher Newport University, Newport News, VA, USA, 2018. [Google Scholar]
  88. Kalnins, M. Empirically Derived Estimates of Gaseous Carbon Loss from Peatlands in North-Central Alberta, Canada, and Northeastern North Carolina, USA. Master’s Thesis, Christopher Newport University, Newport News, VA, USA, 2000. [Google Scholar]
  89. Kelsey, R.G.; Joseph, G.; McWilliams, M.G. Ethanol synthesis by anoxic root segments from five cedar species relates to their habitat attributes but not their known differences in vulnerability to Phytophthora lateralis root disease. Can. J. For. Res. 2011, 41, 1202–1211. [Google Scholar] [CrossRef]
  90. Wurster, F.; Great Dismal Swamp National Wildlife Refuge, Suffolk, VA, USA. Personal communication, 2021.
  91. Seim, A.M. The Effect of Climate on the Growth of Red Maple (Acer rubrum L.) and Atlantic White Cedar (Chamaecyparis thyoides (L.) B.S.P.) in the Great Dismal Swamp National Wildlife Refuge. Master’s Thesis, Christopher Newport University, Newport News, VA, USA, 2005. [Google Scholar]
  92. Pearl, J.K.; Anchukaitis, K.J.; Pederson, N.; Donnelly, J.P. Reconstructing northeastern United States temperatures using Atlantic white cedar tree rings. Environ. Res. Lett. 2017, 12, 1–10. [Google Scholar] [CrossRef]
  93. Hwang, T.; Martin, K.L.; Vose, J.M.; Wear, D.; Miles, B.; Kim, Y.; Band, L.E. Nonstationary hydrologic behavior in forested watersheds is mediated by climate-induced changes in growing season length and subsequent vegetation growth. Water Resour. Res. 2018, 54, 5359–5375. [Google Scholar] [CrossRef]
  94. Williams, K.; MacDonald, M.; Sternberg, L.D. Interactions of storm, drought, and sea-level rise on coastal forest: A case study. J. Coast. Res. 2003, 19, 1116–1121. [Google Scholar]
  95. Zimmermann, G.; Stockton University, Galloway, NY, USA. Personal communication, 2020.
  96. Conner, W.H.; Day, J.W. Variations in vertical accretion in a Louisiana Swamp. J. Coast. Res. 1991, 7, 617–622. [Google Scholar]
  97. Sutter, L.A.; Chambers, R.M.; Perry, J.E. Seawater intrusion mediates species transition in low salinity, tidal marsh vegetation. Aquat. Bot. 2015, 122, 32–39. [Google Scholar] [CrossRef]
  98. Friedrichs, C.T.; Perry, J.E. Tidal salt marsh morphodynamics: A synthesis. J. Coast. Res. 2001, 27, 7–37. [Google Scholar]
  99. Waldron, M.C.B.; Carter, G.A.; Biber, P.D. Using aerial imagery to determine the effects of sea-level rise on fluvial marshes at the mouth of the Pascagoula River (Mississippi, USA). J. Coast. Res. 2021, 37, 389–407. [Google Scholar]
  100. Whitehead, R.D. Developmental and environmental history of the Dismal Swamp. Ecol. Monogr. 1972, 42, 301–315. [Google Scholar] [CrossRef]
  101. Watershed Report. Available online: https://watersgeo.epa.gov/watershedreport/?comid=10484491#streamcat-data (accessed on 23 June 2021).
  102. CRC Science Panel. North Carolina Sea Level Rise Assessment Report; North Carolina Department of Natural and Cultural Resources: Raleigh, NC, USA, 2015; pp. 1–43.
Figure 1. Location of Great Dismal Swamp National Wildlife Refuge (GDSNWR) and Alligator River National Wildlife Refuge (ARNWR). Alligator River forms the western boundary of the Albemarle-Pamlico Peninsula.
Forests 12 00973 g001
Figure 2. Ring Width Index (RWI) for the full study period, 1895–2018. ARNWR (dashed blue) spans 1895–2018 and GDSNWR (red) spans 1919–2003. Years 1971/1972 denote division of early and recent periods. The five most intense named hurricanes in ARNWR (based on wind speed in the area of interest) and three of regional importance from published studies are labeled. Higher names indicate greater relative intensity.
Forests 12 00973 g002
Figure 3. Spearman correlations in each month of 24-month window (12 months in current year and 12 in the previous year) based on standardized tree ring chronology and Palmer Drought Severity Index (PDSI) for ARNWR (a) and GDSNWR (b) sites. Each site is further divided into time periods including early (pre-1972, teal) and recent (post-1972, red). Significant correlations are denoted by “*”, and colors correspond with periods.
Forests 12 00973 g003aForests 12 00973 g003b
Figure 4. Spearman correlations in each month of 24-month window (12 months in the current year and 12 in the previous year) based on standardized tree ring chronology and average monthly temperature for ARNWR (a) and GDSNWR (b) sites. Each site is further divided into time periods including early (pre-1972, teal) and recent (post-1972, red). Significant correlations are denoted by “*” and colors correspond with periods.
Forests 12 00973 g004
Table 1. Descriptive information for five major named hurricanes within the AOI, 20 nautical miles (37 km) of ARNWR during the study period (1895–2018), and an additional three of regional importance [37,51,56]. Maximum Sustained Windspeed in knots (kt) is reported. Percent Change is the deviation from 10-year running average of RWI prior to the current year. Lags are in the current year, one, two, and three years post-hurricane, all contrasting the same 10-year period for each hurricane.
YearHurricane NameMax Wind Speed in AOI (kt)10-Year Running Average RWIPercent Change from 10-Year Average
+0+1+2+3
1954Hazel800.92628.269−11.08922.44939.807
1955Connie, Ione85, 650.984−7.92926.80144.7763.944
1960Donna850.966−1.62213.9186.1076.929
1964Cleo401.010−10.034−14.3780.4345.218
1985Gloria901.0212.273−14.681−10.487−14.670
2003Isabel850.9817.507−5.390−2.230−4.045
2011Irene650.9863.3370.366−5.243−2.396
Table 2. Descriptive statistics of ARNWR and GDSNWR chronologies during full, early, and recent periods.
ARNWR GDSNWR
Full Early Recent Full Early Recent
Number of Trees
(number of time series)
103 (420)102 (416)103 (419)42 stem cuts (≥168 radii)42 stem cuts (≥168 radii)42 stem cuts (≥168 radii)
Chronology Length
(years)
1895–2018
(123)
1895–1971
(76)
1972–2018
(46)
1919–2003
(84)
1919–1971
(52)
1972–2003
(31)
Mean Age 62.25 28.88 33.69 81.26 49.26 32
Median Age 61 30 32 81 49 32
Signal-to-Noise Ratio (SNR) 31.147 38.57 28.341 43.888 64.379 28.565
Mean Subsample Signal Strength (SSS) 0.8175 0.7859 0.9659 0.9943 0.9935 1
Expressed Population Signal (EPS) 0.969 0.975 0.966 0.978 0.985 0.966
Effective Average Correlation Between Series (RBAR.eff) 0.184 0.273 0.126 0.522 0.623 0.405
Publisher’s Note: MDPI stays neutral with regard to jurisdictional claims in published maps and institutional affiliations.

