Article

Forest Biomass Collection from Systematic Mulching on Post-Fire Pine Regeneration with BioBaler WB55: Productivity, Cost and Comparison with a Conventional Treatment

1
Department of Forest and Environmental Engineering and Management, Universidad Politécnica de Madrid, E.T.S.I. Montes, Forestal y del Medio Natural, C/José Antonio Nováis 10, 28040 Madrid, Spain
2
Centro de Desarrollo de Energías Renovables—Centro de Investigaciones Energéticas Medioambientales y Tecnológicas CEDER-CIEMAT, (Renewable Energies Development Center—Energy, Environment and Technology Research Center), Highway A-15, km 56, 42290 Lubia, Soria, Spain
*
Author to whom correspondence should be addressed.
Submission received: 22 June 2021 / Revised: 15 July 2021 / Accepted: 20 July 2021 / Published: 23 July 2021
(This article belongs to the Section Forest Operations and Engineering)

Abstract

:
Post-wildfire regenerated Mediterranean pine stands have a high risk of wildfire recurrence. Preventive clearings are frequently applied in a mix of systematic and selective ways, being a potential biomass source using technologies such as the collector-bundler BioBaler WB55. Our research aimed to compare the BioBaler with a chain mulcher performing systematic mulching of 50% vs. 67% of stand surface over 11.4 ha dominated by Pinus pinaster Ait. regenerated after a severe wildfire. Time studies included the machinery GPS follow-up and the weighing of each produced bale. Environmental aspects were also assessed. A regression curve related BioBaler weight productivity (odt·Workh−1) to pine biovolume (cover (%) average tree height, m). Surface productivity (stand ha·Workh−1) was greater for both technologies when a lower percentage of the total surface was cleared, but less than theoretically predicted. The BioBaler’s economic balance, including the cost of further selective clearing and the income from biomass selling, was costlier than that of the mulcher—in the most representative strata, 475 EUR·ha−1 vs. 350 EUR·ha−1. Under the studied conditions, BioBaler was not economically competitive with the conventional treatment, its main constraint being low collection efficiency (31% of the standing biomass in the cleared surface, 5.33 out of 17.1 fresh tonnes·ha−1).

1. Introduction

As almost 91,000 ha per year of forest land has burned over the last decade in Spain [1] and climate change will increase the fire danger potential in Mediterranean forests [2], improvements in forest fire prevention as well as suppression have become critical. Restoration and improvement treatments on post-fire natural regenerated Pinus pinaster Ait. stands are essential to reduce forest fire hazards, improve forest vigor, and increase early fruiting [3], as these pyrophytic young stands are usually very dense, and a second fire could seriously damage regeneration capacity and stand quality [4]. To this end, systematic mulching and further selective clearing is a common treatment in these Mediterranean young stands. This treatment generally consists of two steps: a systematic mechanical mulching on strips and a selective motor–manual clearing with brush cutters or chainsaws between those mulched strips. Chain or hammer mulchers attached to bulldozers or farm tractors are the conventional technologies used in the first step of this treatment, so that the cut biomass is left on the ground [5]. In Galicia (northern Spain), such treatments in post-wildfire regenerated pine stands have also been performed using vertical axis chain mulchers [6]. Other Canadian trials used different mulchers for similar work: a Fecon FTX 140 mid-sized non-articulated mulcher for strip thinning high density pine regeneration [7,8] or a Rayco C130 mulcher in a forest reduction treatment [9]. All these machines leave the biomass on the ground.
As an increase in biomass demand is expected in a growing bioeconomy with the current European targets to reduce greenhouse gas emissions by at least 55% by 2030 and to become climate neutral by 2050 [10], other alternatives should be considered. Some commercial machines can simultaneously mulch and harvest the biomass, obtaining loose or baled biomass. Two types of commercial mulcher-harvesters can be found: tractor-mounted mulchers with an outlet chute to propel the biomass to another vehicle with a trailer, mostly used for energy crops, and all-in-one machines with mulcher, chute and trailer for shredded biomass, such as AHWI BMH 480 or Serrat Oli Pack. Very little information is available about the productivity and cost of these latter machines [11]. Additionally, different prototypes are known to be under development, such as RetraBio in Spain. It is a modified forwarder with a front mulcher and a chute that propels shredded biomass into a rear container [12]. Regarding mulching–baling, two machines are currently available on the market: the Gyro-Trac BBS-XP, with hardly any information on operational conditions and productivity, and the BioBaler WB55 from the Canadian Anderson group.
Biobaler WB55 is an alternative to conventional mulchers. This machine can harvest woody material between 1 and 10 cm in diameter [13]. The Biobaler is a harvesting and baling technology designed to continuously cut and process the biomass into 1.2 m wide by 1.2 m diameter bales, which facilitates biomass forwarding and further handling operations. This biomass could then be used for renewable energy production or bio-based products. As the high cost of manual clearing is an economic barrier to these treatments, an objective in collecting biomass is to reduce their cost on a per hectare basis, in order to achieve their self-financing.
In Canada and the United States, the BioBaler has been used to clear wild brush, forest understory, and encroaching small trees to improve land management in Tennessee [13], Quebec, Ontario and Minnesota [14], and Florida [15], and to bale woody biomass in a forest application in Georgia, Alabama [16], and Saskatchewan [17]. Other studies were based on harvesting short-rotation woody crops in plantations in Quebec [18] and Poland [19]. In Spain, the Biobaler has been used to clear Mediterranean shrub formations [11,20]. There is a lack of knowledge about the behavior, productivity, and collection efficiency of the BioBaler when mulching dense post-fire natural regenerated pine stands.
The aim of this study was to assess and compare the systematic mulching and selective clearing work on post-fire naturally regenerated pine stands applying two different machines and working methods: a Biobaler WB55 and a conventional chain mulcher, both carrying out a systematic mulching of 50% vs. 67% of the total stand surface.
BioBaler mulching productivity modeling, including identifying its explanative variables, was the first goal of the study. The cost of both treatments with Biobaler was estimated and compared with the cost of the same treatments time-studied using a chain mulcher, considered as the most common alternative. Soil and stand damage and biomass quality were also assessed.
In addition, manual clearing productivity and cost were studied, in order to find the possible influence of mulching technology and selectively cleared strip width on them.

2. Materials and Methods

2.1. Study Area

The study was conducted in León, Northwest Spain, on 11.4 ha covered by Pinus pinaster Ait. regeneration and several shrub species (Hallimium umbellatum, Erica sp. and 
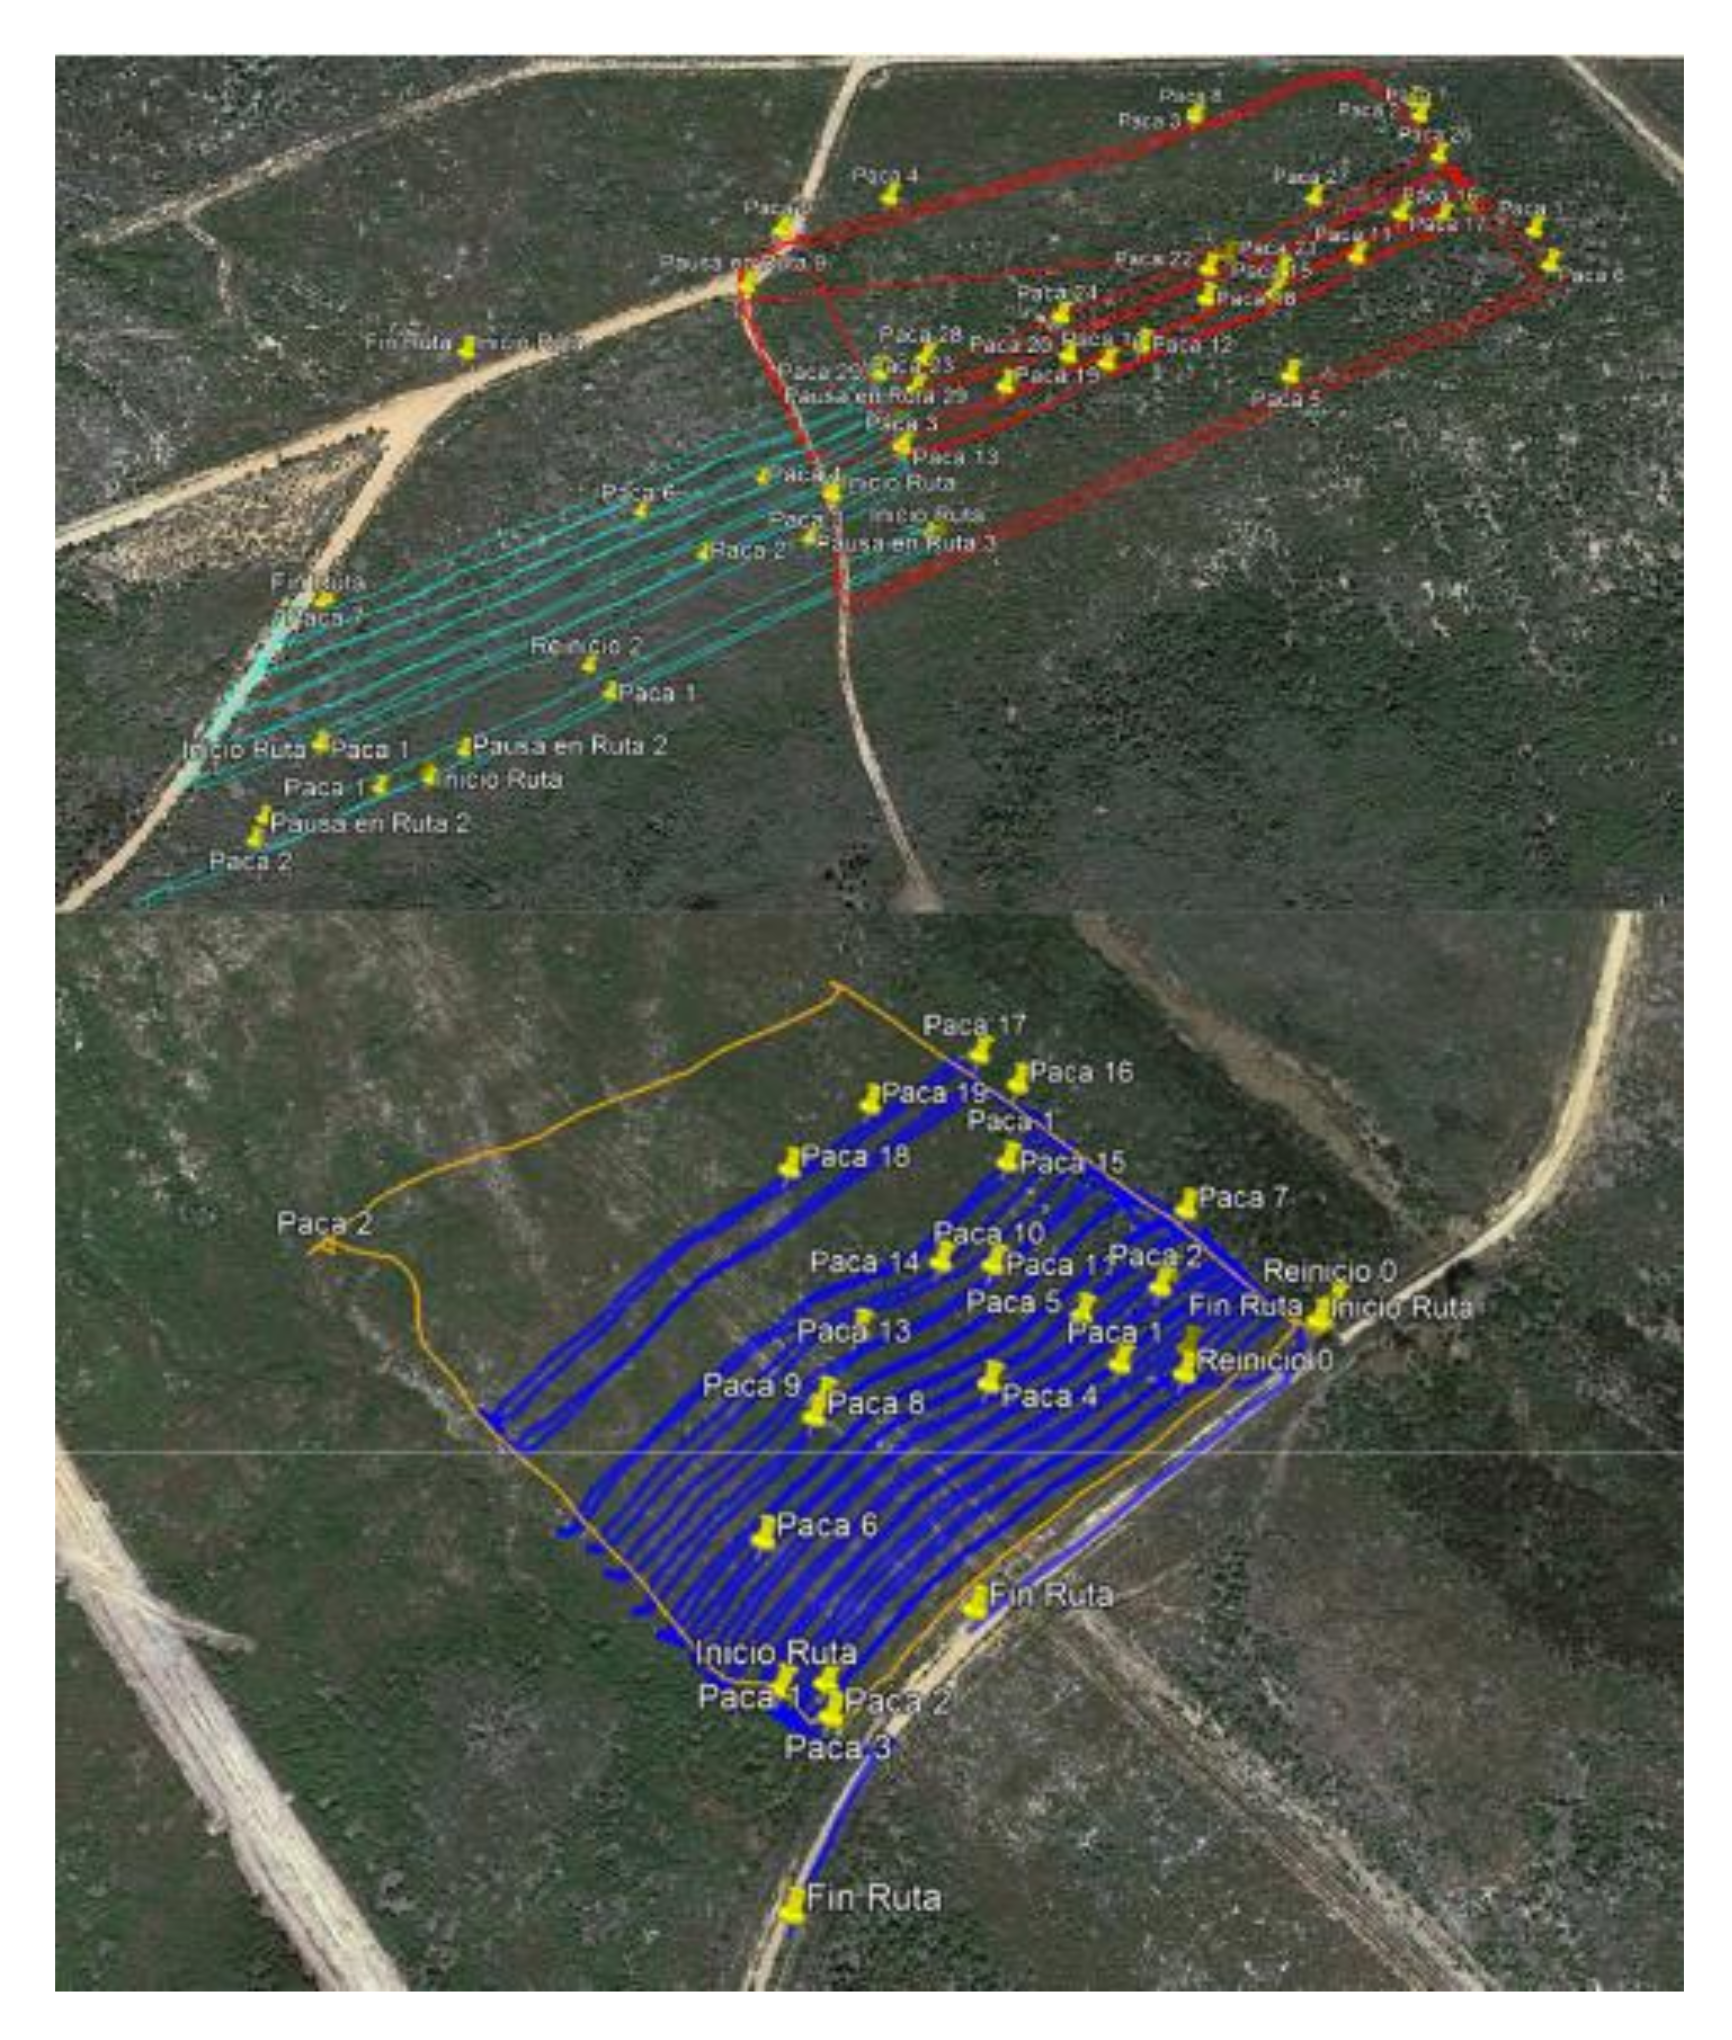
Cistus sp.) after a severe 2012 wildfire. Two sites with slope below 15% and no rocky outcrops (Tabuyo or Site 1 and Castrocontrigo or Site 2) were selected for the trials (Figure 1).
The main parameters of the study sites are reflected in Table 1.
Each site was divided into four strata to be systematically mulched, two with the Biobaler leaving untreated strips of two different widths and two with the chain mulcher leaving the same two different untreated strip widths. The initial density of the stands was not measured, but was always greater than 8000 trees·hectare−1, as long as the measured final density (after the systematic mulching of more than 48% of the surface and the further selective clearing) was greater than 2700 trees·hectare−1 in all the strata.

2.2. Machinery and Working Methods

The Canadian biomass collector–bundler BioBaler WB55 comprises a harvester unit and a baling unit, powered by a 145 kW tractor (Valtra T194S/4). As the tractor moves forward, the harvester unit cuts standing pines and shrubs with 48 teeth (16 hammers and 32 blades) inserted into a horizontal rotor that strikes the vegetation in an upward motion. Afterwards, the harvested biomass is propelled to the baling unit to be compacted. Once the bale is produced, the baling unit opens, and the bale is released onto the terrain. The conventional chain mulcher was attached to a farm tractor Landini Landpower t165 (116 kW). The mulcher left the crushed biomass on the ground. Both machines employed systematic mulching of approximately 50% vs. approximately 67% of total stand surface, leaving on the terrain wide (2.5–3 m) and narrow (1.5 m) untreated strips, respectively.
A 5.4 m wide perimeter belt was cleared with the Biobaler at each site in order to prevent forest fires. Over the rest of the sites, the average systematically cleared strip width was 2.65 m, which corresponded to the tractor width.
After the mechanical mulching was performed by each machine in its strata, selective clearing on pine was carried out by four operators with portable brush cutters and a foreman on the wide and narrow untreated strips in order to increase spacing between trees. No further treatment was carried out on shrubs.

2.3. Time Study

A continuous time study was performed in each of the strata and for both machines, following [21,22]. The machine GPS data were also used. Surface productivity and cost were analyzed for both machines. Weight productivity and biomass collection efficiency were calculated for the Biobaler. The selective clearing with portable brush cutters was also studied in all strata. The time study was carried out in 20 narrow untreated strips and in 20 wide untreated strips.

2.4. Post-Harvesting Inventory

The bales produced by the Biobaler were georeferenced, marked, extracted and weighed individually. Moisture content samples were taken from sixteen bales in order to calculate the dry weight.
The produced bales along 300 to 350 m of mulched strip were used as replicates. Each replicate included six post-harvesting inventory plots in order to calculate a significant average of the explanatory parameters. The bale production of each replicate varied from one to three. In total 25 replicates were included in the analysis.
In order to calculate the collection efficiency, a systematic sampling comprised of 180 plots (1 m × 2.65 m) was carried out along the treated strips. The uncollected biomass of each plot was weighed, and 56 samples were taken to the Laboratory of Biomass Characterization at CEDER-CIEMAT to determine moisture content according to the ISO 14780:2017 standard, by means of homogenization, division and drying. The analytical method, drying at 105 ± 2 °C, was performed following the ISO 18134-1:2015 standard. Uncollected biomass included both machine pick up failures and fine material losses, which after being cleared, did not get into the baling unit and fell to the ground. In those plots, stump heights were also measured.
The shrub and pine heights (m) and crown cover (%) values were measured in 180 plots on the untreated strips in order to calculate their product, the so-called biovolume for each replicate [23,24]. Stump diameters of the two closest pines to the strip were also measured in each plot.
Soil damage (rutting >10 cm depth) and damage to the remaining trees on the strips treated with the conventional chain mulcher were measured on 48 plots (2 m × 2.65 m). The same assessment was carried out on the strata treated with the Biobaler once the forwarder extracted the bales.
StatGraphics 18 was used to statistically analyze the data.

2.5. Cost Analysis

Hourly costs were estimated using standard methods [25]. Chain mulcher and manual clearing costs were based on current local prices [26]. Biobaler and forwarder costs were estimated from the literature [20,27]. Biomass price was obtained from [28].

3. Results

3.1. Biobaler

3.1.1. Strata Characteristics

Although the ideal situation was to find homogenous strata to facilitate the technology and work method comparison, the post-harvesting inventory showed that the Site 1 stratum with wide untreated strips was statistically different to the others (Table 2). Furthermore, the Site 2 stratum with wide untreated strips showed rougher terrain with a slightly steeper slope. These stratum characteristics might have influenced the results to some extent, as will be discussed later on.

3.1.2. Biomass Collection and Productivity

The Biobaler worked on a total surface of 7.15 ha, with a cleared surface of 4.36 ha. The average untreated strip width was 2.14 m. The number of produced bundles was 76, which was equivalent to 23.25 fresh t (13.64 odt). The collected biomass was 3.25 fresh t·ha−1 in the total area, and 5.33 fresh t·cleared ha−1 (considering only the mulched surface). The bale moisture content was 41% on average after spending 40 days on site before forwarding. The average bale weight was 306 fresh kg and 179.5 odkg. The average collection efficiency was 31.2%, meaning that 68.8% of the biomass remained on the ground (Table 3).
The Site 1 stratum with wide untreated strips had the highest number of tonnes·ha−1 and it was the stratum with the highest biomass collection and the highest amount of uncollected biomass. However, the collection efficiency was above average, although this difference was not statistically significant. On the other hand, the Site 2 stratum with wide untreated strips showed the lowest collection efficiency, which may be due to the rougher terrain that required raising the baling unit and leaving higher stumps.
The average weight and surface productivity was 1.41 odt·Workh−1 and 0.75 ha·Workh−1 (0.45 cleared ha·Workh−1), respectively (Table 4). The highest weight productivity was observed in the Site 1 stratum with wide untreated strips, since this stratum had the highest biovolume before harvesting. As expected, the strata with wide untreated strips showed the highest surface productivity, although the difference with narrow untreated strips was not statistically significant, which may be due to specific stratum characteristics (more biovolume in the Site 1 stratum with wide untreated strips, which increased weight productivity but decreased the machine forward speed).
The biovolume influence on weight productivity and forward speed was analyzed through regression analysis. The analysis showed that pine biovolume (PBV) explained over 50% of the variability in productivity, and there was a negative relationship between speed and pine biovolume (Figure 2).
Productivity (odt·Workh−1) = 0.7835 + 0.01686·PBV
R2 = 53.5%
R2 (adjusted by d.f.) = 51.4%
Standard est. error = 0.607
Medium absolute error = 0.493 odt·Workh−1
Speed (km·Workh−1) = 1.87 − 0.0044·PBV
R2 = 19.7%
R2 (adjusted by d.f.) = 16.2%
Standard est. error = 0.330
Medium absolute error = 0.25 km·Workh−1
Figure 2. Fitted regressions between weight productivity and machine speed vs. pine biovolume.
Forests 12 00979 g002

3.1.3. Costs

According to [9], the Biobaler cost per PMh is 111.56 EUR. Taking into account that the PMh was 91.5% of total working time in this trial, the cost per working hour was 102.1 EUR. The average cost of the bale production was 42.5 EUR·fresh t−1 (71.4 EUR·odt−1). The cost of the total area (cleared area, untreated strips, and bale production) was 136.1 EUR·ha−1 (227 EUR·cleared ha−1), including 22% of fixed, indirect and structural costs and trade margin (Table 5).
When converting the productivity Equation (1) (Figure 2) into unit cost Equation (3) indicates:
Unit cost (€·odt1) = (0.00767 + 1.651·104 ·PBV)1
Biobaler biomass baling costs were reduced when pine biovolume increased (Figure 3). However, high biovolume values might mean large heights and diameters, which may not be suitable for the machine beyond certain dimensions.
The forwarder cost was estimated at 61 EUR·Workh−1, including 22% of fixed, indirect and structural costs and trade margin [27]. Considering a productivity of 8.85 fresh tonne·Workh−1 (5.1 odt·Workh−1), the cost per fresh tonne was 6.89 EUR (11.75 EUR·odt−1), equivalent to 22.4 EUR·ha−1.
The transportation cost from the forest site to the industry was estimated at 12 EUR·fresh t−1 under the following conditions: travel distance 40 km, truck capacity 12 t.
The biomass price was estimated by the industry at 25 EUR·fresh t−1 at the plant gate [28]. Therefore, at landing the biomass price would be 13 EUR·fresh t−1, meaning 42.3 EUR·ha−1.
The economic balance considering costs and income was 108.1 and 125.1 EUR·ha−1 for the strata with wide and narrow untreated strips respectively (Table 5).

3.2. Chain Mulcher

3.2.1. Strata Characteristics

The strata treated with the conventional chain mulcher were similar to the ones treated with the Biobaler, with the exception of Site 1 stratum with wide untreated strips, which had a lower pine biovolume and a higher shrub biovolume.

3.2.2. Productivity and Cost

The chain mulcher worked on a total surface of 4.2 ha, with a cleared surface of 2.32 ha. The average untreated strip width was 2.18 m. The average productivity was 0.71 ha·Workh−1 (0.39 cleared ha·Workh−1), which was similar in both treatments.
The hourly rate of the tractor with the chain mulcher was estimated at 45 EUR·Workh−1 [26], including indirect cost and trade margin. This resulted in a cost of 115.4 EUR·cleared ha−1, 55.8 EUR·ha−1 in the strata with wide untreated strips (48.4% of the total area was cleared) and 69.8 EUR·ha−1 in the strata with narrow untreated strips (60.5% of the total area was cleared).

3.3. Manual Clearing

3.3.1. Productivity

The highest surface productivity was observed in a Site 2 stratum with narrow untreated strips. This was possibly due to a lower pine biovolume and a higher shrub biovolume. There was a significant difference in surface productivity between narrow and wide strips. The average surface productivity was 0.106 ha·Workh−1 and 0.087 ha·Workh−1 for narrow and wide strips, respectively. However, when looking at cleared surface productivity rather than total surface productivity, there was no significant difference between narrow and wide strips, which did not support the hypothesis of narrow strips facilitating manual clearing due to a smaller area to be cleared compared to wide strips.
Manual clearing productivity was also compared in the strata treated with Biobaler and the conventional chain mulcher. The total and cleared surface productivity was significantly higher in the strata treated with the chain mulcher (Table 6). This was probably due to a higher stump height on the Biobaler strips, which could slow down the operator’s forward movement. These factors were also analyzed by looking at the strata individually. The highest total and cleared surface productivity was again observed on the strata treated with the chain mulcher, and it was significantly higher on wide strips.

3.3.2. Costs

The cost per hour of the four operators and the foreman was 126.9 EUR, considering an operator cost·Workh−1 (including 22% of fixed, indirect and structural costs and trade margin) of 24.4 EUR and 29.3 EUR·Workh−1 for the foreman [26].
Taking into account the surface productivity, the cost of manual clearing was 547 EUR·cleared ha−1 and 676 EUR·cleared ha−1 for areas cleared by the chain mulcher with wide and narrow strips respectively, and 911 EUR·cleared ha−1 and 1010 EUR·cleared ha−1 for areas cleared by the Biobaler with wide and narrow strips respectively.
The chain mulcher working in the strata with narrow strips showed the lowest manual clearing cost·ha−1 (Figure 4), considering the ratio of manual cleared ha and total treated ha.

3.4. Economic Balance

The selective motor–manual clearing cost per total ha varied from 337 EUR (chain mulcher with wide strips) to 572 EUR (Biobaler with wide strips) (Figure 4). The high clearing cost observed in the Biobaler stratum with wide strips could be due to a higher pine biovolume and larger stump diameters. Therefore, the Biobaler cost with narrow strips is a better figure to compare with the chain mulcher costs.

3.5. Biomass Quality

The average calorific value was 19.33 MJ·odkg−1 (Table 7), similar to other forest biomass such as pine (Pinus sp.) or broom (Cytisus scoparius) [29]. The ash content was close to 2%, which is higher than crushed pine (0.7%) [29], close to shrub values such as Cytisus scoparius and Erica sp. (1.4%) or Cistus sp. (2.4%), and short rotation forestry such as Populus sp. (2%), but lower than straw (5%) [30]. The average nitrogen content was 0.51%, which is a value in between those of pine (0.09%) and Cytisus scoparius (0.91%) [29]. The sulphur and chlorine contents were 0.05% and 0.03% respectively, similar to pine and Cytisus scoparius values. The fusibility temperature was similar for all samples, except for one sample that showed lower values, probably due to a larger shrub content.
The analyzed parameters showed that the bales possessed acceptable biomass quality. However, the presence of needles, fermentation risk, and difficulties in the drying process lowered the biomass quality [28].

3.6. Tree and Soil Damage, Stump Heights and Final Tree Density

The damage to the remaining trees varied from 6 to 22%, depending on the stratum, being higher in the strata with narrow strips (Table 8). This was probably due to a larger edge ratio since more area was cleared in the strata with narrow strips. Forwarder movement also increased the amount of damage in the Biobaler strata. Most of the damage was observed only on bark or barely penetrating the wood. The main cause of damage was the brush cutter movement and to a lesser extent the machine framework. Only two strips of the Biobaler strata showed rutting between 3 and 7 m length and 10–15 cm depth, due to forwarder movement.
The final tree density was above 2500 trees·ha−1, and was higher in the Biobaler strata than in the chain mulcher strata (Table 8).
The average pine stump height was 31 cm in the Biobaler strata. By contrast, pine stumps were almost not visible in the chain mulcher strata.

4. Discussion

4.1. Key Findings. Differences between Biobaler and Chain Mulcher Performance

The Biobaler surface productivity (total ha·Workh−1) was 14% higher in the strata with wide untreated strips than in the strata with narrow untreated strips. However, this difference was not statistically significant, probably due to a larger biovolume in those strata which decreased the machine forward speed. The weight productivity was 51% higher in the strata with wide untreated strips. This result was influenced by the high pine biovolume in the Site 1 stratum with wide untreated strips, which was significantly different to the others. The highest collection efficiency was observed in the stratum with the highest weight productivity. However, this efficiency was low (31% on average): high stumps were left on the ground, the mulching width was smaller than the machine width which caused trees and shrubs to be pushed down without being harvested, and losses from the baling unit were observed during the trials. Although these material losses can have positive effects on the stands such as moisture retention, nutrients and wildlife habitat protection [7], this low efficiency negatively affected the economy of the technology. The average chain mulcher surface productivity was similar in both treatments, with narrow and wide untreated strips, and was 5% lower than the Biobaler surface productivity.
The manual clearing productivity (total ha·Workh−1) in the narrow strips was 22% higher than in the wide strips. However, there was no significant difference between treatments when looking at cleared surface productivity. The results of a comparison between manual clearing productivity in the strata treated with the Biobaler and the chain mulcher indicated a significant difference in total and cleared surface productivity between technologies. The manual clearing productivity (total surface and cleared surface) was approximately 50% higher in the strata treated with the chain mulcher. These results suggest that there is a potential for decreasing the cost of manual clearing operations by carrying out a previous mechanical mulching with a chain mulcher. However, possible climate benefits of biomass harvesting and use for energy or bio-products is not achieved with this option since the biomass will decompose on the stand.
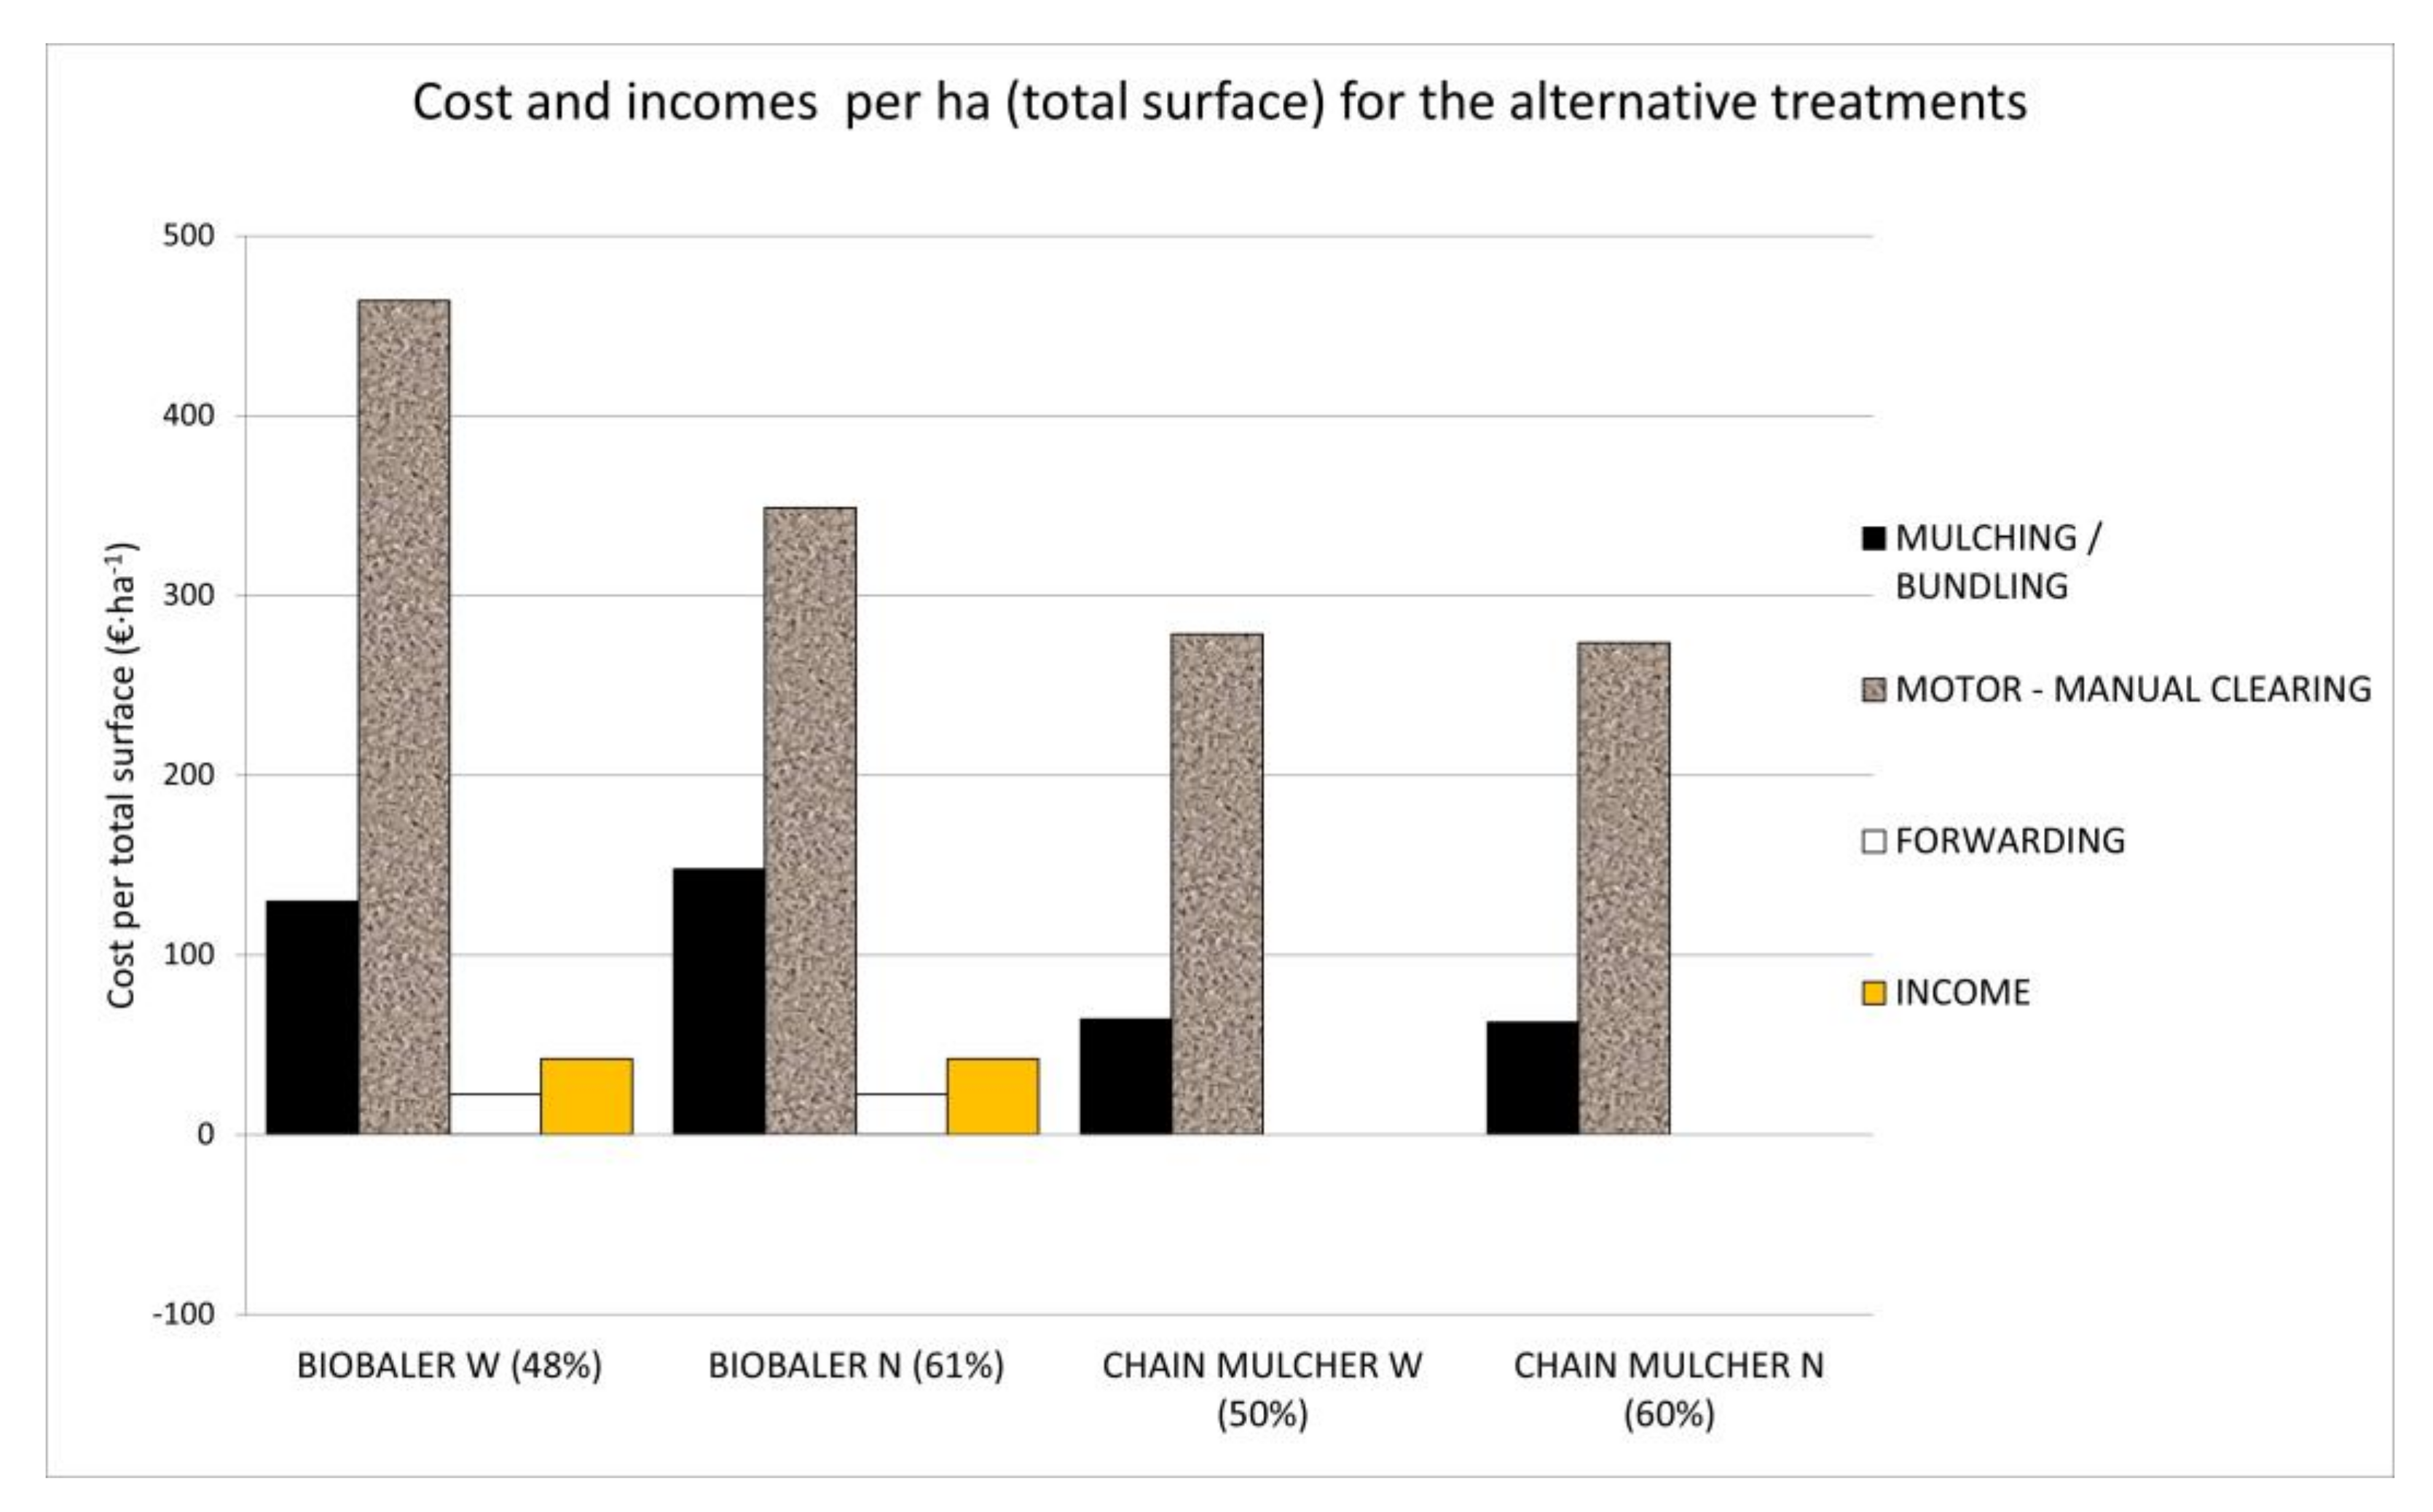
Concerning the total cost per ha, including manual clearing cost, the chain mulcher cost leaving wide strips on the terrain was 3% lower than that of the chain mulcher leaving narrow strips, 29% lower than that of the Biobaler leaving narrow strips, and 41% lower than that of the Biobaler leaving wide strips.
The damage to the remaining trees was around 50% higher in the strata with narrow strips than in the strata with wide strips. The strata treated with the Biobaler showed 46% more damage than the strata treated with the chain mulcher. However, this damage was minor due to its low severity and the high density of the remaining trees.

4.2. Comparison with Other Studies

A previous study on Mediterranean shrubs in Spain showed an average weight productivity of 1.9 odt·PMh−1, an average surface productivity of 0.7 ha·PMh−1, and a collection efficiency of 31% [20]. These results were very similar to the ones obtained in this study. However, [20] observed that a decrease in collection efficiency occurred when shrub biomass load increased. This decrease was not observed in this study, potentially due to the abundant presence of pine biomass. [11] showed a weight and surface productivity from 0.6 to 2.1 odt·workh−1 and from 0.11 to 0.66 ha·workh−1, and a collection efficiency from 25% to 50% on shrublands in Spain, depending on the terrain characteristics, the height, density, age, and species of scrub, and the skill and experience of the driver. The results obtained in the present study were within that range. [15] reported an average weight productivity of 2.2 fresh t·PMh−1, an average surface productivity of 0.36 ha·PMh−1, and a collection efficiency of 36% on understory biomass in pine stands in the United States. The study compared two different sites—the one with the lowest amount of understory biomass was the stand with lower weight productivity and collection efficiency and higher surface productivity. The same trend was observed in three of the four strata analyzed in this study. By contrast, [13] reported an average weight productivity of 3.6 odt·h−1 on natural shrubs in various environments in Canada, and a higher collection efficiency ranging from 44% to 73%.
The Biobaler technology was also analyzed on natural willow rings (coppices around marshes) in other studies. [17] reported a weight productivity between 3.5 and 6.6 fresh t·h−1, equivalent to 2.0 and 3.9 odt·h−1, on natural willow rings in Canada. The collection efficiency was 62%. Weight productivity was related to yield. The highest weight productivity was observed in the site yielding more biomass·ha−1 since the Biobaler had to travel less to fill the bale chamber. Although weight productivity in [17] was higher than productivity in this study (1.4 odt·h−1 on average), the same trend was observed in the strata analyzed—a higher yield was associated with a higher weight productivity—with the exception of the Site 2 stratum with wide strips, probably due to rougher terrain. The collection efficiency reported in [17,31] was double than in this study. The higher flexibility of willow compared to pine could have facilitated biomass collection. In addition, in both studies the total yield per ha was higher than in this study.

4.3. Strengths and Limitations of the Study

The results are based on a broad statistical base: 11.4 hectares in two different sites have been treated and the bales sets considered as replications have provided a good basis for ANOVAs while the many measured plots to estimate stand conditions and biomass left on the terrain have provided strongly reliable data.
Nevertheless, there were some differences between the strata. The Site 1 stratum treated with the Biobaler leaving wide untreated strips had the largest amount of pine biomass, the lowest amount of shrub biomass, the largest pine diameters and therefore the largest total amount of biomass per ha. These stratum characteristics might have increased the Biobaler productivity and reduced the motor–manual productivity. The Site 2 stratum with wide strips was different to the others in terms of collection efficiency. However, this stratum was not different in biomass amount and composition, nor in total biomass amount per ha. Rougher terrain could explain part of the differences in the results regarding this stratum.
The Biobaler driver had previously worked mainly on shrublands. Therefore, an improvement in productivity is expected when more working hours are dedicated to young and dense pine stands.
Finally, the transportation cost included in the analysis corresponds with a short distance (40 km) from the forest to the industry. If longer distances were considered, the Biobaler alternative would have been a more costly option. Therefore, nearby demand is essential for the economic viability of biomass harvesting.

5. Conclusions

The surface productivity (ha·Workh−1) was slightly higher for the Biobaler than for the conventional mulcher, even considering that the Biobaler collected the biomass and produced bales. However, the average cost of the treatment, including the selective clearing by motor–manual operators, was higher for the Biobaler than for the conventional mulcher. This was due to higher hourly costs of the Biobaler and lower motor–manual clearing productivity in the strata treated with the Biobaler. In the most representative strata this cost was around 475 EUR·ha−1 for the Biobaler and 350 EUR·ha−1 for the conventional mulcher. The income coming from the sale of the bales at current woody biomass price could not compensate for the difference.
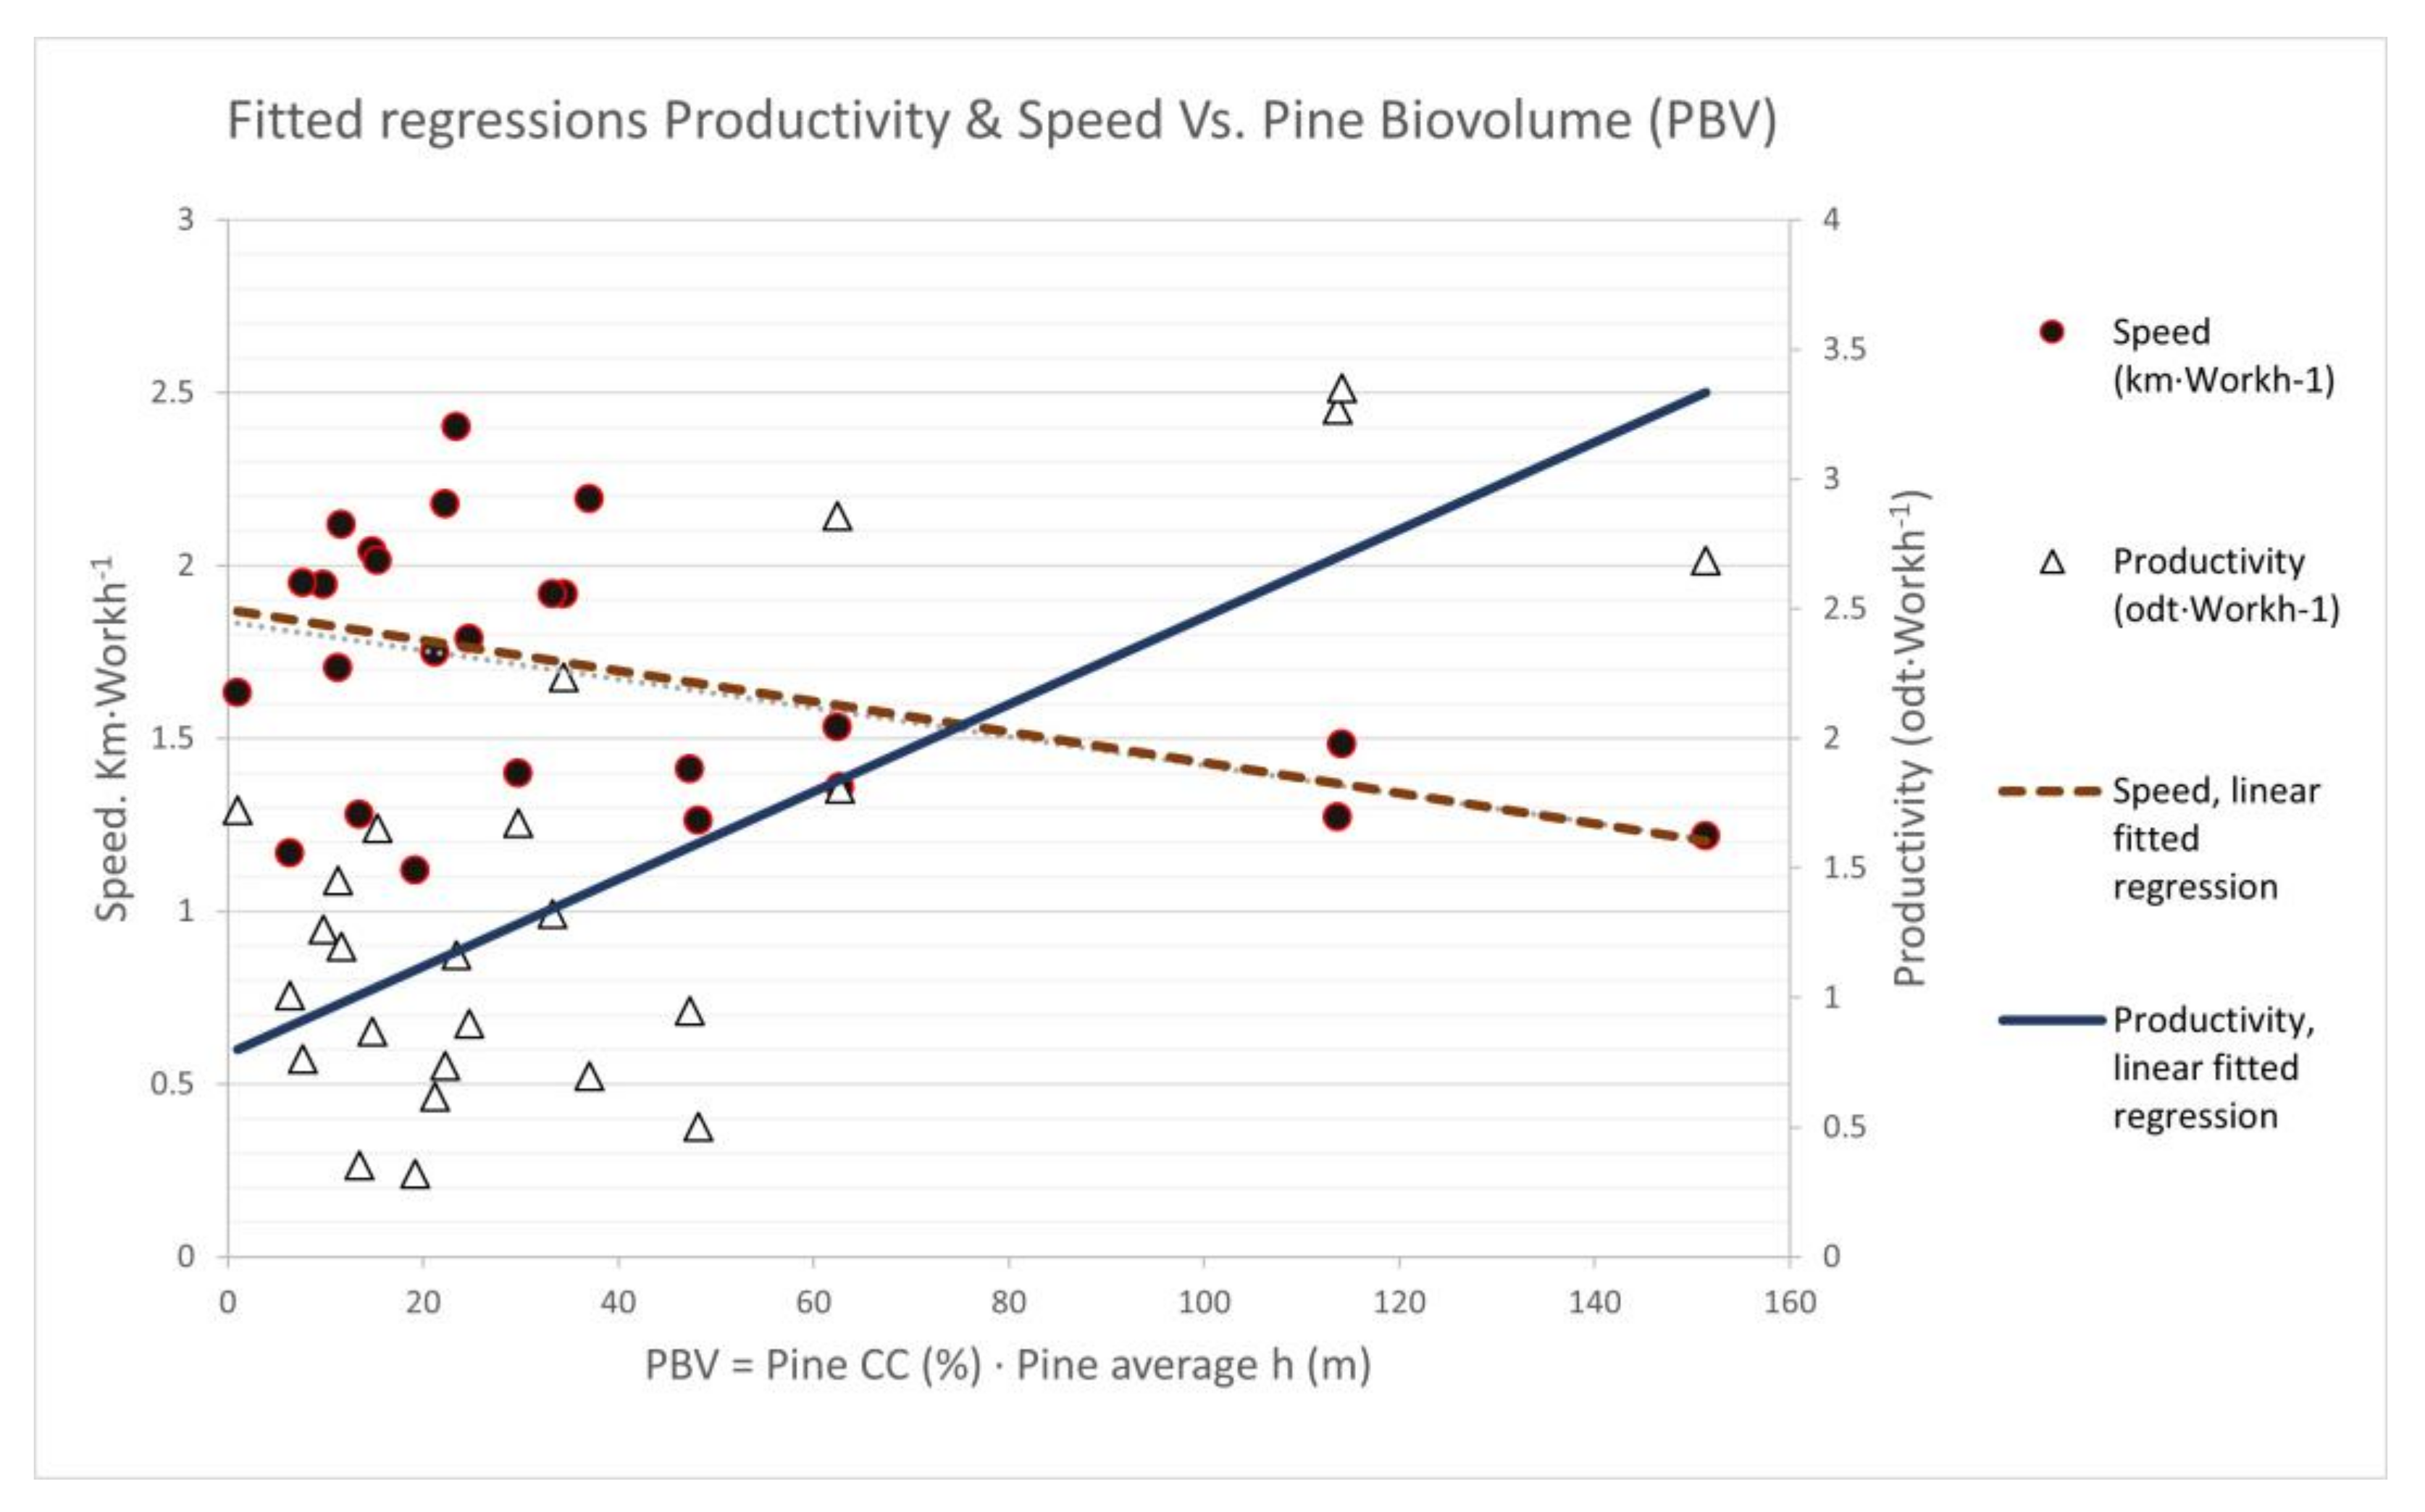
The total surface productivity (stand ha·Workh−1) was greater when a lower percentage of the total surface was cleared, but to a lesser extent than theoretically predicted. The Biobaler surface productivity (stand ha·Workh−1) was 14% higher when leaving wide untreated strips on the terrain than when leaving narrow strips. A larger pine biovolume in the stands increased weight productivity but reduced machine speed.
The main constraint of the Biobaler was low collection efficiency (31% of the standing biomass in the cleared surface).
This study showed that pine biomass collection on post-fire natural regenerated pine stands with low slope and rock-free terrain was technically possible. However, there is a need for improvement of the Biobaler stem cutting system and the mass flow inside the baling unit in order to increase collection efficiency. This future development would increase weight productivity and reduce cost.

Author Contributions

Conceptualization: E.T. and R.B.; Methodology: E.T., R.B., R.L., T.d.l.F.; Investigation: E.T., R.B., R.L., N.M.B., T.d.l.F.; Resources: E.T., R.B.; Data curation: E.T., N.M.B., R.B.; Writing—original draft: E.T., T.d.l.F.; Writing—review & editing: R.L. and R.B. All authors have read and agreed with the published version of the manuscript.

Funding

This study was funded by the Spanish Ministry of Science and Innovation (Project PCI2019-103673). Project Smallwood is supported under the umbrella of ERA-NET Cofund ForestValue. ForestValue has received funding from the European Union’s Horizon 2020 research and innovation programme under grant agreement No 773324.

Institutional Review Board Statement

Not applicable.

Informed Consent Statement

Not applicable.

Data Availability Statement

The datasets generated during and/or analyzed during the current study are available from the corresponding author on reasonable request.

Acknowledgments

We have to thank L.S. Esteban from CEDER-CIEMAT who supported us in the use of the BioBaler. We are also indebted to Rafael García-González, Isabel García-Álvarez, Íñigo Oliagordia and Javier Ezquerra and other staff from Castilla y León Forest Administration, for their support in the treatments performed on the terrain belonging to its managed forests. Additionally we are very grateful to Rubén García and Vanesa Suárez, from SOMACYL public forest enterprise, as well as to the contractor F. Castañeiras and to the machine drivers M. Zamora, R. Corredor and F. Dios-Ares for their support in biomass collection, extraction and transport.

Conflicts of Interest

The authors declare no conflict of interest.

References

  1. MITECO, Spanish Ministry for Ecological Transition. 2020 Forest Fire Statistics in Spain. Available online: https://www.miteco.gob.es/eu/biodiversidad/estadisticas/avanceinformativoa31dediciembre2020_tcm35-132566.pdf (accessed on 22 June 2021).
  2. Bedia, J.; Herrera, S.; Camia, A.; Moreno, J.M.; Gutierrez, J.M. Forest fire danger projections in the Mediterranean using ENSEMBLES regional climate change scenarios. Clim. Chang. 2014, 123, 343–344. [Google Scholar] [CrossRef]
  3. Madrigal, J.; Hernando, C.; Guijarro, M.; Díez, C.; Jiménez, E. Distribución de biomasa y fijación de carbono tras clareos mecanizados intensos en regenerado post-incendio de Pinus pinaster Ait. (Monte “Fraguas”, Guadalajara, España). Investig. Agrar. Sist. Recur. For. 2006, 15, 231–242. [Google Scholar] [CrossRef] [Green Version]
  4. Taboada, A.; Tárrega, R.; Marcos, E.; Valbuena, L.; Suárez-Seoana, S.; Calvo, L. Fire recurrence and emergency post-fire management influence seedling recruitment and growth by altering plant interactions. For. Ecol. Manag. 2017, 402, 63–75. [Google Scholar] [CrossRef]
  5. Rodríguez-Soalleiro, R.; Madrigal-Collazo, A. Selvicultura de Pinus Pinaster Ait. Subsp. Atlantica. In Compendio de Selvicultura Aplicada en España; Serrada, R., Montero, G., Reque, J., de Vill, H., Eds.; Instituto Nacional de Investigaciones Agrarias (National Institute of Agricultural Reserach): Madrid, Spain, 2008; pp. 367–398. [Google Scholar]
  6. Martínez-Chamorro, E.; Rodríguez-Soalleiro, R. Clareos con desbrozadora de eje vertical sobre regeneración natural de Pinus pinaster Ait. en la provincia de Orense. Cuad. Soc. Esp. Cien. For. 2003, 15, 153–157. [Google Scholar]
  7. Nishio, G. Narrow-Strip Mulching Trial: Monitoring Protocol; FPInnovations Technical Report No. 23; Point-Clair: Montréal, QC, Canada, 2015; p. 16. [Google Scholar]
  8. Nishio, G. Strip Thinning High Density Pine Regeneration; FPInnovations Technical Report No. 26; Point-Clair: Montréal, QC, Canada, 2015; p. 17. [Google Scholar]
  9. Hvenegaard, S.; Hsieh, R. Productivity of A Semi-Mechanized Forest-Fuel Reduction Treatment: A Case Study in Central Alberta; FPInnovations Technical report nº. 50; Point-Clair: Montréal, QC, Canada, 2017; p. 15. [Google Scholar]
  10. European Comission. EU Climate Action and the European Green Deal 2021. Available online: https://ec.europa.eu/clima/policies/eu-climate-action_en (accessed on 22 June 2021).
  11. Esteban, L.S.; Bados, R.; Mediavilla, I. Sustainable Management of Shrub Formations for Energy Purposes. Available online: https://www.researchgate.net/publication/340342918_Sustainable_Management_of_Shrub_Formations_for_Energy_Purposes/link/5e8a37a0a6fdcca789f7d4c4/download (accessed on 14 July 2021).
  12. Bados, R.; Esteban, L.S.; Pérez, P.; Corredor, R.; Maqueda, L.; Zamora, V.; Mediavilla, I.; Carrasco, J.E.; Blasco, I.; Calero, R. Scrub Harvesting Trials for Energy Purposes. In Proceedings of the 24th European Biomass Conference and Exhibition (EUBCE), Amsterdam, The Netherlands, 6–9 June 2016; pp. 270–273. Available online: http://www.etaflorence.it/proceedings/?detail=13246 (accessed on 14 July 2021).
  13. Langholtz, M.; Caffrey, K.; Barnett, E.; Webb, E.; Brummette, E.; Downing, M. Demonstration of the BioBaler harvesting system for collection of small-diameter woody biomass. Oak Ridge Natl. Lab. 2011. [Google Scholar] [CrossRef] [Green Version]
  14. Savoie, P.; Current, D.; Robert, F.S.; Hebert, P.L. Harvest of natural shrubs with a Biobaler in various environments in Quebec, Ontario and Minnesota. Appl. Eng. Agric. 2012, 28, 795–801. [Google Scholar] [CrossRef]
  15. Do Canto, J.L.; Klepac, J.; Rummer, B.; Savoie, P.; Seixas, F. Evaluation of two round baling systems for harvesting understory biomass. Biomass Bioenergy 2011, 35, 2163–2170. [Google Scholar] [CrossRef]
  16. Klepac, J.; Rummer, B. Evaluation of the WB55 bio-baler for baling woody biomass in a forest application. In Proceedings of the SAF 2009 National Convention, Orlando, FL, USA, 4 October 2009; pp. 1–13. [Google Scholar]
  17. Savoie, P.; Lavoie, F.; D’Amours, L.; Schroeder, W.; Kort, J. Harvesting natural willow rings with a bio-baler around Saskatchewan prairie marshes. Can. Biosyst. Eng. 2010, 52, 21–25. [Google Scholar]
  18. Savoie, P.; Hébert, P.L.; Robert, F.S.; Sidders, D. Harvest of Short-Rotation Woody Crops in Plantations with a Biobaler. Energy Power Eng. 2013, 5, 39–47. [Google Scholar] [CrossRef] [Green Version]
  19. Stolarski, M.J.; Krzyzaniak, M.; Szczukowski, S.; Tworkowski, J.; Grygutis, J. Changes of willow biomass quality as a renewable energy feedstock harvested with Biobaler. J. Elem. 2015, 20, 717–730. [Google Scholar] [CrossRef]
  20. Bados, R.; Tolosana, E.; Esteban, L.S. Evaluation of a Harvester-Baler System Operating in a Rockrose (Cistus laurifolius L.) Shrubland. Croat. J. For. Eng. 2020, 41, 191–203. [Google Scholar] [CrossRef]
  21. Bjoherden, R.; Thompson, W. An International Nomenclature for Forest Work Study. In Proceedings of the IUFRO 1995 S3: 04 Subject Area: 20th World Congress, Caring for the Forest: Research in a Changing World, Tampere, Finland, 6–12 August 1995. [Google Scholar]
  22. Acuña, M.; Bigot, M.; Guerra, S.; Hartsough, B.; Kanzian, C.; Kärhä, K.; Lindroos, O.; Magagnotti, N.; Roux, S.; Spinelli, R.; et al. Good Practice Guidelines for Biomass Production Studies; CNR–IVALSA: Firenze, Italy, 2012; p. 50. [Google Scholar]
  23. Cook, C.W. The use of multiple regression and correlation in biological investigations. Ecology 1960, 41, 556–560. [Google Scholar] [CrossRef]
  24. Tolosana, E.; Ambrosio, Y.; Vignote, S. Rendimientos, costes y efectos ambientales de las claras mecanizadas sobre repoblaciones de Pinus sylvestris L. en España. Investigación Agraria. For. Syst. 2002, 11, 39–65. [Google Scholar]
  25. Ackerman, P.; Belbo, H.; Eliasson, L.; de Jong, A.; Lazdins, A.; Lyons, J. The COST model for calculation of forest operations costs. Int. J. For. Eng. 2014, 25, 75–81. [Google Scholar] [CrossRef]
  26. García-González, R. Castilla y León Regional Forest Administration Forest Engineer. Personal communication, 2020. [Google Scholar]
  27. Callol, O. Forest engineer working for the private company Lignia Biomassa; In Tolosana, E.; Laina, R. Productivity and cost factors, silvicultural and environmental performance of the treatment performed with the Feller Bundler FIXTERI in a post-fire regenerated Mediterranean stand in Riudarenes (Girona, Spain) Unpublished report. Personal communication, 2018. [Google Scholar]
  28. Suárez, V. SOMACYL responsible engineer for biomass supply to Cubillos del Sil Forestalia biomass power plant. Personal communication, 2020. [Google Scholar]
  29. Mediavilla, I.; Borjabad, E.; Fernández, M.J.; Ramos, R.; Pérez, P.; Bados, R.; Carrasco, J.E.; Esteban, L.S. Biofuels from broom clearings: Production and combustion in commercial boilers. Energy 2017, 141, 1845–1856. [Google Scholar] [CrossRef]
  30. Esteban, L.S.; Bados, R.; Mediavilla, I. Gestión Sostenible de Formaciones Arbustivas Para Uso Energético; CIEMAT: Madrid, Spain, 2017; p. 82. [Google Scholar]
  31. Schroeder, W.; Kort, J.; Savoie, P.; Preto, F. Biomass Harvest from Natural Willow Rings around Prairie Wetlands. Bioenergy Res. 2009, 2, 99–105. [Google Scholar] [CrossRef]
Figure 1. Biobaler strips and georeferenced bales in Site 1 (above) and Site 2 (below) strata.
Forests 12 00979 g001
Figure 3. Relationship between Biobaler clearing and baling cost per odt and pine biovolume (canopy cover % height in m).
Forests 12 00979 g003
Figure 4. Economic balance for the four studied alternatives.
Forests 12 00979 g004
Table 1. Stand average parameters of study sites 1 (Tabuyo) and 2 (Castrocontrigo). Acronyms: S, surface; h, height; CC, crown cover; BV, biovolume = h·CC; dStumps, pine average diameter at stump height.
SiteS, haUTM Coord.
(ETRS 89)
hPines, mCCPines; %BVPineshShrub, mCCShrub, %BV ShrubBV totaldStumps, cm
15.7046850597309971.14056.50.63632.689.12.0
25.6746804737311600.72325.20.86657.179.31.7
Table 2. Biobaler stratum characteristics (the different superscript letters indicate statistically significant differences at 95% probability). Acronyms: N, narrow; W, wide; CC, crown cover; h, height.
SiteStratum (% of Systematically Cleared Surface)Pine Biovolume (CC,%·h,m)Shrubs Biovolume (CC,%·h,m)Total Biovolume (Pine + Shrubs)Stumps Average Diameter, cm
1N (59%)20.7 a49.4 a70.1 a1.0 a
W (50%)91.9 b6.2 b98.1 b3.2 b
2N (62%)10.7 a54.5 a65.2 a.b1.6 c
W (46%)30.9 a53.9 a84.8 a.b1.8 c
Table 3. Biobaler collection efficiency (the different superscript letters indicate statistically significant differences at 95% probability). Acronyms: N, narrow; W, wide; odt, oven dry tonne; ha, hectare.
SiteStratum (% of SystematiCally Cleared Surface) Biomass Left on the Ground, odt·ha−1Collected Biomass Weight, odt·ha−1Total Biomass Weight, odt·ha−1Collection Efficiency, %
1N (59%)3.0 a1.35 a4.31 a29.8 a.b
W (50%)4.9 b3.41 b8.35 b41.6 a
2N (62%)3.5 a.b1.44 a5.09 a33.1 a
W (46%)3.7 a.b0.88 a4.63 a20.4 b
Table 4. Biobaler weight and surface productivity (the different superscript letters indicate statistically significant differences at 95% probability). Acronyms: N, narrow; W, wide; odt, oven dry tonne; Workh, workhour.
SiteStratum (% of Systematically Cleared Surface)Productivity (odt·Workh−1)Productivity (Total Surface, ha·Workh−1)Productivity (Systematically Cleared ha·Workh−1)
1N (59%)1.04 a0.62 a0.48 a.b
W (50%)2.49 b0.71 a.b0.37 a
2N (62%)1.25 a0.78 a.b0.50 b
W (46%)0.91 a0.88 b0.43 a.b
Table 5. Biobaler collecting and bundling unit cost and balance (including clearing, baling, forwarding, biomass transport and income from biomass sale) per tonne and total surface (ha). Acronyms: N, narrow; W, wide; odt, oven dry tonne; ha, hectare (the different superscript letters indicate statistically significant differences at 95% probability).
Stratum (% of Systematically Cleared Surface)Collecting-Bundling Cost (€·Fresh Tonne−1)Collecting-Bundling Cost (€·odt−1)Collecting-Bundling Cost (€·Total ha−1)Balance (Cost-Income), (€·Fresh Tonne−1)Balance (Cost-Income), (€·odt−1)Balance (Cost-Income), (€·Total ha−1)
N (61%)51.8 a88.4 a145 a45.7 a78.0 a125.1 a
W (48%)35.1 a60.2 a128 a29.0 a49.8 a108.1 a
Table 6. Total manual cleared area per hour and operator in each technology and working method (the different letters indicate statistically significant differences at 95% probability). Acronyms: N, narrow; W, wide; Workh, workhour; ha, hectare (the different superscript letters indicate statistically significant differences at 95% probability).
Stratum (% Systematically Cleared Surface) × MachineCleared StripsAver. Productivity, Total Surface, ha (Workh Worker)−1Motor-Manual Thinning Cost (€·Total ha−1)
W (48%) × Biobaler120.0684 a464
N (61%) × Biobaler80.0910 b349
W (50%) × Chain mulcher80.114 c281
N (60%) × Chain Mulcher120.116 c276
Table 7. Bale biomass physical and chemical properties. Acronyms: GCV, gross calorific value; NCV, net calorific value; wt.%, weight%; w.b., wet basis; WM, wet matter; d.b., dry basis; n.a., not available; SST, shrinkage staring temperature; DT, deformation temperature; HT, hemisphere temperature; FT, flow temperature.
Parameter Sample ReferenceAverageMilled PineMilled Broom
201202203204205206207
Moisture wt.% w.b.44.247.057.544.444.747.644.147.110.211.9
Ash wt.% w.b.3.42.32.31.61.51.52.22.10.71.1
Elementary analisys
Carbon wt.% d.b.50.950.652.052.051.953.351.151.751.750.4
Hydrogen wt.% d.b.6.16.16.36.26.26.36.26.26.06.3
Nitrogen wt.% d.b.0.470.340.530.650.520.610.470.510.090.91
Sulphur wt.% d.b.0.040.040.060.040.050.050.040.050.030.04
Chlorine wt.% d.b.0.030.030.020.030.030.030.030.030.020.03
Oxygenwt.% d.b.39.0640.5938.7939.4839.8038.2139.9639.41n.a.n.a.
Calorific values
GCVMJ/kg d.b.19.6420.1821.1721.0720.3521.7020.6120.6720.3020.40
GCVMJ/kg w.b.10.9610.709.0011.7111.2611.3711.5210.9318.3018.00
NCVMJ/kg d.b.18.3218.8619.8019.7219.0020.3319.2619.3319.0019.00
NCVMJ/kg w.b.9.148.857.019.889.429.499.699.0716.8016.50
Ash composition
Alwt.% d.b.2.801.402.401.601.301.402.101.861.501.80
Bawt.% d.b.0.080.080.040.090.180.090.100.09n.a.n.a.
Cawt.% d.b.7.4017.008.1014.0013.0012.007.8011.3323.0015.00
Fewt.% d.b.1.600.801.000.910.670.570.980.930.800.84
Kwt.% d.b.5.407.008.2011.0016.0015.0010.0010.379.0021.00
Mgwt.% d.b.4.205.505.508.007.306.905.206.096.606.40
Mnwt.% d.b.0.200.620.220.500.610.570.290.43n.d.n.d.
Nawt.% d.b.1.101.601.801.502.201.600.981.540.580.63
Pwt.% d.b.1.503.302.402.602.802.302.102.432.004.70
Swt.% d.b.1.402.302.303.003.403.002.202.51n.d.n.d.
Siwt.% d.b.18.08.0015.08.305.705.7014.0010.672.905.10
Srwt.% d.b.0.080.110.040.100.060.040.050.07n.a.n.a.
Tiwt.% d.b.0.280.100.180.110.080.070.200.14n.a.n.a.
Znwt.% d.b.0.170.070.290.250.510.330.090.24n.a.n.a.
Ash melting behaviour by CEN/TS 15370-1 pre-standard and predictive indexes
SST°C1190124011301220112088011001126n.a.n.a.
DT°C1210126011301230123093011401161n.a.n.a.
HT°C12301270119012401260135011701244n.a.n.a.
FT°C12301300119012601360142011801277n.a.n.a.
Table 8. Damage to remaining trees and final tree density. Acronyms: N, narrow; W, wide; nr, number; ha, hectare.
Stratum (% Systematically Cleared Surface) × MachineTotal Trees Nr·ha−1Damaged Trees·ha−1% of Damaged Trees
W (48%) × Biobaler331272922
N (61%) × Biobaler289834113
W (50%) × Chain mulcher271452218
N (60%) × Chain Mulcher27211966
Publisher’s Note: MDPI stays neutral with regard to jurisdictional claims in published maps and institutional affiliations.

