
Silviculture for Deer and Timber: A Multiple-Use Policy Analysis Reveals Important Implementation Barriers


1
School of Forest Resources, University of Maine, Orono, ME 04469, USA
2
Department of Forest Engineering, Resources and Management, Oregon State University, Corvallis, OR 97331, USA
3
Department of Wildlife, Fisheries and Conservation Biology, University of Maine, Orono, ME 04469, USA
*
Author to whom correspondence should be addressed.
Forests 2021, 12(11), 1436; https://0-doi-org.brum.beds.ac.uk/10.3390/f12111436
Submission received: 3 September 2021
/
Revised: 9 October 2021
/
Accepted: 14 October 2021
/
Published: 21 October 2021
(This article belongs to the Section Forest Economics, Policy, and Social Science)
Abstract
:Policies that attempt to balance timber production with non-market values that forests provide are common across the United States. Such is the case in northern Maine, USA, where management of critical areas of mature softwood-dominated forest are regulated through the State’s primary wildlife management agency. We use a case study approach with qualitative and quantitative analyses to understand the persistent difficulties encountered by both forest and wildlife managers when implementing this policy. Interviews with foresters and wildlife biologists established the management parameters, and simulated management scenarios compared forest management outcomes with respect to both financial and wildlife habitat provision goals. The model results indicated that there are opportunities for comparable revenues within regulated habitat areas as without, although the returns varied due to legacy of previous management and species composition. More importantly, the interviews revealed that differing habitat metrics used by foresters and biologists are a barrier to communication and management planning, and thus also a barrier to effective policy implementation. We close with thoughts on the applicability of both the methods and results to other situations where an understanding of multiple-use forest policy implementation is desired.
1. Introduction
Sustained focus on multiple-use forest management in recent decades has inspired creative approaches for balancing conflicting objectives, and models to evaluate tradeoffs have proliferated [1]. There are broad challenges inherent in forest management for multiple objectives, one of which is identifying the impact of each alternative. For example, cost–benefit analyses of carbon storage at different rotation ages or optimization studies of grazing intensity in agroforestry share the goal of clarifying the financial implications of competing uses, although they do not explicitly address other potential barriers to policy implementation [2,3].
A common case of competing uses of forestland is the provision of wildlife habitat and the production of timber. Changes may be necessary to accommodate both uses, such as adjusting the timing or intensity of timber harvests, with the potential for resulting financial repercussions. Yet numerous studies worldwide have concluded that habitat maintenance and profitable forest management are not necessarily in opposition [4,5,6,7,8]. In some instances, the perceived costs of meeting wildlife habitat needs on working timberland were overestimated until researchers parsed out the true economic impact [9]. One unique case of balancing wildlife habitat and timber production can be found in northern Maine, USA, where a State policy calls for commercial timberland to maintain, in specifically delineated locations, a forest type that deer rely on to survive harsh winters.
White-tailed deer (Odocoileus virginianus (Zimmerman) (Cervidae)) is a charismatic wildlife species that comes into contact with humans frequently across much of its range. It has high social value for a variety of reasons, including consumptive value as a game species, non-consumptive value to those who enjoy viewing deer in the forest or their backyards, and existence value as a component of healthy forest ecosystems [10]. The protection of deer for these values is a priority of many State-level wildlife management agencies, including the Maine Department of Inland Fisheries and Wildlife (MDIFW). Impelled by public desires, MDIFW implements multiple methods to maximize the number of deer across the State, including setting hunting limits and overseeing the protection of critical habitats [11]. Of particular relevance in the context of multiple-use land management is Maine’s policy for white-tailed deer that protects critical areas of winter shelter, referred to locally as deeryards, through restricted timber harvesting. The implications of this policy can inform a wide audience of wildlife biologists, foresters, and policymakers involved in habitat management activities that restrict timber harvesting.
1.1. Deeryard Characteristics and Zoning
White-tailed deer density relates inversely to winter severity in the deer’s northern range, where deep snow and cold temperatures result in high deer mortality in late winter and early spring [12]. In response to the pressure of increased metabolic requirements to maintain body temperature and move through deep snow, deer overwinter in sheltered areas rather than increase their foraging efforts [12,13]. These sheltered areas are characterized by low elevation, gentle topography, and dense softwood cover, which minimize snow accumulation and increase thermal insulation [14].
In the 1970s, the State of Maine’s Land Use Regulatory Commission (now the Land Use Planning Commission, LUPC) delineated many deeryards for official protection with the goal of maintaining deer abundance at a level sufficient to meet public demand, despite the toll of harsh winter weather [15,16]. These zoned areas, hereafter referred to as protected deeryards or PDs, were to be maintained as a winter habitat for deer in perpetuity [11]. They span both public and private land, many of which are commercially harvested for timber, and require specific planning steps prior to harvest. To prevent habitat loss or degradation, PD management guidelines and a timber harvest approval system were created to ensure that PDs continue to exhibit features determined to be of value to wintering deer, specifically, an average tree height within PDs of at least 10.7 m with 70% softwood-dominated crown closure [17]. The harvest approval process consists of a site visit by a State wildlife biologist and agreement between the biologist and forester on the harvest plan. Any single timber harvest may decrease crown closure below the published desired percentage within a portion of a PD if at least 50% of the PD meets the stated minimum.
1.2. Study Objectives
Under Maine’s current legislation, most PDs are in the State’s northern townships, where the majority of the land base is commercially managed timberland. Thus, much of the cost of this habitat provision policy is borne by forestland-owning entities. The imbalance between public and private value allocation and the associated impacts in the context of this unique policy was the impetus for focusing on this study. It has historically been an intractable issue in the State, with management standards subject to variable interpretation and no party completely satisfied with the outcomes. Despite the implementation of the policy, quality deer habitat on the landscape has declined since zoning [18], and most forest management companies see PDs on their property as a universal cost in timber production planning. Although silvicultural management of deeryards has been the subject of discussion since the establishment of regulations guiding deeryard management [19,20], there has not been, to the best of our knowledge, any direct comparison or analysis of alternative management options, nor an analysis of non-financial aspects of the policy.
With information from forest manager and wildlife biologist interviews in Maine and forest stand inventory data, we compared PD management information from both forester and wildlife biologist perspectives and estimated a variety of modeled management scenarios to articulate some of the tradeoffs and challenges of this policy’s implementation. We used a case study approach to examine how the wildlife policy is implemented on the ground, how it has altered forest management activities, and the financial implications of those changes on two timber-producing properties with different management histories, objectives, and stand conditions. The immediate purpose was to identify what landowners are doing in response to the policy and to determine whether perceptions of financial loss are accurate through the use of a simple comparison of discounted cash flows attained from models based on participant input. The resources and tools we used are inexpensive, accessible to most forest and wildlife managers throughout the USA, and are already widely used in the industry, and their application to this case study is in line with other growth modeling and financial analysis [21]. While ours is not a traditional optimization model or exhaustive cost–benefit analysis, it is a starting point for further discussion and consideration of possibilities through a replicable process that includes site-specific, real-world management information. The results provide a reference point for evaluating silvicultural options in deeryard management, and contribute to clarifying the outcomes of alternative scenarios and distinguishing the factors influencing those outcomes. The approach used in this case study can be applied to understanding policy trade-offs involving timber harvesting wherever growth-and-yield models and tree inventory data are available.
2. Materials and Methods
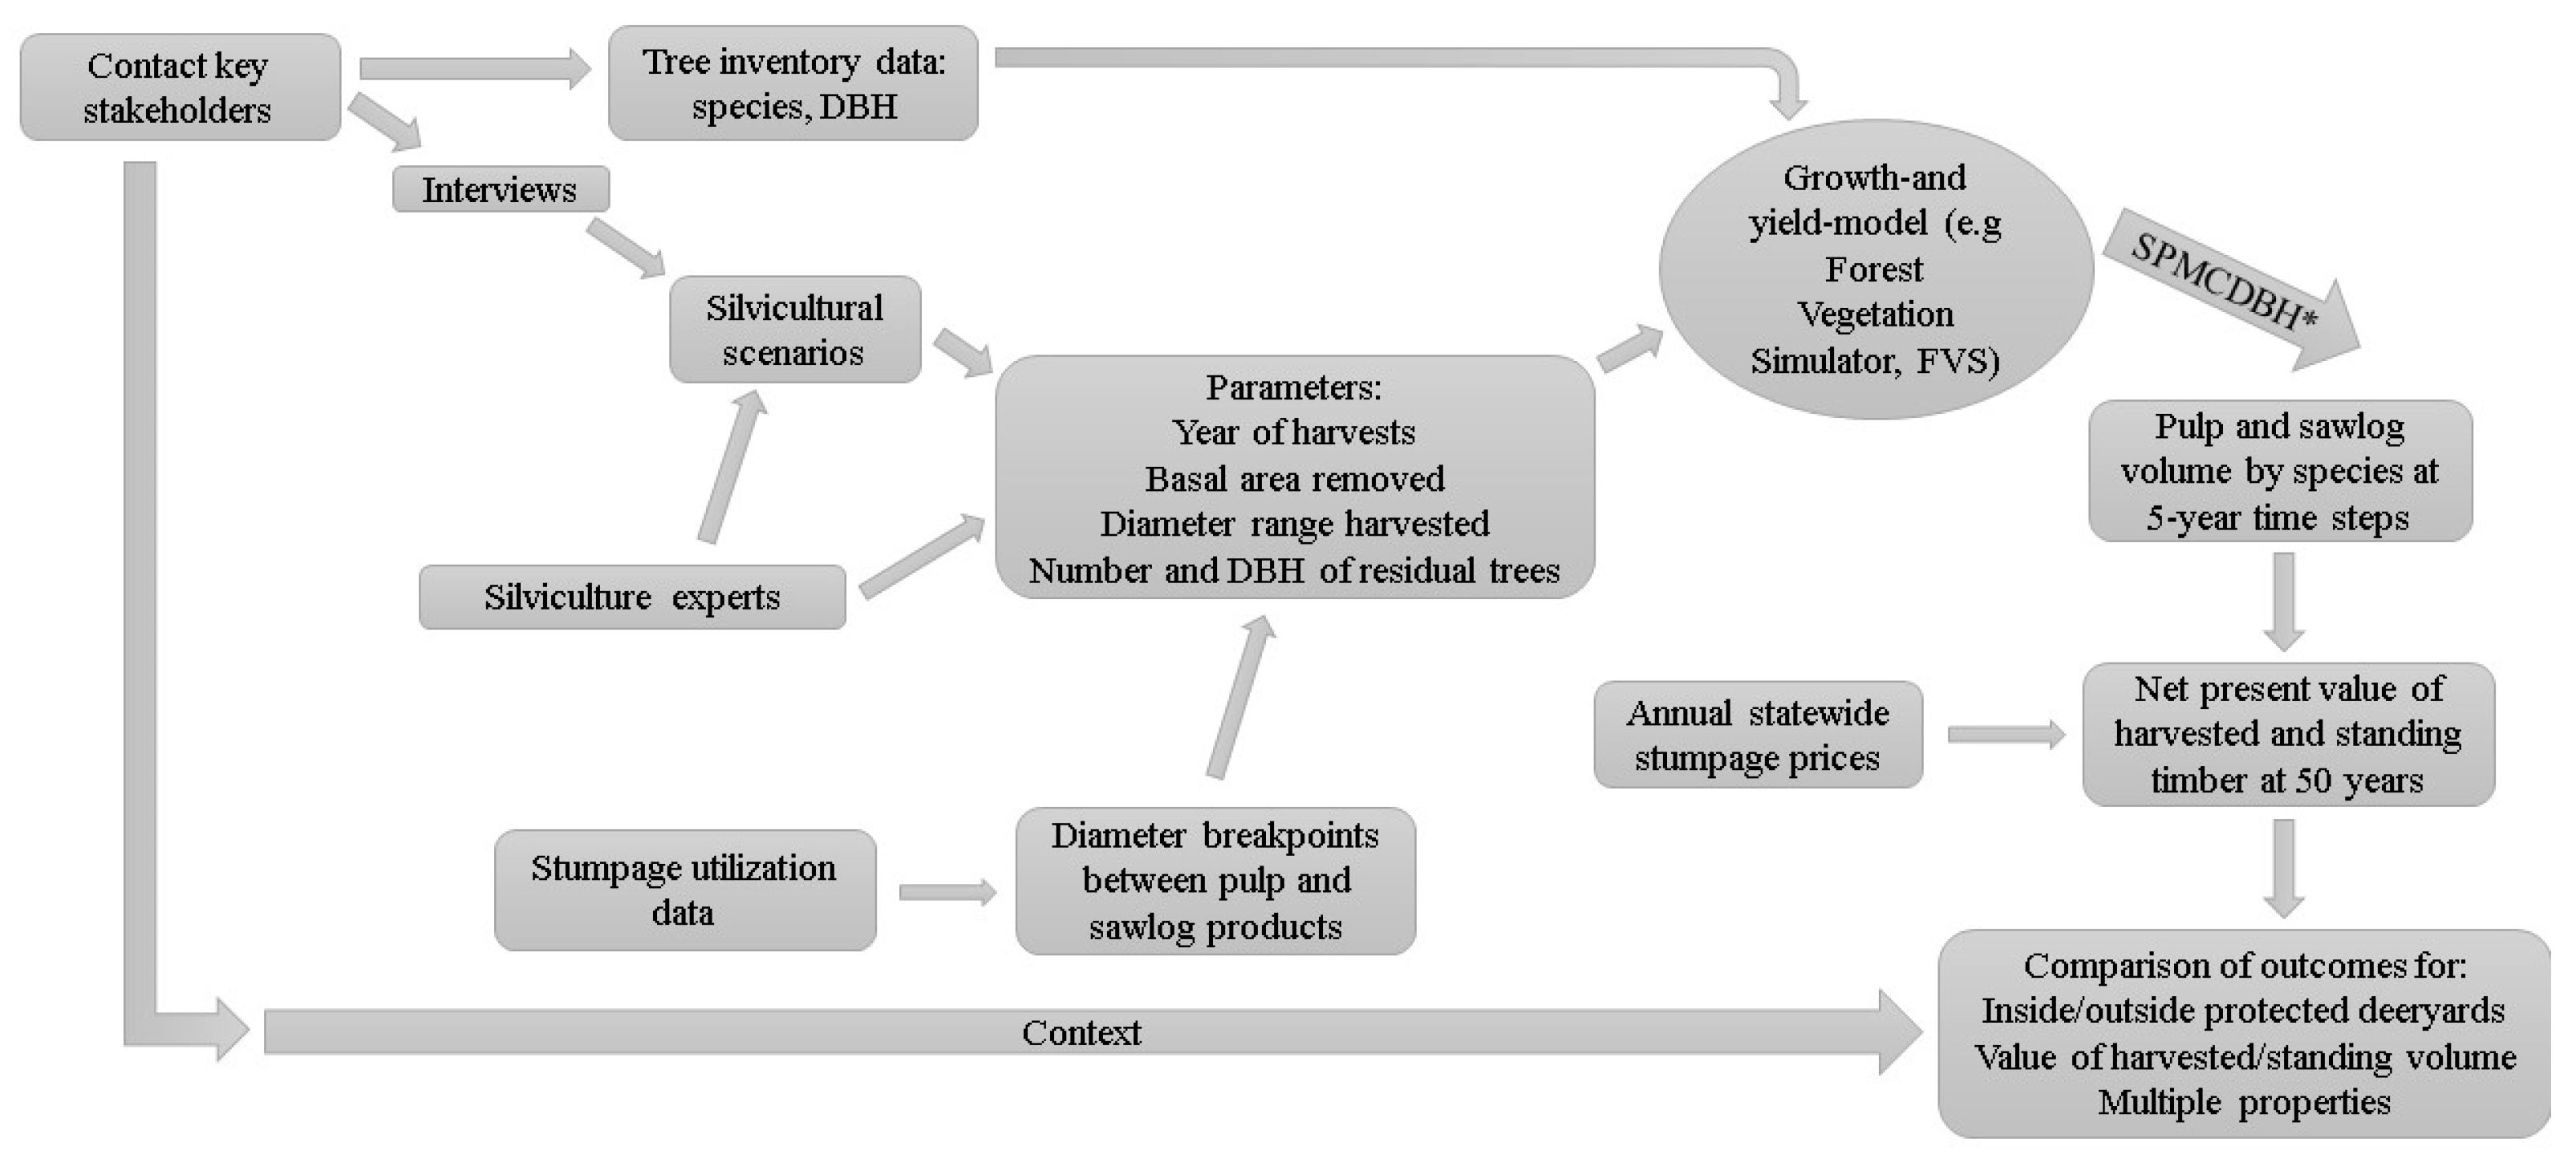
Our study objectives were: (1) To illuminate whether or not management inside PDs is a universal cost, as commonly believed by foresters; (2) to determine if there are other management options not currently practiced that might lead to better habitat outcomes on the landscape; and (3) to identify any other barriers to effective policy implementation. To do this, we relied on information solicited directly from managers and biologists, along with publicly available data and modeling tools (Figure 1). The components of this model are described in the following sections.
2.1. Interviews to Identify Relevant Silvicultural Systems
In order to identify timber management scenarios used on the landscape, we interviewed 17 employees from nine forest management entities (see upper left portion of Figure 1) in Maine regarding their timber management activities, both within PDs and elsewhere on their property (Institutional Review Board Approval #2015-12-14). The interviewed employees were recruited through their participation in a cooperative research unit with the University of Maine and subsequent word of mouth invitations from their colleagues. The interviewees included foresters, biometricians, supervisory staff, biologists, and an archivist, all of whom participated voluntarily. The entities represented landholdings across central and northern Maine, and all managed for or had winter deer shelter, if not designated PDs, on their property at the time of this study. The entities represented a variety of land ownerships, including land trusts, public agencies, conservation organizations, and commercial forest companies. The areas of the properties ranged from 12,000 to 485,600 ha, with areas managed for winter deer shelter comprising 3–58% of the individual landholdings.
While specific management objectives differed among entities, all included both timber production and wildlife habitat priorities. The questions in the semi-structured interviews (below) focused on the specific silvicultural systems that companies apply across their land base, whether there are differences in how they harvested inside PDs versus elsewhere, and if so, why and how they tailor prescriptions to PD management. We also asked for details on the process of acquiring approval from MDIFW for a harvest plan agreement, and the interviewees’ perspective on managing PDs. The interview responses are referenced in the text to provide context for the results; names and other identifying information were withheld to maintain confidentiality.
Forest management interview questions:
- What is your current management plan for your PDs?
- How would you manage that land if it were not in a zoned PD?
- Are you satisfied with the production of your stands in PDs? Do you have any plans to increase it?
- Are you satisfied with the returns brought in by stands in PDs? Do you have any plans to increase them?
- What is your estimate of the cost in time of managing PDs—including making a specific management plan and meeting with a state biologist? What other steps are involved?
- Are you willing to make your inventory and harvest data available to this project for more accurate computer modeling?
- Have you made any changes to your PD management? What were the results?
- Do your foresters notice deer in your PDs? Elsewhere on your property?
- Are you interested in managing for any other species?
- Would research on the range and habitat needs of any other species be of interest to you?
- Would you find a similar economic analysis of larger-scale PDs of value?
2.2. Parameterization of Silvicultural Systems
The silvicultural systems used by the cooperating companies and modeled in this study were uniform shelterwood, clearcut, group selection, and single-tree selection. These were the options cited by interviewees in answer to the questions, “What is your current management plan for your PDs?” and “How would you manage that land if it were not in a zoned PD?”. The interviewees also described the relative intensity, in terms of residual basal area and entry interval, of timber harvest plans inside and outside of PDs. Each scenario was modeled on a per-hectare basis to approximate the stand-scale silvicultural decisions foresters make within PDs. Though a shelterwood or clearcut would never be implemented on an entire PD, these systems could be applied to portions of a PD when appropriate. Intermediate treatments were not included in the modeling because they do not always contribute to revenue and are not a consistent treatment used among all silvicultural systems and landowners. A model with fewer variables allowed us to compare the impact of the policy on different forest management entities more clearly. The accuracy of management scenarios in relation to common practices after parameterization for modeling (Table 1) was reviewed by each interviewed forester, as well as three School of Forest Resources faculty members at the University of Maine (see center of Figure 1).
In addition to the widespread silvicultural systems identified in the interviews (uniform shelterwood, clearcut, group selection, and single-tree selection), two other systems implemented within the study area were modeled: Diameter-limit harvesting and “irregular group shelterwood with reserves,” a femelschlag-like treatment first applied in the Penobscot Experimental Forest, a property co-managed by the University of Maine and the U.S. Department of Agriculture, Forest Service for silvicultural research. For the latter system, initial gaps are created as a percent of the total acreage, and subsequent harvests expand outward from the original gaps, simultaneously protecting regeneration and leaving residual trees that will never be harvested [22]. The gaps can be small or large (10% or 20% of the total harvest block acreage, respectively). Assuming the 100-year rotation outlined by the original researchers, small-gap systems harvest 100% of the block over the rotation with 10-year entry intervals; large-gap systems harvest 100% of the block within the first 50 years and have no harvests in the second half of the rotation [23]. The researchers involved in its experimental implementation suggested that this system may be particularly appropriate for PD management, as it combines long rotations for tall trees, a high degree of standing cover for shelter, and regenerating areas that may provide browse [24], and so was included as a scenario option to assess the outcomes of it for land managers who are currently, or may consider, applying it. Likewise, the diameter limit harvest system was included due to its frequent application in the region, past and present; although it can lead to stand degradation over time [25] and no interviewed forester identified this in current prescriptions, it was included to represent harvests for the highest immediate net revenue and because it is still practiced broadly by some landowners. This resulted in seven silvicultural scenarios included in the quantitative analysis (Table 1).
2.3. Analysis of Forest Management Case Studies
Two forest management entities among those interviewed, hereinafter Company A and Company B, were selected as contrasting scenarios for modeling, given that they represent different but common management approaches in the region. Company A practiced typical commercial forest management for timber production, whereas Company B managed primarily for conservation and wildlife habitat priorities—the two represented contrasting management approaches and forest conditions to capture diverse modeling outcomes. Both companies voluntarily provided inventory tree lists suitable for populating input for the Forest Vegetation Simulator (FVS), Northeast Variant [26]. FVS is a stand-level, non-spatially explicit growth-and-yield program, the results of which are applicable to any hectare with composition similar to the input forest inventory data. It is a free, online-supported program commonly used by forest managers across the USA to model harvest plans and project stand growth. The scenarios we modeled could be applied at any spatial scale, meaning that interested land managers could infer outcomes from our models, whether they use a different silvicultural scenario on each hectare of a PD or the same scenario for the entire property. The input data, which included tree species and diameter at breast height (DBH) of all stems greater than 2.54 cm in 15-BAF variable radius plots, were used to model all management scenarios. Inventory sites from which plot data were drawn spanned multiple regions of Maine and included plots inside and outside PDs at each site. The initial tree species composition and stocking varied among the inventory plot locations and between PDs and non-zoned timberland (Table 2). Land management entity names and precise inventory plot locations are not disclosed to preserve confidentiality.
2.3.1. Forest Growth Modeling
Forest growth at the stand level was modeled under the seven silvicultural scenarios specific to either the regulated areas inside PDs or the more intensive “business as usual” scenarios outside PDs (i.e., what would be done in the absence of management constraints) by adapting the actual management prescriptions described during forester interviews to FVS. We parameterized the models for each silvicultural system, approximating the harvests described during interviews, and ran 50-year projections with FVS forecasting per-hectare annual growth and mortality according to default settings of the Northeast Variant. A 50-year time horizon was selected as the limit of reliability of projections while still capturing enough harvest entries to model each silvicultural scenario accurately. The parameters identified the years of harvest entries, absolute or proportional basal area (BA, m2 ha−1) removed in each entry, diameter range of trees harvested, quantity and DBH of any residual trees to be retained after an otherwise complete removal, and any species excluded from harvest. Scenarios of incomplete timber removal within PDs excluded northern white-cedar (Thuja occidentalis L.) and eastern hemlock (Tsuga canadensis L.) from harvest, as is common practice due to these species’ high value to wintering deer [27,28].
2.3.2. Financial Analysis
The harvested volume of pulpwood and sawlogs for each silvicultural scenario, calculated with FVS internal equations, was tabulated by species, along with standing volume at 50 years. Including the final standing value of the stand limited the potential to favor systems with short rotations or heavy early harvests, which would yield higher returns from harvests in the near term but leave less value in the residual stand for future harvests. FVS output was divided into product classes using the “SPMCDBH” function, which allows the user to specify the breakpoint DBH between product classes by species [29]. Breakpoints were determined by the Maine Forest Service based on stumpage utilization data [30]. The wood product output of simulated harvests was converted to financial returns in a discounted cash flow approach using statewide average stumpage prices in U.S. dollars from the 2014 Maine Stumpage Price Report [31]. All revenues that were not acquired from a harvest at year 0 were discounted at a rate of 4%, a lower discount rate than is likely for private timber companies, but one that can represent public lands or lands with multiple management priorities [32]. Total discounted per-hectare stumpage harvested from PDs on each property, combined with the discounted stumpage value of standing trees at the end of the 50-year time horizon, was compared to revenues from similar harvests outside of PDs. The difference estimated the financial cost of timber harvests inside a PD relative to areas of the property not subject to timber harvest restrictions. We focused on discounted cash flow rather than more traditional metrics such as LEV in order to more easily compare between even-aged and uneven-aged silvicultural systems, along with opportunistic harvest (e.g., diameter limit harvest), over a mid-range projection period. In addition, this metric was replicable by and understandable to forest managers. The scope of this project and the data available from private companies did not allow a complete cost–benefit analysis that incorporated all aspects of management inside PDs, such as the time required to develop and receive approval for PD-appropriate harvest plans or the potential need of a specific type of harvest equipment to carry out the approved plan.
3. Results
3.1. Interviews Reveal Relevant Silvicultural Systems and Implementation Challenges
The responses to the interview questions regarding management options revealed a set of silvicultural systems common among entities participating in the study. Although the forest stand entry interval and harvested basal area differed among companies, all interviewed foresters indicated that “business as usual” management typically consisted of the uniform shelterwood system or clearcuts with possible intermediate precommercial or commercial thinning treatments. The questions about management inside PDs elicited a greater variety of responses, including infrequent opportunistic harvests in which PDs were harvested if an outside-PD harvest happening nearby; low-intensity single-tree selection systems; group selection; and treatments similar to those applied outside of PDs.
The interviewees also provided perspective on the challenges of preparing prescriptions for PDs. Forest managers expressed the perception that the time and effort involved in gaining MDIFW approval for harvest plans presented an obstacle to consistent management within PDs; most estimated that it required an extra day for the site visit and paperwork involved. Many foresters also expressed uncertainty that a given plan would be approved, despite their efforts to follow the guidelines, or that they would need to make significant changes to their ideal prescription to accommodate the MDIFW requirements, potentially diminishing the financial feasibility of the operation. These challenges in the early stages of harvest planning led many companies not to prioritize, or even simply to avoid, harvesting within PDs. They particularly avoided intermediate treatments such as thinning due to the lower profits and doubt regarding the ultimate payoff of those treatments at the end of the rotation, given the restrictions placed on final harvest. Most forest managers understood that MDIFW oversight was necessary to maintain the habitat, but felt that communication and understanding was limited. Participants from MDIFW acknowledged that the current policy does not produce perfect outcomes, but that most feasible alternatives would lead to greater dissatisfaction among stakeholders. They attempt to balance site-specific habitat conditions, landscape-scale population dynamics, and public desires in the guidance they provide to forest managers, resulting in some frustrating interactions due to conflicting objectives. The biologists expressed a desire to improve communication surrounding interpretation of the guidelines, silvicultural options, and the intended beneficial purpose of the approval process.
3.2. Analysis of Forest Management Scenarios
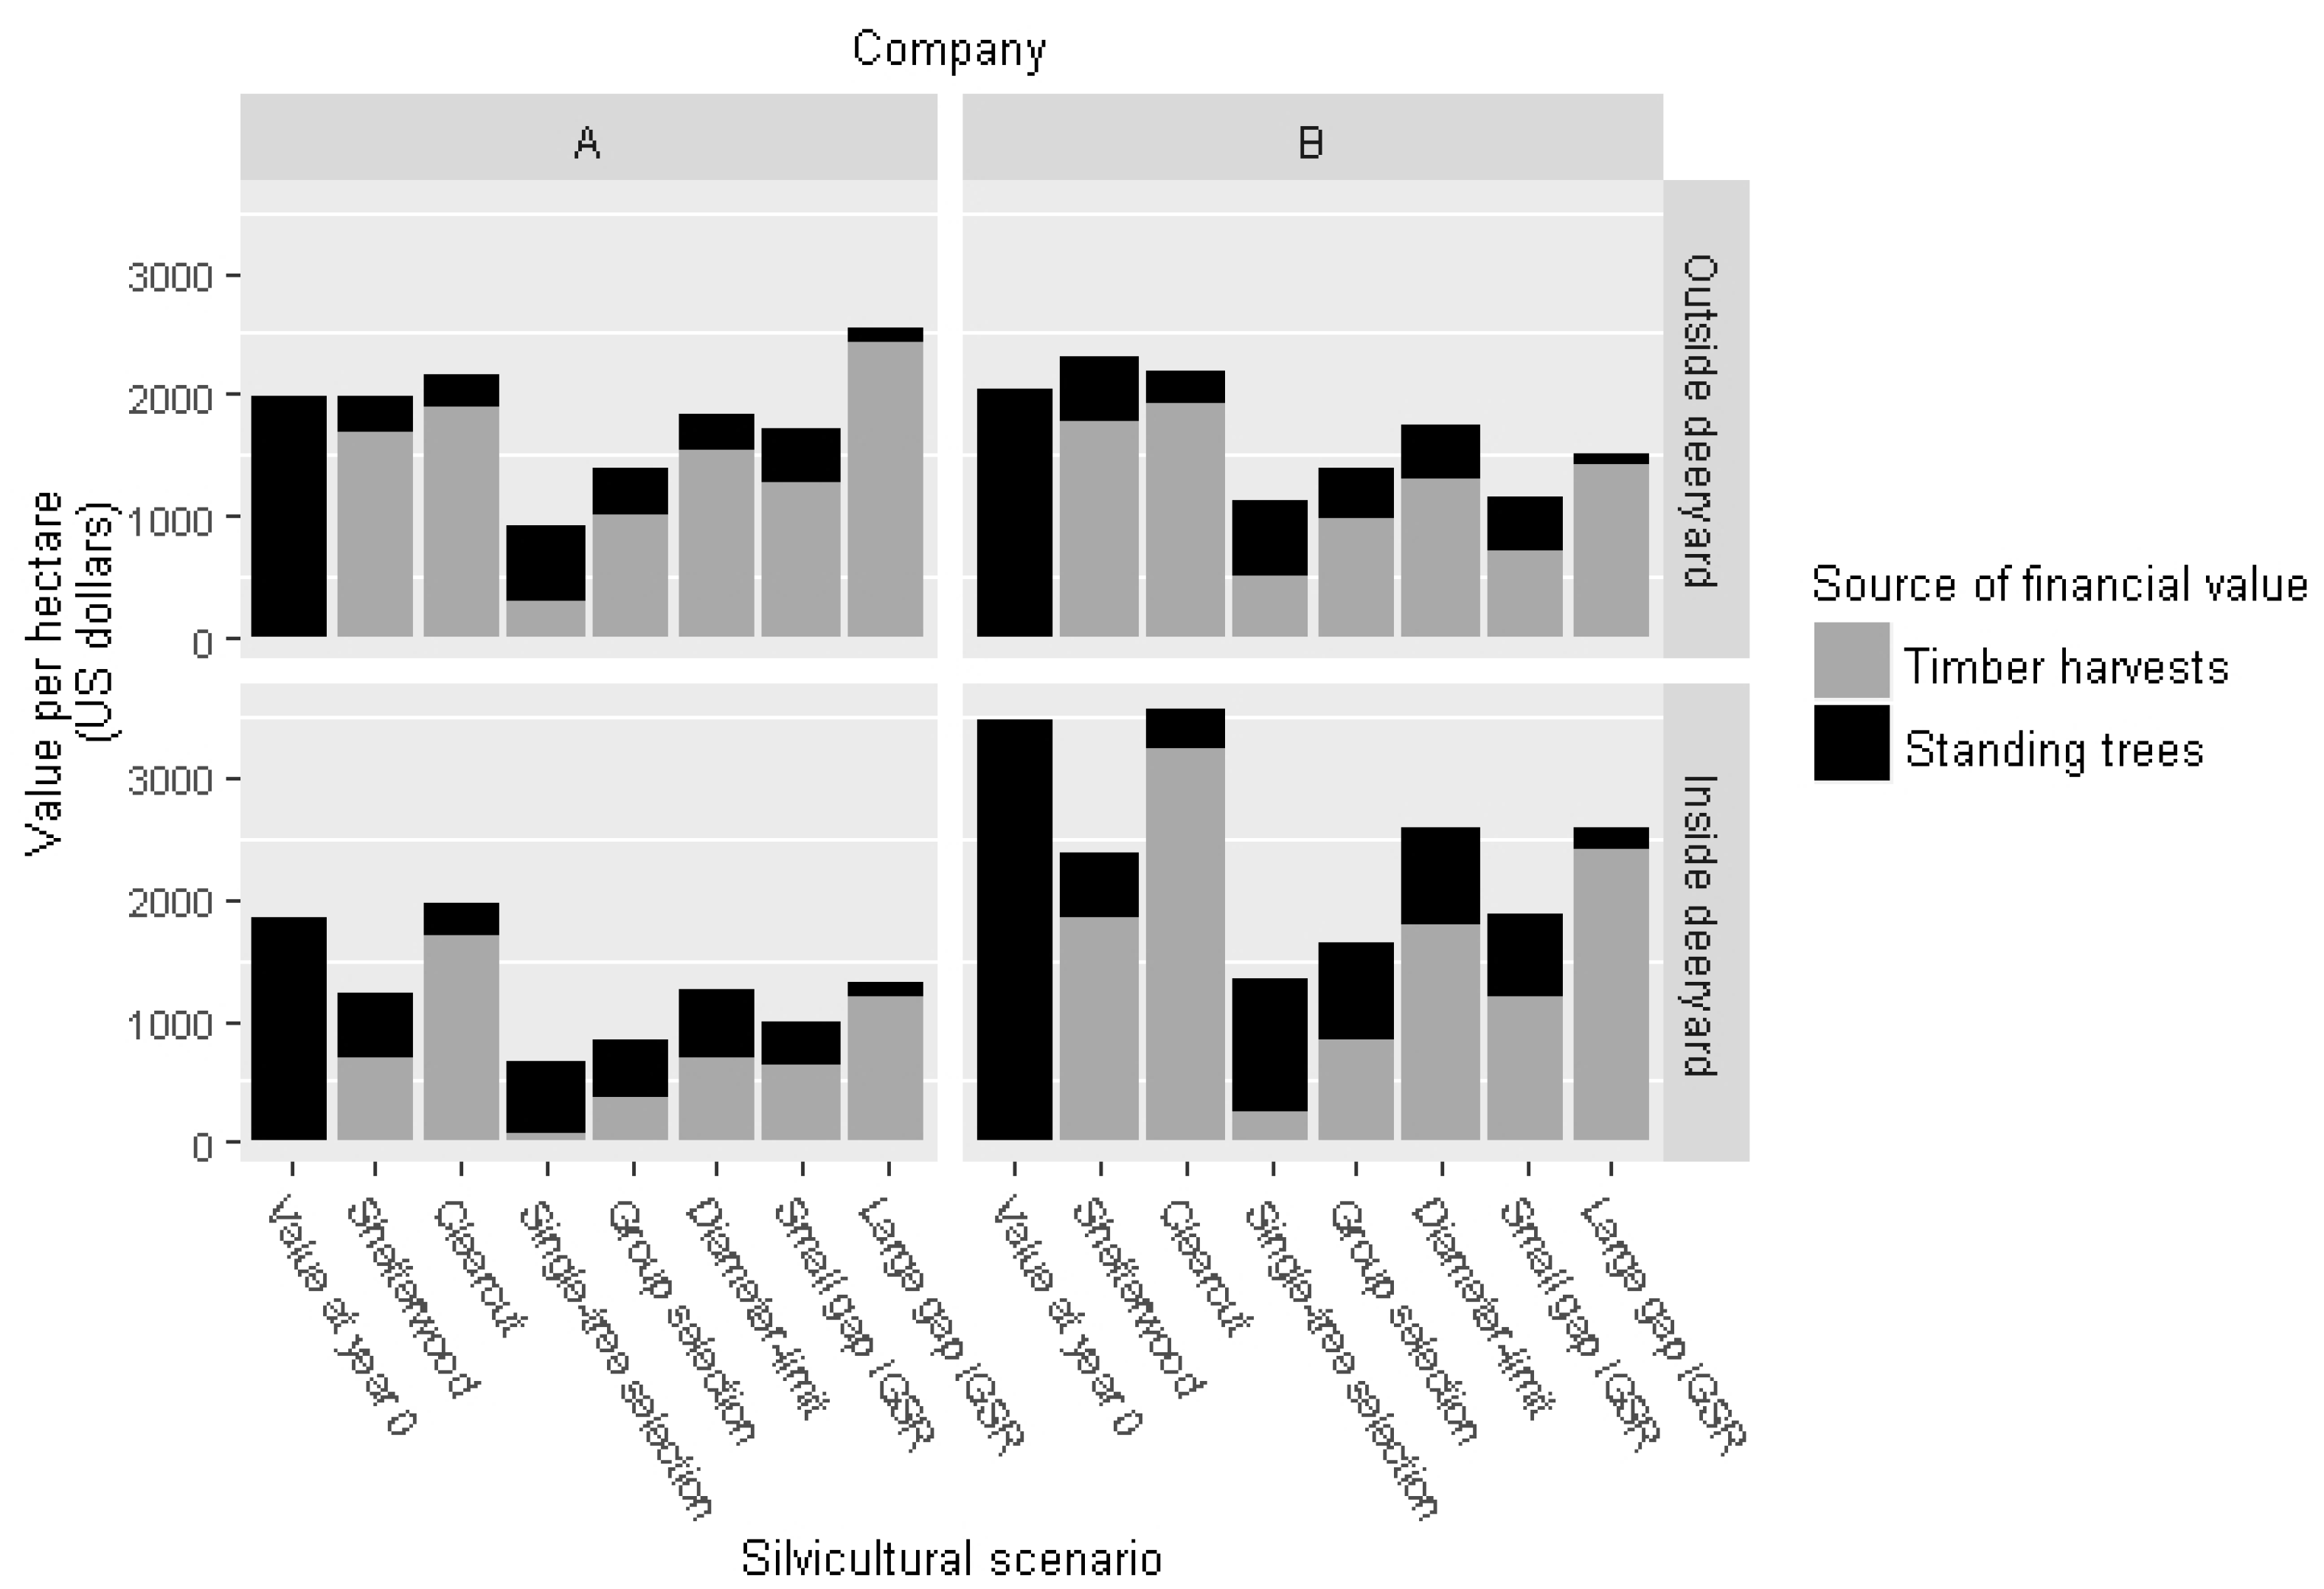
The model runs indicated that the partial harvest scenario of single-tree selection left a relatively greater proportion of the value as standing trees, whereas the other scenarios resulted in higher revenues from harvested trees within the 50-year simulation horizon (Figure 2). The large-gap irregular group shelterwood with reserves system left a small proportion of standing tree value, which was a feature of the system as it has been experimentally implemented: 100% of the harvest block was cut within the first half of the 100-year rotation, leaving only the reserve trees standing at the end of the 50-year simulation. The small-gap system, in contrast, distributed harvest revenue across the entire 100-year rotation, resulting in a smaller ratio of harvested-to-standing trees at 50 years.
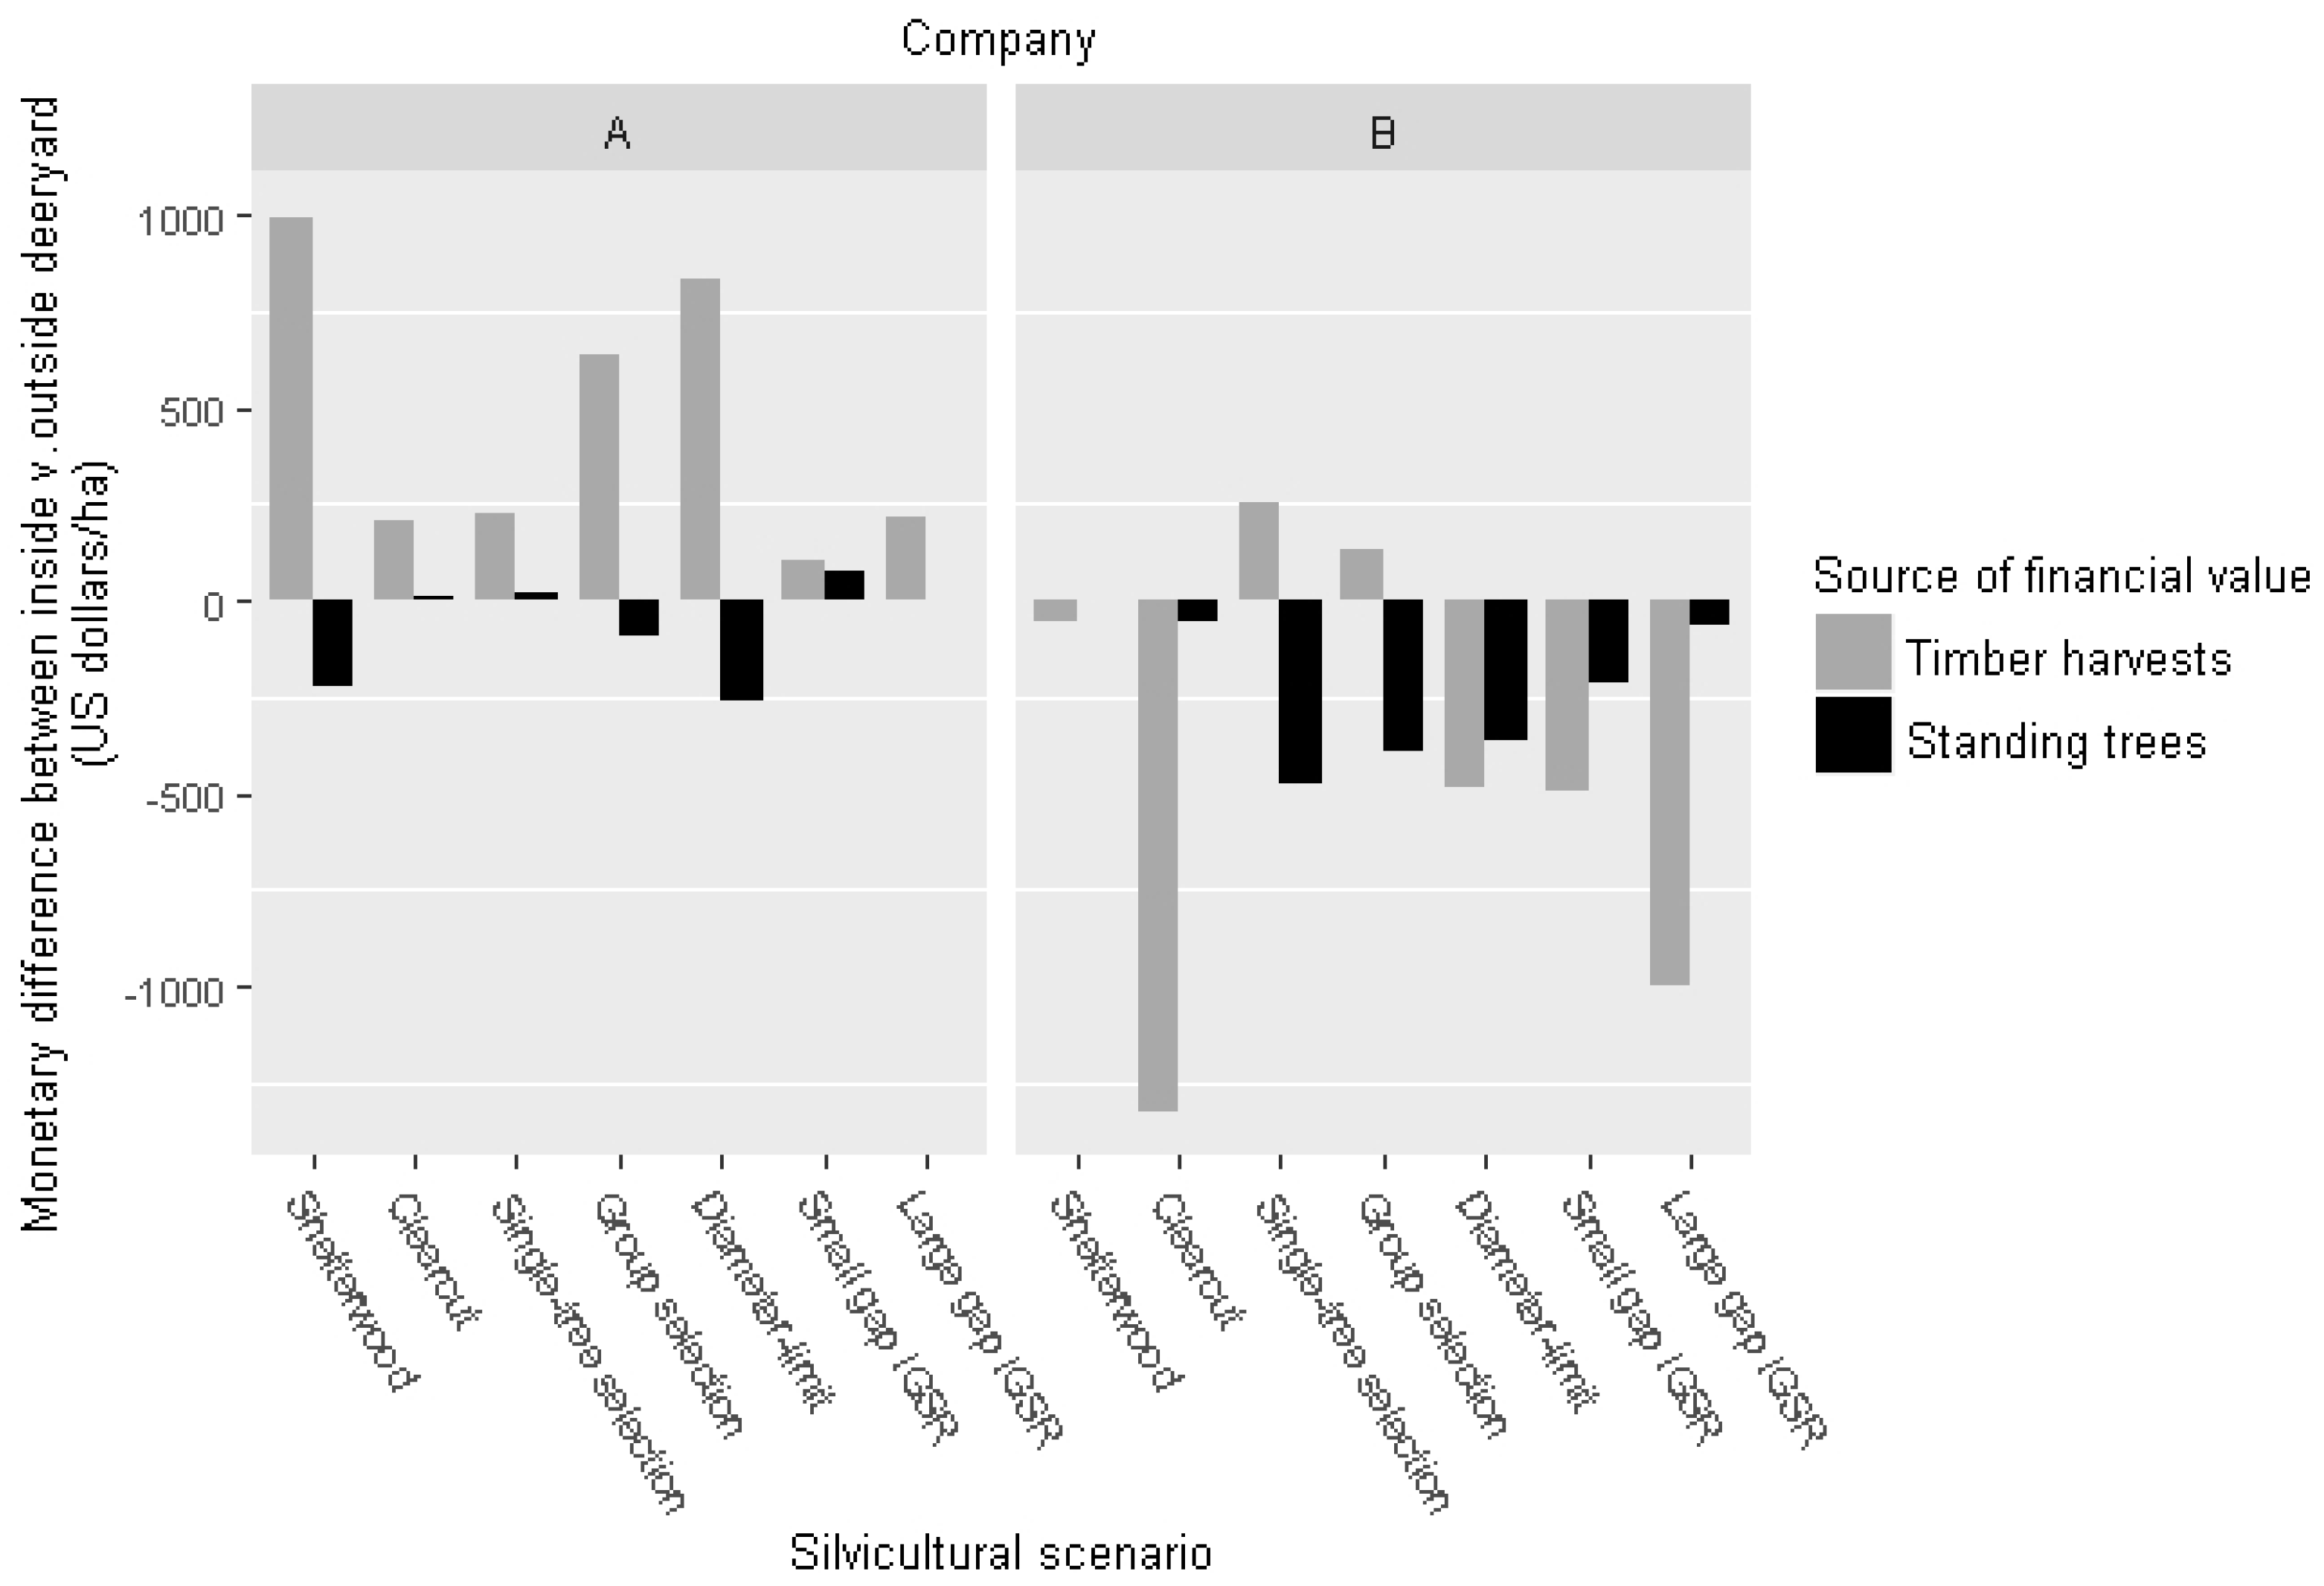
The differences between inside- and outside-PD revenues for each company, representing the net loss or gain associated with inside-PD silvicultural scenarios when compared to “business as usual” management outside PDs, are synthesized in Figure 3. Modeling with Company A tree lists resulted in higher returns coming from harvests outside of PDs across all silvicultural scenarios. The revenues from the modeled scenarios for Company B, in contrast, were not always lower inside PDs, as indicated by the negative values when the revenue from PDs was subtracted from that of the outside-PD scenarios (Figure 3). The only cases in which greater revenues resulted from “business as usual” management for Company B were single-tree and group selection harvests when the final standing tree value was not considered. These two uneven-aged silvicultural systems, in which full overstory removal does not occur, produced lower harvest returns because of a smaller percentage of stumpage extracted, but the final standing tree value was greater inside PDs for all silvicultural scenarios in Company B.
4. Discussion
We used primary data from forest management professionals to inform stand-level simulations comparing the outcomes of timber harvest under a wildlife policy limiting harvest options. The study was situated in a context where many professionals involved in policy implementation expressed frustration over suboptimal outcomes, either financially or in terms of resulting habitat quality on the landscape. Our model outlined a range of options, and stakeholder input from interviews provided necessary background to understand those outcomes and the factors affecting actual management decisions. We first discuss the results of this case study and then evaluate the applicability of our approach to other policy issues with multiple-use objectives.
4.1. Secondary Effects on Habitat Quality Due to Policy Constraints
Declines in deeryard quality can occur when intense harvests outside of the deeryard extend to the PD boundary, essentially creating an island of winter shelter with sharp transitions to neighboring forest types [11,18]. The interviewed foresters expressed that because they often felt constrained in the type or intensity of harvest that they were allowed to perform in PDs, they did not prioritize, and sometimes actively avoided, incorporating PDs into harvest plans, even though active management might produce better landscape-level outcomes for deer habitat overall. Multiple interviewed foresters communicated that harvesting within PDs required additional time and effort to design a prescription appropriate for maintaining the state-specified winter shelter characteristics and to obtain approval to harvest. Furthermore, there was a commonly held belief among the foresters that harvests designed to maintain winter shelter in PDs were less profitable due to the “light touch” to which most prescriptions were restricted and the lower quality trees grown in the absence of typical intermediate treatments such as thinning. The difficulty of finding a logging operator to agree to the anticipated low financial returns often associated with PD harvests could be prohibitive to management. These factors contributed to the current state of isolated, densely stocked deeryards surrounded by intensively managed forest, thus compromising the landscape-level quality of the PDs as accessible winter deer habitat (e.g., through loss of habitat corridors that previously connected PDs).
4.2. Case-Specific Revenue Patterns: Are Restrictions in Forest Management a Universal Loss?
The difference in financial returns between Company A and Company B was largely due to stand-level variation. For Company A, representing historically commercially managed land, the lower value found within PDs may have been due to a lack of intermediate treatments. As the interviewed foresters pointed out, longer rotations and uncertainty regarding harvest approval sometimes deterred landowners from intermediate treatments such as thinning, which often were light to maintain the necessary high percentage of crown closure. The delay and uncertainty of the magnitude of returns dissuaded many from making the investment. Without intermediate treatments, PDs on Company A property had a lower average quadratic mean diameter (QMD; cm) and higher number of trees per hectare (TPH) than stands outside PDs (Table 1). These metrics indicated a high density of trees with a smaller average DBH, and therefore a greater percentage of low-value pulpwood relative to sawlogs. Although Company B’s inventory revealed even greater differences between inside- and outside PD stand metrics than Company A’s inventory, species composition was a key factor in Company B’s greater revenue from inside PDs. Perhaps due to its history as conservation land with long silvicultural rotations that favored long-lived, shade-tolerant tree species, Company B’s property was dominated by northern white-cedar and eastern hemlock. Outside of PDs, American beech (Fagus grandifolia Ehrh.) was a major component alongside the dominant two conifer species. Inside PDs, the third most prevalent species was red spruce (Picea rubens Sarg.), with sawlogs worth more than double those of beech at the time of analysis [31]. Thus, greater revenue was realized from simulated harvests inside PDs because of their greater current species-specific stumpage value.
Because of the difference in species composition between the two properties and variations in initial stand metrics, the models resulted in one company experiencing a loss due to restrictions on harvests within PDs, whereas another gained an advantage in some scenarios despite the lower intensity harvests. The difference in revenue patterns between the two companies led us to conclude, in this case study, that forest stand characteristics and landowner objectives that determined past management more strongly influenced the outcomes of current management decisions within PDs than the silvicultural limitations imposed by the policy itself. Thus, Maine’s winter deer habitat policy impacts forest management entities differently depending on the forest structure and composition inside and outside PDs on different properties. We conclude that timber harvesting inside PDs can produce revenues depending on the site characteristics thus the widespread and popular perception of low timber value among foresters is unfounded. Furthermore, due to this perception, there may be less investment in intermediate treatments inside PDs, resulting in lower revenues in the long-term and thus can become a self-fulfilling prophecy.
4.3. Solutions through Management
Recognizing that silvicultural options are constrained when operating within PDs, there may be an advantage to seeking a percentage of harvested volume there in order to promote active management and achieve better habitat and returns. It is possible that more targeted silvicultural activity within PDs could maintain and improve long-term habitat quality in these remaining critical patches of winter deer shelter. Well-planned silviculture could increase the health and resilience of previously neglected stands and spread the harvest more evenly across zoned and non-zoned areas, limiting the impact on habitat quality of sharp differences in PD and non-PD management. By presenting feasible options that have been employed successfully by timber companies and clearly articulating the differences between inside- and outside- PD management, we hope to decrease hesitance of other landowners to harvest in PDs. These results describe a set of common, field-tested and successful management practices for forest managers working within harvest-restricted units. The diameter limit scenario, a common alternative to silviculture, yielded revenues competitive to the common silvicultural systems in the short term, but did not maintain consistent revenues, and research indicates that it does not maintain stand characteristics indicative of quality habitat in the long term [25,33]. In addition to the common silvicultural practices currently in use, we included an uncommon silvicultural system, the irregular group shelterwood with reserves, which has the potential to achieve comparable revenues to more common systems while maintaining necessary habitat characteristics. Theoretically, this system could be implemented across the entire PD, continuously regenerating patches while providing winter shelter in the matrix with access to regenerating browse in neighboring gaps [23]. Additionally, the small-gap version of this system can provide regular income to the landowner at 10-year intervals throughout the stand rotation. These rarely used silvicultural systems can produce revenue inside PDs and are likely to produce quality deer habitat outcomes on the landscape.
Our results provide confirmation, alongside other studies, that managing for wildlife is not a universal loss. In another economic analysis comparing wildlife and forestry trade-offs, Kline et al. [9] calculated a lower cost of black bear damage to crop trees than previously thought when they modeled the impact of the actual injury caused. A study in the southern U.S. found that although management that included deer habitat goals reduced the optimal LEV relative to only timber production, wildlife-only management had positive LEVS overall and, when the willingness to pay for regional hunting lease rates were taken into account, could compete with traditional management [4]. Likewise, our analysis revealed that this deer habitat provision policy is not the cost it is perceived to be in every case. In a study comparing timber harvest management to grouse-friendly management in Finland, researchers found that 30-year net present value (NPV) calculations at very low discount rates resulted in economic benefits to wildlife management in some cases [5]. Similar to our analysis, they found that a non-management parameter (discount rate used) had a large impact on the calculated outcome; in our case, it was site-specific species factors that influenced the results. If it was made clear that harvesting in PDs is not necessarily a financial loss or an insurmountable inconvenience, a greater percentage of revenue could come from harvests in PDs, potentially easing the intensity of harvests in adjacent stands and improving the landscape-level habitat quality.
4.4. Methodological Approach Evaluation: Challenges of Policy Implementation
The approach we used here generated a diversity of outcomes from silvicultural modeling and suggested explanations for the different model outcomes through information gathered in interviews. The analytical process could easily be replicated to include additional inventory data sets from other forest management entities. Entirely quantitative analyses are common but lack the contextualization that we gained from interview responses in this complex policy case. Furthermore, in controversial or divisive management questions, the decision to include stakeholders in the research process increases cooperation, transparency, participant investment, and likelihood of a positive resolution [34]. We recommend this stakeholder-informed comparison approach as an initial step in clarifying land management tradeoffs in many contexts. Through this analysis, we identified two fundamental challenges representing likely barriers to ideal policy implementation and evaluation of management outcomes through this process.
A challenge encountered in modeling was that forests inside and outside PD boundaries were subject to different management practices in the 30–50 years since designation of zoning and often had differences in site quality that influenced tree growth (and deer habitat suitability, and thus the likelihood of being designated a PD), even before deeryard zoning, resulting in different standing inventories at present. Avoidance of timber harvests inside PDs on many properties allowed accumulation of tree volume that, if harvested according to “business as usual” scenarios, would yield high value for one rotation. The returns from mining this accumulated tree growth would not be sustained over subsequent rotations of “business as usual” management. Thus, inventory plots and associated tree lists from inside PDs were used to model inside-PD management, and likewise for outside-PD plots and management. Modeling outside-PD management on inside-PD tree inventory would simulate the elimination of harvest restrictions inside PDs, a scenario that is unlikely given the high social value of deer in Maine today. The result was that returns from inside- and outside-PDs could not be directly compared to each other as in a true opportunity cost analysis, as initial condition data were not available. This highlights the difficulty in assessing the impacts on forest management of a policy that has been in place for several decades. Many forest management companies do not have access to large, fully representative data sets or the means to perform detailed opportunity cost analyses; the method described here can provide insight into potential outcomes, despite limited analytical capacity or data availability. Future studies in the northern conifer region could explore economic impacts more completely.
An unexpected challenge in both policy implementation and silvicultural modeling, revealed through the interviews and model parameterization process, was the difficulty of comparing forest inventory metrics (and FVS outputs) to MDIFW deer wintering area management guidelines. The main characteristics that determine the quality of a PD according to MDIFW are crown closure and tree height [17]. These metrics are two of the least accurately measured elements of forests [35,36,37], and typical forest inventory metrics cannot be reconciled with the guidelines. There is a misalignment in the metrics the two key parties use to evaluate the same forest stand. Basic scenarios that had been field-validated to preserve adequate winter shelter were simulated here, but FVS and most other growth-and-yield modeling software are unable to approximate habitat quality after the modeled harvests. Were MDIFW to release revised guidelines based on standard inventory metrics, such as a desired stem diameter distribution and basal area, foresters would be better able to translate stand characteristics into habitat management goals prior to meeting with a biologist, perhaps improving the process and results of the harvest plan approval meeting. This obstacle to both management and modeling was one of the gaps in policy implementation and monitoring that became clear through our case study.
The generalizability of our approach to other management contexts would be increased by incorporating more variants of harvest type and intensity within the modeled silvicultural scenarios. An ability to model the policy from the point of implementation, using the forest data at that time, would enable a more traditional cost–benefit analysis. However, our simple approach can be adapted to evaluate the outcomes of forest practices in response to other regulatory constraints, policies, or desired stand characteristics, and is based on tools and data readily available to managers. We gained insights into the decisions land managers make in the face of the state policy and the underlying causes of its unanticipated fragmenting effect on landscape-level winter deer habitat in northern Maine. More detailed analyses can be undertaken once the context of a given challenge is understood and the implications of a basic set of options are outlined.
5. Conclusions
Multiple-use forest management can involve biological limits of trees and wildlife, pressures for profit maximization, conflicting management objectives, and preferences of the public and thus can be difficult to evaluate across ownerships. We proposed an approach that leveraged stakeholder participation to parameterize and contextualize comparison of revenue streams from common forest management actions. It proved effective to draw conclusions and comparisons regarding the outcomes of varying policy interpretation and implementation. The tools used (FVS and Excel) are widely accessible (or in the case of tree growth-and-yield models, can be substituted by other regionally available models), have strong online support, and are already in use by many forest managers in the industry; the quantitative analysis (discounted cash flow) is common in business and involves straightforward calculations. Large or numerous data sets are not necessary for making comparisons, though more data will likely yield more representative and detailed results. Because this is not a statistics-based approach with inherent assumptions, there are few drawbacks to gathering the information available through interviews, modeling forest management options, and comparing the resulting revenue streams, when there may not be sufficient resources or expertise for a full cost–benefit or opportunity cost analysis. Interviewees, as informed professionals, might act as expert advisors to interpret unexpected results and help determine if model outcomes are accurate.
In summary, the combination of silvicultural modeling based on actual forest management decisions, quantitative economic results from a standardized process applied to each inventory data set, and input from knowledgeable and diverse parties yielded a comparison of contrasting forest management outcomes that can be used to explore the implications of wildlife policy in more depth. We used this approach to refute a common perception that timber harvesting inside PDs cannot produce significant revenue and to identify rarely used silvicultural systems that have great potential to improve multiple-use outcomes. Information gathered through interviews highlighted policy implementation barriers such as differing forest metrics that would not otherwise have been revealed. Other forest and wildlife management entities can refer to these results or adapt the methods to their own management scenarios and data. This approach is flexible and could be applied to understanding and evaluating policy or management implementation that affects forest management decisions to meet multiple-use objectives.
Author Contributions
Conceptualization, K.B., M.S.C. and A.M.R.; methodology, K.B., M.S.C. and A.M.R., analysis, K.B. and M.S.C.; and writing, K.B., M.S.C. and A.M.R. All authors have read and agreed to the published version of the manuscript.
Funding
This project was supported by the USDA National Institute of Food and Agriculture, McIntire-Stennis Project number ME042018 through the Maine Agricultural & Forest Experiment Station under Publication Number 3851. This research was also supported by the USDA National Institute of Food and Agriculture, McIntire Stennis projects 1005416 and 1011463 and the Cooperative Forestry Research Unit, University of Maine, Orono, ME, USA.
Institutional Review Board Statement
The study was conducted according to the guidelines of the Declaration of Helsinki and approved by the Institutional Review Board of the University of Maine (approval #2015-12-14, date of approval 14 December 2015).
Informed Consent Statement
Informed consent was obtained from all subjects involved in the study.
Data Availability Statement
Non-proprietary data used in this study is available upon request from the authors.
Acknowledgments
Thank you to Robert S. Seymour of the University of Maine for FVS guidance and use of his merchandising key; Laura Kenefic of the U.S. Forest Service; Keith Kanoti and Neila Cole of the University of Maine; helpful comments from outside reviewers that greatly improved this manuscript; and, most importantly, cooperators representing many Maine forest and wildlife management entities for their generosity in time and information. All analysis and interpretation is that of the authors.
Conflicts of Interest
The authors declare no conflict of interest. The funders had no role in the design of the study; in the collection, analyses, or interpretation of data; in the writing of the manuscript, or in the decision to publish the results.
Appendix A
Financial data shown in Figure 2: Economic returns in U.S. dollars per hectare of modeled management scenarios inside and outside of protected deeryards of two companies. The “Harvest” value is the total returns from all harvest entries within 50 years with the first entry at year 0; the “Standing” value is the stumpage value of standing timber at the end of the 50-year simulation. The first row represents the value of the starting inventory tree list before any harvests were modeled. “IGSR” represents the irregular group shelterwood with reserves system.
| Company A | Company B | |||||||
| Management type | Inside Deeryard | Outside Deeryard | Inside Deeryard | Outside Deeryard | ||||
| Value source | Harvest | Remaining | Harvest | Remaining | Harvest | Remaining | Harvest | Remaining |
| Starting value | 0 | 1849 | 0 | 1991 | 0 | 3472 | 0 | 2044 |
| Shelterwood | 685 | 526 | 1682 | 300 | 1843 | 526 | 1788 | 525 |
| Clearcut | 1700 | 249 | 1904 | 258 | 3237 | 333 | 1911 | 276 |
| Single tree selection | 83 | 589 | 312 | 612 | 250 | 1093 | 505 | 617 |
| Group selection | 355 | 494 | 995 | 399 | 840 | 811 | 976 | 421 |
| Diameter limit | 690 | 558 | 1526 | 302 | 1780 | 796 | 1296 | 437 |
| Small-gap IGSR | 632 | 369 | 1263 | 444 | 1208 | 658 | 711 | 448 |
| Large-gap IGSR | 1208 | 110 | 2416 | 114 | 2416 | 157 | 1421 | 93 |
Appendix B
Financial data shown in Figure 3: Difference in revenue per hectare between “business as usual” (outside protected deeryard, PD) management scenarios and those applied within PDs of two companies. Each cell represents the U.S. dollar value from harvested or standing timber of a “business as usual” scenario minus the value of a scenario modified for PDs, using inventory data from each company. Harvest revenue is total returns from all entries within 50 years with the first entry at year 0; the standing value is the stumpage value of standing timber at the end of the 50-year simulation. Positive values indicate greater revenue outside PDs; negative indicate greater revenue inside. “IGSR” represents the irregular group shelterwood with reserves system.
| Company A | Company B | |||
| Value source | Harvest | Standing trees | Harvest | Standing trees |
| Shelterwood | 996.48 | −225.17 | −55.32 | −0.95 |
| Clearcut | 204.34 | 9.8 | −1325.89 | −57.2 |
| Single tree selection | 228.6 | 23.24 | 255.27 | −476.22 |
| Group selection | 639.28 | −94.57 | 136.33 | −390.24 |
| Diameter limit | 835.47 | −255.72 | −484.56 | −358.91 |
| Small-gap IGSR | 106.44 | 74.77 | −497.26 | −210.17 |
| Large-gap IGSR | 212.88 | 4.91 | −994.52 | −63.7 |
References
- Kline, J.D.; Harmon, M.E.; Spies, T.A.; Morzillo, A.T.; Pabst, R.J.; McComb, B.C.; Schnekenburger, F.; Olsen, K.A.; Csuti, B.; Vogeler, J.C. Evaluating Carbon Storage, Timber Harvest, and Habitat Possibilities for a Western Cascades (USA) Forest Landscape. Ecol. Appl. 2016, 26, 2044–2059. [Google Scholar] [CrossRef]
- Klemperer, W.D. Forest Resource Economics and Finance; McGraw-Hill, Inc.: New York, NY, USA, 1996. [Google Scholar]
- Stainback, G.A.; Alavalapati, J.R.R. Economic Analysis of Slash Pine Forest Carbon Sequestration in the Southern US. J. For. Econ. 2002, 8, 105–117. [Google Scholar] [CrossRef] [Green Version]
- Davis, P.B.; Munn, I.A.; Henderson, J.E.; Strickland, B.K. Economic Tradeoffs of Managing for Timber Production or Wildlife Habitat. J. Wildl. Manag. 2017, 81, 1363–1371. [Google Scholar] [CrossRef]
- Haara, A.; Matala, J.; Melin, M.; Miettinen, J.; Korhonen, K.; Packalen, T.; Varjo, J. Economic effects of grouse-friendly forest management. Silva. Fenn. 2021, 55, 10468. [Google Scholar] [CrossRef]
- Marzluff, J.M.; Millspaugh, J.J.; Ceder, K.R.; Oliver, C.D. Modeling Changes in Wildlife Habitat and Timber Revenues in Response to Forest Management. For. Sci. 2002, 48, 191–202. [Google Scholar] [CrossRef]
- Simons-Legaard, E.M.; Harrison, D.J.; Krohn, W.B.; Vashon, J.H. Canada Lynx Occurrence and Forest Management in the Acadian Forest: Canada Lynx Occurrence in Maine. J. Wildl. Manag. 2013, 77, 567–578. [Google Scholar] [CrossRef]
- Teixeira, D.; Carrilho, M.; Mexia, T.; Köbel, M.; Santos, M.J.; Santos-Reis, M.; Rosalino, L.M. Management of Eucalyptus Plantations Influences Small Mammal Density: Evidence from Southern Europe. For. Ecol. Manag. 2017, 385, 25–34. [Google Scholar] [CrossRef]
- Kline, K.N.; Taylor, J.D.; Morzillo, A.T. Estimating Stand-Level Economic Impacts of Black Bear Damage to Intensively Managed Forests. Can. J. For. Res. 2018, 48, 758–765. [Google Scholar] [CrossRef] [Green Version]
- Conover, M.R. Monetary and Intangible Valuation of Deer in the United States. Wildl. Soc. Bull. 1997, 25, 298–305. [Google Scholar]
- Maine Department of Inland Fisheries and Wildlife. Maine’s Game Plan for Deer. Available online: https://www.maine.gov/ifw/docs/WTD%20Plan_4Mar2011_FINAL.pdf (accessed on 30 June 2021).
- Moen, A.N. Energy Conservation by White-Tailed Deer in the Winter. Ecology 1976, 57, 192–198. [Google Scholar] [CrossRef]
- Tierson, W.C.; Mattfeld, G.F.; Sage, R.W.; Behrend, D.F. Seasonal Movements and Home Ranges of White-Tailed Deer in the Adirondacks. J. Wildl. Manag. 1985, 49, 760. [Google Scholar] [CrossRef]
- Morrison, S.F.; Forbes, G.J.; Young, S.J.; Lusk, S. Within-Yard Habitat Use by White-Tailed Deer at Varying Winter Severity. For. Ecol. Manag. 2003, 172, 173–182. [Google Scholar] [CrossRef]
- Lavigne, G.R. White-Tailed Deer Assessment and Strategic Plan. Report Prepared for Maine DIFW. Available online: https://www.maine.gov/ifw/docs/deer-speciesassessment.pdf (accessed on 30 June 2021).
- Maine Department of Inland Fisheries and Wildlife. Deer Habitat Management System and Database. Available online: https://www.maine.gov/ifw/docs/species_planning/mammals/whitetaileddeer/habitatmanagement.pdf (accessed on 30 June 2021).
- Maine Department of Inland Fisheries and Wildlife. Guidelines for Wildlife: Managing Deer Wintering Areas in Northern, Western and Eastern Maine. Available online: https://www.maine.gov/ifw/docs/DWA_Guidelines_2.4.10.pdf (accessed on 30 June 2021).
- Harrison, D.; Simons-Legaard, E.; Legaard, K.; Sader, S. Effectiveness of State Regulations to Protect Deer Wintering Habitats in Maine: Did the Designation of LURC-Zoned Deeryards Achieve Desired Objectives during the Period 1975–2007? Final Report to the Northeastern States Research Cooperative and USDA Forest Service. 2013; Available online: http://nsrcforest.org/sites/default/files/uploads/harrison08full.pdf (accessed on 30 June 2021).
- Boer, A. Management of Deer Wintering Areas in New Brunswick. Wildl. Soc. Bull. 1978, 6, 200–205. [Google Scholar]
- Weber, S.J.; Mautz, W.W.; Lanier, J.W.; Wiley, J.E. Predictive Equations for Deeryards in Northern New Hampshire. Wildl. Soc. Bull. 1983, 11, 331–338. [Google Scholar]
- Taylor, J.D.; Kline, K.N.; Morzillo, A.T. Estimating Economic Impact of Black Bear Damage to Western Conifers at a Landscape Scale. For. Ecol. Manag. 2019, 432, 599–606. [Google Scholar] [CrossRef] [Green Version]
- Seymour, R.S. Integrating Natural Disturbance Parameters into Conventional Silvicultural Systems: Experience from the Acadian Forest of Northeastern North America. In Balancing Ecosystem Values: Innovative Experiments for Sustainable Forestry: August 15–20, 2004; PNW-GTR-635; USDA Forest Service, Pacific Northwest Research Station: Portland, OR, USA, 2005; pp. 41–47. [Google Scholar]
- Arseneault, J.E.; Saunders, M.R.; Seymour, R.S.; Wagner, R.G. First Decadal Response to Treatment in a Disturbance-Based Silviculture Experiment in Maine. For. Ecol. Manag. 2011, 262, 404–412. [Google Scholar] [CrossRef]
- Seymour, R.; (University of Maine, Orono, ME, USA). Personal communication, 2016.
- Kenefic, L.S.; Nyland, R.D. Diameter-Limit Cutting and Silviculture in Northeastern Forests: A Primer for Landowners, Practitioners and Policymakers; NA-TP-02-05; USDA Forest Service, Northeastern Area State and Private Forestry: Newtown Square, PA, USA, 2005; 18p.
- FVS Staff. Northeast (NE) Variant Overview—Forest Vegetation Simulator; Internal Report; Department of Agriculture, Forest Service, Forest Management Service Center: Fort Collins, CO, USA, 2008; (revised 2021); Available online: http://www.fs.fed.us/fmsc/ftp/fvs/docs/overviews/FVSne_Overview.pdf (accessed on 30 June 2021).
- Euler, D.; Thurston, L. Characteristics of Hemlock Stands Related to Deer Use in East-Central Ontario. J. Appl. Ecol. 1980, 17, 1–6. [Google Scholar] [CrossRef]
- Lishawa, S.C.; Bergdahl, D.R.; Costa, S.D. Winter Conditions in Eastern Hemlock and Mixed-Hardwood Deer Wintering Areas of Vermont. Can. J. For. Res. 2007, 37, 697–703. [Google Scholar] [CrossRef]
- Crookston, N.L. User’s Guide to the Event Monitor: Part of Prognosis Model, Version 6; Gen. Tech. Rep. INT-GTR-275; Department of Agriculture, Forest Service, Intermountain Research Station: Ogden, UT, USA, 1990; 21p. [Google Scholar] [CrossRef] [Green Version]
- Laustsen, K.; (Maine Forest Service, Augusta, ME, USA). Personal communication, 2016.
- Maine Forest Service. Maine Stumpage Price Report for 2015. Available online: https://www.maine.gov/dacf/mfs/publications/annual_reports.html (accessed on 30 June 2021).
- Row, C.; Kaiser, H.F.; Sessions, J. Discount Rate for Long-Term Forest Service Investments. J. For. 1981, 79, 367–376. [Google Scholar] [CrossRef]
- Nyland, R.D. Diameter-Limit Cutting and Silviculture: A Comparison of Long-Term Yields and Values for Uneven-Aged Sugar Maple Stands. North. J. Appl. For. 2005, 22, 111–116. [Google Scholar] [CrossRef] [Green Version]
- Bothwell, K.N. Practicing Collaborative Natural Resource Management with Federal Agencies: Keys to Success across Partnership Structures. J. For. 2019, 117, 226–233. [Google Scholar] [CrossRef]
- United States Forest Service. Forest Inventory and Analysis Program. Northeastern Forest Inventory & Analysis Quality Assurance/Quality Control Results. 2004. Available online: http://www.fs.fed.us/ne/fia/methodology/p2/NEQAresults/yrs0304/qa_tree.html (accessed on 30 June 2021).
- Husch, B.; Beers, T.W.; Kershaw, J.A., Jr. Forest Mensuration, 4th ed.; John Wiley & Sons, Inc.: Hoboken, NJ, USA, 2003. [Google Scholar]
- Kim, I. Specific Measurements: Crown Closure for a Stand. In A Sampler of Inventory Topics, 1st ed.; Kim Iles & Associates Ltd.: Nanaimo, BC, Canada, 2003; pp. 139–140. [Google Scholar]
Figure 1.
Conceptual model depicting the workflow from qualitative and quantitative input data through the output of the per-hectare value of timberland used in the comparison and interpretation of the impacts of a wildlife policy. SPMCDBH * is the FVS keyword that specifies the diameter cutoff between product classes.

Figure 2.
Simple financial returns per hectare of modeled management scenarios of two companies (A,B). The scenarios included activities both outside deeryards (top row of graphs) and inside deeryards (bottom row of graphs) separately, due to differences in the starting conditions. Each bar represents the total value of the trees on one hectare for a given management option and is composed of harvest revenue (total returns from all entries within 50 years with the first entry at year 0; grey portion of bar) and standing value (stumpage value of standing timber at the end of the 50-year simulation; black portion of bar). The first bar in each panel represents the value of the starting inventory tree list before any harvests were modeled. “IGSR” represents the irregular group shelterwood with reserves system. Data in Appendix A.

Figure 3.
Differences in revenue per hectare between “business as usual” management scenarios and those applied within protected deeryards (PDs) of two companies (A,B) (for example, the first bar in each panel represents the value from harvested timber of a “business as usual” shelterwood minus the harvest value of a shelterwood modified for PDs, using inventory data from each company; each of the two panels corresponds to a company). The harvest revenue (gray bars) is the total returns from all entries within 50 years with the first entry at year 0; the standing value (black bars) is the stumpage value of standing timber at the end of the 50-year simulation. Positive bars indicate greater revenue outside PDs; negative bars indicate greater revenue inside PDs. “IGSR” represents the irregular group shelterwood with reserves system. Data in Appendix B.


Table 1.
Silvicultural scenarios and parameters for growth-and-yield modeling using the Forest Vegetation Simulator (FVS) inside and outside protected deeryards (PDs) in Maine. The scenarios were adapted to FVS functions and settings from actual silvicultural activities described by professional foresters in Maine. OSR indicates overstory removal timber harvest; DBH is the diameter at breast height.
| Silvicultural Scenario | Inside Protected Deeryard | Outside Protected Deeryard |
|---|---|---|
| Uniform shelterwood | 15-year entry interval: Establishment cut to 9 m2 ha−1 BA; overstory removal (OSR). Exclude T. occidentalis and T. canadensis from all harvests. | 7-year entry interval: Establishment cut to 6.5 m2 ha−1 BA; OSR. |
| Clearcut * | Single entry: Removal of 95% of all stems at least 11.43 cm DBH. | |
| Group selection (GS) | 15-year entry interval: 20% of the harvest block in “clearcut;” exclude T. occidentalis and T. canadensis from all harvests. | 10-year entry interval: 30% of the harvest block in “clearcut.” |
| Single-tree selection | 30-year entry interval: 20% removal 11.43–25.38 cm DBH using the “thin throughout a diameter range” function. Exclude T. occidentalis and T. canadensis from all harvests. | 30-year entry interval: 30% removal 11.43–25.38 cm DBH using the “thin throughout a diameter range” function. |
| Diameter-limit | Removal of all but 5 trees per hectare 30.5 cm DBH and greater with the 80% “cutting efficiency” setting. Exclude T. occidentalis and T. canadensis from all harvests. | Remove all but 5 trees per hectare 30.5 cm DBH and greater with the 90% “cutting efficiency” setting. |
| Irregular GS with reserves * | Small gap: 10-year entry interval: 10% of harvest block in “clearcut” with 5 residual trees per hectare of at least 51 cm DBH. Large gap: 10-year entry interval: 20% of harvest block in “clearcut” with 5 residual trees per hectare of at least 51 cm DBH. | |
* Identical scenarios were applied inside and outside PDs. Using this set of parameters, simulations were run and the results are reported separately for the inside- and outside-PD tree lists.
Table 2.
Summary of the stand metrics of the inventory tree lists used in modeling forest management scenarios inside and outside of protected deeryards (PDs) in Maine. Quadratic mean diameter (QMD), basal area (BA), and trees per hectare (TPH) were exported from internally calculated FVS stand summaries. The site index was from USDA Natural Resources Conservation Service Web Soil Survey.
| Metric | Company A Outside PD | Company A Inside PD | Company B Outside PD | Company B Inside PD |
|---|---|---|---|---|
| Average stand QMD (cm) | 14.0 | 13.0 | 21.5 | 13.9 |
| Average stand BA (m2 ha−1) | 23.6 | 25.7 | 24.4 | 33.7 |
| Average TPH | 1713 | 1913 | 699 | 2691 |
| Common species, percent volume | Picea mariana, 20 Acer rubrum, 18 Abies balsamea, 14 | Thuja occidentalis, 29 Abies balsamea, 22 Picea mariana, 13 | Tsuga canadensis, 27 Fraxinus americana, 18 Thuja occidentalis, 15 | Thuja occidentalis, 26 Tsuga canadensis, 23 Picea rubens, 13 |
| Number of stands sampled | 5 | 5 | 6 | 9 |
| Number of inventory plots | 12 | 13 | 18 | 22 |
| Site indices, m | A. balsamea, 17 Picea mariana, 15 Fagus grandifolia, 18 | A. balsamea, 17 Picea mariana, 15 Fagus grandifolia, 18 | Pinus strobus, 20 | Pinus strobus, 20 |
Publisher’s Note: MDPI stays neutral with regard to jurisdictional claims in published maps and institutional affiliations. |
© 2021 by the authors. Licensee MDPI, Basel, Switzerland. This article is an open access article distributed under the terms and conditions of the Creative Commons Attribution (CC BY) license (https://creativecommons.org/licenses/by/4.0/).
Share and Cite
MDPI and ACS Style
Bothwell, K.; Crandall, M.S.; Roth, A.M. Silviculture for Deer and Timber: A Multiple-Use Policy Analysis Reveals Important Implementation Barriers. Forests 2021, 12, 1436. https://0-doi-org.brum.beds.ac.uk/10.3390/f12111436
AMA Style
Bothwell K, Crandall MS, Roth AM. Silviculture for Deer and Timber: A Multiple-Use Policy Analysis Reveals Important Implementation Barriers. Forests. 2021; 12(11):1436. https://0-doi-org.brum.beds.ac.uk/10.3390/f12111436
Chicago/Turabian StyleBothwell, Karin, Mindy S. Crandall, and Amber M. Roth. 2021. "Silviculture for Deer and Timber: A Multiple-Use Policy Analysis Reveals Important Implementation Barriers" Forests 12, no. 11: 1436. https://0-doi-org.brum.beds.ac.uk/10.3390/f12111436
Note that from the first issue of 2016, this journal uses article numbers instead of page numbers. See further details here.