
Mountain Pine Beetle Impacts on Health through Lost Forest Air Pollutant Sinks


Department of Economics, University of New Mexico, Albuquerque, NM 87131, USA
Forests 2021, 12(12), 1785; https://0-doi-org.brum.beds.ac.uk/10.3390/f12121785
Submission received: 28 October 2021
/
Revised: 8 December 2021
/
Accepted: 14 December 2021
/
Published: 16 December 2021
(This article belongs to the Special Issue Forest and Other Natural Landscapes and Human Health)
Abstract
:The mountain pine beetle (MPB) destroys millions of coniferous trees annually throughout Western US forests. Coniferous forests are important air pollutant sinks, removing pollutants from the air such as PM2.5 (particulate matter < 2.5 μm in diameter), O3 (ozone), SO2 (sulfur dioxide), NO2 (nitrogen dioxide), and CO (carbon monoxide). In this paper, US Forest Service data on MPB tree mortality in the Western US is combined with a forest air pollution model (i-Tree Eco) and standard health impact functions to assess the human mortality and morbidity impacts of MPB-induced tree mortality. Modeling results suggest considerable spatial and temporal heterogeneity of impacts across the Western US. On average, MPB is associated with 10.0–15.7 additional deaths, 6.5–40.4 additional emergency room (ER) visits, and 2.2–10.5 additional hospital admissions per year over 2005–2011 due to lost PM2.5 sinks. For every 100 trees killed by MPB, the average PM2.5 mortality health costs are $418 (2019$). Impacts on other criteria pollutants are also estimated. Several sensitivity checks are performed on model inputs. These results have important policy implications for MPB management and on our understanding of the complex couplings between forest pests, forest health, and human health.
1. Introduction
The mountain pine beetle (MPB), Dendroctonus ponderosae Hopkins, is a destructive insect pest in conifer forests throughout the Western United States (US) and British Columbia, Canada [1]. Though native to the region, MPB outbreaks have been exacerbated since the 1990s by warmer winters brought on by climate change and large, contiguous, overstocked stands of large-diameter trees throughout the region [2,3]. The US Forest Service estimates that MPB has affected >55 million acres of forest, or approximately 20% of all Western conifer forests by area since 1990, primarily impacting lodgepole pine (Pinus contorta Douglas ex Loudon) and ponderosa pine (Pinus ponderosa Douglas ex P. Lawson and C. Lawson) trees, making it one of the largest drivers of landscape-scale tree mortality in the US [4] (and see Appendix A for additional information on MPB growth dynamics).
Dead, rusty-colored conifer trees caused by MPB reduce the ecosystem services provided by forests, with economic impacts on recreation [5], property values [6], landscape aesthetics [7], and subjective well-being [8], in addition to direct market impacts on the forestry and logging industry [9]. For instance, Rosenberger et al. [5] found that moderate to severe MPB outbreaks can cause recreation losses totaling $5–$59 million in Rocky Mountain National Park in Colorado, USA.
However, there is increasing interest that in order to understand the overall impacts of forest-attacking pests, investigations of indirect, as opposed to direct, effects of forest loss on society must be conducted that recognize the coupled human and natural systems framework that connects human welfare to forest disturbance events (see discussions in [10,11,12,13] for the specific case of bark beetles).
One prominent indirect effect of MPB that has not received much attention is the impact of landscape-scale tree mortality on regional air quality and human health outcomes. Trees and forests are important air pollutant sinks. Gaseous air pollutants are removed by trees through leaf stomata uptake and plant surfaces, while particulate pollutants are intercepted on the surfaces of leaves, branches, and bark [14]. Air pollutants removed by trees include PM2.5 (particulate matter < 2.5 μm in diameter), O3 (ozone), SO2 (sulfur dioxide), NO2 (nitrogen dioxide), and CO (carbon monoxide), each of which are associated with human respiratory and cardiovascular outcomes [15,16,17]. Trees also remove carbon from the atmosphere and store it as biomass, though this does not directly impact human health. Additionally, PM10 is removed by trees, but the focus is often on PM2.5 instead. Thus, it would be anticipated that extensive losses of coniferous forests due to MPB would have demonstrable effects on regional air quality with associated human mortality and morbidity outcomes. However, the magnitude and spatial-temporal extent of such impacts are presently unknown.
In non-MPB contexts, estimates of the magnitude of tree impacts to air pollution and health have been made in the literature. Using i-Tree Eco, the same modeling software used in the present study, Nowak et al. [18] estimated that urban trees in the US remove between 4.7 to 64.5 tons of PM2.5 per year, depending on the US city, at a value of $1.1–$60.1 million per year in avoided mortality and morbidity outcomes. In more recent work, Nowak et al. [19] calculated that trees and forests in the conterminous US removed a total of 17.4 million tons of air pollution (PM2.5, O3, SO2, and NO2) in 2010 with modeled mortality and morbidity benefits of $6.8 billion, on the basis of 850 avoided deaths and 670,000 avoided incidences of acute respiratory symptoms.
Of particular concern when considering the air pollution and health impacts of MPB-induced tree mortality is the fact that coniferous trees, which MPB exclusively attack, are more effective at intercepting PM2.5 compared to broad-leafed deciduous trees by about 25% on average, due to differences in leaf morphology [20]. Additionally, MPB are primarily attracted to large diameter, mature trees, which tend to remove significantly more pollutants from the air than smaller, young trees, since pollutant removal depends on tree size and maturity [18]. This underscores the potential significant impacts that MPB may be having on regional air quality and human health across the Western US and beyond.
To the best of my knowledge, there are no prior studies explicitly investigating MPB impacts to air pollution and health. However, there are related studies that have looked at human health and, in some cases, air pollution consequences of anthropogenic deforestation [21,22] and invasive species-caused tree mortality [23,24,25,26]. By all accounts, this literature suggests worsening air pollution and worsening health outcomes after significant tree loss occurs. For instance, Jones and McDermott [23] showed that lost ash trees due to the invasive emerald ash borer resulted in increased air pollution concentrations ranging from 9.2 to 46.2% across the US, increasing rates of cardiovascular mortality by 6.2–32.5/yr. per 100,000 people.
There is also a related literature on the economic impacts of MPB, including reduced recreational opportunities [5], lower life satisfaction and happiness [8], and reduced residential property values [6]. Market impacts of MPB have also been estimated [9]. Others have also investigated the economic feasibility of using timber from MPB kills as a source of bioenergy [27], and bioeconomic models have been constructed for land management strategies during MPB outbreaks [28].
In this paper, I extend the literature on MPB impacts in three ways. First, by quantifying the air pollution and health consequences of MPB, I provide the literature and policymakers with a better understanding of the total economic scale of MPB impacts on society (a “scale contribution”). This is an important advancement over past economic cost studies of MPB, which have tended to focus on first-order direct impacts [5,6,9], whereas this work provides estimates of indirect costs on society. Second, since air pollutants disperse across geographic landscapes and over space, this work expands the scope of MPB welfare impacts to include those populations within the larger airshed, but who may not be directly affected by MPB impacts to recreation, aesthetics, or property values. By expanding the potential pool of affected individuals vis-à-vis the larger airshed, I provide for a more holistic assessment of the true burden of MPB on society (a “scope contribution”). Finally, this work provides new information on the expanded set of potential benefits of MPB management, thereby eliminating one potential source of downward bias in benefit-cost analyses of MPB prevention and control programs. This is important since a key MPB prevention mechanism is stand density reduction and crown thinning [29], which has co-benefits on wildfire risk and future wildfire severity [30]. Thus, more accurate benefit-cost analyses of MPB management, inclusive of human health considerations, could serve as admissible evidence for policies designed to restore overall forest health.
2. Materials and Methods
To estimate the air pollution impacts of MPB tree kill in the Western US, high-resolution MPB disturbance data will be combined with the US Forest Service’s i-Tree Eco software tool. Then, using the estimated MPB-induced air pollution impacts provided by i-Tree Eco, I will calculate impacts to various human health outcomes using standard US Environmental Protection Agency (EPA) health impact functions. Lastly, the estimated health impacts will be economically valued using economic cost estimates from the US EPA and the extant economics literature. Each component is described below.
2.1. MPB Disturbance Data
Data on annual tree mortality caused by MPB in the Western US (defined here as the states of Arizona, California, Colorado, Idaho, Montana, New Mexico, Nevada, Oregon, Utah, Washington, and Wyoming) was obtained from the US Forest Service Insect and Disease Survey (IDS) database for the 2005–2011 period. The Western US is focused on since this is the primary historical habitat range of MPB [4]. The IDS data obtained are specific to MPB tree mortality and were assembled by the Forest Service using the Digital Aerial Sketch Mapping (DASM) system. Additional information on the DASM data are provided in Appendix B.
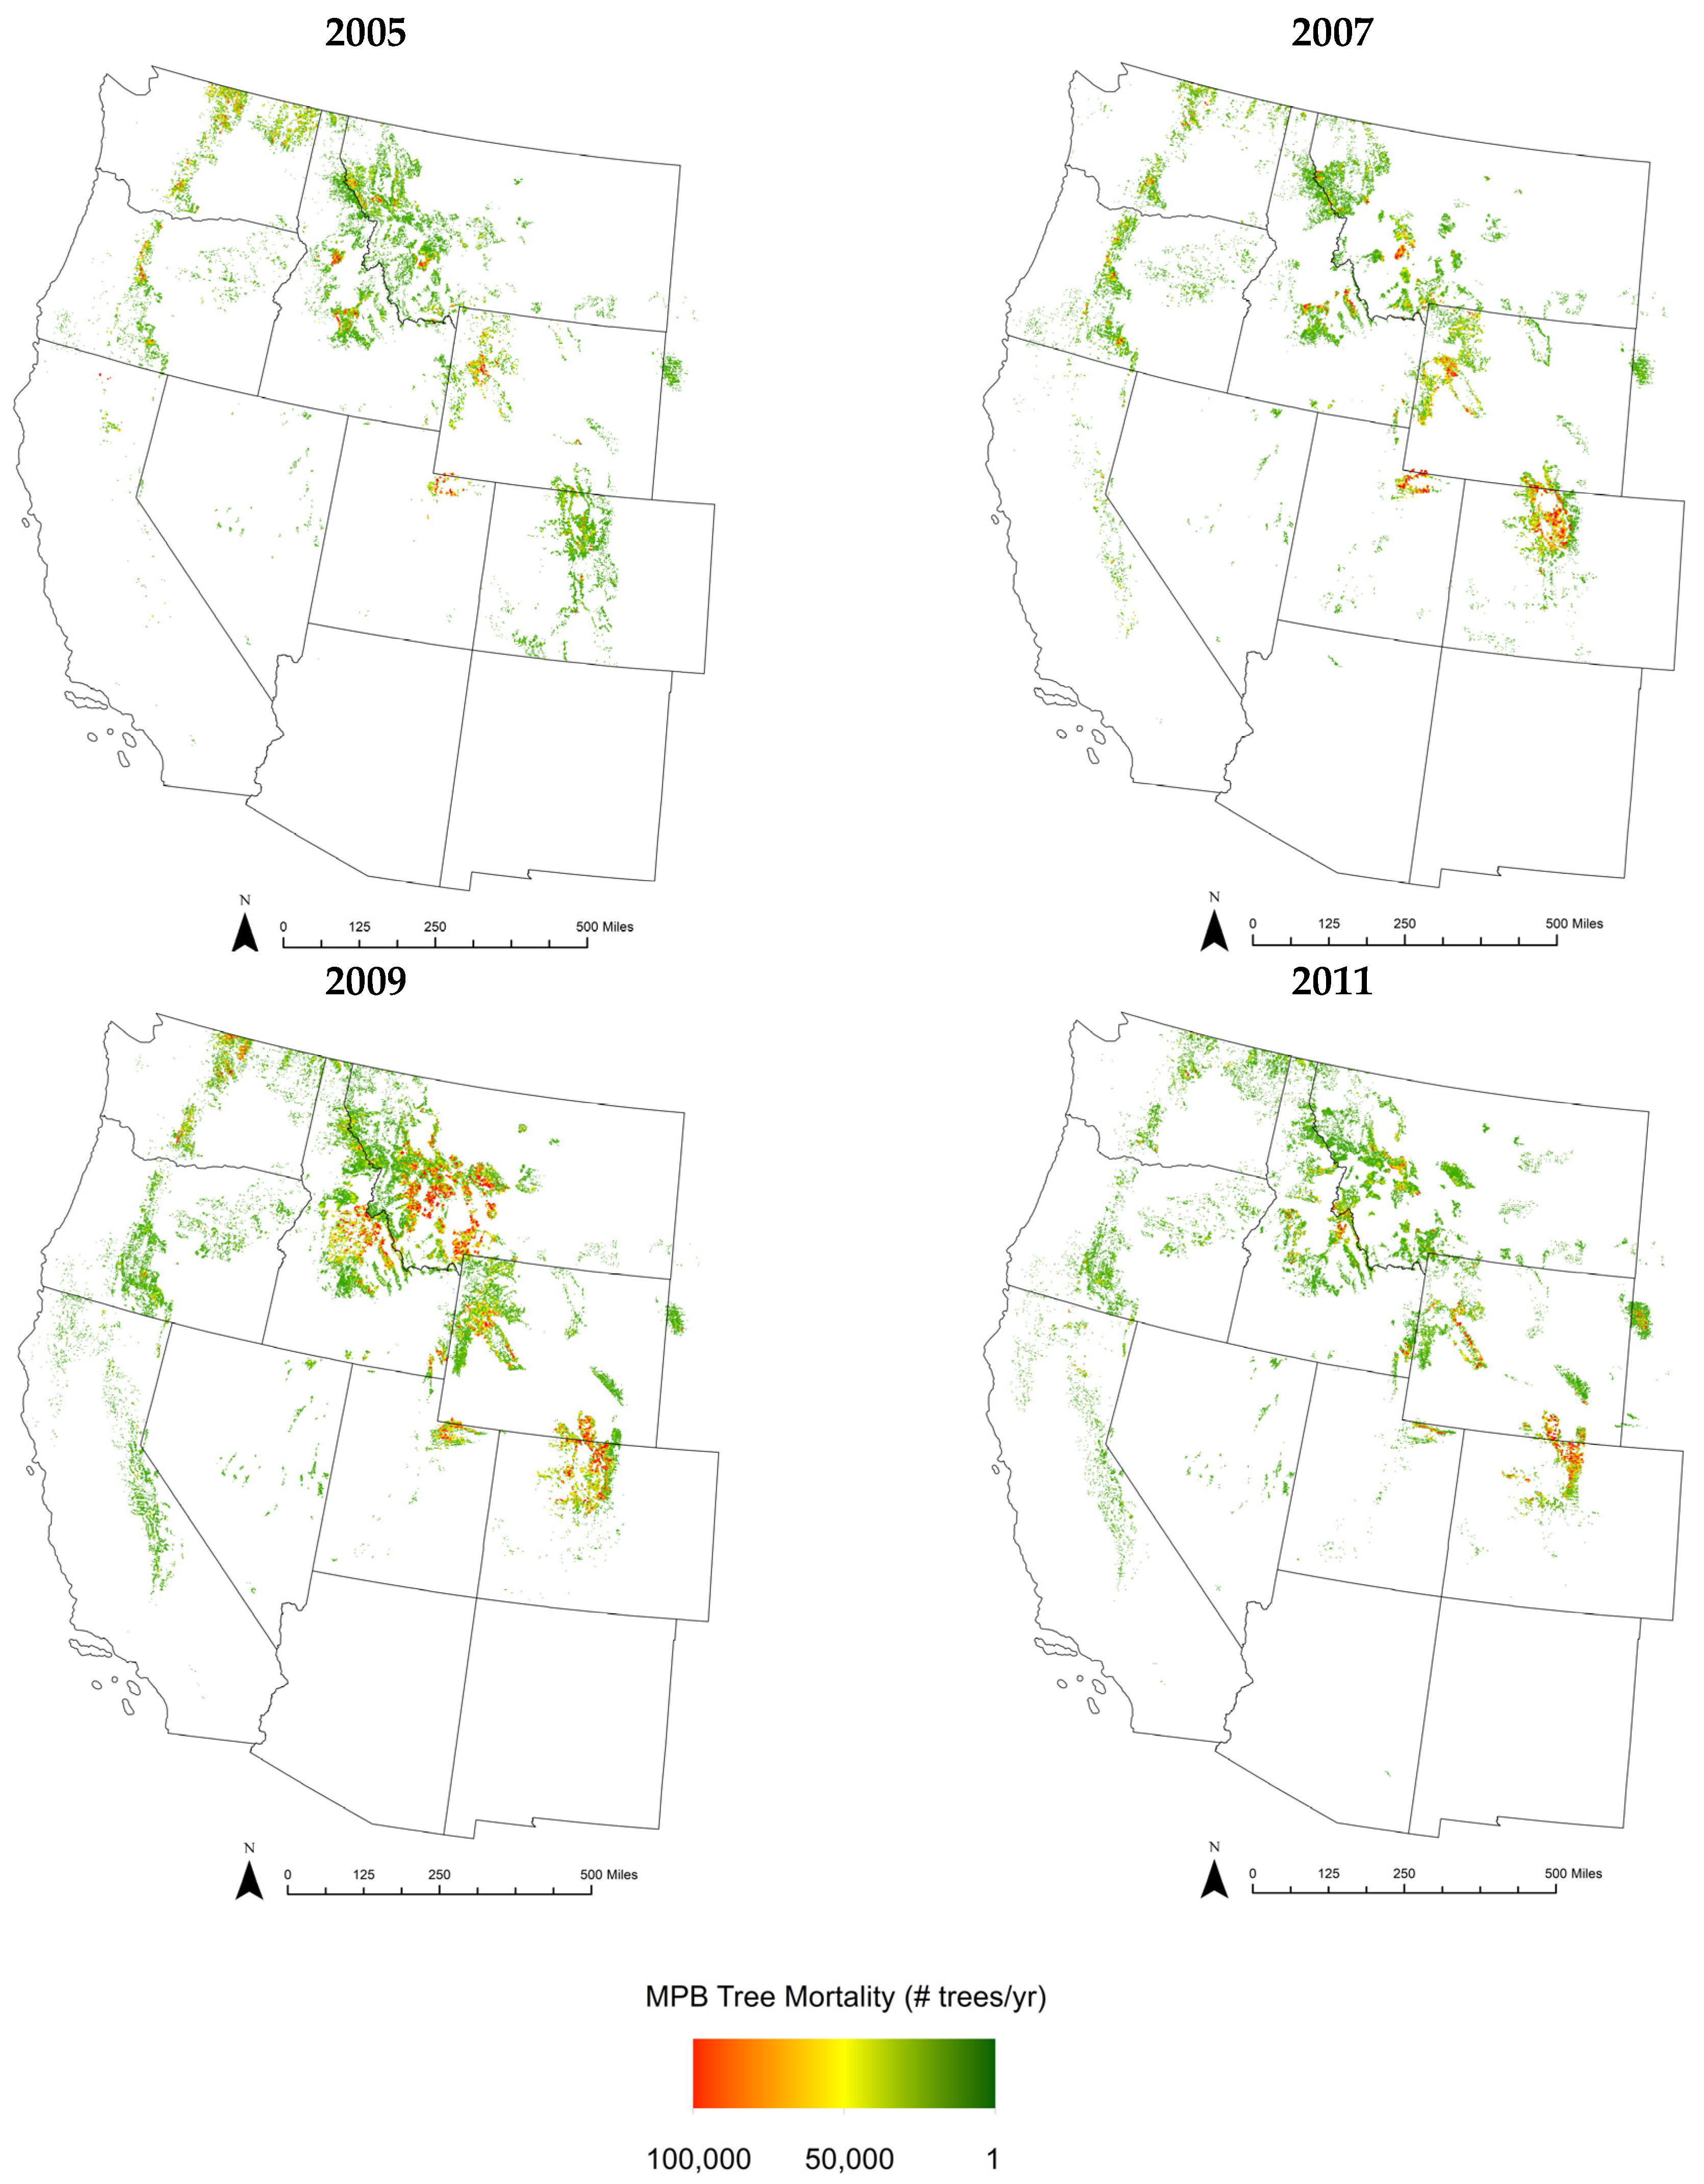
Annual DASM data contain between 42,000 and 88,000 individual polygons, indicating extensive coverage across Western US conifer forests (see Figure 1). In what follows, I use information on the number of trees killed by MPB for all tree host species. To avoid over-counting tree mortality in cases where the same area or where a portion of the same area was surveyed more than once in a year, I remove all overlapping sections of polygons, keeping only the disjoint areas. Using GIS software, the total number of trees killed by MPB in each Western US county was calculated as the sum of the individual disjointed polygon attributes intersecting each county. This was carried out annually and separately by tree species. If a polygon intersected more than one county, the county with the greatest geographic extent of intersection was assigned to that polygon.
2.2. Using i-Tree Eco to Model Tree Pollution Removal
To estimate lost air pollution removal due to MPB tree mortality, the i-Tree Eco software tool was utilized. i-Tree Eco is a peer-reviewed modeling program developed in partnership with the US Forest Service that uses sample or inventory tree data to assess forest structure, forest health, and forest ecosystem services (including air pollution removal) for any tree population [31]. The original basis for the i-Tree program is the US Forest Service’s Urban Forest Effects (UFORE) model, developed in the 1990s to investigate the benefits of urban forests. Applications of i-Tree Eco for estimating tree pollutant removals include [32,33,34].
The software uses a gas exchange and particulate matter interception model at the individual-tree leaf level combined with hourly monitoring-station weather data from the National Oceanic and Atmospheric Administration (NOAA) National Centers for Environmental Information and hourly pollution concentration monitoring station data from the US EPA AirData network to estimate hourly tree pollution removal of PM2.5, O3, SO2, NO2, and CO.
Pollution removal or pollution flux for pollutant , , is calculated as the product of the deposition velocity, , and the pollutant’s hourly concentration in the atmosphere (as measured by a monitoring station), ,
The deposition velocity is calculated as the inverted sum of the aerodynamic (), quasi-laminar boundary layer (), and canopy () resistances [13], and represents the velocity at which pollutants deposit to the leaf surface,
Values for , , and are calculated using hourly weather data (temperature, windspeed, humidity, precipitation, solar radiation) and big-leaf and multilayer canopy deposition models. Importantly, the values used for PM account for hourly resuspension of particulates off of the tree surface and back into the atmosphere due to wind, thus reducing potential upward bias in PM removal rates.
To obtain average hourly net pollution removal across an entire study area (e.g., city, county), , i-Tree multiples the hourly pollutant flux () at the leaf level by total tree canopy coverage. Canopy coverage is determined using daily leaf area indices based on the percent of the area that is comprised of evergreen tree species and information on seasonal leaf on/leaf off dates in fall and spring. Field data are also used to increase the accuracy of these estimates (see discussion in [33]).
The calculated above is in units of mass and not volumetric concentration. To calculate the hourly change in pollutant concentration, , the following equation is used,
where is the hourly change in pollutant mass for the pollutant, is the hourly atmospheric boundary layer height, and is the geographic surface area of the study area. Boundary layer heights vary throughout the day and i-Tree uses radiosonde station data from NOAA’s Earth System Research Laboratory to determine these [31].
and are the main outcome variables of interest obtained from i-Tree Eco. They provide modeled estimates of the aggregate change in pollutant mass and pollutant concentration (in units ppb (parts per billion), ppm (parts per million), or , depending on the pollutant), respectively, per pollutant type, across all inventoried trees in a given study area. i-Tree Eco reports monthly and annual averages of for each pollutant as part of its modeling results output. The software also produces estimates of the percentage improvement to air quality, using the following formula,
where is the hourly monitoring station measured pollutant concentration in the atmosphere. Using Equations (3) and (4), hourly estimates of can be calculated and then averaged over some desired time period.
Annual estimates of and for the specific case of MPB were obtained for each Western US county using the processed DASM data. The analysis was performed for each tree species identified in the DASM using tree diameter sizes from the Gymnosperm Database [35] and default species-specific i-Tree values for other tree characteristics. In the sensitivity checks later in the paper (Appendix D), other diameter sizes are used to allow for the possibility of small diameter tree kill.
Results from i-Tree are technically estimates of the counterfactual (what pollution removal would have been if the trees killed by MPB had still been alive). In actuality, these trees are no longer alive and thus the estimates obtained from i-Tree are used in what follows as representing the lost pollution removal due to MPB in a given county-year, i.e., the pollution removal that would have occurred in a county-year if MPB tree mortality had not happened and thus had not removed these pollutant sinks. While virtually no gaseous pollutants (O3, SO2, NO2, CO) are removed by dead trees, some fraction of PM might continue to be deposited onto tree limbs, branches, and conifer needles. I ignore continued PM deposition here since the dead trees will be eventually removed as part of salvage harvesting operations, or for other purposes (e.g., aesthetics, hazard, etc.), or due to needle loss, or eventual tree collapse. Thus, in the long-run, PM removal by dead trees is non-existent. Given this, my estimates of lost PM2.5 removal and associated health impacts should be considered as being representative of long-run effects. This is further explored in the sensitivity checks later in the paper.
2.3. Health Impact Functions and Economic Valuation
Health impact functions are used to estimate the human mortality and morbidity impacts associated with modeled changes in pollution concentrations due to MPB tree mortality.
The standard log-linear health impact function can be written following [36],
where is the change in health outcome associated with pollutant , is the population of the study area of interest, is the baseline incidence rate of health outcome , is the epidemiological relationship between changes in the concentration of pollutant , and health outcome , and is the change in pollutant concentration estimated from i-Tree Eco in Equation (3).
MPB health impacts are estimated at the county-year level using Equation (5) for: (i) all-cause mortality, (ii) emergency room (ER) visits for asthma, and (iii) hospital admissions (HA) for all-respiratory outcomes. Epidemiological estimates for each term were obtained from various sources (see footnote below Table 1).
Annual age-adjusted baseline incidence rates for all-cause mortality were obtained from the National Center for Health Statistics (NCHS) through the CDC WONDER website. Baseline incidence rates for ER asthma visits and HA all-respiratory outcomes were obtained from the Healthcare Cost and Utilization Project (HCUP) as made available by the Agency for Healthcare Research and Quality (AHRQ). Bridged-race population estimates were obtained from NCHS, again through the CDC WONDER website.
To economically value changes in mortality and morbidity, I apply a standard value of a statistical life (VSL) of $9.42 million (in inflation adjusted 2019 US dollars; 2019$) from [37] to all estimated mortality outcomes. A value of $481.44 (2019$) from [38] is applied to each ER asthma visit, and a value of $39,259 (2019$) from [36] is applied to each HA all-respiratory instance. The VSL and HA cost values used are the same as those employed by the US EPA in their regulatory impact analyses.
2.4. Summary Statistics and Parameter Values
Summary statistics and parameter values for key model inputs are presented in Table 1. Across the Western US, county-level MPB tree mortality averages 118,316 trees per year. For context, there are an estimated 228 billion trees in the US [39], implying that MPB kill is approximately 0.10% of total US live tree stocks per year, aggregated across all Western US counties.

Table 1.
Summary statistics and parameter values of model inputs (annual county-level averages).
| Mean | Std. Dev. | Sample Size | |
|---|---|---|---|
| Lodgepole pine (Pinus contorta) mortality | 69,167.3 | 315,355.6 | 2016 |
| Ponderosa pine (Pinus ponderosa) mortality | 27,532.0 | 125,527.3 | 2016 |
| Great Basin bristlecone pine (Pinus longaeva) mortality | 35.49 | 161.8 | 2016 |
| Rocky Mountain bristlecone pine (Pinus aristata) mortality | 535.4 | 2427.5 | 2016 |
| Monterey pine (Pinus radiata) mortality | 0.292 | 1.33 | 2016 |
| Limber pine (Pinus flexilis) mortality | 4697.1 | 21,415.7 | 2016 |
| SouthWestern white pine (Pinus strobiformis) mortality | 4.09 | 18.65 | 2016 |
| Sugar pine (Pinus lambertiana) mortality | 1774.7 | 8091.6 | 2016 |
| Western white pine (Pinus monticola) mortality | 1549.9 | 7066.6 | 2016 |
| Whitebark pine (Pinus albicaulis) mortality | 13,014.7 | 59,338.2 | 2016 |
| Tree mortality, all species | 118,315.6 | 539,438.3 | 2016 |
| Population | 148,307.4 | 652,786.5 | 2016 |
| Baseline mortality rate (per 100,000) | 757.6 | 135.3 | 1949 |
| Baseline ER asthma rate (per 100,000) | 459.4 | 169.4 | 2016 |
| Baseline HA all-respiratory rate (per 100,000) | 2409.3 | 876.4 | 2016 |
| Monitored PM2.5 () | 5.11 | 1.51 | 2016 |
| Monitored O3 (ppm) | 0.071 | 0.009 | 2016 |
| Monitored SO2 (ppb) | 41.07 | 32.98 | 2016 |
| Monitored NO2 (ppb) | 37.68 | 11.74 | 2016 |
| Monitored CO (ppm) | 2.10 | 0.464 | 2016 |
| (mortality, PM2.5) = 0.0005826891 | |||
| (mortality, O3) = 0.000507844 | |||
| (mortality, SO2) = 0.000399202 | |||
| (mortality, NO2) = 0.0074100012 | |||
| (mortality, CO) = 0.0328431136 | |||
| (ER asthma, PM2.5) = 0.005602959 | |||
| (ER asthma, O3) = 0.00397574 | |||
| (ER asthma, SO2) = 0.000049975 | |||
| (ER asthma, NO2) = 0.0019802627 | |||
| (ER asthma, CO) = 0.0099503309 | |||
| (HA all-respiratory, PM2.5) = 0.00207 | |||
| (HA all-respiratory, O3) = 0.007147005 | |||
| (HA all-respiratory, SO2) = 0.0202669672 | |||
| (HA all-respiratory, NO2) = 0.0028013898 | |||
| (HA all-respiratory, CO) = 0.088156972 | |||
| Num. states = 11 | |||
| Num. counties = 2016 |
Notes: annual county-level averages shown for Western US counties over 2005–2011. Tree mortality is average number of dead trees. ER, emergency room; HA, hospital admissions; ppb, parts per billion; ppm, parts per million. Sources: US Forest Service DASM, NCHS, HCUP, US EPA, [15,40,41,42,43,44,45,46,47,48,49,50,51].
3. Results
3.1. Lost Air Pollution Removal
The first set of model results shown are the annual lost pollution removal impacts of MPB, aggregated across the entire Western US (Table 2). Impacts are presented separately by pollutant type and year. For PM2.5, MPB tree mortality reduces conifer forest pollution removal by 14,361 to 52,507 tons per year, with an average loss of 29,974 tons/yr. between 2005 and 2011. The largest impacts are observed for O3, with lost pollution removal ranging 43,457 to 175,803 tons/yr., or, 103,510 tons/yr. on average. Annual average impacts on other pollutants are, in order from highest to lowest: 60,063 tons/yr. (NO2), 32,975 tons/yr. (SO2), and 10,979 tons/yr. (CO). On a per lost tree basis, an average of 0.0009 tons of PM2.5 and SO2 removal, 0.003 tons of O3 removal, 0.002 tons of NO2 removal, and 0.0003 tons of CO removal are lost for each individual tree killed by MPB per year.
3.2. Mortality and Morbidity Impacts and Costs
Table 3 presents modeled annual health impacts of lost pollution removal due to MPB tree mortality using Equation (5). Results are presented separately by year, pollutant type, and health outcome, and have been totaled across all counties. The largest mortality impacts are observed for PM2.5, where between 10 and 15.7 deaths per year are estimated, at a cost ranging from $93.9 million to $147 million per year. Note that all costs presented are in inflation adjusted 2019 US dollars (2019$). Morbidity impacts of modeled changes in PM2.5 are 6.5–40.4 additional ER asthma visits per year and 2.15–10.5 additional HA all-respiratory outcomes per year, with associated cost ranges of $3000–$19,000/yr. (ER asthma) and $84,000–$410,000/yr. (HA all-respiratory). Average annual MPB attributable deaths due to lost removal of O3, SO2, NO2, and CO are 3.17/yr., 5.60/yr., 5.88/yr., and 0.12/yr., respectively, with annual economic impacts ranging $1.09–$55.4 million per year. ER asthma and HA all-respiratory impacts for O3, SO2, NO2, and CO generally average one to two additional cases per year per pollutant, with notably higher exceptions for SO2 (HA all-respiratory) and NO2 (ER asthma), and notably lower exceptions for CO (ER asthma and HA all-respiratory). Morbidity economic costs range from $20/yr. to $8000/yr. (ER asthma) and $8000/yr. to $409,000/yr. (HA all-respiratory).
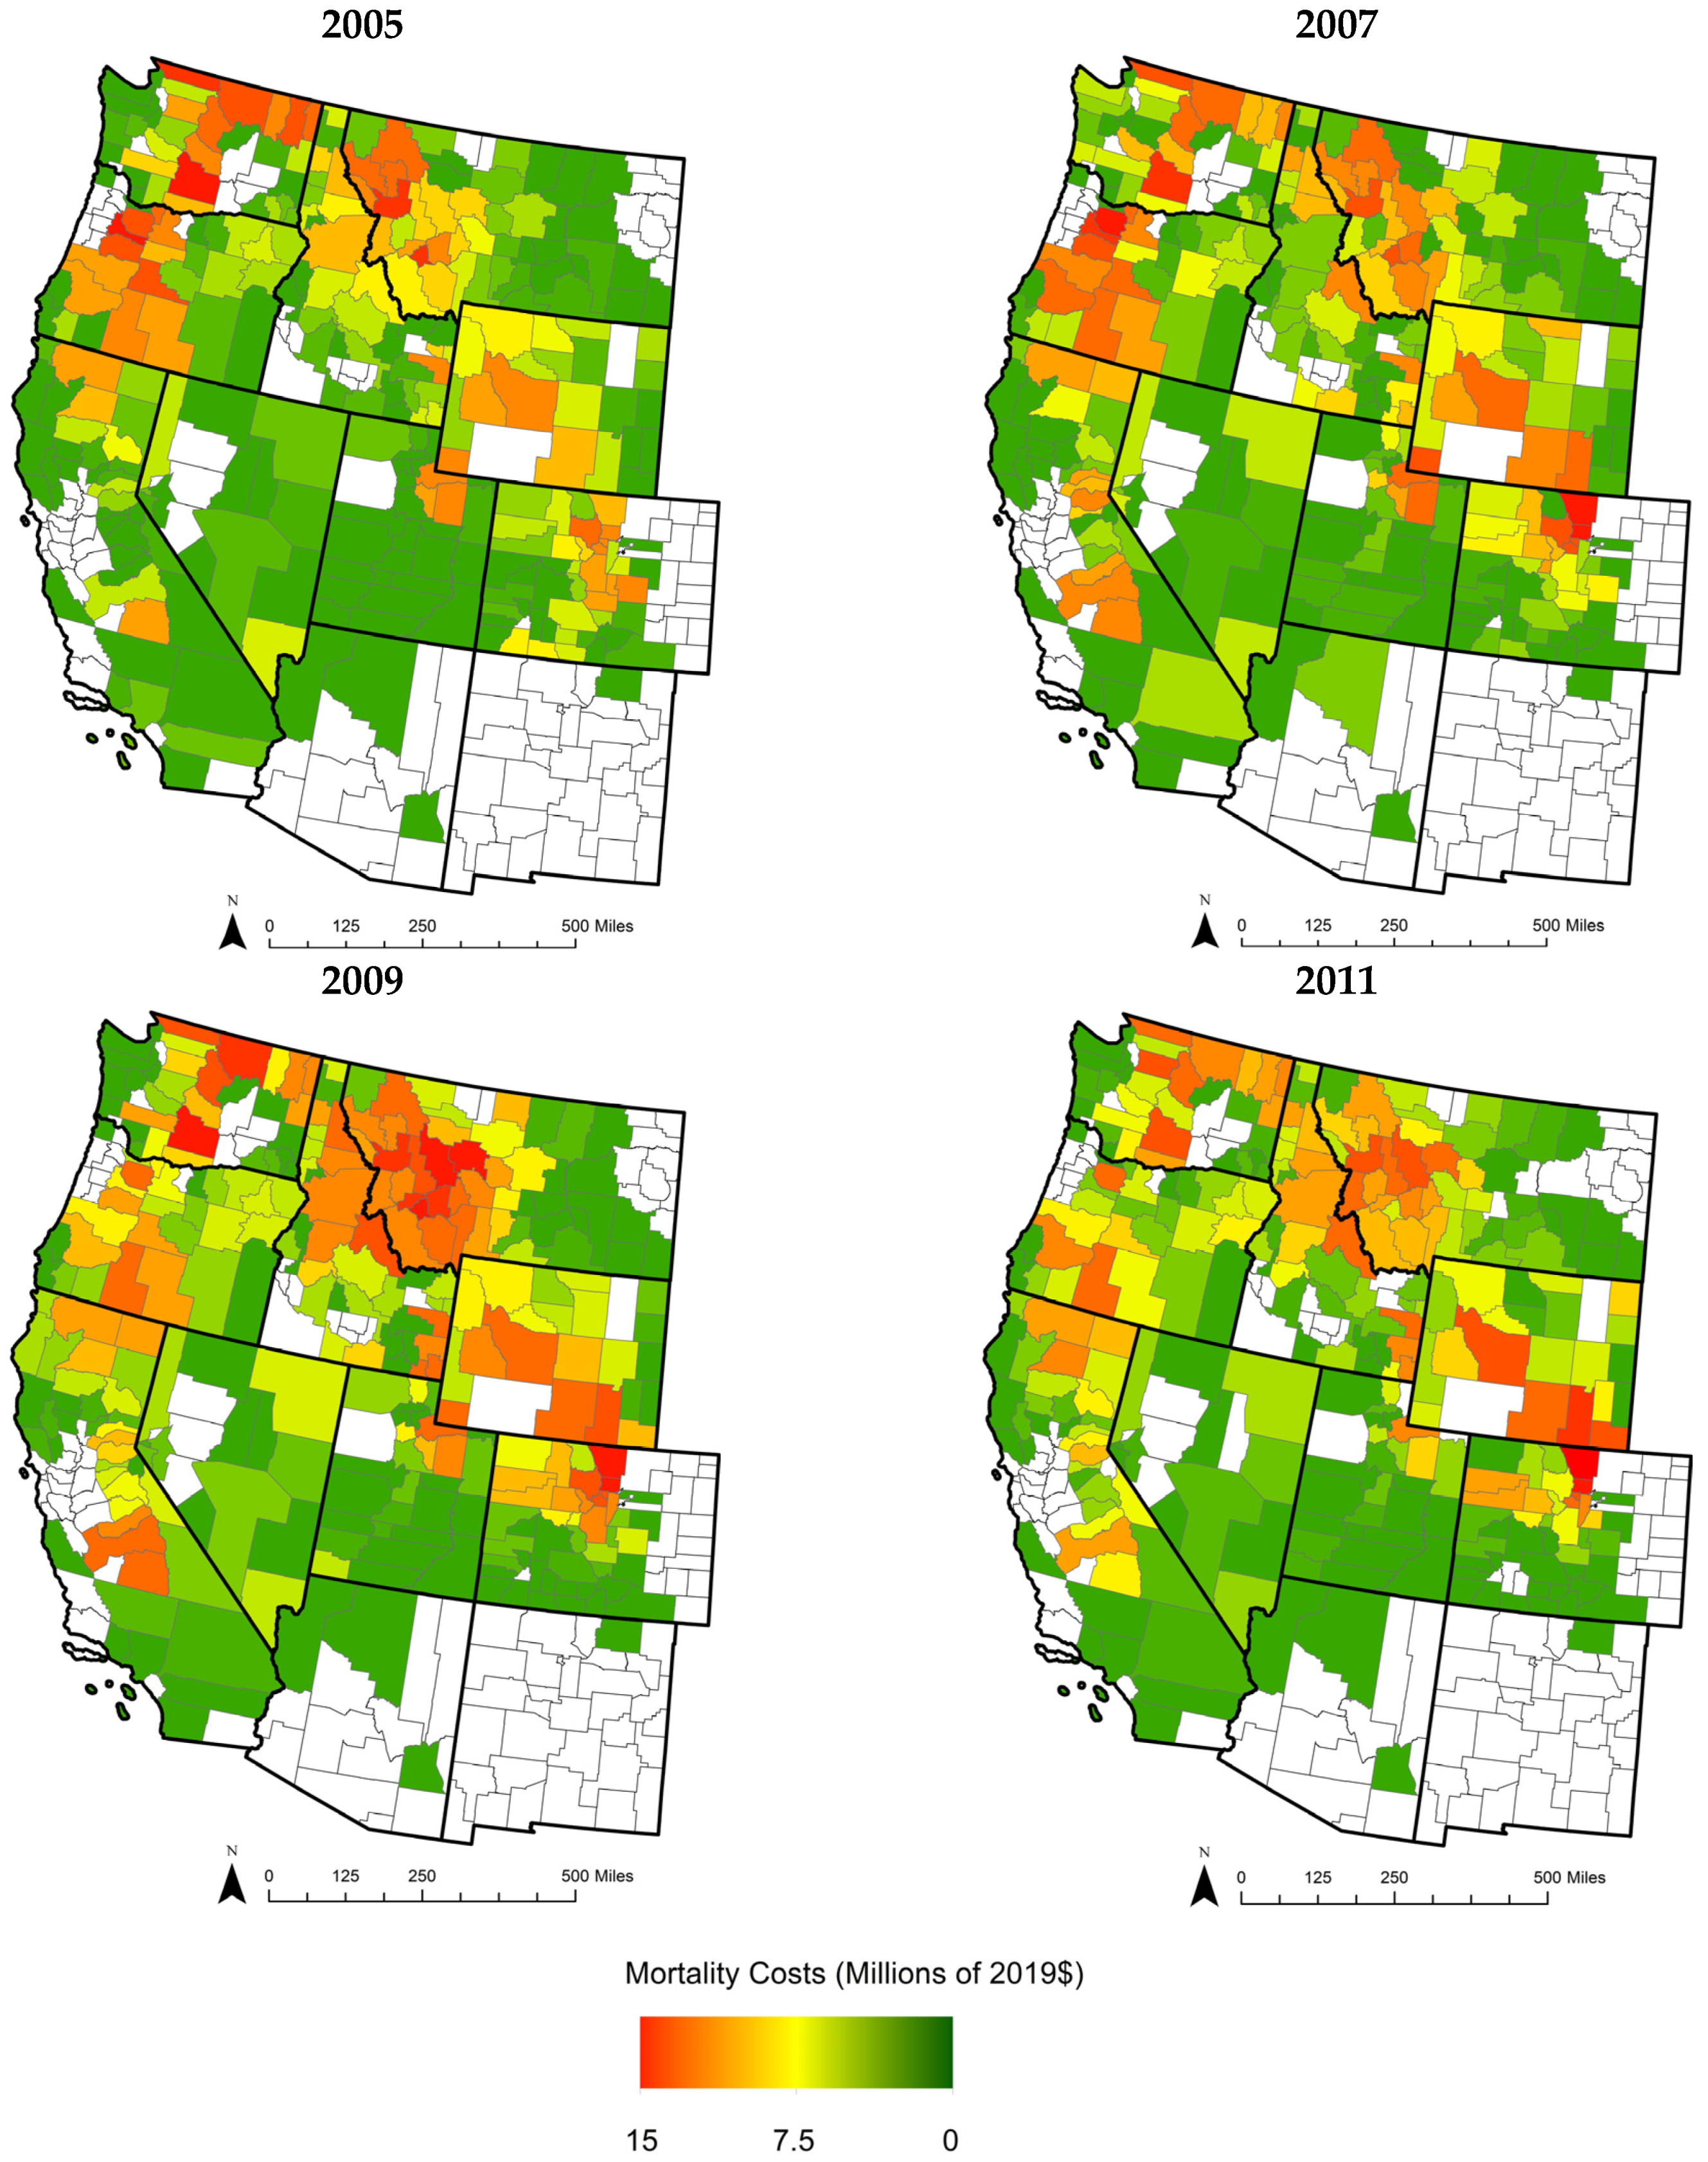
In Figure 2, I show the geographic and temporal heterogeneity of MPB health impacts across the Western US. The county-level PM2.5 mortality health costs in millions of 2019$ for the years of 2005, 2007, 2009, and 2011 are plotted. PM2.5 was selected as the representative pollutant here since it is associated with the highest health costs among all the pollutants investigated. There is a clear clustering of mortality impacts in three distinct areas: (i) along the Front Range of northern Colorado; (ii) in Western Montana; and (iii) along the Cascade Mountain range in central Washington and northcentral Oregon. Impacts in these areas are primarily driven by large MPB tree kill, as can be seen through a comparison of Figure 1 and Figure 2. Mortality health costs along the front range of northern Colorado are also likely due to high human population clustering around the Denver metro area, which significantly increases the costs of lost tree pollution removal since small pollution effects in or around high population centers have disproportionately large impacts on human health [19]. Mortality impacts are generally small throughout most of Utah, Nevada, northern Arizona, southern California, southern Colorado, and eastern Montana. This may be in part due to limited conifer stands in these areas or due to low endemic populations of MPB.
Note the significant temporal heterogeneity in mortality costs across the four time periods in Figure 2. As one example of this, consider Marion County, Oregon, located south of Portland and containing the town of Salem (the state capital), which has estimated mortality health costs of $55 million in 2005. By 2011, Marion County experiences only $11 million in mortality costs; an 80% decrease over 6 years. Another example is Albany County, Wyoming, where the University of Wyoming is located, which has $19 million in mortality costs in 2005 and $50 million in 2011 (an increase of 163%). While just two examples of temporal heterogeneity (and others can be found in Figure 2), they illustrate the changing dynamics of MPB impacts over the short-run, which are driven from year-to-year by tree host abundance (i.e., availability of live trees that MPB can attack), and also by weather conditions (especially temperature and precipitation, which affect tree resistance and MPB populations), annual wildfire patterns, and baseline pollution concentrations. Given this, one key takeaway from Figure 2 is that it demonstrates just how rapidly MPB health impacts, from PM2.5-induced mortality in this case, can scale up or down over the span of only a few years. One policy implication of these results is the need for active informational campaigns targeted at communities in areas with significant MPB activity in a given year, that specifically provide pollution avoidance information so as to reduce potential mortality and morbidity health impacts. To increase their effectiveness, such public health campaigns might closely track with annual MPB activity so that the timing of greatest avoidance can coincide with the timing of greatest MPB kill.
Table A1 in Appendix C presents the mortality and morbidity cost results per 100 trees killed by MPB per year by pollutant type. These results suggest that every 100 trees lost to MPB generates between $236 and $689 (average = $418) in PM2.5 mortality health costs. Similarly, average mortality costs per 100 trees killed by MPB for O3, SO2, NO2, and CO are $85.6, $184, $208, and $3.52, respectively. Note that a sensitivity analysis on key parameter inputs and modeling assumptions is provided in Appendix D.
4. Discussion
This paper estimated the air pollution and human health impacts of mountain pine beetle (MPB) tree mortality across its historical range in the Western US over the 2005–2011 period. The main result is that MPB conifer tree kill is associated with annual average mortality impacts of 12.2 deaths/yr. (from lost PM2.5 removal), 3.2 deaths/yr. (from lost O3 removal), 5.6 deaths/yr. (from lost SO2 removal), 5.9 deaths/yr. (from lost NO2 removal), and 0.12 deaths/yr. (from lost CO removal), with associated economic costs of $115 million/yr. (PM2.5), $29.9 million/yr. (O3), $52.8 million/yr. (SO2), $55.4 million/yr. (NO2) and $1.09 million/yr. (CO). Significant respiratory-related morbidity impacts were also found, but the economic costs associated with them are orders of magnitude lower than the observed mortality health costs due to large differences in per unit values (i.e., VSL vs. cost-of-illness).
Substantial county-level spatial and temporal heterogeneity was found across the Western US, with clear clustering occurring in at least three parts of the region where disproportionally high beetle kill occurred over the study period. The magnitude of impacts in a given county were also found to vary considerably from year-to-year due primarily to changes in MPB kill, which is driven in large part by weather and wildfire conditions that impact MPB populations and tree resilience. In addition to its avoidance behavior implications, the heterogeneity findings might also presage what could occur as MPB spreads outside of its historical range into the eastern US and eastern Canada. Specifically, that detection of MPB in an area is not a necessary and sufficient condition for meaningful pollution health impacts; rather, large health impacts likely emerge after an outbreak has occurred and around high population centers where lost pollutant sinks will be more impactful. Thus, from a health policy perspective, the focus and attention of forest management should be on reducing the likelihood of severe MPB outbreaks (especially those near urban areas).
My results can be compared to those from Nowak et al. [19] who estimated 8.29 × 10⁻⁴ avoided deaths per ton of PM2.5 removed and 1.92 × 10⁻⁵ avoided deaths per ton of O3 removed by trees in the conterminous US. By comparison, I estimate that an average of 4.07 × 10⁻⁴ and 3.06 × 10⁻⁵ deaths are associated with each MPB-induced lost ton of PM2.5 and O3, respectively. The small differences observed may be caused by differences in the types of tree species investigated (I focus exclusively on conifers and not all tree species found in the US) and study location (Western US vs. conterminous US). Overall, however, the results are reasonably comparable on key metrics to the extant literature.
While the focus on this work is on one direction of impact (the effect of MPB on air pollution and, by association, human health), it is important to note that other couplings likely exist between MPB, trees, and air pollution. Prior work has shown that air pollution itself can negatively affect insect species growth and interactions [52,53]. Additionally, trees’ natural defense mechanisms and stress tolerance are known to be a function of air pollution levels [54]. Elevated air pollution levels in MPB infested areas could therefore result in other impacts that might be investigated as a part of future work.
Since the investigation undertaken here included a complete record of all MPB tree mortality in the Western US, it is representative of the entire historical geographic range of MPB outbreaks in the US. Going forward in time, however, it is unclear how generalizable these results will be due to the unpredictable nature of MPB outbreaks from year-to-year. Over the study period from 2005 to 2012, several historically large MPB outbreaks occurred across the west, though outbreaks over the past few years (2013-onward) have been more limited in size and scale [4]. If the era of subdued MPB outbreaks continues into the future, then the pollution health impacts of the beetle will be lower in magnitude than those estimated here. However, by some accounts, the current limited period of outbreaks is likely only a short-term deviation, and on-going climate change and persistent droughts in the west are expected to contribute to increased MPB outbreaks in the future [55]. If this scenario is true, it would mean that the health impacts estimated here are potentially lower bounds on what future impacts may be, especially if MPB spreads outside of its historical range [56].
Along these same lines, there is concerted efforts by Federal, state, and local forest management officials to improve overall forest health conditions across the US, such as by thinning tree stands, removing undergrowth, and utilizing controlled burns. Such efforts not only can reduce the probability of a successful MPB outbreak [29], but can also reduce future wildfire risk and severity [30]. Depending on the success of future MPB control policies, it is therefore possible that the human health impacts of MPB are lower in the future than those estimated here.
Perhaps more importantly, is the need for continued financing mechanisms of forest health improvement programs. While the explosive growth of wildfire frequency and severity over the last decade certainly has created strong impetus for action, the “co-benefits” of MPB management (e.g., crown thinning, understory removal, etc.) on forest health cannot be overlooked. Thus, benefit-cost analyses of MPB management initiatives, inclusive of pollution and human health considerations, have the potential to be consequential going forward by increasing the expected benefits of action vis-à-vis the larger airshed. This could help increase resources directed towards forest health programs, which would affect both MPB and future wildfire risk.
Funding
This research received no external funding.
Institutional Review Board Statement
Not applicable.
Informed Consent Statement
Not applicable.
Data Availability Statement
None.
Conflicts of Interest
The author declares no conflict of interest.
Appendix A. MPB Life Cycle Dynamics
MPB has a one-year life cycle (two-year in some high elevation settings) that begins in late-summer when female adults bore into living trees, often in pheromone coordinated mass attacks, and lay up to 100 eggs under the tree bark [57]. Attacks by MPB produce a characteristic “pitch tube” on the surface of the tree trunk caused by resin secretion by the tree. Within two weeks, the eggs hatch and the larvae tunnel their way throughout the upper-layers of the tree as they feed on fungal spores and tree tissue and develop overwinter. Feeding continues into the spring and adult MPB emerge from the tree between late-July and mid-August depending on tree species and weather conditions, and the cycle begins anew. Under outbreak conditions, enough MPB can emerge from a single tree to kill at least two trees the following year [57]. Tree mortality is caused, at sufficient beetle density, by the destruction of tree phloem (which prevents water and nutrient transport within the tree) and by the introduction of a blue stain fungus that is present on the bodies of adult MPB. The combination of phloem destruction and fungal infection kills the tree within approximately one year after successful beetle attack, causing the crown of the tree to turn a dry, rusty-brown color [58]. Dead trees are commonly removed as part of salvage harvesting operations or for other reasons [59].
MPB has several natural predators, including woodpeckers, clerid beetles, and several bird species. Unfortunately, once a given conifer has been infested by MPB, there are few viable options for preventing tree mortality; hence, management and control objectives commonly focus on prevention through the use of insecticides (e.g., carbaryl, permethrin, and bifenthrin), sprayed on green non-infested trees in early summer to deter attacks, and stand density thinning and species diversification, which improves overall forest health and reduces trees’ susceptibility to successful MPB attacks [29,57].
Recent MPB outbreaks have been rather devastating to Western US conifer forests. An estimated 3.4 million acres of forests have been affected by MPB in Colorado between the late-1990s and 2012 [55] and at least 4 million acres have been affected in Wyoming over 1995–2016 [60]. Since 1990, the US Forest Service estimates that MPB has affected more than 55 million acres of forests, or approximately 20% of all conifer forests by area in the Western US [4]. To provide some perspective, in 2015 alone, MPB was responsible for nearly 22% of total tree mortality across all surveyed US forested lands, though the exact figure ebbs and flows over time depending on host abundance, temperature and precipitation conditions, and the occurrence of large forest fires [4]. For example, in 2010, MPB was responsible for 74% of total tree mortality on US Forest Service surveyed lands. Impacts to Canadian forests have also been extensive [61].
Appendix B. MPB Disturbance Data
This appendix provides additional details on the MPB disturbance data from the US Forest Service Digital Aerial Sketch Mapping (DASM) system over 2005–2011.
DASM data are collected by using highly-trained observers onboard small aircraft that fly over forested areas of interest, typically at altitudes of 1000–3000ft. above ground-level. The observer tracks the plane’s location on hardcopy maps or physical/digital aerial photographs and sketches areas of interest on them (as points, lines, or polygons) as they fly over an area. Aerial data are used in conjunction with ground surveys to ascertain the specific cause(s) of tree mortality from various sources [62]. For the case of MPB, tree mortality is determined on the basis of observing characteristic rusty-brown colored tree canopies in coniferous forests where ground surveys indicate recent or active presence of MPB.
The DASM, and since 2015, the DMSM (Digital Mobile Sketch Mapping), are the primary methods used by the US Forest Service for collecting data on forested areas affected by insects and disease. The DMSM data also provide estimates of the number of trees killed by MPB, but only over the period 2015–2019. I choose to use the DASM data instead in order to evaluate a longer time series (2005–2011) and to also cover several years of extreme MPB outbreaks in the late-2000s. These data are used to produce the annual Forest Insect and Disease Conditions reports that are required by the amended Cooperative Forestry Assistance Act of 1978. Thus, they are official record of the health of US forests. However, it is important to note that past work has found that the beetle-caused tree mortality estimates reported in the DASM are likely underestimates of actual tree mortality [63]. Given this, the air pollution and human health impacts modeled in the present study are potentially lower-bounds on actual MPB impacts. This motivates some of the sensitivity checks in Appendix D.
The DASM data are available as annual shapefiles in polygon format and the associated database tables contain information on the insect species, tree host species, damage type (e.g., mortality, defoliation), acres surveyed, survey year, and the extent of tree damage (e.g., percent affected range, number of dead trees, etc.).
Appendix C. Mortality and Morbidity Health Costs Per 100 Trees Killed by MPB
Table A1.
Health costs per 100 trees killed by MPB by pollutant type and year for the Western US, 2005–2011.
Table A1.
Health costs per 100 trees killed by MPB by pollutant type and year for the Western US, 2005–2011.
| Mortality (All-Cause) | ER Visits (Asthma) | Hospital Admissions (All-Respiratory) | ||
|---|---|---|---|---|
| Trees Killed (Millions) | Costs Per 100 Trees Killed ($) | Costs Per 100 Trees Killed ($) | Costs Per 100 Trees Killed ($) | |
| PM2.5 | ||||
| 2005 | 15.2 | 618 | 0.020 | 0.592 |
| 2006 | 15.1 | 689 | 0.020 | 0.556 |
| 2007 | 20.3 | 547 | 0.025 | 0.571 |
| 2008 | 51.6 | 236 | 0.017 | 0.430 |
| 2009 | 59.4 | 247 | 0.017 | 0.401 |
| 2010 | 41.0 | 327 | 0.022 | 0.510 |
| 2011 | 35.9 | 260 | 0.053 | 1.14 |
| Average | 37.2 | 418 | 0.025 | 0.600 |
| O3 | ||||
| 2005 | 15.2 | 59.9 | 0.001 | 0.125 |
| 2006 | 15.1 | 58.0 | 0.002 | 0.113 |
| 2007 | 20.3 | 72.9 | 0.002 | 0.138 |
| 2008 | 51.6 | 65.5 | 0.002 | 0.114 |
| 2009 | 59.4 | 65.0 | 0.002 | 0.125 |
| 2010 | 41.0 | 82.4 | 0.002 | 0.161 |
| 2011 | 35.9 | 195.3 | 0.006 | 0.396 |
| Average | 37.2 | 85.6 | 0.002 | 0.167 |
| SO2 | ||||
| 2005 | 15.2 | 320 | 0.001 | 1.13 |
| 2006 | 15.1 | 262 | 0.001 | 0.921 |
| 2007 | 20.3 | 208 | 0.001 | 0.966 |
| 2008 | 51.6 | 125 | 0.001 | 0.874 |
| 2009 | 59.4 | 134 | 0.002 | 1.03 |
| 2010 | 41.0 | 160 | 0.002 | 1.19 |
| 2011 | 35.9 | 81.3 | 0.003 | 2.24 |
| Average | 37.2 | 184 | 0.002 | 1.19 |
| NO2 | ||||
| 2005 | 15.2 | 307 | 0.005 | 0.270 |
| 2006 | 15.1 | 403 | 0.006 | 0.278 |
| 2007 | 20.3 | 243 | 0.010 | 0.404 |
| 2008 | 51.6 | 122 | 0.006 | 0.244 |
| 2009 | 59.4 | 110 | 0.005 | 0.261 |
| 2010 | 41.0 | 134 | 0.010 | 0.424 |
| 2011 | 35.9 | 134 | 0.025 | 1.18 |
| Average | 37.2 | 208 | 0.010 | 0.437 |
| CO | ||||
| 2005 | 15.2 | 4.84 | 0.00007 | 0.040 |
| 2006 | 15.1 | 3.94 | 0.00007 | 0.033 |
| 2007 | 20.3 | 3.52 | 0.00010 | 0.025 |
| 2008 | 51.6 | 2.83 | 0.00006 | 0.019 |
| 2009 | 59.4 | 2.51 | 0.00005 | 0.019 |
| 2010 | 41.0 | 2.76 | 0.00007 | 0.022 |
| 2011 | 35.9 | 4.23 | 0.00011 | 0.031 |
| Average | 37.2 | 3.52 | 0.00008 | 0.027 |
Notes: listed are the total annual health costs per 100 trees killed by MPB by pollutant type and year across all Western US counties for all-cause mortality, ER visits asthma, and HA all-respiratory. Costs are in 2019 USD.
Appendix D. Sensitivity Analysis
To investigate model sensitivity to key parameter inputs and assumptions made to produce the baseline results reported in the main text, a sensitivity analysis was completed, which is described in this appendix.
First, it was previously assumed that 100% of the PM2.5 pollutant removal of a given conifer was lost when it was killed by MPB. This is true in the long-run (5+ years), due to needle fall and tree collapse. This assumption is also reasonable in the short-run for areas where commercial harvesting (or other salvage operations) is used to quickly remove MPB-infested stands (which probably includes the bulk of the study area in this work). The precise timing of tree removal, needle fall, or tree collapse will be species and context specific. For commercial harvesting purposes, MPB-infested trees tend to be harvested within the first one to two years of initial MPB attack; the time period when dieback is first visually witnessed [64]. In this case, an assumption of 100% PM2.5 loss due to MPB in the baseline results is reasonable for most Western US forest stands, where many forested communities have harvesting industries (e.g., in Colorado, Montana, the Pacific Northwest, California, and Wyoming). Note that these communities are also those where most MPB dieback occurs (see Figure 1). In areas where tree harvesting is not widely available or used (e.g., the Southwest), needle fall will occur two to three years after a successful MPB attack and tree collapse will occur several years after that (e.g., five+ years later) [64]. However, in Western US areas where harvesting/removal is not immediate, some PM2.5 removal will still occur given the existence of surfaces on which particulates could continue to rest (e.g., branches, needles, etc.), despite the fact that the tree is dead. To investigate how the inclusion of limited PM2.5 removal affects the results, I re-estimated the i-Tree component of the model but now included a “canopy dieback” characteristic value of 10–15% for all conifer trees killed by MPB. Inclusion of this dieback value will reduce the leaf area index values used by i-Tree by 10–15%, indicating some limited dieback due to MPB, but still allowing for the majority (85–90%) of the tree canopy to remain available for PM2.5 removal. Selection of a 10–15% dieback value is based on [65] who conducted field studies after successful MPB attacks and found that canopy dieback was between 7% and 33% during the first two years after attack, depending on the tree stand studied. Pollution removal for all other pollutants remained unchanged. Results are presented in Table A2 and indicate that MPB is associated with reduced losses of PM2.5 removal and associated health impacts compared to the baseline results, as expected. PM2.5 mortality health costs now average $15.1 million per year compared to $115 million per year in the baseline results previously presented. Health costs for all other pollutants are unchanged. The $15.1 million/yr. estimate on PM2.5 mortality health costs should be considered an extreme lower bound, since many MPB-affected trees are removed for commercial purposes (thus resulting in an immediate loss of PM2.5 removal). Additionally, whereas the $115 million/yr. baseline estimate is a one-time cost (since tree mortality and the 100% loss of PM2.5 removal occur in the same year), the $15.1 million/yr. estimate from the sensitivity analysis should be considered as an intertemporal stream of annual costs, beginning when MPB-induced dieback first occurs and ending years later when tree collapse occurs.
Second, there is a concern that the DASM survey data obtained from the US Forest Service underestimates actual MPB tree mortality. Meddens et al. [63] calculate that actual tree mortality in the Western US may be between 13.6 and 20.9 times the numbers reported in the DASM. Given this, I follow Meddens et al. [63] and use an adjustment factor to “correct” the DASM data. To be conservative, I take 13.6 as my adjustment factor and use this to increase the number of trees killed by MPB in each county-year by a factor of 13.6. The adjusted tree mortality data were used in i-Tree Eco. As shown in Table A3, aggregate MPB-induced mortality and morbidity impacts are substantially increased due to the adjustment, by an average of 13.6 times. On average, PM2.5 mortality health costs are now $1.6 billion per year compared to $115 million per year in the baseline results.
Finally, if MPB do not exclusively or nearly exclusively attack large, mature coniferous trees (i.e., if a non-insignificant portion of the tree losses captured in the DASM data are for small, young trees) then the baseline results may be overestimating the pollution and health impacts of MPB since I previously used large diameter tree data in i-Tree Eco (and larger trees remove more pollutants, ceteris paribus). As a check on this, I now use the midpoint of the tree diameter range estimates from the Gymnosperm Database [35] for each conifer tree species in the data, rather than the maximum of the range as before, thereby allowing for the possibility that smaller diameter trees are killed by MPB, lowering average tree size. Using the new tree diameter parameter values in i-Tree Eco, I re-estimated the pollution health impacts of MPB (Table A4). Overall, mortality and morbidity impacts are lower by approximately 70% on average due to this change. PM2.5 mortality health costs now average $37 million per year compared to $115 million per year in the baseline results.
Table A2.
Aggregate MPB air pollution and human health impacts with limited PM2.5 pollution removal.
Table A2.
Aggregate MPB air pollution and human health impacts with limited PM2.5 pollution removal.
| Lost PM2.5 Removal (t) | Mortality (All-Cause) Due to Lost PM2.5 | ER Visits (Asthma) Due to Lost PM2.5 | HA (All-Respiratory) Due to Lost PM2.5 | Mortality Costs (Millions $) | ER Visits Costs (Millions $) | HA Costs (Millions $) | |
|---|---|---|---|---|---|---|---|
| 2005 | 1865 | 1.30 | 0.850 | 0.299 | 12.2 | 0.0004 | 0.012 |
| 2006 | 1893 | 1.42 | 0.898 | 0.277 | 13.4 | 0.0004 | 0.011 |
| 2007 | 2112 | 1.54 | 1.40 | 0.387 | 14.5 | 0.0007 | 0.015 |
| 2008 | 5975 | 1.72 | 2.61 | 0.754 | 16.2 | 0.0012 | 0.029 |
| 2009 | 6984 | 2.08 | 2.74 | 0.801 | 19.5 | 0.0013 | 0.032 |
| 2010 | 4791 | 1.74 | 2.55 | 0.692 | 17.4 | 0.0012 | 0.027 |
| 2011 | 4046 | 1.31 | 5.32 | 1.39 | 12.3 | 0.0024 | 0.054 |
| Average | 4300 | 1.59 | 2.34 | 0.657 | 15.1 | 0.0011 | 0.026 |
Notes: listed are the total annual air pollution and human health impacts of MPB-induced tree mortality across all Western US counties, by year. Estimates were obtained assuming 10–15% conifer canopy dieback for each tree killed by MPB rather than 100% canopy dieback as was assumed in the baseline results in the main text. Costs are in millions of 2019 USD.
Table A3.
Aggregate MPB mortality and morbidity impacts and costs after adjusting the estimates of MPB tree mortality.
Table A3.
Aggregate MPB mortality and morbidity impacts and costs after adjusting the estimates of MPB tree mortality.
| Mortality (All-Cause) | ER Visits (Asthma) | Hospital Admissions (All-Respiratory) | |||||
|---|---|---|---|---|---|---|---|
| Trees Killed (Millions) | Cases | Costs (Millions $) | Cases | Costs (Millions $) | Cases | Costs (Millions $) | |
| PM2.5 | |||||||
| 2005 | 207 | 136 | 1277 | 88.9 | 0.041 | 31.2 | 1.22 |
| 2006 | 205 | 149 | 1414 | 94.6 | 0.041 | 29.2 | 1.14 |
| 2007 | 276 | 160 | 1509 | 146 | 0.068 | 40.3 | 1.58 |
| 2008 | 702 | 175 | 1659 | 265 | 0.122 | 76.6 | 3.02 |
| 2009 | 808 | 214 | 1999 | 285 | 0.136 | 82.5 | 3.24 |
| 2010 | 558 | 193 | 1822 | 263 | 0.122 | 72.4 | 2.84 |
| 2011 | 488 | 135 | 1270 | 549 | 0.258 | 143 | 5.58 |
| Average | 463 | 166 | 1564 | 242 | 0.113 | 67.9 | 2.66 |
| O3 | |||||||
| 2005 | 207 | 13.1 | 124 | 6.36 | 0.003 | 6.54 | 0.258 |
| 2006 | 205 | 12.6 | 119 | 7.08 | 0.004 | 5.88 | 0.232 |
| 2007 | 276 | 21.4 | 201 | 12.2 | 0.005 | 9.79 | 0.381 |
| 2008 | 702 | 48.6 | 459 | 26.5 | 0.012 | 20.5 | 0.802 |
| 2009 | 808 | 55.6 | 525 | 32.2 | 0.014 | 25.7 | 1.01 |
| 2010 | 558 | 48.8 | 460 | 28.3 | 0.014 | 22.8 | 0.897 |
| 2011 | 488 | 101.2 | 953 | 64.6 | 0.027 | 49.1 | 1.93 |
| Average | 463 | 43.0 | 406 | 25.3 | 0.011 | 20.0 | 0.787 |
| SO2 | |||||||
| 2005 | 207 | 70.0 | 661 | 5.25 | 0.003 | 59.3 | 2.34 |
| 2006 | 205 | 56.9 | 537 | 4.71 | 0.003 | 48.0 | 1.89 |
| 2007 | 276 | 60.9 | 573 | 7.14 | 0.004 | 67.8 | 2.67 |
| 2008 | 702 | 93.4 | 879 | 17.0 | 0.008 | 156 | 6.13 |
| 2009 | 808 | 115 | 1083 | 24.1 | 0.013 | 212 | 8.32 |
| 2010 | 558 | 94.7 | 892 | 18.5 | 0.010 | 168 | 6.61 |
| 2011 | 488 | 42.0 | 397 | 39.9 | 0.014 | 279 | 10.95 |
| Average | 463 | 76.1 | 717 | 16.7 | 0.008 | 141 | 5.56 |
| NO2 | |||||||
| 2005 | 207 | 67.5 | 635 | 19.3 | 0.010 | 14.1 | 0.557 |
| 2006 | 205 | 87.9 | 828 | 26.2 | 0.012 | 14.4 | 0.571 |
| 2007 | 276 | 71.3 | 671 | 50.0 | 0.028 | 28.6 | 1.12 |
| 2008 | 702 | 90.6 | 853 | 82.7 | 0.041 | 43.7 | 1.71 |
| 2009 | 808 | 94.2 | 889 | 96.7 | 0.042 | 53.7 | 2.11 |
| 2010 | 558 | 79.1 | 748 | 105 | 0.054 | 60.4 | 2.36 |
| 2011 | 488 | 69.2 | 653 | 256 | 0.124 | 147 | 5.74 |
| Average | 463 | 80.0 | 754 | 90.8 | 0.044 | 51.7 | 2.02 |
| CO | |||||||
| 2005 | 207 | 1.06 | 10.0 | 0.394 | 0.0001 | 2.08 | 0.081 |
| 2006 | 205 | 0.86 | 8.09 | 0.354 | 0.0001 | 1.65 | 0.068 |
| 2007 | 276 | 1.03 | 9.72 | 0.435 | 0.0003 | 1.87 | 0.069 |
| 2008 | 702 | 2.10 | 19.9 | 0.843 | 0.0004 | 3.61 | 0.136 |
| 2009 | 808 | 2.16 | 20.3 | 0.911 | 0.0004 | 3.90 | 0.149 |
| 2010 | 558 | 1.62 | 15.4 | 0.707 | 0.0004 | 2.97 | 0.122 |
| 2011 | 488 | 2.18 | 20.7 | 1.07 | 0.0005 | 3.90 | 0.150 |
| Average | 463 | 1.57 | 14.9 | 0.673 | 0.0003 | 2.85 | 0.111 |
Notes: listed are the total annual mortality and morbidity health impacts and costs of MPB-induced tree mortality across all Western US counties, by year. Annual tree mortality estimates have been increased by a factor of 13.6 to adjust for underestimates in the DASM data. Costs are in millions of 2019 USD.
Table A4.
Aggregate MPB mortality and morbidity impacts and costs after lowering average conifer tree size.
Table A4.
Aggregate MPB mortality and morbidity impacts and costs after lowering average conifer tree size.
| Mortality (All-Cause) | ER Visits (Asthma) | Hospital Admissions (All-Respiratory) | ||||
|---|---|---|---|---|---|---|
| Cases | Costs (Millions $) | Cases | Costs (Millions $) | Cases | Costs (Millions $) | |
| PM2.5 | ||||||
| 2005 | 3.22 | 30.3 | 2.11 | 0.001 | 0.742 | 0.029 |
| 2006 | 3.54 | 33.5 | 2.24 | 0.001 | 0.693 | 0.027 |
| 2007 | 3.81 | 35.1 | 3.45 | 0.002 | 0.954 | 0.037 |
| 2008 | 4.17 | 39.4 | 6.29 | 0.003 | 1.82 | 0.072 |
| 2009 | 5.01 | 47.1 | 6.77 | 0.003 | 1.96 | 0.077 |
| 2010 | 4.55 | 43.2 | 6.24 | 0.003 | 1.72 | 0.067 |
| 2011 | 3.21 | 30.1 | 13.01 | 0.006 | 3.39 | 0.132 |
| Average | 3.93 | 37.0 | 5.73 | 0.003 | 1.61 | 0.063 |
| O3 | ||||||
| 2005 | 0.194 | 1.82 | 0.094 | 0.00004 | 0.096 | 0.004 |
| 2006 | 0.181 | 1.75 | 0.104 | 0.00006 | 0.086 | 0.003 |
| 2007 | 0.314 | 2.94 | 0.180 | 0.00008 | 0.144 | 0.006 |
| 2008 | 0.714 | 6.75 | 0.392 | 0.0002 | 0.301 | 0.012 |
| 2009 | 0.818 | 7.72 | 0.471 | 0.0002 | 0.374 | 0.015 |
| 2010 | 0.704 | 6.76 | 0.416 | 0.0002 | 0.336 | 0.013 |
| 2011 | 1.41 | 14.01 | 0.951 | 0.0004 | 0.722 | 0.028 |
| Average | 0.619 | 5.96 | 0.373 | 0.0002 | 0.294 | 0.012 |
| SO2 | ||||||
| 2005 | 1.56 | 14.7 | 0.117 | 0.00001 | 1.32 | 0.052 |
| 2006 | 1.26 | 11.7 | 0.104 | 0.00001 | 1.07 | 0.042 |
| 2007 | 1.32 | 12.8 | 0.159 | 0.00001 | 1.51 | 0.059 |
| 2008 | 2.09 | 19.5 | 0.378 | 0.0002 | 3.48 | 0.137 |
| 2009 | 2.51 | 24.1 | 0.536 | 0.0003 | 4.72 | 0.185 |
| 2010 | 2.11 | 19.9 | 0.412 | 0.0002 | 3.75 | 0.142 |
| 2011 | 0.936 | 8.84 | 0.890 | 0.0003 | 6.21 | 0.244 |
| Average | 1.68 | 15.9 | 0.371 | 0.0001 | 3.15 | 0.123 |
| NO2 | ||||||
| 2005 | 1.19 | 11.1 | 0.338 | 0.0002 | 0.247 | 0.009 |
| 2006 | 1.52 | 14.5 | 0.459 | 0.0002 | 0.252 | 0.010 |
| 2007 | 1.25 | 11.7 | 0.876 | 0.0005 | 0.510 | 0.019 |
| 2008 | 1.47 | 14.9 | 1.45 | 0.0007 | 0.766 | 0.031 |
| 2009 | 1.62 | 15.5 | 1.69 | 0.0007 | 0.941 | 0.037 |
| 2010 | 1.39 | 13.0 | 1.84 | 0.0009 | 1.06 | 0.041 |
| 2011 | 1.21 | 11.4 | 4.48 | 0.002 | 2.57 | 0.101 |
| Average | 1.38 | 13.2 | 1.59 | 0.0007 | 0.907 | 0.035 |
| CO | ||||||
| 2005 | 0.022 | 0.198 | 0.008 | 0.000003 | 0.041 | 0.002 |
| 2006 | 0.017 | 0.160 | 0.007 | 0.000003 | 0.032 | 0.001 |
| 2007 | 0.020 | 0.192 | 0.009 | 0.000005 | 0.037 | 0.001 |
| 2008 | 0.041 | 0.395 | 0.017 | 0.000008 | 0.072 | 0.003 |
| 2009 | 0.041 | 0.402 | 0.018 | 0.000008 | 0.078 | 0.003 |
| 2010 | 0.032 | 0.305 | 0.014 | 0.000008 | 0.059 | 0.002 |
| 2011 | 0.043 | 0.411 | 0.021 | 0.00001 | 0.077 | 0.003 |
| Average | 0.031 | 0.295 | 0.013 | 0.000006 | 0.057 | 0.002 |
Notes: listed are the total annual mortality and morbidity health impacts and costs of MPB-induced tree mortality across all Western US counties, by year. Average species-specific tree diameter sizes have been reduced as described in the main text. Costs are in millions of 2019 USD.
References
- Sambaraju, K.R.; Goodsman, D.W. Mountain pine beetle: An example of a climate-driven eruptive insect impacting conifer forest ecosystems. CAB Rev. 2021, 16, 1–18. [Google Scholar] [CrossRef]
- Negrón, J.F.; Klutsch, J.G. Probability of Infestation and Extent of Mortality Models for Mountain Pine Beetle in Lodgepole Pine Forests in Colorado; USDA Forest Service Res. Note. RN-RMRS-77; Rocky Mountain Research Station: Fort Collins, CO, USA, 2017.
- Soderberg, D.N.; Mock, K.E.; Hofstetter, R.W.; Bentz, B.J. Translocation experiment reveals capacity for mountain pine beetle persistence under climate warming. Ecol. Monogr. 2021, 91, e01437. [Google Scholar] [CrossRef]
- US Forest Service. Major Forest Insect and Disease Conditions in the United States: 2015; FS-1093; USDA Forest Service, Forest Health Protection Office: Washington, DC, USA, 2017. Available online: https://www.fs.fed.us/foresthealth/publications/ConditionsReport_2015.pdf (accessed on 15 November 2021).
- Rosenberger, R.S.; Bell, L.A.; Champ, P.A.; White, E.M. Estimating the economic value of recreation losses in Rocky Mountain National Park due to a mountain pine beetle outbreak. West. Econ. Forum 2013, 12, 31–39. [Google Scholar]
- Price, J.I.; McCollum, D.W.; Berrens, R.P. Insect infestation and residential property values: A hedonic analysis of the mountain pine beetle epidemic. For. Policy Econ. 2010, 12, 415–422. [Google Scholar] [CrossRef]
- Sheppard, S.; Picard, P. Visual-quality impacts of forest pest activity at the landscape level: A synthesis of published knowledge and research needs. Landsc. Urban Plan. 2006, 77, 321–342. [Google Scholar] [CrossRef]
- Holmes, T.; Koch, F. Bark Beetle Epidemics, Life Satisfaction, and Economic Well-Being. Forests 2019, 10, 696. [Google Scholar] [CrossRef] [Green Version]
- Corbett, L.J.; Withey, P.; Lantz, V.A.; Ochuodho, T.O. The economic impact of the mountain pine beetle infestation in British Columbia: Provincial estimates from a CGE analysis. Forestry 2016, 89, 100–105. [Google Scholar] [CrossRef] [Green Version]
- Mazza, G.; Tricarico, E. (Eds.) Invasive Species and Human Health; CABI: Oxfordshire, UK, 2018. [Google Scholar]
- Jones, B.A. Invasive species impacts on human well-being using the life satisfaction index. Ecol. Econ. 2017, 134, 250–257. [Google Scholar] [CrossRef]
- European Environment Agency. The Impacts of Invasive Alien Species in Europe; European Environment Agency: Copenhagen, Denmark, 2012. Available online: https://www.eea.europa.eu/publications/impacts-of-invasive-alien-species (accessed on 15 November 2021).
- McCollum, D.W.; Lundquist, J.E. Bark Beetle Infestation of Western US Forests: A Context for Assessing and Evaluating Impacts. J. For. 2019, 117, 171–177. [Google Scholar] [CrossRef]
- Nowak, D.J.; Crane, D.E.; Stevens, J.C. Air pollution removal by urban trees and shrubs in the United States. Urban For. Urban Green. 2006, 4, 115–123. [Google Scholar] [CrossRef]
- Khaniabadi, Y.O.; Polosa, R.; Chuturkova, R.; Daryanoosh, M.; Goudarzi, G.; Borgini, A.; Tittarelli, A.; Basiri, H.; Armin, H.; Nourmoradi, H.; et al. Human health risk assessment due to ambient PM10 and SO2 by an air quality modeling technique. Process. Saf. Environ. Prot. 2017, 111, 346–354. [Google Scholar] [CrossRef]
- Anenberg, S.C.; Horowitz, L.W.; Tong, D.Q.; West, J.J. An estimate of the global burden of anthropogenic ozone and fine particulate matter on premature human mortality using atmospheric modeling. Environ. Health Perspect. 2010, 118, 1189–1195. [Google Scholar] [CrossRef]
- Chen, T.M.; Kuschner, W.G.; Gokhale, J.; Shofer, S. Outdoor air pollution: Nitrogen dioxide, sulfur dioxide, and carbon monoxide health effects. Am. J. Med. Sci. 2007, 333, 249–256. [Google Scholar] [CrossRef]
- Nowak, D.J.; Hirabayashi, S.; Bodine, A.; Hoehn, R. Modeled PM2.5 removal by trees in ten US cities and associated health effects. Environ. Pollut. 2013, 178, 395–402. [Google Scholar] [CrossRef] [PubMed]
- Nowak, D.J.; Hirabayashi, S.; Bodine, A.; Greenfield, E. Tree and forest effects on air quality and human health in the United States. Environ. Pollut. 2014, 193, 119–129. [Google Scholar] [CrossRef] [PubMed] [Green Version]
- Chen, L.; Liu, C.; Zhang, L.; Zou, R.; Zhang, Z. Variation in tree species ability to capture and retain airborne fine particulate matter (PM2.5). Sci. Rep. 2017, 7, 3206. [Google Scholar] [CrossRef]
- Garg, T. Ecosystems and human health: The local benefits of forest cover in Indonesia. J. Environ. Econ. Manag. 2019, 98, 102271. [Google Scholar] [CrossRef] [Green Version]
- Berazneva, J.; Byker, T.S. Does forest loss increase human disease? Evidence from Nigeria. Am. Econ. Rev. 2017, 107, 516–521. [Google Scholar] [CrossRef] [Green Version]
- Jones, B.A.; McDermott, S.M. Health impacts of invasive species through an altered natural environment: Assessing air pollution sinks as a causal pathway. Environ. Resour. Econ. 2018, 71, 23–43. [Google Scholar] [CrossRef]
- Jones, B.A. Forest-attacking Invasive Species and Infant Health: Evidence from the Invasive Emerald Ash Borer. Ecol. Econ. 2018, 154, 282–293. [Google Scholar] [CrossRef]
- Jones, B.A.; McDermott, S.M.; Chermak, J.M. PLAN or get SLAM’ed: Optimal management of invasive species in the presence of indirect health externalities. J. Environ. Manag. 2016, 180, 538–550. [Google Scholar] [CrossRef] [PubMed]
- Donovan, G.H.; Butry, D.T.; Michael, Y.L.; Prestemon, J.P.; Liebhold, A.M.; Gatziolis, D.; Mao, M.Y. The relationship between trees and human health: Evidence from the spread of the emerald ash borer. Am. J. Prev. Med. 2013, 44, 139–145. [Google Scholar] [CrossRef]
- Niquidet, K.; Stennes, B.; van Kooten, G.C. Bioenergy from mountain pine beetle timber and forest residuals: A cost analysis. Can. J. Agric. Econ. 2012, 60, 195–210. [Google Scholar] [CrossRef]
- Sims, C.; Aadland, D.; Finnoff, D. A dynamic bioeconomic analysis of mountain pine beetle epidemics. J. Econ. Dyn. Control 2010, 34, 2407–2419. [Google Scholar] [CrossRef]
- Fettig, C.J.; Klepzig, K.D.; Billings, R.F.; Munson, A.S.; Nebeker, T.E.; Negrón, J.F.; Nowak, J.T. The effectiveness of vegetation management practices for prevention and control of bark beetle infestations in coniferous forests of the Western and southern United States. For. Ecol. Manag. 2007, 238, 24–53. [Google Scholar] [CrossRef]
- Hartsough, B.R.; Abrams, S.; Barbour, R.J.; Drews, E.S.; McIver, J.D.; Moghaddas, J.J.; Schwilk, D.W.; Stephens, S.L. The economics of alternative fuel reduction treatments in Western United States dry forests: Financial and policy implications from the National Fire and Fire Surrogate Study. For. Policy Econ. 2008, 10, 344–354. [Google Scholar] [CrossRef]
- Nowak, D.J. Understanding i-Tree: Summary of Programs and Methods; US Forest Service: Syracuse, NY, USA, 2019; in press.
- Song, P.; Kim, G.; Mayer, A.; He, R.; Tian, G. Assessing the Ecosystem Services of Various Types of Urban Green Spaces Based on i-Tree Eco. Sustainability 2020, 12, 1630. [Google Scholar] [CrossRef] [Green Version]
- Hirabayashi, S.; Nowak, D.J. Comprehensive national database of tree effects on air quality and human health in the United States. Environ. Pollut. 2016, 215, 48–57. [Google Scholar] [CrossRef] [PubMed]
- Selmi, W.; Weber, C.; Rivière, E.; Blond, N.; Mehdi, L.; Nowak, D. Air pollution removal by trees in public green spaces in Strasbourg city, France. Urban For. Urban Green. 2016, 17, 192–201. [Google Scholar] [CrossRef] [Green Version]
- Earle, C.J. The Gymnosperm Database. 2020. Available online: https://www.conifers.org/index.php (accessed on 15 November 2021).
- US EPA. BenMAP-CE User’s Manual—April 2021; US EPA: Washington, DC, USA, 2021. Available online: https://www.epa.gov/sites/production/files/2015-04/documents/benmap-ce_user_manual_march_2015.pdf (accessed on 15 November 2021).
- US EPA. Guidelines for Preparing Economic Analyses—Chapter 7: Analyzing Benefits; US EPA: Washington, DC, USA, 2010. Available online: https://www.epa.gov/sites/production/files/2017-09/documents/ee-0568-07.pdf (accessed on 15 November 2021).
- Stanford, R.; Mclaughlin, T.; Okamoto, L.J. The cost of asthma in the emergency department and hospital. Am. J. Respir. Crit. Care Med. 1999, 160, 211–215. [Google Scholar] [CrossRef] [PubMed]
- Crowther, T.W.; Glick, H.B.; Covey, K.R.; Bettigole, C.; Maynard, D.S.; Thomas, S.M.; Smith, J.R.; Hintler, G.; Duguid, M.C.; Amatulli, G.; et al. Mapping tree density at a global scale. Nature 2015, 525, 201–205. [Google Scholar] [CrossRef]
- Vanos, J.K.; Hebbern, C.; Cakmak, S. Risk assessment for cardiovascular and respiratory mortality due to air pollution and synoptic meteorology in 10 Canadian cities. Environ. Pollut. 2014, 185, 322–332. [Google Scholar] [CrossRef] [PubMed] [Green Version]
- Jerrett, M.; Burnett, R.T.; Beckerman, B.S.; Turner, M.C.; Krewski, D.; Thurston, G.; Martin, R.; Van Donkelaar, A.; Hughes, E.; Shi, Y.; et al. Spatial analysis of air pollution and mortality in California. Am. J. Respir. Crit. Care Med. 2013, 188, 593–599. [Google Scholar] [CrossRef] [PubMed]
- Krewski, D.; Jerrett, M.; Burnett, R.T.; Ma, R.; Hughes, E.; Shi, Y.; Turner, M.C.; Pope, C.A.; Thurston, G.; Calle, E.E.; et al. Extended Follow-Up and Spatial Analysis of the American Cancer Society Study Linking Particulate Air Pollution and Mortality (No. 140); Health Effects Institute: Boston, MA, USA, 2009. [Google Scholar]
- Zanobetti, A.; Franklin, M.; Koutrakis, P.; Schwartz, J. Fine particulate air pollution and its components in association with cause-specific emergency admissions. Environ. Health 2009, 8, 58. [Google Scholar] [CrossRef] [Green Version]
- Zanobetti, A.; Schwartz, J. Mortality displacement in the association of ozone with mortality: An analysis of 48 cities in the United States. Am. J. Respir. Crit. Care Med. 2008, 177, 184–189. [Google Scholar] [CrossRef]
- Orellano, P.; Quaranta, N.; Reynoso, J.; Balbi, B.; Vasquez, J. Effect of outdoor air pollution on asthma exacerbations in children and adults: Systematic review and multilevel meta-analysis. PLoS ONE 2017, 12, e0174050. [Google Scholar] [CrossRef]
- Mar, T.F.; Koenig, J.Q.; Primomo, J. Associations between asthma emergency visits and particulate matter sources, including diesel emissions from stationary generators in Tacoma, Washington. Inhal. Toxicol. 2010, 22, 445–448. [Google Scholar] [CrossRef]
- Ito, K.; Thurston, G.D.; Silverman, R.A. Characterization of PM2.5, gaseous pollutants, and meteorological interactions in the context of time-series health effects models. J. Expo. Sci. Environ. Epidemiol. 2007, 17, S45–S60. [Google Scholar] [CrossRef] [PubMed] [Green Version]
- Peel, J.L.; Tolbert, P.E.; Klein, M.; Metzger, K.B.; Flanders, W.D.; Todd, K.; Mulholland, J.A.; Ryan, P.B.; Frumkin, H. Ambient air pollution and respiratory emergency department visits. Epidemiology 2005, 16, 164–174. [Google Scholar] [CrossRef]
- Zheng, X.Y.; Ding, H.; Jiang, L.N.; Chen, S.W.; Zheng, J.P.; Qiu, M.; Zhou, Y.; Chen, Q.; Guan, W.J. Association between air pollutants and asthma emergency room visits and hospital admissions in time series studies: A systematic review and meta-analysis. PLoS ONE 2015, 10, e0138146. [Google Scholar] [CrossRef]
- Oftedal, B.; Nafstad, P.; Magnus, P.; Bjørkly, S.; Skrondal, A. Traffic related air pollution and acute hospital admission for respiratory diseases in Drammen, Norway 1995–2000. Eur. J. Epidemiol. 2003, 18, 671–676. [Google Scholar] [CrossRef] [PubMed]
- Schwartz, J. Short term fluctuations in air pollution and hospital admissions of the elderly for respiratory disease. Thorax 1995, 50, 531–538. [Google Scholar] [CrossRef] [Green Version]
- Feldhaar, H.; Otti, O. Pollutants and their interaction with diseases of social Hymenoptera. Insects 2020, 11, 153. [Google Scholar] [CrossRef] [PubMed] [Green Version]
- Phanitchat, T.; Ampawong, S.; Yawootti, A.; Denpetkul, T.; Wadmanee, N.; Sompornrattanaphan, M.; Sivakorn, C. Dose-Dependent Blood-Feeding Activity and Ovarian Alterations to PM2. 5 in Aedes aegypti. Insects 2021, 12, 948. [Google Scholar] [CrossRef]
- Paoletti, E.; Schaub, M.; Matyssek, R.; Wieser, G.; Augustaitis, A.; Bastrup-Birk, A.; Bytnerowicz, A.; Günthardt-Goerg, M.; Müller-Starck, G.; Serengil, Y. Advances of air pollution science: From forest decline to multiple-stress effects on forest ecosystem services. Environ. Pollut. 2010, 158, 1986–1989. [Google Scholar] [CrossRef] [PubMed]
- Negrón, J.F.; Cain, B. Mountain pine beetle in Colorado: A story of changing forests. J. For. 2019, 117, 144–151. [Google Scholar] [CrossRef] [Green Version]
- Bentz, B.J.; Régnière, J.; Fettig, C.J.; Hansen, E.M.; Hayes, J.L.; Hicke, J.A.; Kelsey, R.G.; Negrón, J.F.; Seybold, S.J. Climate change and bark beetles of the Western United States and Canada: Direct and indirect effects. BioScience 2010, 60, 602–613. [Google Scholar] [CrossRef]
- Leatherman, D.A.; Aguayo, I.; Mehall, T.M. Mountain Pine Beetle, Insect Series, Trees & Shrubs; Colorado State University Cooperative Extension: Fort Collins, CO, USA, 2007. [Google Scholar]
- US Forest Service. Forest Insect & Disease Leaflet 2; USDA Forest Service, Pacific Northwest Region: Portland, OR, USA, 2009. Available online: https://www.fs.fed.us/rm/pubs_other/rmrs_2009_gibson_k002.pdf (accessed on 15 November 2021).
- Griffin, J.M.; Simard, M.; Turner, M.G. Salvage harvest effects on advance tree regeneration, soil nitrogen, and fuels following mountain pine beetle outbreak in lodgepole pine. For. Ecol. Manag. 2013, 291, 228–239. [Google Scholar] [CrossRef]
- Wyoming State Forestry Division. 2016 Wyoming State Forestry Division Highlights; Wyoming State Forestry Division: Cheyenne, WY, USA, 2016; Available online: https://www.fs.fed.us/foresthealth/docs/fhh/WY_FHH_2016.pdf (accessed on 15 November 2021).
- Shegelski, V.A.; Campbell, E.O.; Thompson, K.M.; Whitehouse, C.M.; Sperling, F.A. Source and spread dynamics of mountain pine beetle in central Alberta, Canada. Can. Entomol. 2021, 153, 314–326. [Google Scholar] [CrossRef]
- US Forest Service. Digital Aerial SketchMapping (DASM) for Invasive Weeds; USDA Forest Service, Remote Sensing Applications Center: Salt Lake City, UT, USA, 2020. Available online: https://studylib.net/doc/10672985/digital-aerial-sketchmapping--dasm--for-invasive-weeds--i (accessed on 15 November 2021).
- Meddens, A.J.; Hicke, J.A.; Ferguson, C.A. Spatiotemporal patterns of observed bark beetle-caused tree mortality in British Columbia and the Western United States. Ecol. Appl. 2012, 22, 1876–1891. [Google Scholar] [CrossRef]
- Loeffler, D.; Anderson, N. Impacts of the mountain pine beetle on sawmill operations, costs, and product values in Montana. For. Prod. J. 2018, 68, 15–24. [Google Scholar] [CrossRef]
- Brown, M.G.; Black, T.A.; Nesic, Z.; Foord, V.N.; Spittlehouse, D.L.; Fredeen, A.L.; Bowler, R.; Grant, N.J.; Burton, P.J.; Trofymow, J.A.; et al. Evapotranspiration and canopy characteristics of two lodgepole pine stands following mountain pine beetle attack. Hydrol. Process. 2014, 28, 3326–3340. [Google Scholar] [CrossRef]
Figure 1.
Western US MPB tree mortality across time. Constructed using the US Forest Service Insect and Disease Survey (IDS) database Digital Aerial Sketch Mapping (DASM) system for MPB. All conifer tree host species included.
Figure 1.
Western US MPB tree mortality across time. Constructed using the US Forest Service Insect and Disease Survey (IDS) database Digital Aerial Sketch Mapping (DASM) system for MPB. All conifer tree host species included.

Figure 2.
PM2.5 mortality health costs (millions of 2019 USD) due to MPB tree deaths in the Western US for 2005, 2007, 2009, and 2011. Areas in white had no measurable MPB tree deaths in the year shown.
Figure 2.
PM2.5 mortality health costs (millions of 2019 USD) due to MPB tree deaths in the Western US for 2005, 2007, 2009, and 2011. Areas in white had no measurable MPB tree deaths in the year shown.

Table 2.
MPB air pollution impacts by year for Western US, 2005–2011.
| PM2.5 | O3 | SO2 | NO2 | CO | ||||||
|---|---|---|---|---|---|---|---|---|---|---|
| Tonnes (t) | t/Lost Tree | Tonnes (t) | t/Lost Tree | Tonnes (t) | t/Lost Tree | Tonnes (t) | t/Lost Tree | Tonnes (t) | t/Lost Tree | |
| 2005 | 14,361 | 0.0009 | 43,457 | 0.003 | 16,476 | 0.001 | 28,257 | 0.002 | 5645 | 0.0005 |
| 2006 | 14,450 | 0.0009 | 49,440 | 0.003 | 17,834 | 0.001 | 28,482 | 0.002 | 7272 | 0.0004 |
| 2007 | 16,374 | 0.0008 | 67,214 | 0.003 | 19,110 | 0.0009 | 34,886 | 0.002 | 6495 | 0.0003 |
| 2008 | 44,592 | 0.0009 | 158,251 | 0.003 | 49,328 | 0.001 | 87,597 | 0.002 | 15,841 | 0.0003 |
| 2009 | 52,507 | 0.0009 | 175,803 | 0.003 | 55,478 | 0.0009 | 105,897 | 0.002 | 20,240 | 0.0003 |
| 2010 | 36,889 | 0.0009 | 119,277 | 0.003 | 38,712 | 0.0009 | 74,112 | 0.002 | 14,164 | 0.0003 |
| 2011 | 30,648 | 0.0009 | 111,125 | 0.003 | 33,885 | 0.0009 | 61,213 | 0.002 | 7202 | 0.0002 |
| Average | 29,974 | 0.0009 | 103,510 | 0.003 | 32,975 | 0.0009 | 60,063 | 0.002 | 10,979 | 0.0003 |
Notes: listed are the total annual air pollution impacts (lost pollutant mass) of MPB-induced tree mortality across all Western US counties, by year. Estimates were obtained from i-Tree Eco using annual MPB tree mortality data from the DASM.
Table 3.
Aggregate MPB mortality and morbidity impacts and costs by pollutant type and year for Western US, 2005–2011.
Table 3.
Aggregate MPB mortality and morbidity impacts and costs by pollutant type and year for Western US, 2005–2011.
| Mortality (All-Cause) | ER Visits (Asthma) | Hospital Admissions (All-Respiratory) | ||||
|---|---|---|---|---|---|---|
| Cases | Costs (Millions $) | Cases | Costs (Millions $) | Cases | Costs (Millions $) | |
| PM2.5 | ||||||
| 2005 | 9.97 | 93.9 | 6.54 | 0.003 | 2.30 | 0.090 |
| 2006 | 11.0 | 104 | 6.96 | 0.003 | 2.15 | 0.084 |
| 2007 | 11.8 | 111 | 10.7 | 0.005 | 2.96 | 0.116 |
| 2008 | 12.9 | 122 | 19.5 | 0.009 | 5.63 | 0.222 |
| 2009 | 15.7 | 147 | 21.0 | 0.010 | 6.07 | 0.238 |
| 2010 | 14.2 | 134 | 19.4 | 0.009 | 5.33 | 0.209 |
| 2011 | 9.92 | 93.4 | 40.4 | 0.019 | 10.5 | 0.410 |
| Average | 12.2 | 115 | 17.8 | 0.008 | 4.99 | 0.196 |
| O3 | ||||||
| 2005 | 0.967 | 9.10 | 0.468 | 0.0002 | 0.481 | 0.019 |
| 2006 | 0.930 | 8.76 | 0.520 | 0.0003 | 0.432 | 0.017 |
| 2007 | 1.57 | 14.8 | 0.901 | 0.0004 | 0.720 | 0.028 |
| 2008 | 3.58 | 33.8 | 1.95 | 0.0009 | 1.51 | 0.059 |
| 2009 | 4.09 | 38.6 | 2.37 | 0.001 | 1.89 | 0.074 |
| 2010 | 3.59 | 33.8 | 2.08 | 0.001 | 1.68 | 0.066 |
| 2011 | 7.44 | 70.1 | 4.75 | 0.002 | 3.61 | 0.142 |
| Average | 3.17 | 29.9 | 1.86 | 0.0008 | 1.47 | 0.058 |
| SO2 | ||||||
| 2005 | 5.15 | 48.6 | 0.386 | 0.0002 | 4.36 | 0.171 |
| 2006 | 4.19 | 39.5 | 0.346 | 0.0002 | 3.53 | 0.139 |
| 2007 | 4.48 | 42.2 | 0.525 | 0.0003 | 4.99 | 0.196 |
| 2008 | 6.87 | 64.7 | 1.25 | 0.0006 | 11.5 | 0.451 |
| 2009 | 8.45 | 79.6 | 1.77 | 0.0009 | 15.6 | 0.612 |
| 2010 | 6.96 | 65.6 | 1.36 | 0.0007 | 12.4 | 0.486 |
| 2011 | 3.09 | 29.2 | 2.94 | 0.001 | 20.5 | 0.805 |
| Average | 5.60 | 52.8 | 1.23 | 0.0006 | 10.4 | 0.409 |
| NO2 | ||||||
| 2005 | 4.96 | 46.7 | 1.42 | 0.0007 | 1.04 | 0.041 |
| 2006 | 6.46 | 60.9 | 1.93 | 0.0009 | 1.06 | 0.042 |
| 2007 | 5.24 | 49.4 | 3.68 | 0.002 | 2.10 | 0.082 |
| 2008 | 6.66 | 62.7 | 6.08 | 0.003 | 3.22 | 0.126 |
| 2009 | 6.94 | 65.4 | 7.11 | 0.003 | 3.95 | 0.155 |
| 2010 | 5.84 | 55.0 | 7.73 | 0.004 | 4.44 | 0.174 |
| 2011 | 5.09 | 48.0 | 18.8 | 0.009 | 10.8 | 0.422 |
| Average | 5.88 | 55.4 | 6.68 | 0.003 | 3.80 | 0.149 |
| CO | ||||||
| 2005 | 0.078 | 0.735 | 0.029 | 0.00001 | 0.153 | 0.006 |
| 2006 | 0.063 | 0.595 | 0.026 | 0.00001 | 0.122 | 0.005 |
| 2007 | 0.076 | 0.715 | 0.032 | 0.00002 | 0.138 | 0.005 |
| 2008 | 0.155 | 1.46 | 0.062 | 0.00003 | 0.266 | 0.010 |
| 2009 | 0.159 | 1.49 | 0.067 | 0.00003 | 0.287 | 0.011 |
| 2010 | 0.119 | 1.13 | 0.052 | 0.00003 | 0.219 | 0.009 |
| 2011 | 0.161 | 1.52 | 0.079 | 0.00004 | 0.287 | 0.011 |
| Average | 0.116 | 1.09 | 0.050 | 0.00002 | 0.210 | 0.008 |
Notes: listed are the total annual mortality and morbidity health impacts and costs of MPB-induced tree mortality across all Western US counties, by year. Estimates were obtained by combining versions of the air pollution estimates in Table 2 with the health impact function in Equation (5). Costs are in millions of 2019 USD.
Publisher’s Note: MDPI stays neutral with regard to jurisdictional claims in published maps and institutional affiliations. |
© 2021 by the author. Licensee MDPI, Basel, Switzerland. This article is an open access article distributed under the terms and conditions of the Creative Commons Attribution (CC BY) license (https://creativecommons.org/licenses/by/4.0/).
Share and Cite
MDPI and ACS Style
Jones, B.A. Mountain Pine Beetle Impacts on Health through Lost Forest Air Pollutant Sinks. Forests 2021, 12, 1785. https://0-doi-org.brum.beds.ac.uk/10.3390/f12121785
AMA Style
Jones BA. Mountain Pine Beetle Impacts on Health through Lost Forest Air Pollutant Sinks. Forests. 2021; 12(12):1785. https://0-doi-org.brum.beds.ac.uk/10.3390/f12121785
Chicago/Turabian StyleJones, Benjamin A. 2021. "Mountain Pine Beetle Impacts on Health through Lost Forest Air Pollutant Sinks" Forests 12, no. 12: 1785. https://0-doi-org.brum.beds.ac.uk/10.3390/f12121785
Note that from the first issue of 2016, this journal uses article numbers instead of page numbers. See further details here.