Article

Carbon Emission and Redistribution among Forest Carbon Pools, and Change in Soil Nutrient Content after Different Severities of Forest Fires in Northeast China

1
CAS Key Laboratory of Forest Ecology and Management, Institute of Applied Ecology, Chinese Academy of Sciences, Shenyang 110016, China
2
College of Resources and Environment, University of Chinese Academy of Sciences, Beijing 100049, China
3
College of Land and Environment, Shenyang Agricultural University, Shenyang 110866, China
*
Author to whom correspondence should be addressed.
Submission received: 28 October 2021 / Revised: 7 January 2022 / Accepted: 10 January 2022 / Published: 13 January 2022
(This article belongs to the Section Natural Hazards and Risk Management)

Abstract

:
Forest fires are a significant factor that affects the boreal forest carbon distribution which emits carbon into the atmosphere and leads to carbon redistribution among carbon pools. However, knowledge about how much carbon was transferred among pools and the immediate changes in soil nutrient contents in areas that were burned by fires of various severities are still limited. In this study, we surveyed eight wildfire sites that are located in northeast China within three months after the fires occurred. Our results indicate that the total soil nitrogen, phosphorus, and organic carbon contents significantly increased after moderate- and high-severity fires. The carbon emissions were 3.84, 5.14, and 12.86 Mg C/ha for low-, moderate-, and high-severity fires, respectively. The amount of carbon transferred among pools increased with fire severity except for the charcoal pool, storing the highest amounts of carbon in moderate-severity fires. Although the charcoal and ash pools accounted for a small proportion of the total ecosystem, they are important for biogeochemical cycles and are worthy of attention. The carbon redistribution information in our study is important for accurately estimating the forest carbon budget and providing crucial parameters for forest carbon cycling models to incorporate the carbon transfer process.

Graphical Abstract

1. Introduction

Boreal forests, one of the largest terrestrial biomes, store 32% of global carbon stocks [1] and play a significant role in global carbon cycles and balance [2,3,4]. Forest carbon is held in six primary pools: standing live trees (SLT), standing dead trees (SDT), coarse woody debris (CWD), shrubs and herbaceous vegetation (S&H), forest floors (litter and duff), and mineral soils [5]. Wildland fire is a crucial factor that influences boreal forest structures and development [2,6], especially under climate change conditions with increases in fire size, frequency, and severity [7,8,9,10]. Wildfires not only emit carbon during combustion but also induce carbon transfers and redistribution among these carbon pools (e.g., shifting from live biomass to dead) [11,12,13]. Depending on the fire severity (i.e., the degree of burning in forest ecosystems) [14], the carbon transfers among carbon pools and emissions could vary widely [15]. These factors could have profound influences on forest carbon cycling. However, to date, the carbon transfer process is seldom incorporated into forest carbon cycling models, which may affect the accurate estimation of forest carbon stocks. Understanding the role of fire on the carbon transfer process and the postfire carbon dynamics of boreal forests are important for accurately estimating regional or global forest carbon stocks [16].
The carbon in a forest ecosystem is stored in various carbon pools. For example, 72% of the organic carbon of northern forests was stored in the soil [17], CWD accounted for almost 50% of the surface fuels in the Alaskan boreal ecoregion [11], forest-floor and S&H carbon accounted for almost 10% and 3% of the total aboveground carbon in mature larch forests in northeast China [18]. Forest fires may alter these carbon distribution patterns by converting carbon among the various carbon pools along with emitting it into the atmosphere, which results in the redistribution of carbon in forest ecosystems. However, the number of reports on postfire carbon redistribution among forest pools was relatively few compared to forest fire carbon emission research [19,20,21,22], which is not our major focus in this study. However, a few researchers have studied the woody dynamics among forest carbon pools in Canada, America, and northeastern China [2,10,13,23] one or two years post-fire. There is a knowledge gap regarding how much carbon is redistributed between the live pools (e.g., SLT or S&H); dead pools (SDT, CWD, litter, or duff); and soil carbon pools immediately after fires of varying severities.
Except for the six forest carbon pools mentioned above, fires also convert portions of fuels into pyrogenic carbon (Pyc) that results from incomplete burning in a limited-oxygen environment [24]. Pyc, which is characterized as charred residues, contains visual charcoal that usually exists on the surface and as aboveground black carbon (BC) [25,26]. Charcoal and black carbon can exist in boreal ecosystems for decades owing to their high resistance to degradation and may even stay in the soil for hundreds of years [27]. Hence, they are significant parts of forest ecosystem carbon pools, whereas they receive less attention when studying carbon cycles [28]. Recently, reports have indicated that the sites that suffered moderate-severity fires over the years had the highest soil BC contents [27,29]. However, how does the soil BC content change immediately after fires of different severities? In general, there is a need to consider the Pyc pool when studying carbon transfers among carbon pools immediately after fires occur.
Apart from the aboveground changes, the soil nutrient contents (e.g., organic C, nitrogen, phosphorus, and potassium) are also affected by wildfires [30,31]. It has been reported that total soil organic C, nitrogen, and phosphorus (TOC, TN, TP) contents decrease several years after fires have occurred [32,33,34]. However, the elapsed time since fire has occurred is an important factor that influences soil properties [10], especially immediately after fires, which bring significant changes to soils [35]. Despite some immediate studies on soil nutrient changes post-fire have been carried out, a large number of them were low-severity prescribed fires or single severity wildfires [35,36,37,38]. Burned areas are heterogeneous landscapes that include varying fire severities [14]. The knowledge regarding the changes in soil nutrient contents that have been burned by fires of various severities in a landscape is still very limited. This information is crucial for planning landscape restoration after fire disturbances. Hence, studying the changes in soil nutrient contents, especially organic C, which is a common indicator of soil quality [39], immediately after fires that are integrated with severity is necessary.
In this study, we conducted field surveys and sampled eight carbon pools, including SLT, SDT, CWD, S&H, forest floor, ash, charcoal (charred material on trees and woody debris), and mineral soil, in the boreal forests of northeast China to (1) evaluate the impacts of different severities of forest fires on the changes in carbon stocks of the various forest carbon pools, (2) assess the changes in postfire soil nutrient contents (e.g., TOC, TN, TP, and BC) for various fire severities compared to their pre-fire conditions, and (3) quantify the carbon transfers among these carbon pools and emissions into the atmosphere under different fire severities.

2. Materials and Methods
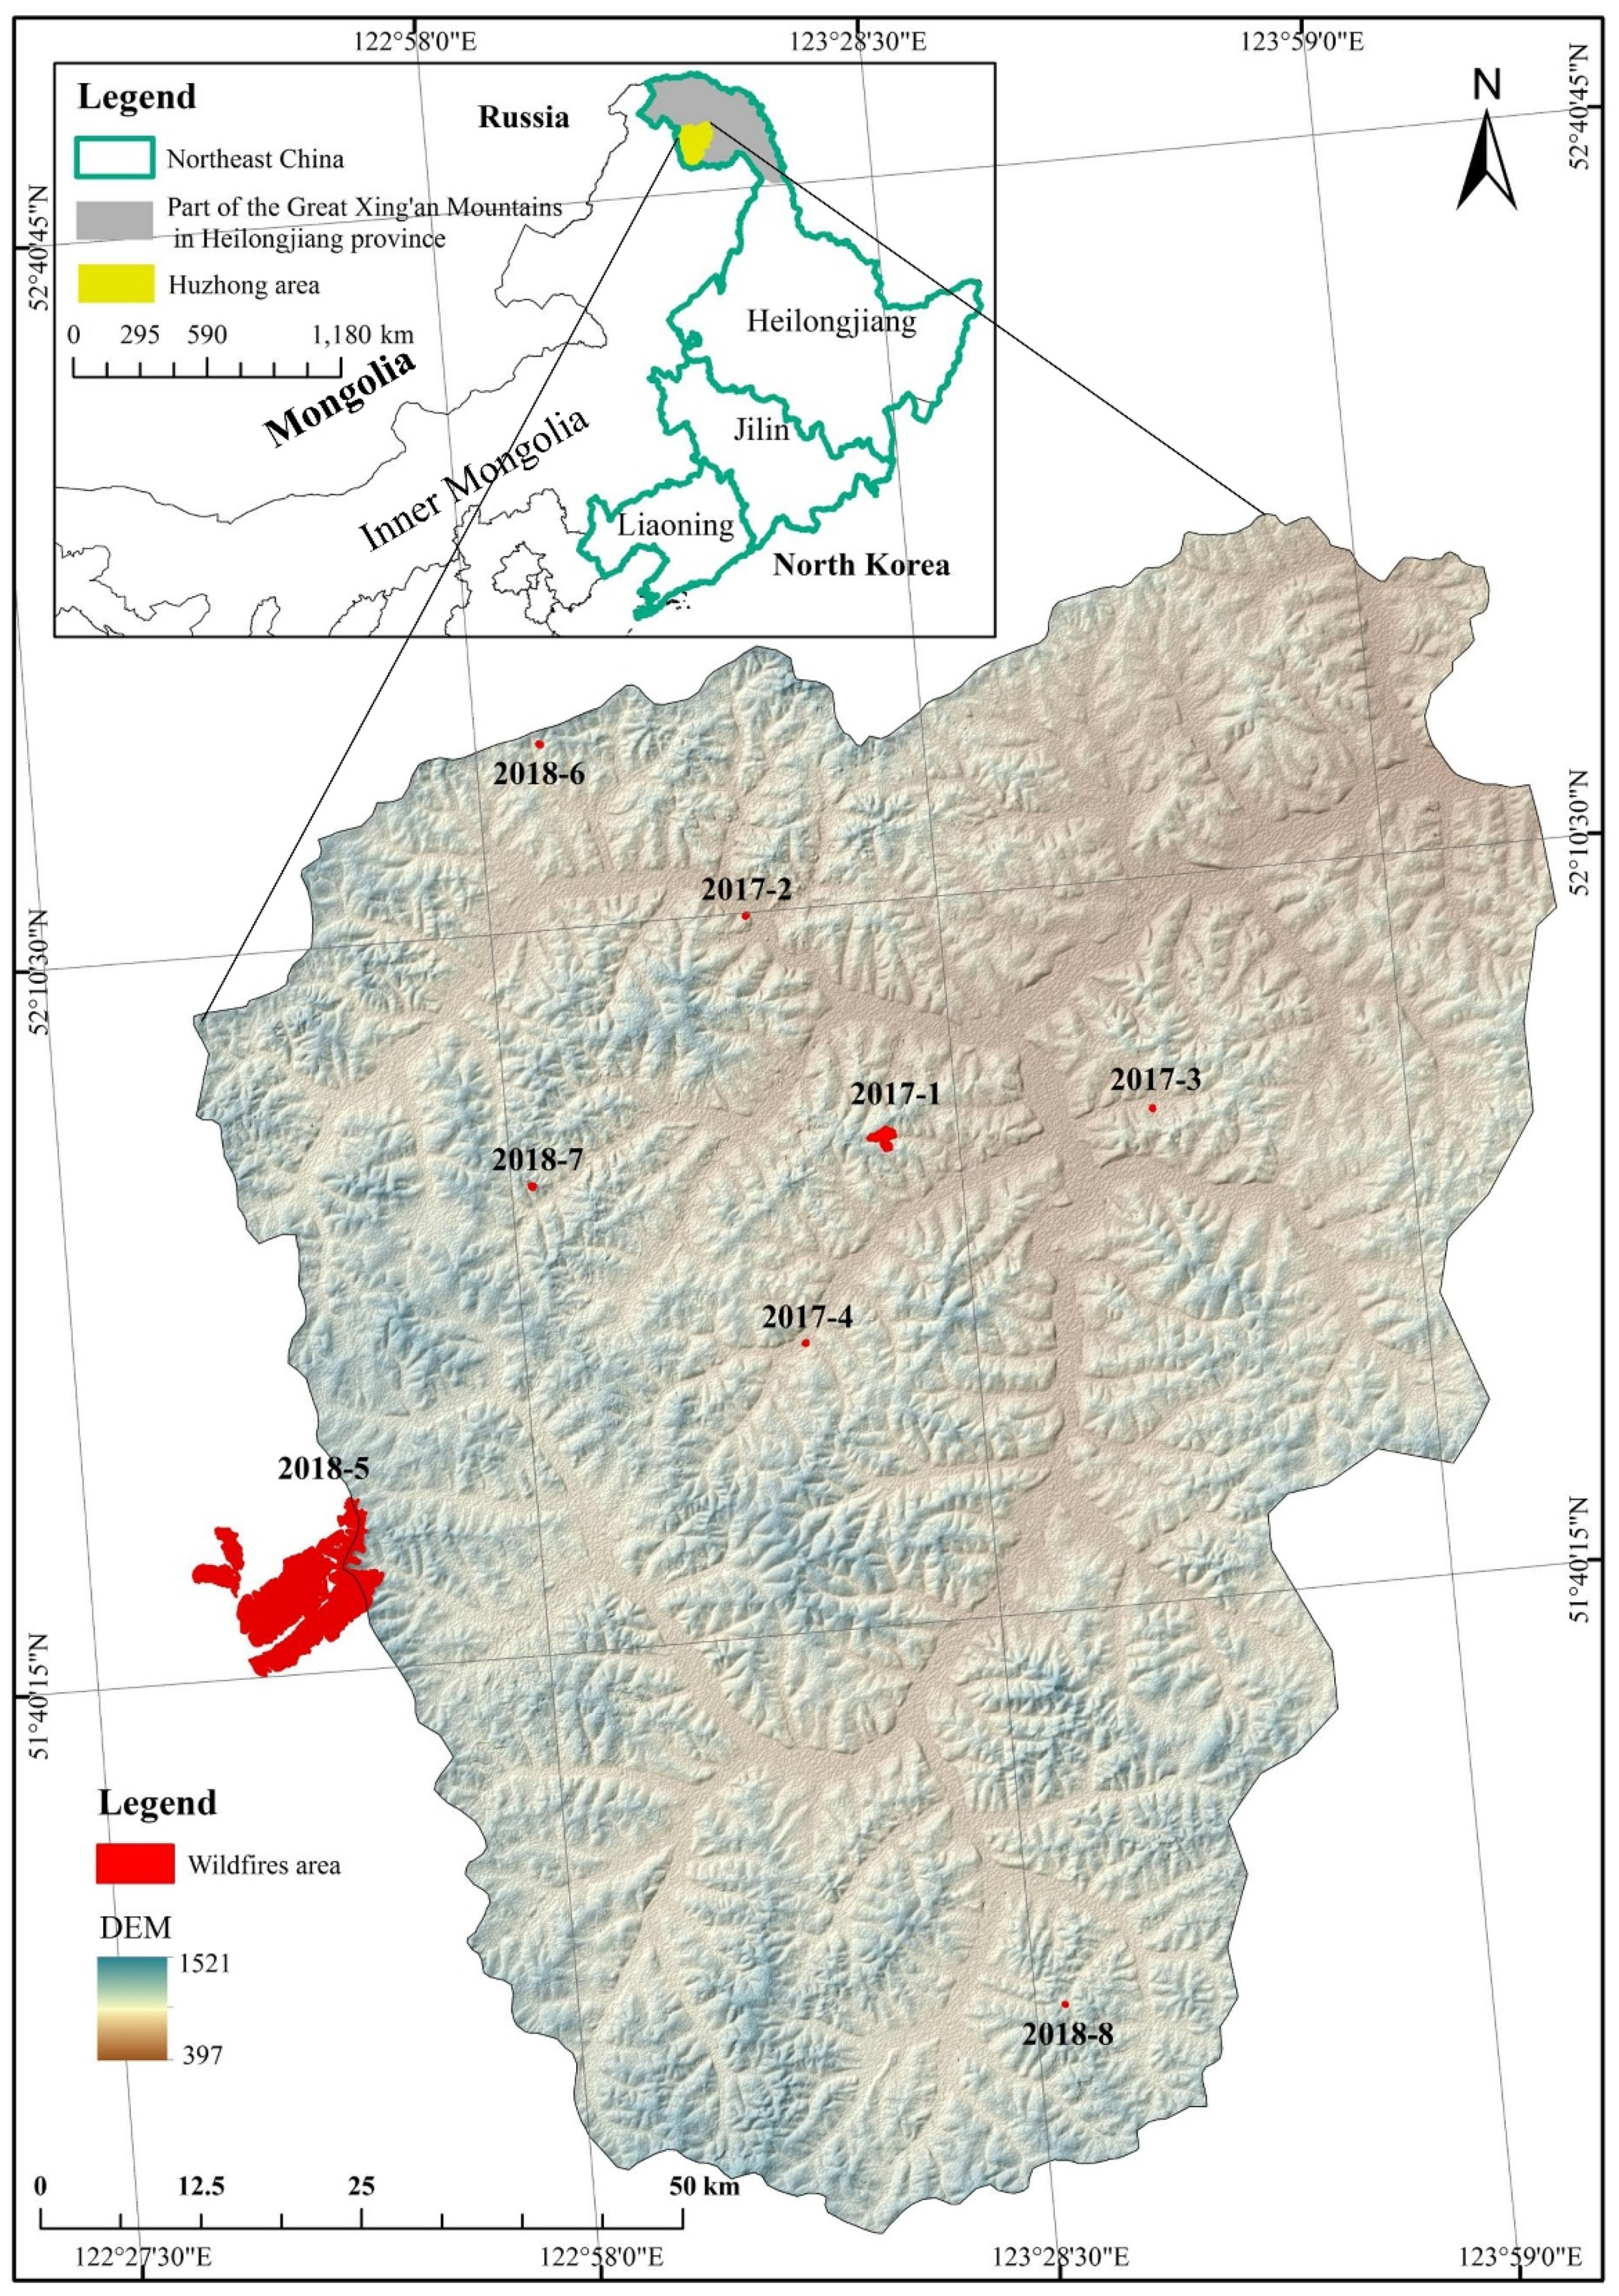
2.1. Study Area

This study was conducted in the Huzhong area, which is a part of the Great Xing’an Mountains, Northeast China, with a total area of 770,199 ha (51°14′40″ to 52°25′00″ N and 122°39′30″ to 124°21′00″ E) (Figure 1). The Great Xing’an Mountains are located on the southern boundary of the eastern Siberian boreal coniferous forest and comprise 30% of the total forest carbon storage of China [40]. The climate is a cold, continental monsoon type that is characterized by long and very cold winters and short and warm summers. The annual mean temperature is −4.3 °C with an average of −35.8 °C for January and 24.5 °C for July, the coldest and hottest months of the year, respectively. The annual precipitation ranges from 350–550 mm and is mainly concentrated in June and August. The terrain is higher in the southwest and lower in the northeast and has a mean altitude of 812 m with an elevation range of 400 to 1500 m. Soils in the study area are mainly brown coniferous forest soil which are characterized by brown or dark brown color, light texture, shallow layers generally with 40 cm, and mixing with a lot of gravel. The slopes are flat and are mostly less than 15° with locally steep sunny slopes of up to 35°. The dominant vegetation in this survey region is Larix forests. The primary tree species of coniferous forest are Dahurian larch (Larix gmelinii Rupr. Kuzen), Scotch pine (Pinus sylvestris var. mongolica Litv.), and Korean spruce (Picea koraiensis Nakai). Major broad-leaved tree species contain White brich (Betula platyphylla Sukaczev, Populus davidiana Dode), and Mongolian poplar (Populus suaveolens Fisch. ex Poit. & A.Vilm.).
Fire is an important natural disturbance in the Huzhong area. It has been reported that 156 fires occurred during 1953–2010 with a total burned area of 38,713 ha [41]. Most fires in Huzhong are characterized by milder ground fires rather than crown fires that mostly happen in North America and western Russia [42] and are mainly caused by lightning, accounting for more than 60% of all fire cases [43]. In 2017–2018, eight fires occurred in the Huzhong area as a result of lightning (Figure 1). We investigated and sampled these eight burn sites within three months (i.e., shortly after the fires occurred) (Table 1). The fire severity of each burned area was determined by calculating the normalized burn ratio index (NBR) and incorporating the thresholds of high severity with NBR < 0.053, moderate severity with 0.053–0.252, and low severity with 0.252–0.585 (details can be seen in [44]).

2.2. Field Measurements

Before sampling, we randomly laid out three 20 × 20 m plots in each burned area and three plots in an unburned area as controls, resulting in 24 burned (Low-12, Moderate-9, and High-3) and 24 control plots. In each plot, the species names, diameters at breast height (DBH), and heights of all standing live and dead trees with DBHs greater than 2.5 cm were measured and recorded. The small- and large-end diameters, lengths, and decomposition stages of the coarse woody debris greater than 7.6 cm in diameter in each plot were also surveyed. Three 2 × 2 m quadrat plots were defined in each 20 × 20 m plot to destructively sample all the tree saplings that were less than 2.5 cm in diameter and the shrubs in each quadrat plot. Similarly, one 1 × 1 m subquadrat plot was defined in each 2 × 2 m quadrat plot to destructively sample the litter with a diameter less than 7.6 cm, duff, and ash. At the same time, the charred materials on the trees and woody debris in the subquadrat plots were all carved by a knife and were reserved in sealed plastic bags. In addition, we collected three repeated soil samples at depths of 0–10 cm in each 1 × 1 m subquadrat plot, mixed these samples, and placed them into cloth bags. We also excavated the soils with a cutting ring to a depth of 10 cm and stored them in aluminum boxes for each 1 × 1 m subquadrat plot.

2.3. Laboratory Analysis

All destructively sampled materials, including the shrubs and tree saplings, additional herbaceous vegetation, litter, duff, ash, and charcoal, were oven-dried at 105 °C for at least 48 h to assess the biomass, and the soils were dried for 12 h to determine the soil bulk densities. Each type of dried material was ground and sieved using a US Standard 60 steel mesh (250 µm) and then combusted in an elemental analyzer (Muhic/N3000) to identify the carbon content of each type. The mineral soils were air-dried and then sieved through a US Standard 100 steel mesh (150 µm) to remove small rocks and fine roots. The sieved mineral soils were used to measure the TOC, TN, TP, and BC contents.
The soil TOC and TN contents were likewise determined by an elemental analyzer (Muhic/N3000). The soil TP contents were assessed by using the Mo-Sb colorimetric method after heating digestion with H2SO4-HClO4 [45]. The soil BC contents were obtained using the chemothermal oxidation method (CTO-375) based on the thermal and chemical stability differences among the black carbon and other forms of soil carbon [29].

2.4. Carbon Stock Calculations

To obtain the biomass of standing live trees (SLT) and standing dead trees (SDT), we used allometric equations to integrate the correlations between tree diameter and biomass for Larix gmelinii [46], Betula platyphylla [47], and Pinus sylvestris var. mongolica [48]. We estimated the biomass of the CWD by multiplying the wood density of the tree species from the same area [49] and the volume from the equation below [50]:
V = π L i ( D S 2 + D L 2 ) / 8000
where V is the volume in cubic meters; D S and D L are the small- and large-end diameters in centimeters, respectively; and L i is the length in meters. Then, the carbon stocks of SLT, SDT, and CWD in the 20 × 20 m plots were calculated from the products of the biomass and carbon contents of the trees, which were 42.43% for Larix gmelinii, 42.01% for Betula platyphylla, and 39.79% for Pinus sylvestris var. mongolica [51].
The biomass of each carbon pool in a 20 × 20 m plot was obtained by multiplying the average biomass in quadrats or subquadrats with plot area. The carbon stock in each kind of fuel was estimated by multiplying the carbon content and biomass that were derived from the above laboratory analyses. The carbon stocks of the S&H and forest floor pools in each plot were obtained by summing the carbon stocks in the shrubs and herbaceous vegetation, litter, and duff, respectively.
The total soil organic carbon stock (TOCS) in a subquadrat was calculated from the product of the average bulk density of the three samples in each subquadrat, the soil TOC content derived from the laboratory analysis, and soil depth. The average soil organic carbon stock in the three subquadrats was used to deduce the TOCS of the plot. In addition, all of the carbon stocks in the various carbon pools were converted to carbon densities based on the plot area (unit: Mg C/ha).

2.5. Carbon Emissions and Redistribution Estimations

Carbon emissions were calculated from the improved equation based on the equation by Seiler and Crutzen [52]:
E c i j = A i × B j × C f i j × E f c
where i is 1, 2, or 3 correspond to low-, moderate-, and high-severity fires; j is 1, 2, 3, 4 or 5 correspond to SLT, SDT, CWD, S&H, Forest floor; E c i j is carbon emissions of each kind of fuel in different severities of fires; A i is the burned area (ha) in different severity fires; B j is carbon storage of each kind of fuels pre-fire (Mg C/ha), including SLT, SDT, CWD, S&H, and Forest floor five types; C f i j is burning efficiency of each kind of fuels under different fire severities which was obtained by our previous study [44]; E f c is the emission factor, and it was 90% when calculating CO2 [53].
Carbon redistribution, except for emissions to the atmosphere, mainly existed among SLT, SDT, and CWD pools. The increase in SDT carbon post-fire was caused by the death of SLT. Hence, the value redistributed from SLT to SDT was calculated from the difference value of SLT carbon between pre-and post-fire. Furthermore, the carbon of CWD generally increased after the fire which mainly resulted from the death of SDT and SLT. However, it was rare for SLT to felling down and convert to CWD during our field investigation. Hence, the increase in CWD was derived from the calculation of the newly fallen SDT.

2.6. Statistical Analyses

Before conducting the statistical analyses, data normality was determined using the Shapiro–Wilk test. The data of fuel strata except for soil all followed the Gaussian distribution. Hence, we applied a paired t-test to the mean pre- and postfire carbon stocks of each carbon pool to determine whether the changes caused by fire were significant. A nonparametric Mann–Whitney U ANOVA test was adopted to determine if any remarkable postfire increases or decreases occurred in the soil organic carbon stocks and soil nutrients, including TOC, TN, TP, and BC, before and after fires with different severities. All of the analyses were carried out with R [54].

3. Results

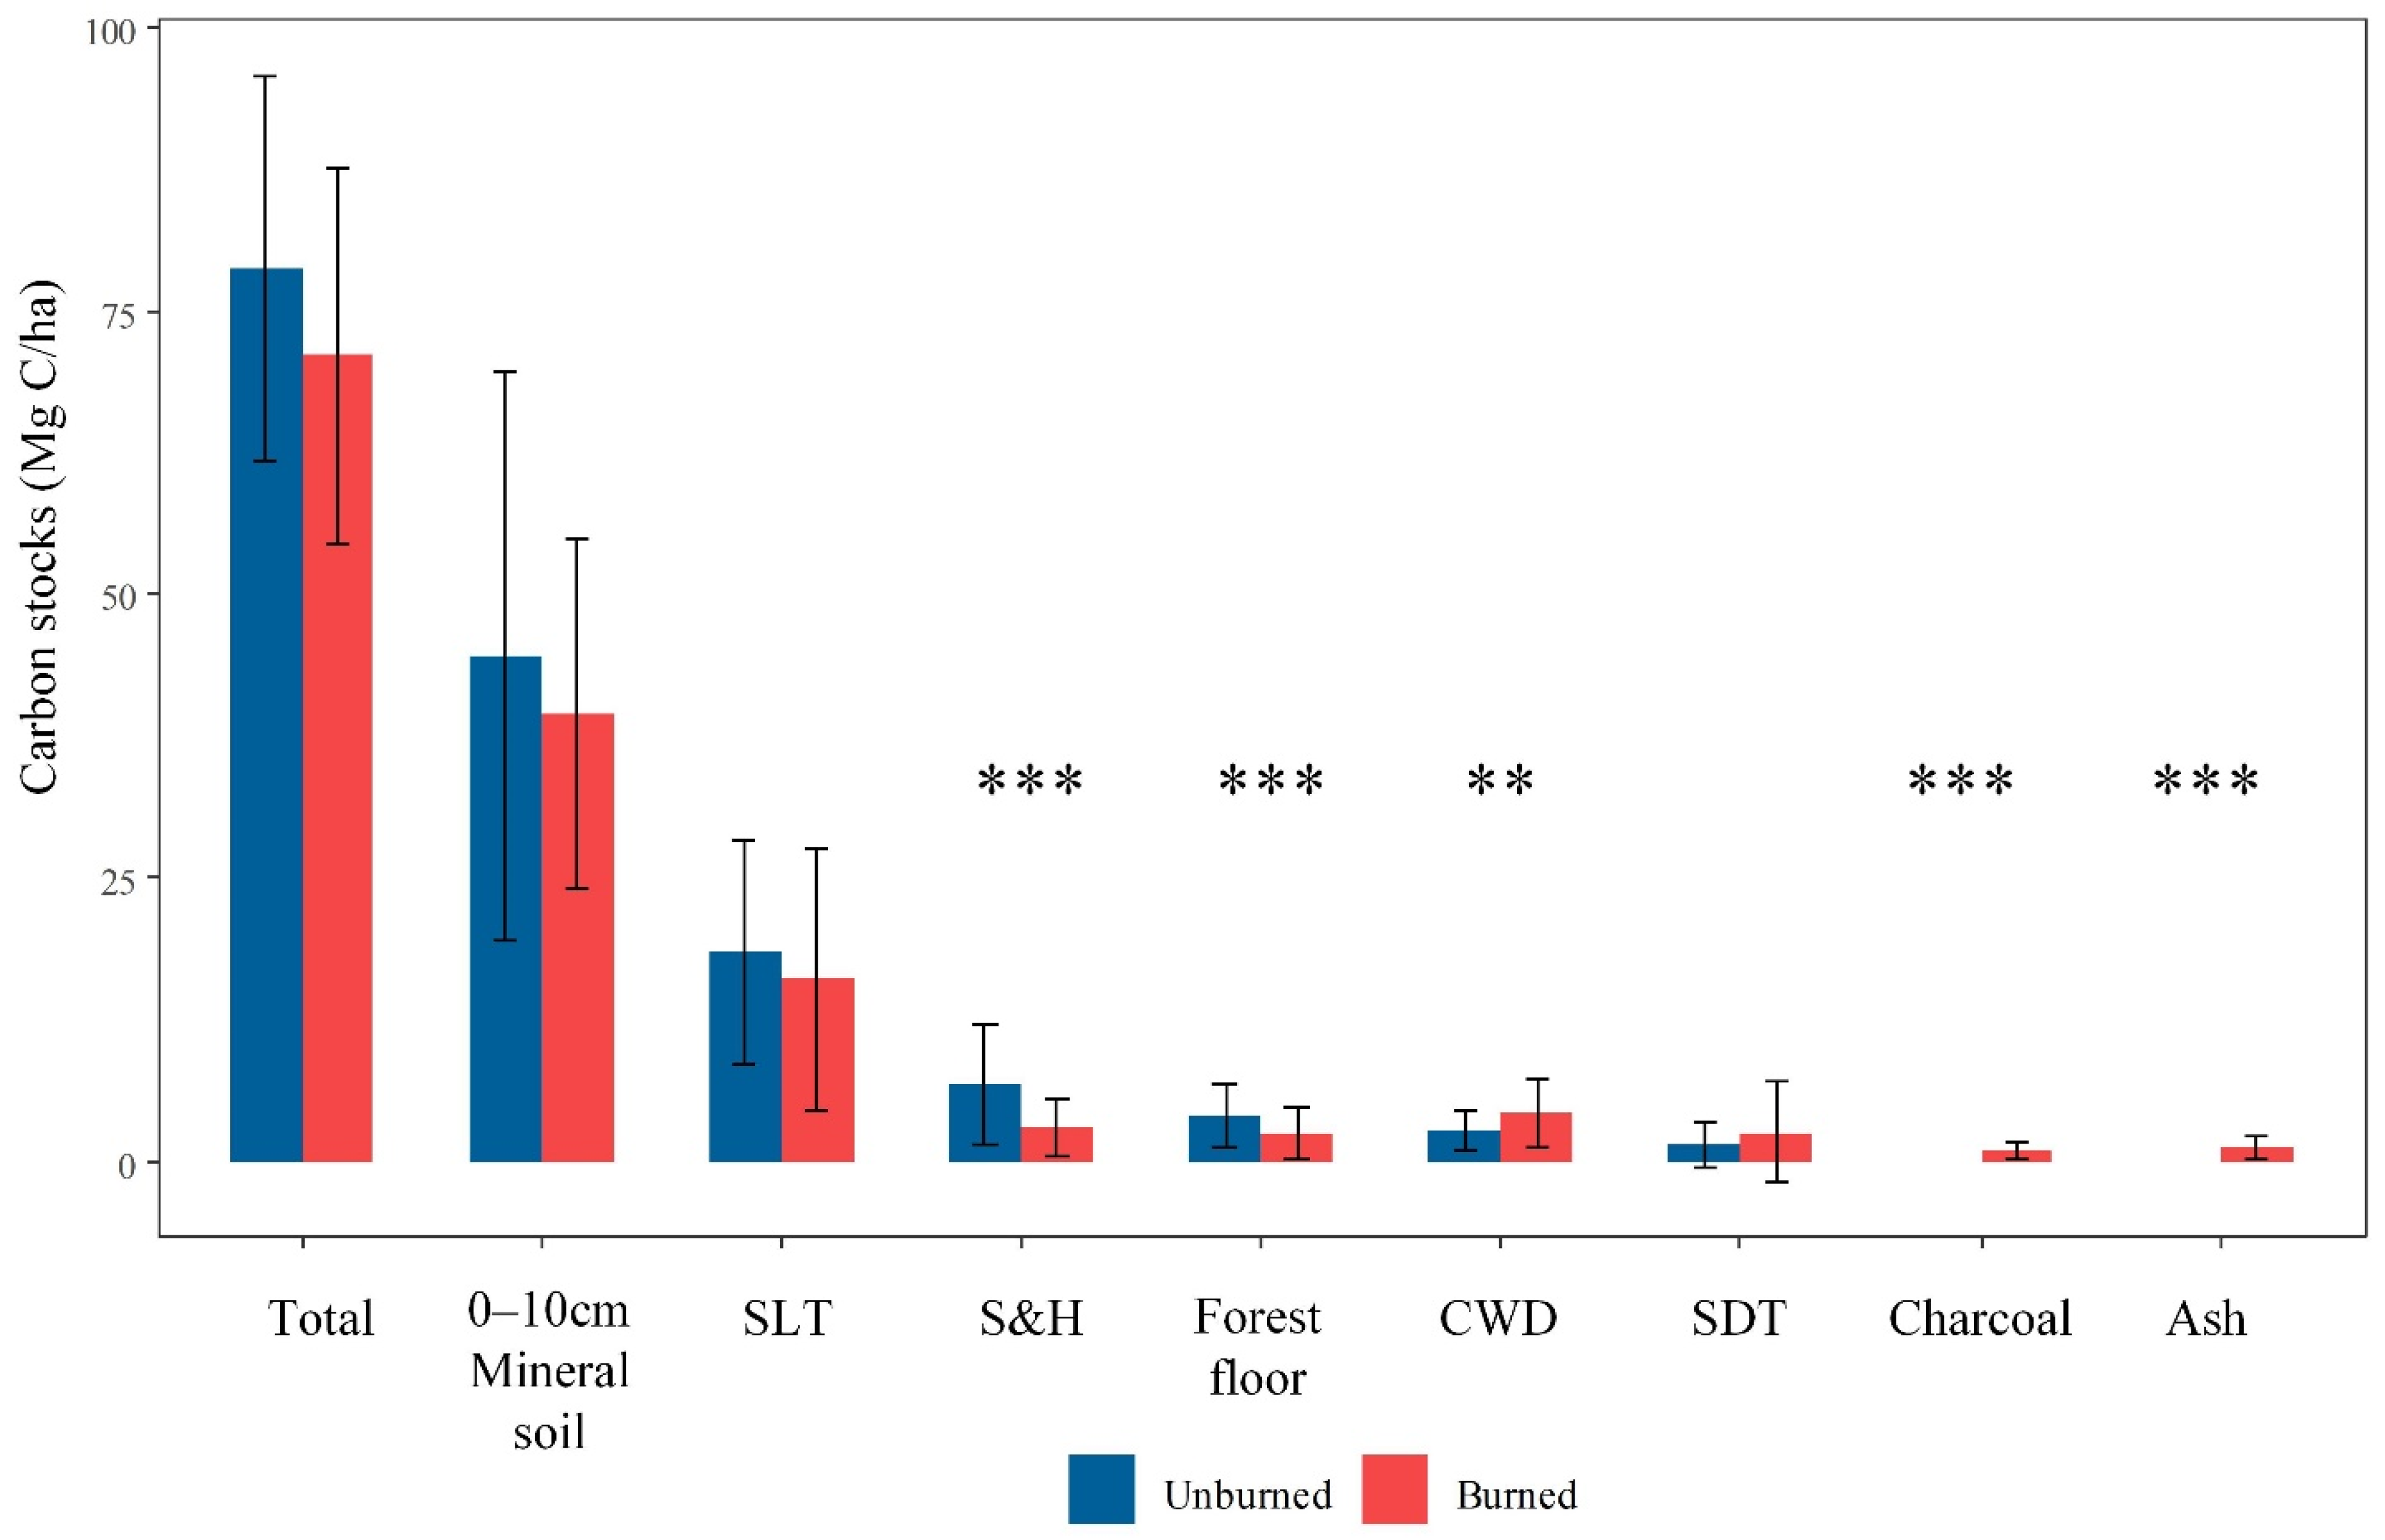
3.1. Carbon Distribution among Various Forest Carbon Pools in Unburned and Burned Plots

We measured carbon in various pools including SLT, SDT, S&H, Forest floor, and soil in both unburned and burned plots. Moreover, charcoal and ash pools’ carbon were calculated in the burned plots. In the unburned plots, the organic carbon in the 0–10 cm soil layer was 44.56 Mg C/ha, which accounted for 57% of the total ecosystem carbon with 78.67 Mg C/ha (Figure 2). Among the aboveground carbon pools, the carbon amount of the SLT was the highest, with 18.51 Mg C/ha, which represented 23% of the total ecosystem carbon. The carbon amounts in the S&H and forest floor pools were 6.95 and 4.18 Mg C/ha, respectively. The amounts of carbon stored in the CWD and SDT pools were relatively small, at 2.87 and 1.60 Mg C/ha, respectively.
In the burned forest plots, the total ecosystem carbon decreased to 70.97 Mg C/ha after burning, with carbon losses of 7.7 Mg C/ha (Figure 2). Among the various pools, the amount of carbon in 0–10 cm mineral soil, SLT, S&H, and forest floor decreased, whereas it increased in the CWD, SDT, charcoal, and ash pools. The carbon amount decreased significantly in the S&H (p = 0.003) and forest floor pools (p = 0.01) and increased in the CWD (p = 0.025), charcoal (p < 0.01), and ash pools (p < 0.01) compared to their respective unburned plots. The charcoal and ash pools stored 1.14 and 1.35 Mg C/ha, respectively. In addition, the standard deviation in the 0–10 cm mineral soil pool was relatively large, which indicated spatial variations in the soil carbon amounts. In general, there is no significant change in total C stocks in the system before and after fires, but that in forest carbon pools, there are significant changes, e.g., S&H, forest floor, etc.

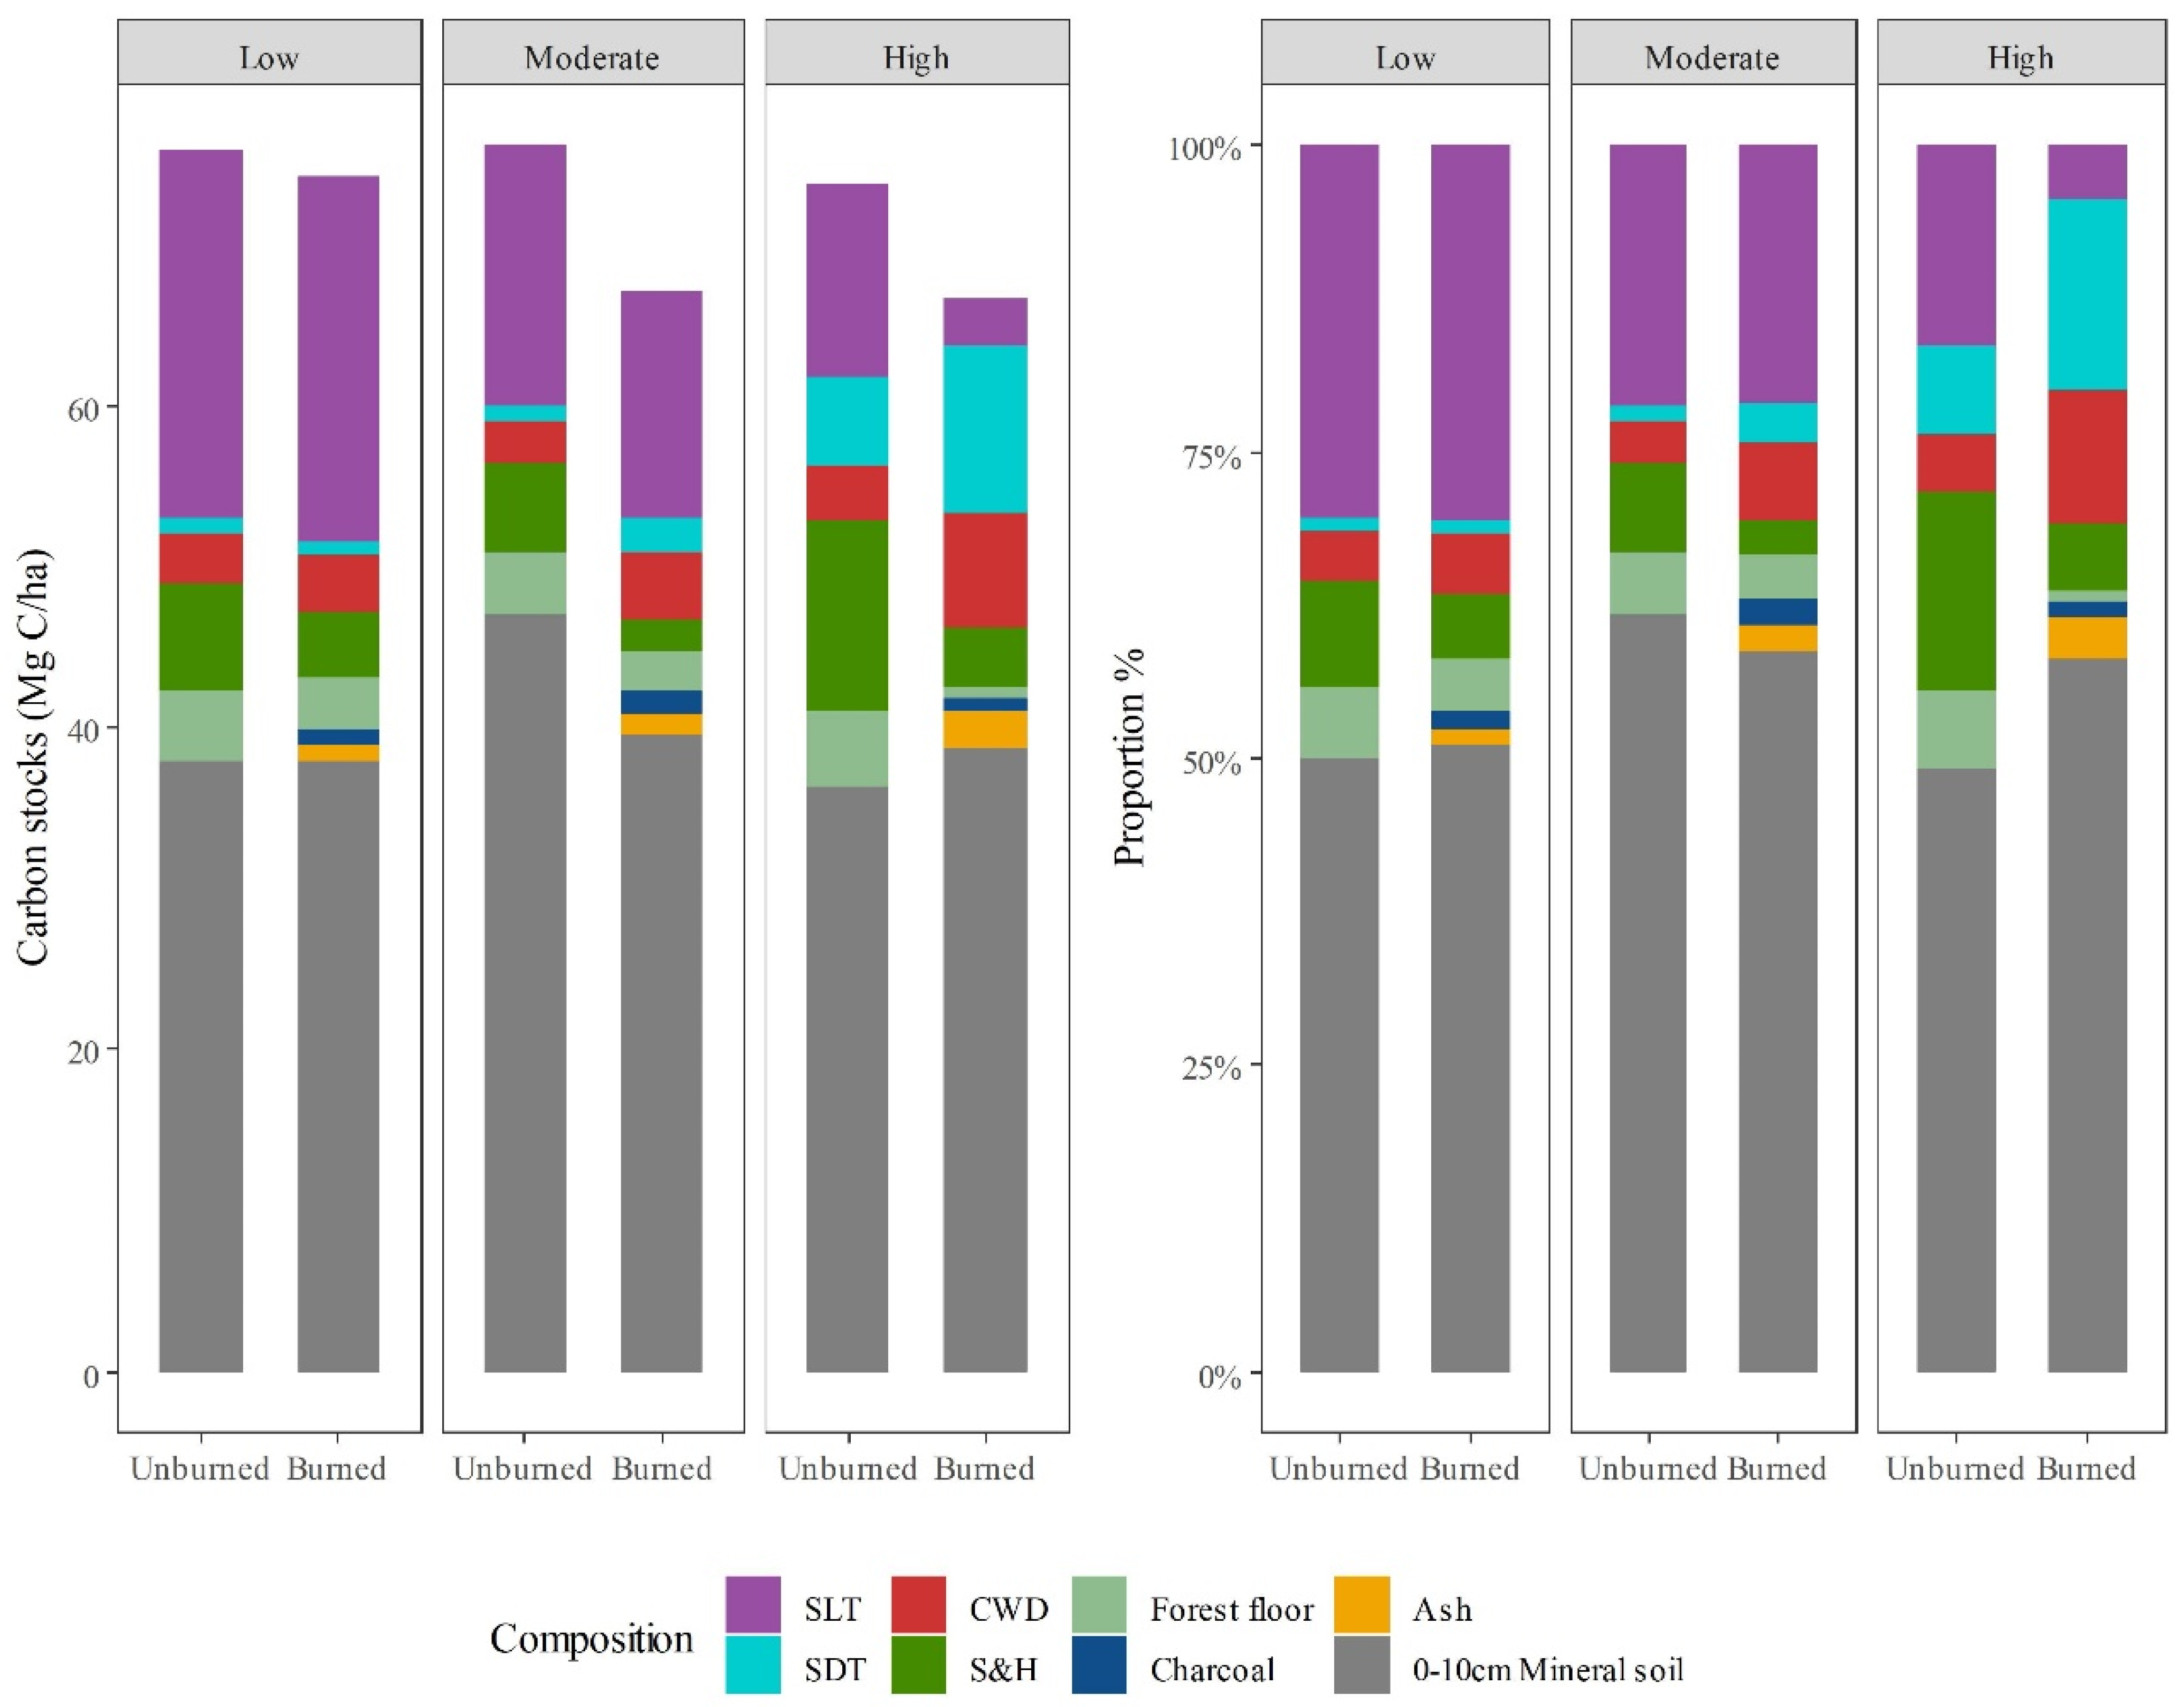
3.2. The Impacts of Fire Severity on the Carbon Distribution among Various Forest Carbon Pools

The fire severity had profound impacts on the carbon redistribution among various carbon pools. High-severity fires resulted in a greater carbon decrease in SLT, but an increase in carbon in SDT and CWD (Figure 3). The amounts of carbon that were stored in the SDT, CWD, and ash pools increased with increasing fire severity, which was exactly opposite to those of the S&H, and the forest floor pools decreased along with a severe loss of the highest carbon under high-severity fires. The forests that experienced high-severity fires had the highest carbon stocks of SDT before the fire. The charcoal pool, unlike the others, contained the highest carbon amounts in the moderate-severity fires. In addition, mineral soil was the biggest carbon pool in the ecosystem and stored the highest amounts of carbon compared to other pools regardless of the level of fire severity.

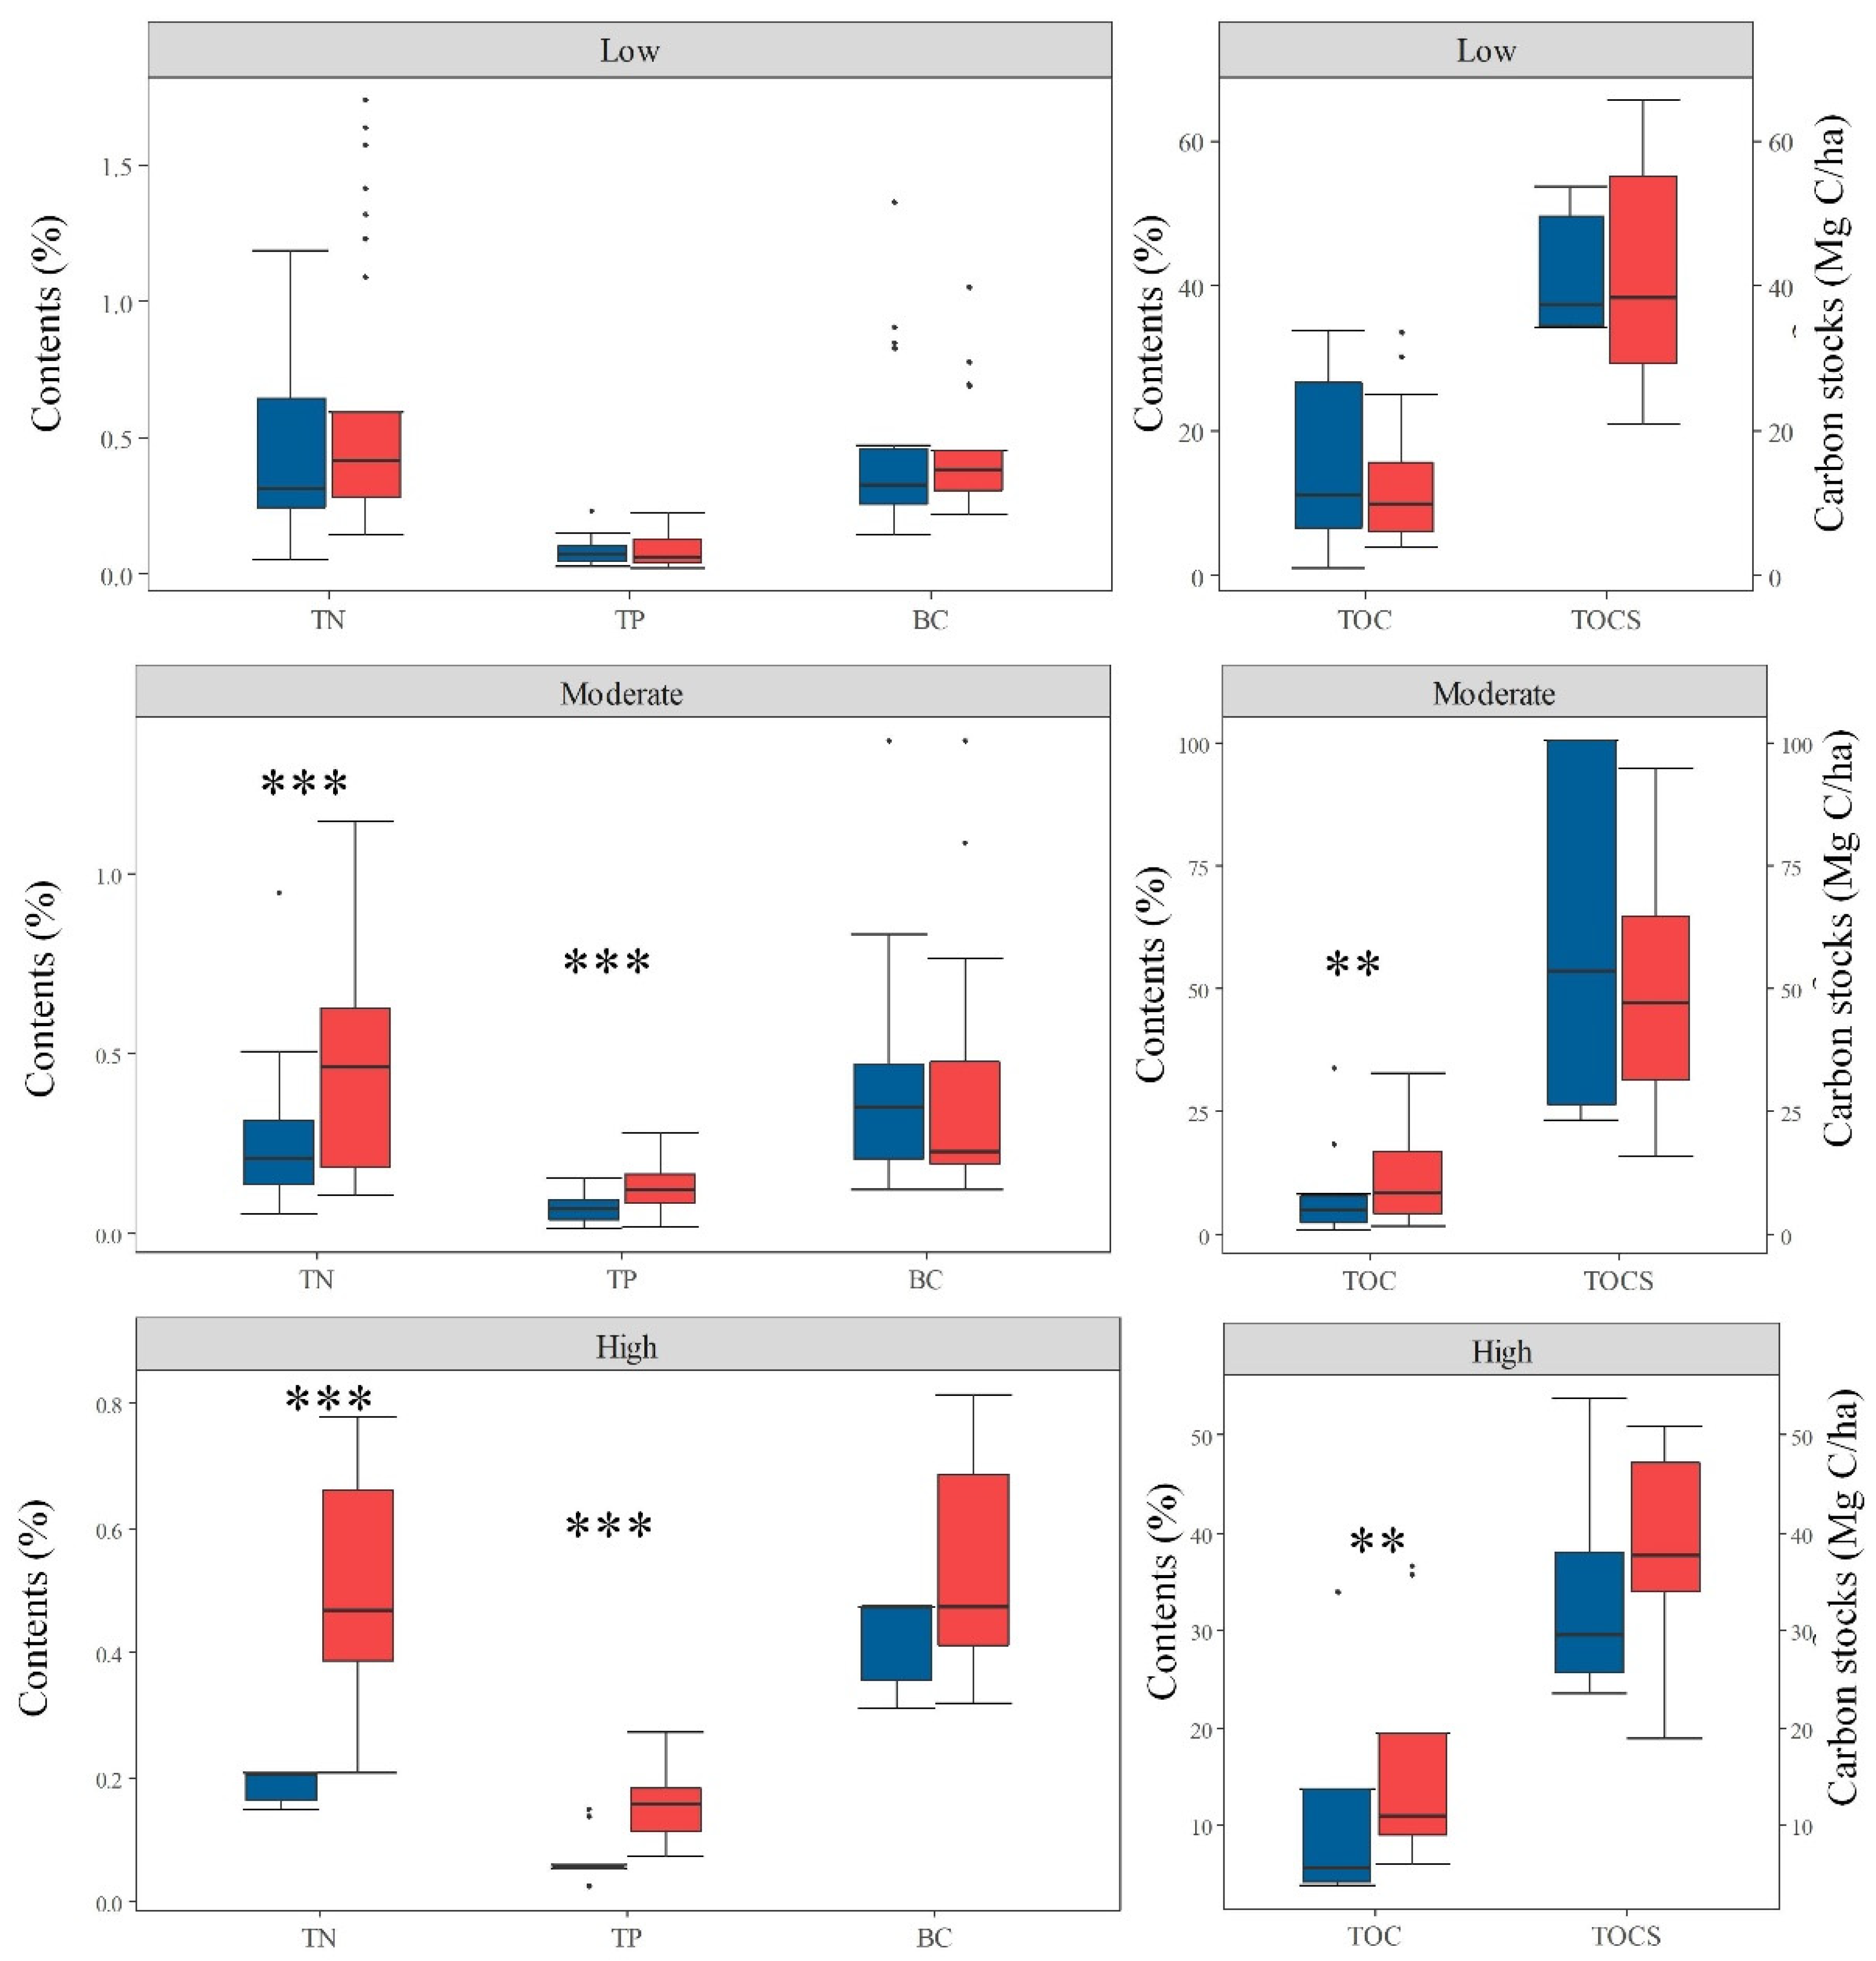
3.3. Changes in Soil Nutrient and BC Contents and TOCS Shortly after Low-, Moderate-, and High-Severity Fires

The TN, TP, BC, and TOC contents in the unburned plots ranged from 0.19–0.46%, 0.07–0.08%, 0.41–0.44%, and 8.52–14.82%, respectively, in the soil at a depth of 0–10 cm (Figure 4). There were no significant differences in the TN, TP, TOC contents, and TOCS between the unburned plots and those burned by low-severity fires (p > 0.05). Both moderate- and high-severity fires significantly increased the TN (p < 0.01), TP (p < 0.01), and TOC contents (p < 0.05). There was no clear effect of fire severity on TOCS. Although high-severity fires led to a decrease in TOCS (58.00 to 47.43 Mg C/ha) whilst moderate-severity fires increased TOCS from 34.04 to 38.19 Mg C/ha, this was all found to be insignificant (p > 0.05). At the same time, there were no remarkable changes in the soil BC contents between the unburned plots and those that burned regardless of the fire severity level.

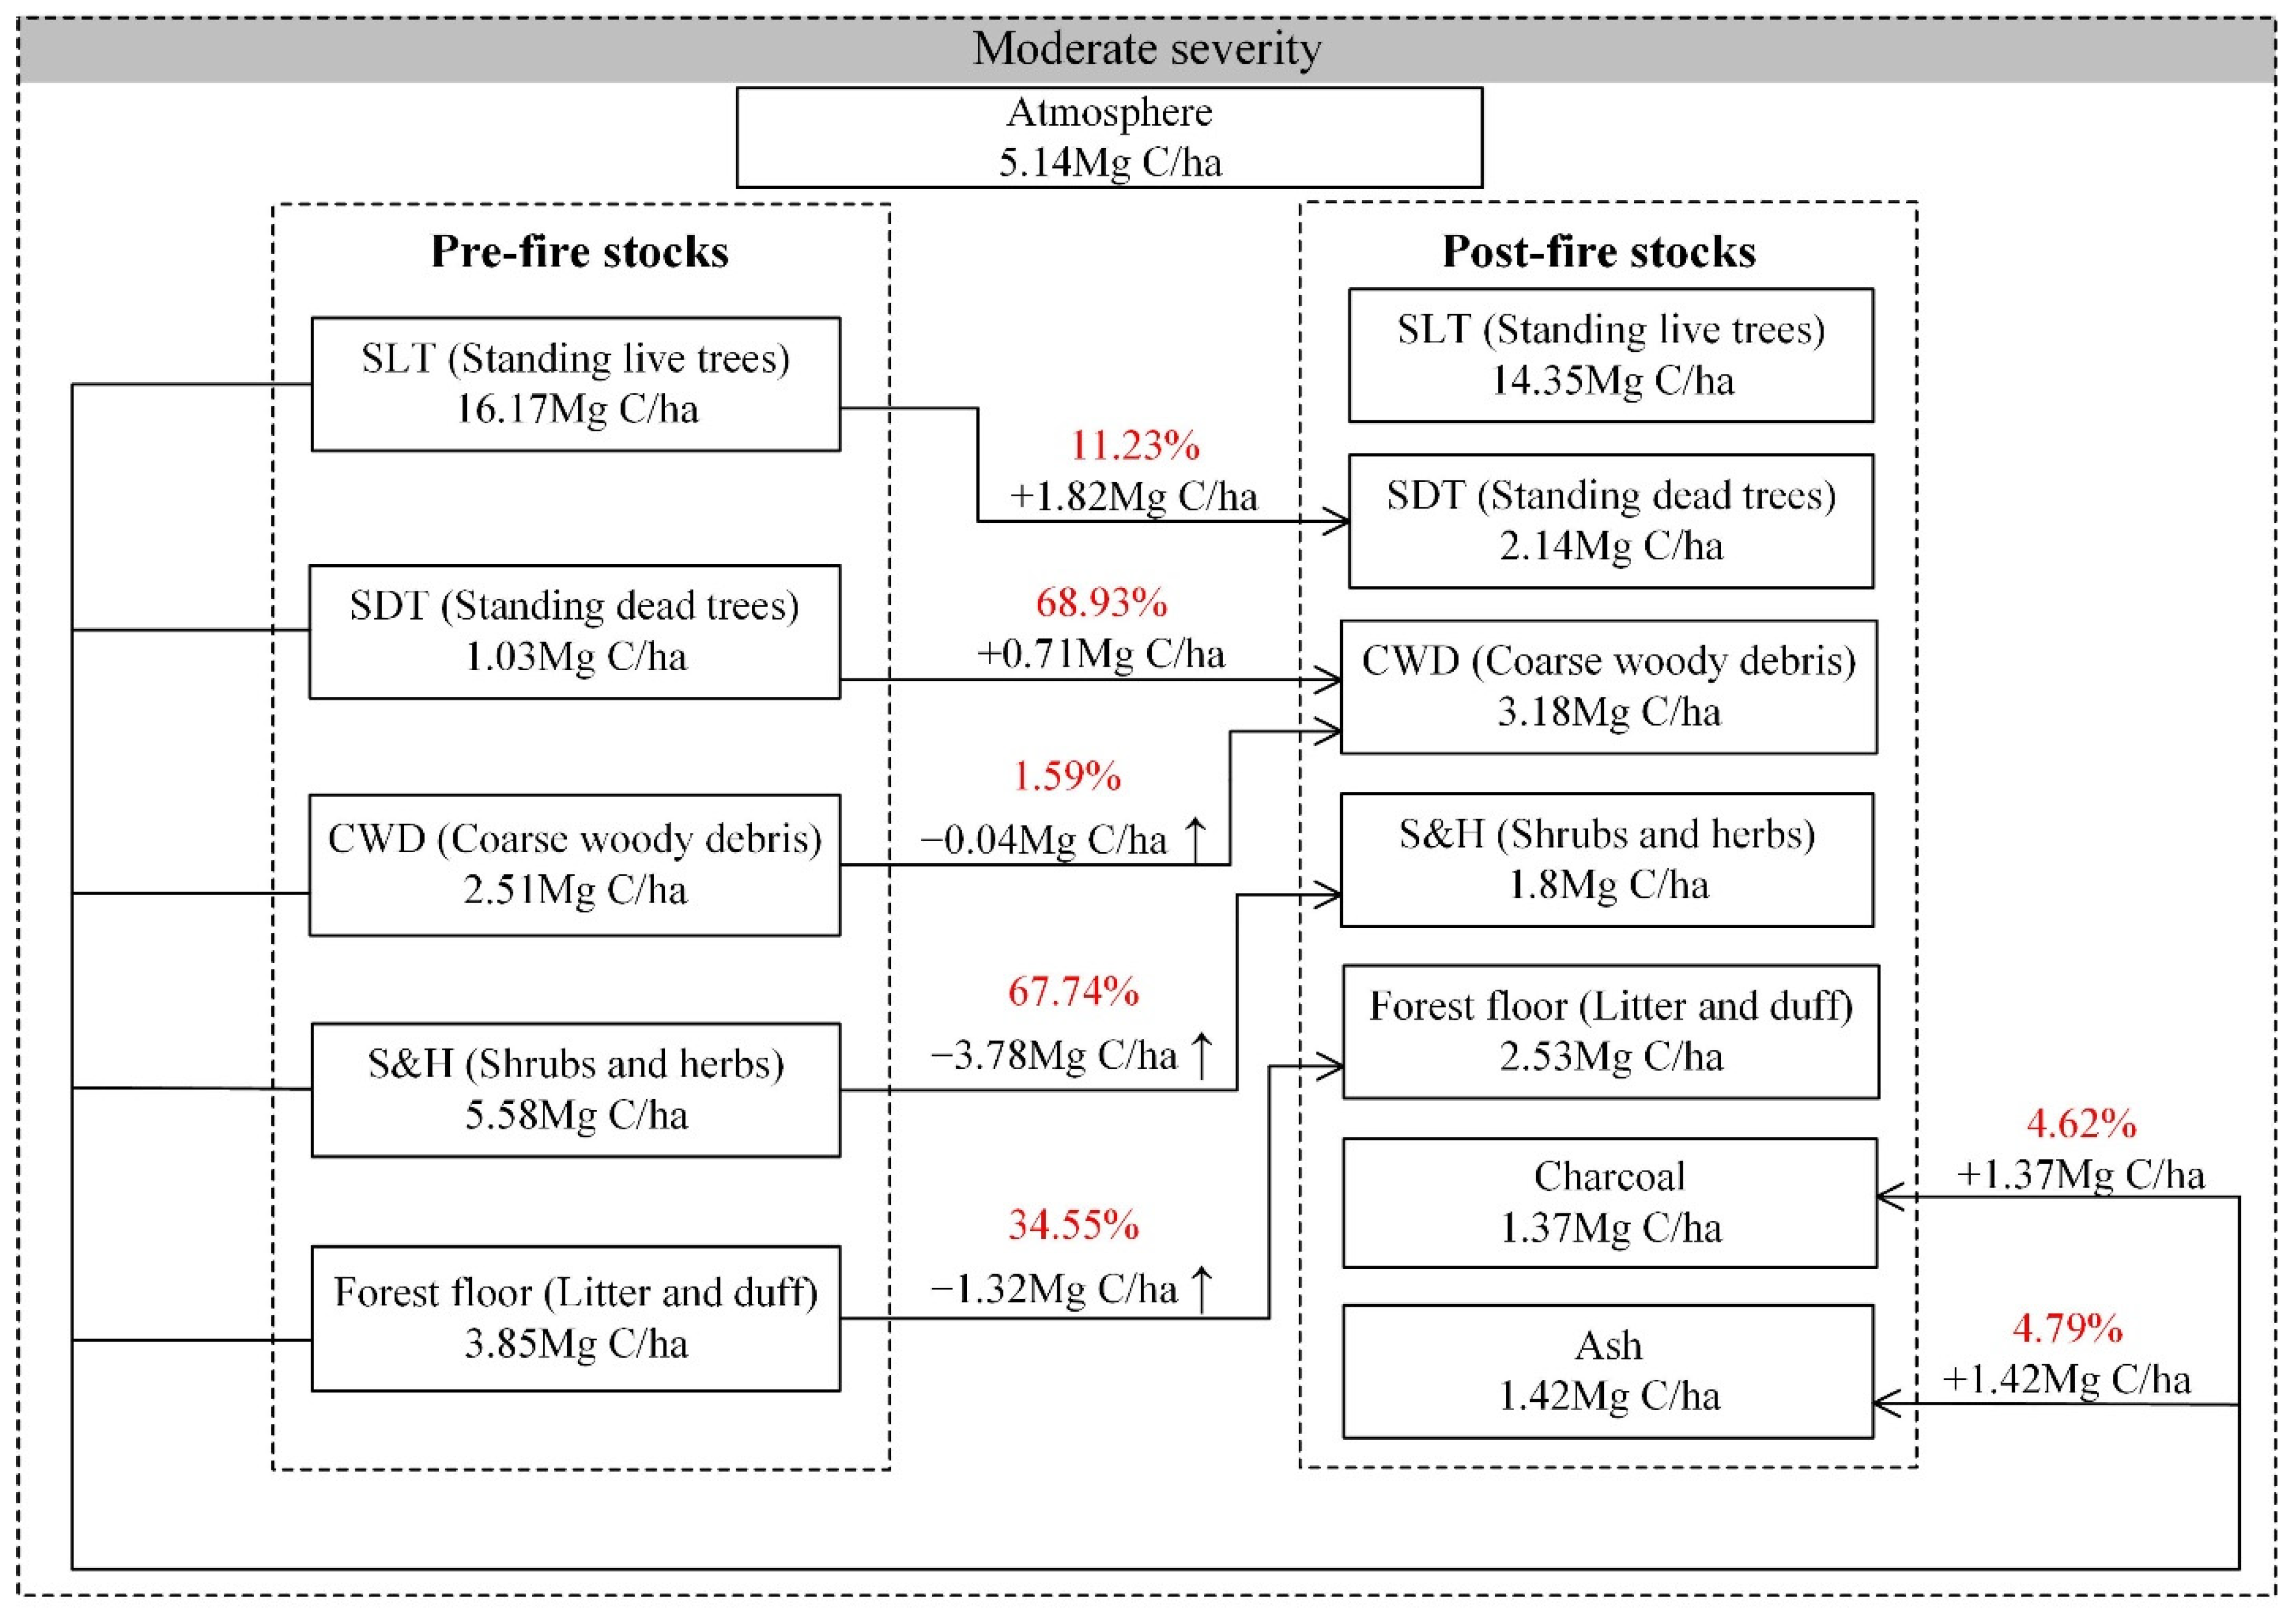
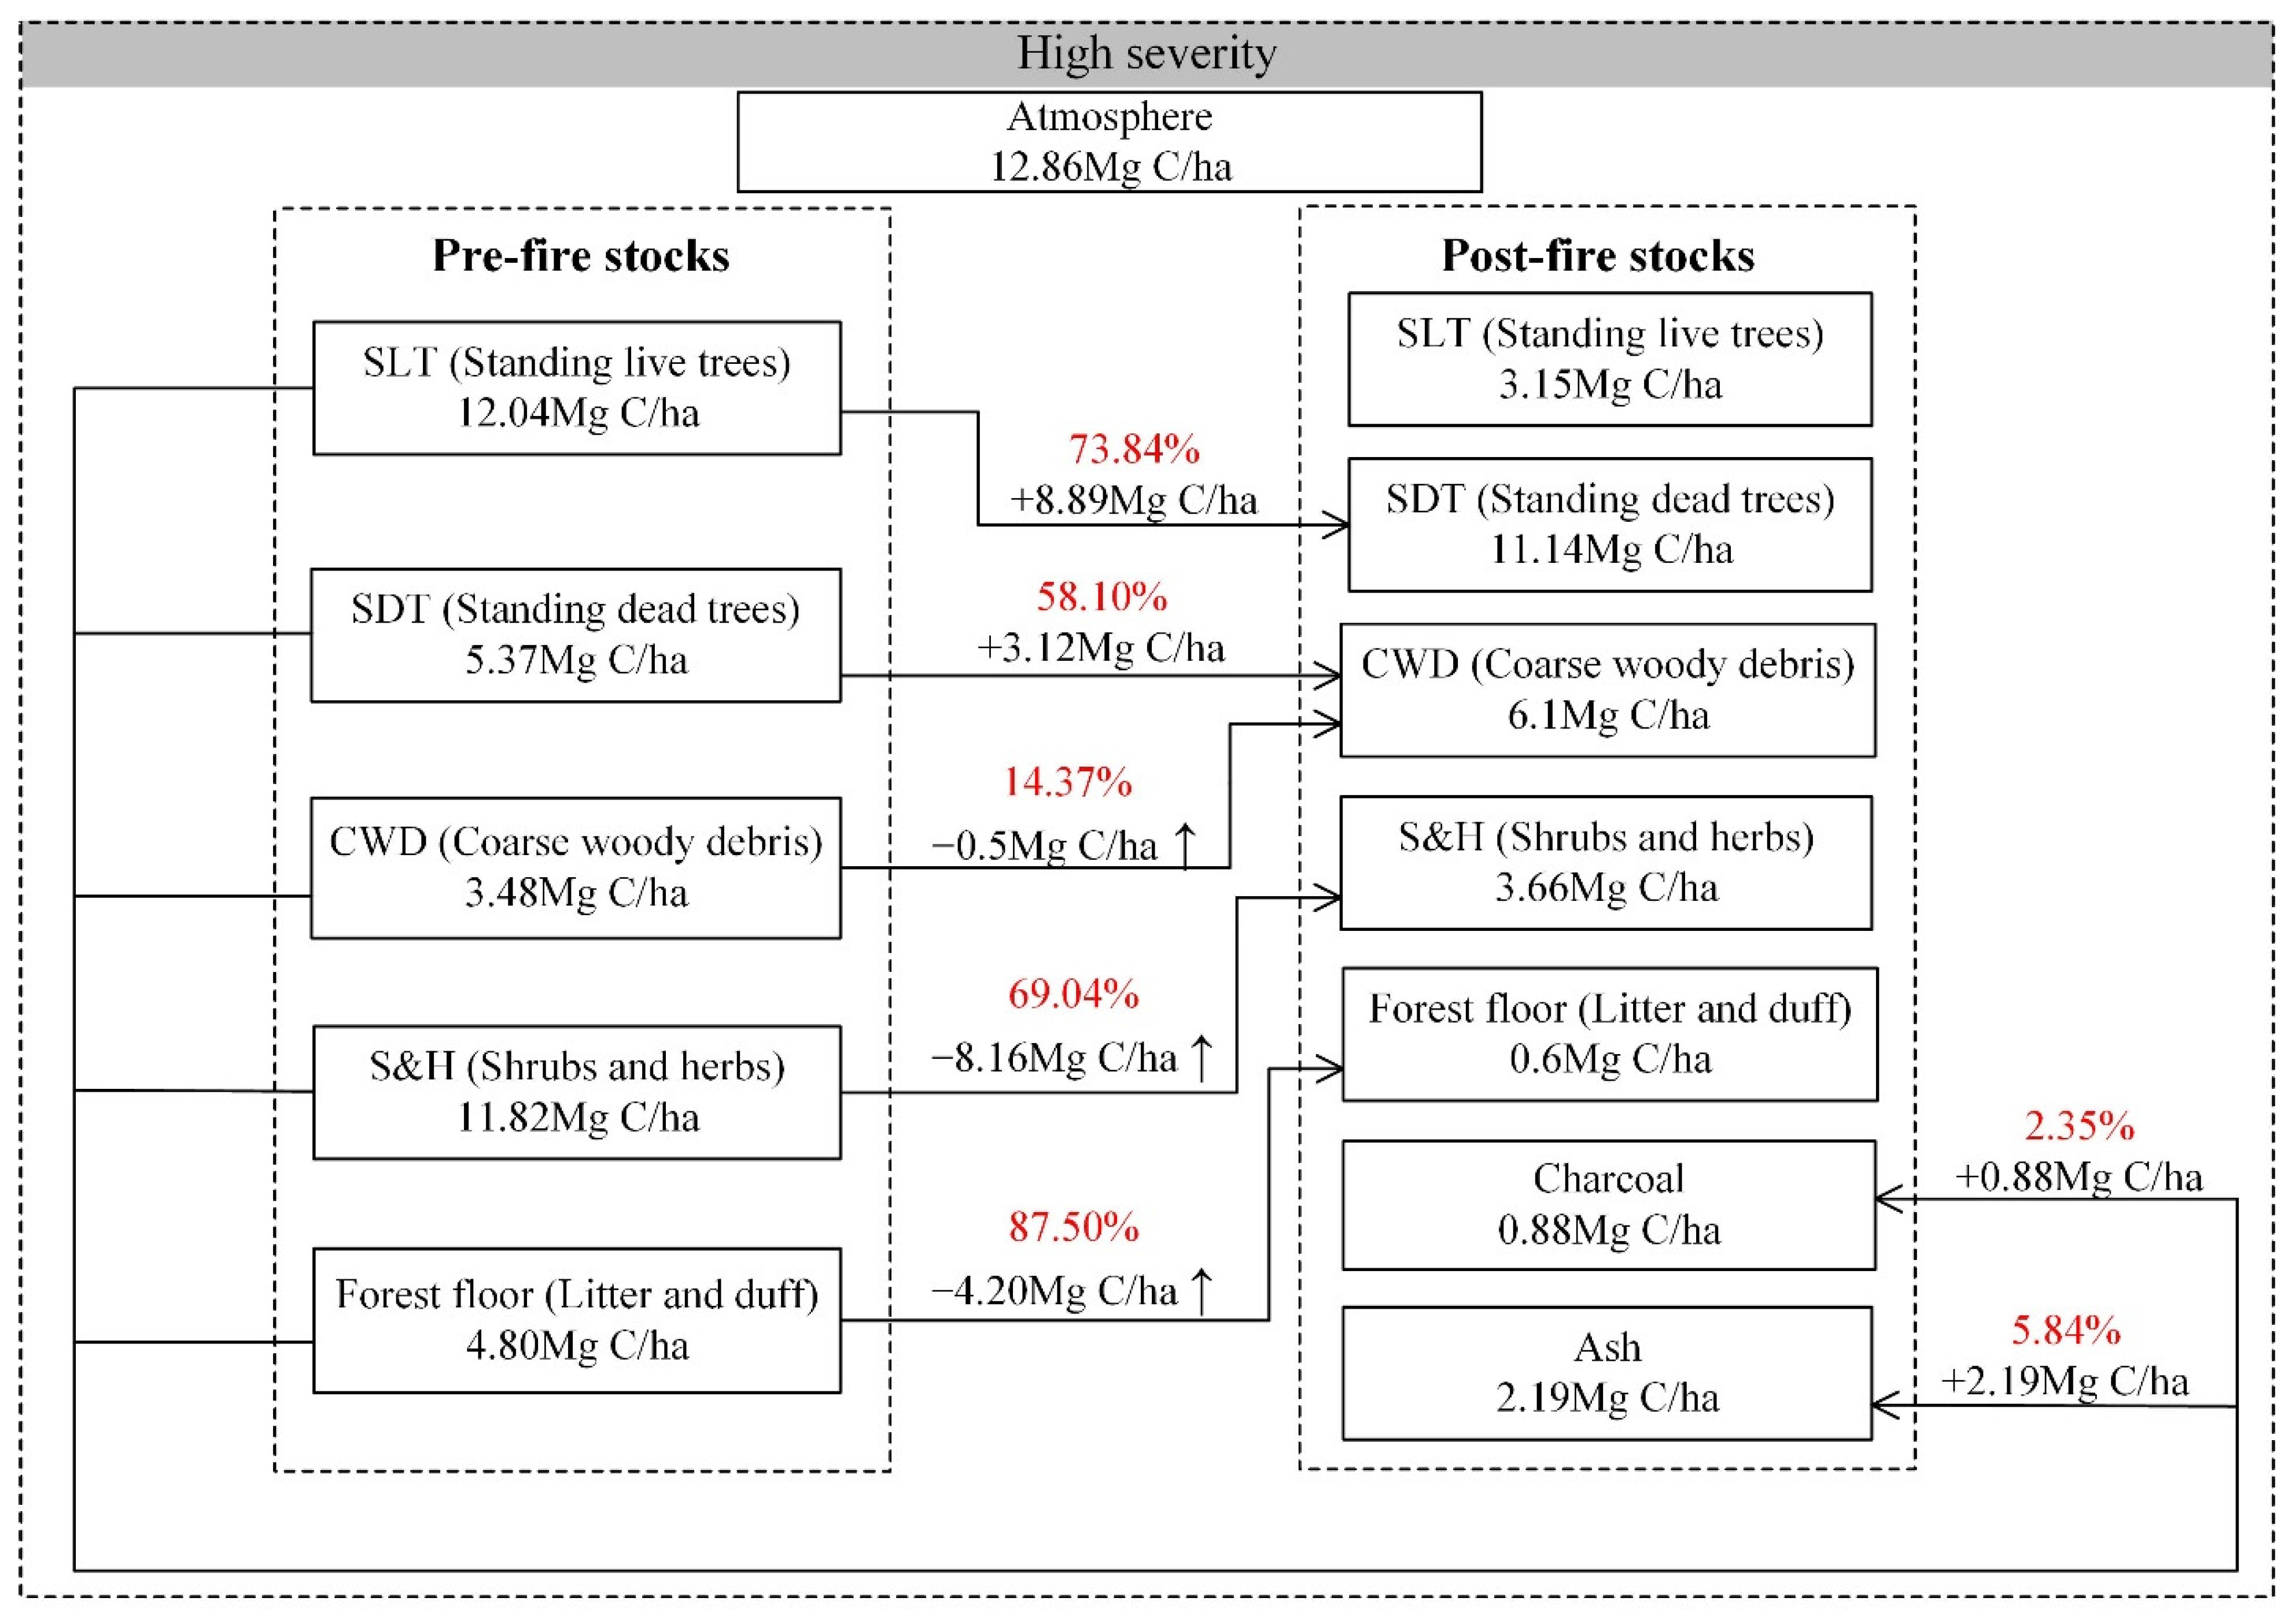
3.4. Carbon Transfers among the Aboveground Carbon Pools and Emissions under Low-, Moderate-, and High-Severity Fires

In addition to the carbon emissions, the forest fires caused carbon transfers among the various carbon pools. In general, the transfer processes included the SLT to SDT and the SDT to CWD pools, and all aboveground carbon pools led to charcoal and ash. The carbon emissions were due to the combustion of the CWD, S&H, and forest floor pools during the fires (Figure 5, Figure 6 and Figure 7).
However, the carbon transfers and emissions were greatly affected by different fire severities. The amount of carbon that was transferred from the SLT pool to the SDT pool increased with fire severity, with 0.33, 1.82, and 8.89 Mg C/ha for low-, moderate-, and high-severity fires, respectively, which accounted for 1.44%, 11.23%, and 73.84% of the prefire SLT carbon stocks (Figure 5, Figure 6 and Figure 7). The amount of carbon that was transferred from the SDT to CWD was the highest under high-severity fires at 3.12 Mg C/ha (Figure 7). The carbon emissions were 3.84, 5.14, and 12.86 Mg C/ha for low-, moderate-, and high-severity fires, respectively (Figure 5, Figure 6 and Figure 7). Most of the carbon emissions were attributed to the combustion of S&H, with 2.70, 3.78, and 8.16 Mg C/ha for low-, moderate-, and high-severity fires, respectively, which were followed by combustion of the forest floor, with 1.11, 1.32, and 4.20 Mg C/ha for low-, moderate-, and high-severity fires, respectively (Figure 5, Figure 6 and Figure 7). The ash carbon stocks increased with fire severity, with 1.00, 1.42, and 2.19 Mg C/ha, which accounted for 2.64%, 4.79%, and 5.84% of the prefire total aboveground carbon stocks, respectively (Figure 5, Figure 6 and Figure 7). The charcoal pool, unlike the ash, had the highest carbon stocks under moderate-severity fires, with 1.37 Mg C/ha, which represented 4.62% of the total prefire aboveground carbon stocks (Figure 6).

4. Discussion

4.1. Carbon Distribution in Various Carbon Pools and Redistribution Following Low-, Moderate-, and High-Severity Fires

The carbon present in forest ecosystems is distributed in various carbon pools. The distribution is affected by the age structures of stands, forest types, climates, and disturbance regimes [55,56,57]. Our results indicated that over 50% of all carbon was located in the soil (Figure 2) because low temperatures restrict the decomposition rate of organic matter and lead to accumulations of organic matter [5,6]. The mean SLT carbon stock was 18.51 Mg C/ha, which was similar to the 19.61 Mg C/ha measured in the young- and middle-aged forests located elsewhere in the Great Xing’an Mountains [58]. The carbon amounts that are held in the S&H in our research were similar to those in middle-aged larch forests [59]. However, the proportion of S&H of the total ecosystem carbon was 8.8% in our study, which was different from the 3% value reported in other previous studies [11,55,60]. This may be related to the older forest ages in these studies because the carbon amounts that were stored in the shrubs and herbaceous vegetation decreased rapidly with stand age [61]. In addition, the high proportion of S&H stocks may be attributed to the unique forest type (e.g., Siberian dwarf pine (Pinus pumila ‘Glauca’)-Larix gmelinii forest) involved in our survey. Pinum pumila is a type of large shrub with large biomass.
Forest fires may redistribute carbon among various carbon pools in forest ecosystems, and the degrees of redistribution are highly influenced by the fire severities [10,12,62]. In our study, the highest carbon stocks in the SDT and CWD pools were observed under high-severity fires (Figure 3) because high-severity fires lead to high fuel consumption, especially of forest floor fuels, and to high tree mortality and fallen branches [15,44,62,63]. However, carbon relocated from SLT to SDT pool was small under low- and moderate-severity fires due to low levels of tree mortality [42,44], which was much lower than the crown fires in North America and western Russia [64]. It is worth noting that forest fires can generate charcoal, which is an important carbon pool in fire-prone forests. However, charcoal was largely neglected in the current forest carbon budget [25,65]. Our results indicated that the carbon stock of charcoal was highest under moderate-severity fires. This is because, during high-severity fires, the fuels are exposed to high temperatures, which results in more complete combustion of fuels compared to moderate-severity fires so that less charcoal is produced [24,66], in which fewer fuels are consumed during low-severity fires that lead to little remaining charcoal [67]. This is in line with previous studies [29,68,69]. It is difficult for charcoal to decompose, so it is a crucial carbon sink. Our results imply that the current carbon stocks of the forest ecosystems were underestimated when charcoal was not included, which may decrease the role of forests in carbon neutrality.

4.2. Impacts of Forest Fire Severities on Soil Nutrient and BC Contents and TOCS

The impacts of forest fires on soil nutrients are diverse. Some researchers have found that the TOC, TP, and TN contents decreased in postfire soils [33,34,70], while others have indicated that the soil nutrient levels increased within a short period of time since fires occurred [35,71,72]. Our results showed that soil TOC, TP, and TN contents increased after moderate- and high-severity fires (Figure 4). This may partly be due to the field investigation times. Our postfire investigations were carried out within three months. Soil properties change most significantly [35] with nutrient retention peaks in the initial one to three months after fires [36].
In addition, the increases in soil nutrient contents may be caused by ash deposition of burned fuels onto surface soils after fires [36,71]. Numerous researchers have illustrated that the SOM increased due to burned material being placed into postfire soil, and those ash depositions had high N and P concentrations [35,37,72,73]. Low-severity fires combusted less material, which led to little ash formation [29], while moderate- to high-severity fires nearly completely consumed the fuels on the forest floor [62] and caused more ash deposition. This could partly explain why the soil TOC, TP, and TN contents increased significantly after the moderate- and high-severity fires in our study. Furthermore, the plant nutrient demand and uptake were depressed in the first three months after fires [36], which resulted in the accumulation of soil nutrients, such as N [74].
Our results also indicated that although the soil TOC contents significantly increased after moderate- and high-severity fires, the TOCS levels did not change accordingly. This may be attributed to the decreased soil bulk density that is caused by soil swelling shortly after fires [75]. The soil BC contents in the upper 10 cm layer remained stable and were not obviously affected by the fire severities in our research, which was different from other reports [27,29]. This might also be explained by the short sampling times in our study since the fires occurred. Within a short period of time, the BC and charcoal have difficulty entering the soil by wind or rain sparging [76] and are left on the ground surface.

5. Conclusions

This research chose eight sites to be studied immediately after burning by fires of various severities, studied the carbon redistribution, and emissions among carbon pools (e.g., SLT, SDT, CWD, S&H, forest floor, and mineral soil), and determined the changes in soil nutrients and BC contents after the fires. Our results indicated that soil nutrient contents, carbon redistribution, and emissions are all affected by fire severities. The charcoal carbon pool, which is important for biological cycles but largely neglected in the current forest budget, generated the most carbon under moderate-severity fires. However, the carbon emissions, redistribution from SLT to SDT and SDT to CWD were all highest under high-severity fires due to higher fuel consumption and tree mortality levels. Carbon redistribution information is important for accurately estimating forest carbon budgets and providing crucial parameters for forest carbon cycling models to incorporate the carbon transfer process. However, this is a complex interaction among various carbon pools, the redistribution information in our study wasn’t enough and more detailed such as how much carbon was transferred from each fuel stratum to charcoal, to ash, etc., still needs to be explored in the future.

Author Contributions

Conceptualization, X.P. and Y.C.; methodology, X.P. and M.L.; formal analysis, X.P.; investigation, S.S., Y.J. and D.L.; writing—original draft preparation, X.P.; writing—review and editing, X.P., Y.C. and W.H.; supervision, Y.H.; project administration, Y.C.; funding acquisition, Y.C. All authors have read and agreed to the published version of the manuscript.

Funding

This research was funded by the National Natural Science Foundation of China (grant number: 31971483) and the National Key Research and Development Program of China Strategic International Cooperation in Science and Technology Innovation Program (2018YFE0207800).

Institutional Review Board Statement

Not applicable.

Informed Consent Statement

Not applicable.

Data Availability Statement

Data included in this study are available upon request from the corresponding author.

Acknowledgments

We thank the many people in Huzhong Forestry Bureau that contributed to the collection of the field data, especially for Chang-He Hu.

Conflicts of Interest

The authors declare no conflict of interest.

References

  1. Pan, Y.; Birdsey, R.A.; Fang, J.; Houghton, R.; Kauppi, P.E.; Kurz, W.A.; Phillips, O.L.; Shvidenko, A.; Lewis, S.L.; Canadell, J.G.; et al. A Large and Persistent Carbon Sink in the World’s Forests. Science 2011, 333, 988. [Google Scholar] [CrossRef] [Green Version]
  2. Yang, Y.Z.; Cai, W.H.; Yang, J.; White, M.; Lhotka, J.M. Dynamics of Postfire Aboveground Carbon in a Chronosequence of Chinese Boreal Larch Forests. J. Geophys. Res. Biogeosciences 2018, 123, 3490–3506. [Google Scholar] [CrossRef]
  3. Wang, C.; Gower, S.T.; Wang, Y.; Zhao, H.; Yan, P.; Bond-Lamberty, B.P. The influence of fire on carbon distribution and net primary production of boreal Larix gmelinii forests in north-eastern China. Glob. Change Biol. 2001, 7, 719–730. [Google Scholar] [CrossRef]
  4. Kasischke, E.S. Boreal ecosystems in the global carbon cycle. In Fire, Climate Change, and Carbon Cycling in the Boreal Forest; Kasischke, E.S., Stocks, B.J., Eds.; Springer: New York, NY, USA, 2000; Volume 138. [Google Scholar]
  5. Seedre, M.; Shrestha, B.M.; Chen, H.Y.H.; Colombo, S.; Jõgiste, K. Carbon dynamics of North American boreal forest after stand replacing wildfire and clearcut logging. J. For. Res. 2011, 16, 168–183. [Google Scholar] [CrossRef]
  6. Shorohova, E.; Kuuluvainen, T.; Kangur, A.; Jõgiste, K. Natural stand structures, disturbance regimes and successional dynamics in the Eurasian boreal forests: A review with special reference to Russian studies. Ann. For. Sci. 2009, 66, 201. [Google Scholar] [CrossRef] [Green Version]
  7. Kelly, R.; Chipman, M.L.; Higuera, P.E.; Stefanova, I.; Brubaker, L.B.; Hu, F.S. Recent burning of boreal forests exceeds fire regime limits of the past 10,000 years. Proc. Natl. Acad. Sci. USA 2013, 110, 13055–13060. [Google Scholar] [CrossRef] [Green Version]
  8. Chang, Y.; He, H.S.; Hu, Y.; Bu, R.; Li, X. Historic and current fire regimes in the Great Xing’an Mountains, northeastern China: Implications for long-term forest management. For. Ecol. Manag. 2008, 254, 445–453. [Google Scholar] [CrossRef]
  9. Spracklen, D.V.; Mickley, L.J.; Logan, J.A.; Hudman, R.C.; Yevich, R.; Flannigan, M.D.; Westerling, A.L. Impacts of climate change from 2000 to 2050 on wildfire activity and carbonaceous aerosol concentrations in the western United States. J. Geophys. Res. Atmos. 2009, 114. [Google Scholar] [CrossRef]
  10. Yocom Kent, L.L.; Shive, K.L.; Strom, B.A.; Sieg, C.H.; Hunter, M.E.; Stevens-Rumann, C.S.; Fulé, P.Z. Interactions of fuel treatments, wildfire severity, and carbon dynamics in dry conifer forests. For. Ecol. Manag. 2015, 349, 66–72. [Google Scholar] [CrossRef]
  11. Yatskov, M.A.; Harmon, M.E.; Barrett, T.M.; Dobelbower, K.R. Carbon pools and biomass stores in the forests of Coastal Alaska: Uncertainty of estimates and impact of disturbance. For. Ecol. Manag. 2019, 434, 303–317. [Google Scholar] [CrossRef]
  12. Matchett, J.R.; Lutz, J.A.; Tarnay, L.W.; Smith, D.G.; Becker, K.M.L.; Brooks, M.L. Impacts of Fire Management on aboveground Tree Carbon Stocks in Yosemite and Sequoia & Kings Canyon National Parks; National Park Service: Washington, DC, USA, 2015. [Google Scholar]
  13. Eskelson, B.N.I.; Monleon, V.J.; Fried, J.S. A 6 year longitudinal study of post-fire woody carbon dynamics in California’s forests. Can. J. For. Res. 2016, 46, 610–620. [Google Scholar] [CrossRef]
  14. Chang, Y.; Zhu, Z.; Feng, Y.; Li, Y.; Bu, R.; Hu, Y. The spatial variation in forest burn severity in Heilongjiang Province, China. Nat. Hazards 2016, 81, 981–1001. [Google Scholar] [CrossRef]
  15. Meigs, G.W.; Donato, D.C.; Campbell, J.L.; Martin, J.G.; Law, B.E. Forest Fire Impacts on Carbon Uptake, Storage, and Emission: The Role of Burn Severity in the Eastern Cascades, Oregon. Ecosystems 2009, 12, 1246–1267. [Google Scholar] [CrossRef]
  16. Liu, S.; Bond-Lamberty, B.; Hicke, J.A.; Vargas, R.; Zhao, S.; Chen, J.; Edburg, S.L.; Hu, Y.; Liu, J.; McGuire, A.D.; et al. Simulating the impacts of disturbances on forest carbon cycling in North America: Processes, data, models, and challenges. J. Geophys. Res. Biogeosciences 2011, 116, G00K08. [Google Scholar] [CrossRef] [Green Version]
  17. Blais, A.; Lorrain, S.; Plourde, Y.; Varfalvy, L. Organic carbon densities of soils and vegetation of tropical, temperate and boreal forests. In Greenhouse Gas Emissions-Fluxes and Processes; Tremblay, A., Varfalvy, L., Roehm, C., Garneau, M., Eds.; Springer: Berlin/Heidelberg, Germany, 2005. [Google Scholar] [CrossRef]
  18. Wang, X.; Chang, Y.; Chen, H.; Hu, Y.; Feng, Y.; Wu, W. Biomass allocation characteristics of the main forest ecosystems in the Great Xing’an Mountains, Heilongjiang Province. Chin. J. Ecol. 2014, 33, 1437–1444. [Google Scholar]
  19. Amiro, B.D.; Cantin, A.C.; Flannigan, M.D.; de Groot, W.J. Future emissions from Canadian boreal forest fires. Can. J. For. Res. 2009, 39, 383–395. [Google Scholar] [CrossRef]
  20. Boby, L.A.; Schuur, E.A.G.; Mack, M.C.; Verbyla, D.; Johnstone, J.F. Quantifying fire severity, carbon, and nitrogen emissions in Alaska’s boreal forest. Ecol. Appl. 2010, 20, 1633–1647. [Google Scholar] [CrossRef] [Green Version]
  21. Hu, H.; Wei, S.; Sun, L. Estimating carbon emissions from forest fires during 2001 to 2010 in Daxing’anling Mountain. Acta Ecol. Sin. 2012, 32, 5373–5386. [Google Scholar]
  22. Ottmar, R.D. Wildland fire emissions, carbon, and climate: Modeling fuel consumption. For. Ecol. Manag. 2014, 317, 41–50. [Google Scholar] [CrossRef]
  23. Angers, V.A.; Gauthier, S.; Drapeau, P.; Jayen, K.; Bergeron, Y. Tree mortality and snag dynamics in North American boreal tree species after a wildfire: A long-term study. Int. J. Wildland Fire 2011, 20, 751–763. [Google Scholar] [CrossRef]
  24. Carvalho, E.O.; Kobziar, L.N.; Putz, F.E. Fire ignition patterns affect production of charcoal in southern forests. Int. J. Wildland Fire 2011, 20, 474–477. [Google Scholar] [CrossRef]
  25. Preston, C.M.; Schmidt, M.W.I. Black (pyrogenic) carbon: A synthesis of current knowledge and uncertainties with special consideration of boreal regions. Biogeosciences 2006, 3, 397–420. [Google Scholar] [CrossRef] [Green Version]
  26. Bird, M.I.; Wynn, J.G.; Saiz, G.; Wurster, C.M.; McBeath, A. The Pyrogenic Carbon Cycle. Annu. Rev. Earth Planet. Sci. 2015, 43, 273–298. [Google Scholar] [CrossRef]
  27. Maestrini, B.; Alvey, E.; Hurteau, M.; Safford, H.; Miesel, J. Fire severity alters the distribution of pyrogenic carbon stocks across ecosystem pools in a Californian mixed-conifer forest. J. Geophys. Res. Biogeosciences 2017, 122, 2338–2355. [Google Scholar] [CrossRef]
  28. Santín, C.; Doerr, S.H.; Kane, E.S.; Masiello, C.A.; Ohlson, M.; de la Rosa, J.M.; Preston, C.M.; Dittmar, T. Towards a global assessment of pyrogenic carbon from vegetation fires. Glob. Change Biol. 2016, 22, 76–91. [Google Scholar] [CrossRef]
  29. Huang, W.; Hu, Y.; Chang, Y.; Liu, M.; Li, Y.; Ren, B.; Shi, S. Effects of Fire Severity and Topography on Soil Black Carbon Accumulation in Boreal Forest of Northeast China. Forests 2018, 9, 408. [Google Scholar] [CrossRef] [Green Version]
  30. Smithwick, E.A.H.; Turner, M.G.; Mack, M.C.; Chapin, F.S. Postfire Soil N Cycling in Northern Conifer Forests Affected by Severe, Stand-Replacing Wildfires. Ecosystems 2005, 8, 163–181. [Google Scholar] [CrossRef]
  31. González-Pérez, J.A.; González-Vila, F.J.; Almendros, G.; Knicker, H. The effect of fire on soil organic matter—A review. Environ. Int. 2004, 30, 855–870. [Google Scholar] [CrossRef]
  32. Hu, T.; Hu, H.; Li, F.; Zhao, B.; Wu, S.; Zhu, G.; Sun, L. Long-term effects of post-fire restoration types on nitrogen mineralisation in a Dahurian larch (Larix gmelinii) forest in boreal China. Sci. Total Environ. 2019, 679, 237–247. [Google Scholar] [CrossRef]
  33. Sun, M. The Impact on Soil Properties and Revegetation from Forest Fire in Tahe forest Region; Beijing Forestry University: Beijing, China, 2011. [Google Scholar]
  34. Gu, H.; Jin, Y.; Zhang, Y.; Chen, X. Effects of forest fire on soil nutrients of Ass. Pinus pumila-Larix gmelinii forest in Great Xing’an Mountains. J. Beijing For. 2016, 38, 48–54. [Google Scholar] [CrossRef]
  35. Francos, M.; Pereira, P.; Mataix-Solera, J.; Arcenegui, V.; Alcañiz, M.; Ubeda, X. How clear-cutting affects fire severity and soil properties in a Mediterranean ecosystem. J. Environ. Manag. 2018, 206, 625–632. [Google Scholar] [CrossRef]
  36. Butnor, J.R.; Johnsen, K.H.; Maier, C.A.; Nelson, C.D. Intra-Annual Variation in Soil C, N and Nutrients Pools after Prescribed Fire in a Mississippi Longleaf Pine (Pinus palustris Mill.) Plantation. Forests 2020, 11, 181. [Google Scholar] [CrossRef] [Green Version]
  37. Lavoie, M.; Starr, G.; Mack, M.; Martin, T.; Gholz, H. Effects of a Prescribed Fire on Understory Vegetation, Carbon Pools, and Soil Nutrients in a Longleaf Pine-Slash Pine Forest in Florida. Nat. Areas J. 2010, 30, 82–94. [Google Scholar] [CrossRef]
  38. Hu, M.; Liu, Y.; Wang, T.; Hao, Y.; Li, Z.; Wan, S. Fire Alters Soil Properties and Vegetation in a Coniferous–Broadleaf Mixed Forest in Central China. Forests 2020, 11, 164. [Google Scholar] [CrossRef] [Green Version]
  39. Schoenholtz, S.H.; Miegroet, H.V.; Burger, J.A. A review of chemical and physical properties as indicators of forest soil quality: Challenges and opportunities. For. Ecol. Manag. 2000, 138, 335–356. [Google Scholar] [CrossRef]
  40. Yu, G.; Li, X.; Wang, Q.; Li, S. Carbon Storage and Its Spatial Pattern of Terrestrial Ecosystem in China. J. Resour. Ecol. 2010, 1, 97–109, 113. [Google Scholar]
  41. Jia, Y.; Chang, Y.; Ping, X.; Chang, C. Dynamics of carbon stocks of different pools in Huzhong National Natural Reserve, Northeast China under the disturbance of various severity fires. Chin. J. Appl. Ecol. 2021, 32, 2325–2334. [Google Scholar]
  42. Harden, J.W.; Trumbore, S.E.; Stocks, B.J.; Hirsch, A.; Gower, S.T.; O’Neill, K.P.; Kasischke, E.S. The role of fire in the boreal carbon budget. Glob. Change Biol. 2000, 6, 174–184. [Google Scholar] [CrossRef] [Green Version]
  43. Wang, X.; Wang, W.; Chang, Y.; Feng, Y.; Chen, H.; Hu, Y.; Chi, J. Fire severity of burnt area in Huzhong forest region of Great Xing’an Mountains, Northeast China based on normalized burn ratio analysis. Chin. J. Appl. Ecol. 2013, 24, 967–974. [Google Scholar]
  44. Ping, X.; Chang, Y.; Liu, M.; Hu, Y.; Yuan, Z.; Shi, S.; Jia, Y.; Li, D.; Yu, L. Fuel burning efficiency under various fire severities of a boreal forest landscape in north-east China. Int. J. Wildland Fire 2021, 30, 691–701. [Google Scholar] [CrossRef]
  45. Lu, R. Analytical Methods of Soil Agricultural Chemistry; China Agricultural Science Press: Beijing, China, 1999. [Google Scholar]
  46. Cheng, Y.X.; Li, Z.X. A study on biomass of three main forest types in Larix gmelinii forest. Inn. Mong. For. Investig. Des. 1989, 4, 89–100. [Google Scholar]
  47. Chen, C.G.; Zhu, J.F. A Handbook of Biomass of Main Tree Species in the Northeastern China; China Forestry Press: Beijing, China, 1989. [Google Scholar]
  48. Luo, T.X. Patterns of Net Primary Productivity for Chinese Major Forest Types and Their Mathematical Models; Graduate University of Chinese Academy of Sciences: Beijing, China, 1996. [Google Scholar]
  49. Kang, L. A Study on the Decomposition of Falled Trees of Larix Gmelinii and Betula Platyphylla Forests in Daxinganling Mountains; Inner Mongolia Agricultural Universtiy: Hohhot, China, 2012. [Google Scholar]
  50. Waddell, K.L. Sampling coarse woody debris for multiple attributes in extensive resource inventories. Ecol. Indic. 2002, 1, 139–153. [Google Scholar] [CrossRef]
  51. Hu, H.Q.; Sun, L.; Guo, Q.X.; Lü, X.S. Carbon emissions from forest fires on main Arbor species in Daxing’an Mountains in Heilongjiang province. Sci. Silvae Sin. 2007, 43, 82–88. [Google Scholar] [CrossRef]
  52. Seiler, W.; Crutzen, P.J. Estimates of gross and net fluxes of carbon between the biosphere and the atmosphere from biomass burning. Clim. Change 1980, 2, 207–247. [Google Scholar] [CrossRef]
  53. French, N.H.F.; de Groot, W.J.; Jenkins, L.K.; Rogers, B.M.; Alvarado, E.; Amiro, B.; de Jong, B.; Goetz, S.; Hoy, E.; Hyer, E.; et al. Model comparisons for estimating carbon emissions from North American wildland fire. J. Geophys. Res. 2011, 116, G00K05. [Google Scholar] [CrossRef] [Green Version]
  54. R Core Team. R: A Language and Environment for Statistical Computing. R Foundation for Statistical Computing: Vienna, Austria. Available online: https://www.R-project.org/ (accessed on 4 March 2020).
  55. Galarza-Macias, J. Incorporating Fire Severity into Estimates of Carbon Losses in Ontario’s Boreal Forest; Trent University: Peterborough, ON, Canada, 2010. [Google Scholar]
  56. Melvin, A.M.; Mack, M.C.; Johnstone, J.F.; David McGuire, A.; Genet, H.; Schuur, E.A.G. Differences in Ecosystem Carbon Distribution and Nutrient Cycling Linked to Forest Tree Species Composition in a Mid-Successional Boreal Forest. Ecosystems 2015, 18, 1472–1488. [Google Scholar] [CrossRef]
  57. Litton, C.M.; Raich, J.W.; Ryan, M.G. Carbon allocation in forest ecosystems. Glob. Change Biol. 2007, 13, 2089–2109. [Google Scholar] [CrossRef] [Green Version]
  58. Sun, Y.; Zhang, J.; Han, A.; Wang, X.; Wang, X. Biomass and carbon pool of Larix gmelini young and middle age forest in Xing’an Mountains Inner Mongolia. Acta Ecol. Sin. 2007, 27, 1756–1762. [Google Scholar]
  59. Hu, H.; Luo, B.; Wei, S.; Wei, S.; Wen, Z.; Sun, L.; Luo, S.; Wang, L.; Ma, H. Estimating biological carbon storage of five typical forest types in the Daxinganling Mountains, Heilongjiang, China. Acta Ecol. Sin. 2015, 35, 5745–5760. [Google Scholar]
  60. Dyck, B.S.; Shay, J.M. Biomass and carbon pool of two bogs in the Experimental Lakes Area, northwestern Ontario. Can. J. Bot.-Rev. Can. Bot. 1999, 77, 291–304. [Google Scholar] [CrossRef]
  61. Turner, M.G.; Romme, W.H. Landscape dynamics in crown fire ecosystems. Landsc. Ecol. 1994, 9, 59–77. [Google Scholar] [CrossRef]
  62. van Bellen, S.; Garneau, M.; Bergeron, Y. Impact of Climate Change on Forest Fire Severity and Consequences for Carbon Stocks in Boreal Forest Stands of Quebec, Canada: A Synthesis. Fire Ecol. 2010, 6, 16–44. [Google Scholar] [CrossRef]
  63. Carlson, C.H.; Dobrowski, S.Z.; Safford, H.D. Variation in tree mortality and regeneration affect forest carbon recovery following fuel treatments and wildfire in the Lake Tahoe Basin, California, USA. Carbon Balance Manag. 2012, 7, 7. [Google Scholar] [CrossRef] [Green Version]
  64. Stocks, B.J.; Kauffman, J.B. Biomass Consumption and Behavior of Wildland Fires in Boreal, Temperate, and Tropical Ecosystems: Parameters Necessary to Interpret Historic Fire Regimes and Future Fire Scenarios; Clark, J.S., Cachier, H., Goldammer, J.G., Stocks, B., Eds.; Sediment Records of Biomass Burning and Global Change; Springer: Berlin/Heidelberg, Germany, 1997; pp. 169–188. [Google Scholar]
  65. Righi, C.A.; de Alencastro Graça, P.M.L.; Cerri, C.C.; Feigl, B.J.; Fearnside, P.M. Biomass burning in Brazil’s Amazonian “arc of deforestation”: Burning efficiency and charcoal formation in a fire after mechanized clearing at Feliz Natal, Mato Grosso. For. Ecol. Manag. 2009, 258, 2535–2546. [Google Scholar] [CrossRef]
  66. Czimczik, C.I.; Schmidt, M.W.I.; Schulze, E.-D. Effects of increasing fire frequency on black carbon and organic matter in Podzols of Siberian Scots pine forests. Eur. J. Soil Sci. 2005, 56, 417–428. [Google Scholar] [CrossRef] [Green Version]
  67. Krishnaraj, S.J.; Baker, T.G.; Polglase, P.J.; Volkova, L.; Weston, C.J. Prescribed fire increases pyrogenic carbon in litter and surface soil in lowland Eucalyptus forests of south-eastern Australia. For. Ecol. Manag. 2016, 366, 98–105. [Google Scholar] [CrossRef]
  68. Li, Y.; Xu, X.; Zhao, P. Post-fire dispersal characteristics of charcoal particles in the Daxing’an Mountains of north-east China and their implications for reconstructing past fire activities. Int. J. Wildland Fire 2017, 26, 46–57. [Google Scholar] [CrossRef]
  69. Umbanhowar, C.E.; McGrath, M.J. Experimental production and analysis of microscopic charcoal from wood, leaves and grasses. Holocene 1998, 8, 341–346. [Google Scholar] [CrossRef]
  70. Francos, M.; Úbeda, X.; Pereira, P.; Alcañiz, M. Long-term impact of wildfire on soils exposed to different fire severities. A case study in Cadiretes Massif (NE Iberian Peninsula). Sci. Total Environ. 2018, 615, 664–671. [Google Scholar] [CrossRef] [PubMed]
  71. Rutigliano, F.A.; Fierro, A.R.; De Pascale, R.A.; De Marco, A.; Virzo De Santo, A. Role of fire on soil organic matter turnover and microbial activity in a mediterranean burned area. In Developments in Soil Science; Violante, A., Huang, P.M., Bollag, J.M., Gianfreda, L., Eds.; Elsevier: Amsterdam, The Netherlands, 2002; Volume 28, pp. 205–215. [Google Scholar]
  72. Schafer, J.; Mack, M. Short-term effects of fire on soil and plant nutrients in palmetto flatwoods. Plant Soil 2010, 334, 433–447. [Google Scholar] [CrossRef]
  73. Raison, R.J.; Khanna, P.K.; Woods, P.V. Mechanisms of element transfer to the atmosphere during vegetation fires. Can. J. For. Res. 1985, 15, 132–140. [Google Scholar] [CrossRef]
  74. Ficken, C.; Wright, J. Contributions of microbial activity and ash deposition to post-fire nitrogen availability in a pine savanna. Biogeosciences 2017, 14, 241–255. [Google Scholar] [CrossRef] [Green Version]
  75. Zhang, M. The Effect of Forest Fire on Soil Environment; Northeast Forestry University: Harbin, China, 2002. [Google Scholar]
  76. Roy, D.P.; Boschetti, L.; Maier, S.W.; Smith, A.M.S. Field estimation of ash and char colour-lightness using a standard grey scale. Int. J. Wildland Fire 2010, 19, 698–704. [Google Scholar] [CrossRef]
Figure 1. Location of the study area in the boreal forest of northeast China on the border of Russia.
Forests 13 00110 g001
Figure 2. Stocks of various carbon pools in the unburned and burned plots (Mg C/ha). (SLD: standing live trees, S&H: shrubs and herbaceous vegetation, forest floor: litter and duff, CWD: coarse woody debris, and SDT: standing dead trees. p < 0.05 **, p < 0.01 ***).
Forests 13 00110 g002
Figure 3. Carbon stocks (left) and proportions (right) of different forest carbon pools in unburned plots and those burned by low-, moderate-, and high-severity fires.
Forests 13 00110 g003
Figure 4. Boxplots of soil elements in contents and TOCS before and after fires under three levels of fire severity (p < 0.05 **, p < 0.01 ***).
Forests 13 00110 g004
Figure 5. Carbon emissions, transfers, and ratios of changes for each aboveground carbon pool under low-severity fires.
Forests 13 00110 g005
Figure 6. Carbon emissions, transfers, and ratios of changes for each aboveground carbon pool under moderate-severity fires.
Forests 13 00110 g006
Figure 7. Carbon emissions, transfers, and ratios of changes for each aboveground carbon pool under high-severity fires.
Forests 13 00110 g007
Table 1. Dates of wildfire occurrences and investigations.
SiteDate of Fire Occurrence (Day, Month, Year)Date of Field Investigation (Day, Month, Year)Investigation Time since Fire (Days)
2017_123,06,201728,07,201735
2017_224,06,201729,07,201735
2017_325,06,201730,07,201735
2017_403,07,201730,07,201728
2018_503,06,201825,07,201852
2018_631,05,201829,07,201859
2018_701,06,201830,07,201859
2018_831,05,201801,08,201862
Publisher’s Note: MDPI stays neutral with regard to jurisdictional claims in published maps and institutional affiliations.

