
Compatible Biomass Model of Moso Bamboo with Measurement Error
by
 ,
,
Xiao Zhou
1,2,†, 
Yaxiong Zheng
1,2,†,
Fengying Guan
1,2,*,
Xiao Xiao
1,2,
Xuan Zhang
1,2 and
Chengji Li
1,2 1
International Center for Bamboo and Rattan, Key Laboratory of National Forestry and Grassland Administration, Beijing 100102, China
2
National Location Observation and Research Station of the Bamboo Forest Ecosystem in Yixing, National Forestry and Grassland Administration, Yixing 214200, China
*
Author to whom correspondence should be addressed.
†
These authors contributed equally to this work.
Forests 2022, 13(5), 774; https://0-doi-org.brum.beds.ac.uk/10.3390/f13050774
Submission received: 25 April 2022
/
Revised: 13 May 2022
/
Accepted: 16 May 2022
/
Published: 17 May 2022
(This article belongs to the Special Issue Advances in Forest Growth and Site Productivity Modeling)
Abstract
:Moso bamboo is characterized by its fast growth and high yield and is important as a carbon sink species. Therefore, understanding the biomass distribution of its components is crucial. Based on the measured individual biomass data of 66 Phyllostachys heterocycla cv. Pubescens plants in the Yixing state-owned forest in Jiangsu Province, nonlinear simultaneous equations with measurement errors were constructed using nonlinear error-in-variable models (NEIVM) (one step, two step) and nonlinear seemingly unrelated regression (NSUR). Variables affecting biomass were evaluated, including diameter at breast height (DBH), bamboo height (H), height to crown base (HCB), node length at DBH (NL), base diameter (BD), and bamboo age (A). DBH, H, and HCB had significant effects on the biomass of each component. They were used to construct a one-predictor system using DBH, a two-predictor system using DBH and H, and a three-predictor system using DBH, H, and HCB. Regardless of the number of variables used, the fitting accuracy of the NEIVM one-step method exceeded that of the two-step method, and that of NEIVM exceeded that of NSUR estimation. As a system using three predictive variables is better than other systems, we recommend using the one-step NEIVM method for Moso bamboo biomass estimation.
1. Introduction
Biomass, a non-renewable energy source, is the fourth largest energy source in the world. Forest biomass is an important supplier of fodder and fuel and is also important for environmental protection that mitigates climate change through carbon sequestration [1,2]. Bamboo forests are among the most important forest types in the world, accounting for approximately 2.94% of the total forest area in China (data from the Ninth National Forest Resource Inventory Report).
The sixth report of IPCC stated that global warming continues unabated, and the CO2 content is still increasing (the sixth report of IPCC). Bamboo achieves high growth in only a few months [3]. Bamboo is an important carbon source and sink [4]. Biomass quantification is an important means of understanding the carbon pool and productivity of bamboo forests [5,6]. Figuring out how to calculate bamboo biomass is therefore urgent and important.
Globally, bamboo is an important resource, with 1500 varieties of under 87 genera in its subfamily [7]. China has the most abundant bamboo resources and is known as the kingdom of bamboo. These include more than 500 species under 48 genera of bamboo subfamilies [8,9]. Among them, Moso bamboo covers an area of 4.68 million hectares (ha), accounting for 72.96% of the total bamboo coverage (data from the Ninth National Forest Resource Inventory Report).
However, biomass surveys are time consuming and laborious [9,10]. The use of biomass models is currently a popular method. Biomass data need to be measured during the modeling process. However, when the model is established, forest resource inventory data can be used to estimate the biomass of the entire stand in similar stands with guaranteed accuracy.
The allometric growth equation is often used in biomass equations, and the estimation method of the biomass equation has been developed from the least square method to seemingly uncorrelated regression (SUR) [11,12,13,14,15,16]. In previous studies, the methods of estimating bamboo biomass mainly included the following: field survey statistics [17], where only the biomass of the culm was considered [18], all components were constructed using one equation [19], bivariate distribution model [20], and construction of biomass models with different components [21,22]. These methods have some drawbacks, such as high investigation costs owing to the different growth factors of branches, culms, and leaves; also, the accuracy of these methods is relatively low. When different components are used to build the model, it is built independently, resulting in the total biomass not being equal to the sum of each component. This method ignores the correlation between the components of bamboo biomass, and the sum of the predicted biomass of each bamboo component should be equal to the estimated total bamboo biomass. In other words, there is a lack of additivity between the components [23]. To solve this problem, many researchers have used simultaneous additive biomass equations [16,24,25]. However, this method is rarely used for modeling bamboo biomass.
The independent variable has no measurement error, which is the assumption of the biomass nonlinear seemingly uncorrelated simultaneous equations. Error-in-variable (EIV) models not only ensure the additivity of nonlinear biomass equations but also consider the impact of measurement errors [16,25,26,27,28,29,30,31]. However, there are relatively few studies on bamboo forest biomass.
The influence of six candidate factors was evaluated based on the aboveground biomass of the Moso bamboo in the Yixing state-owned forest farm in Jiangsu Province. Using NEIVM (nonlinear error-in-variable models) and NSUR (nonlinear seemingly unrelated regression) as parameter estimation algorithms, one-, two-, and three-predictor systems of biomass equations with measurement error were constructed, and the fitting accuracy of each model was verified by the leave-one-out cross-validation (LOOCV) method. We aimed to select the best biomass model construction method and parameter estimation method and provide technical support for the calculation and research of bamboo forest biomass models.
2. Materials and Methods
2.1. Study Areas
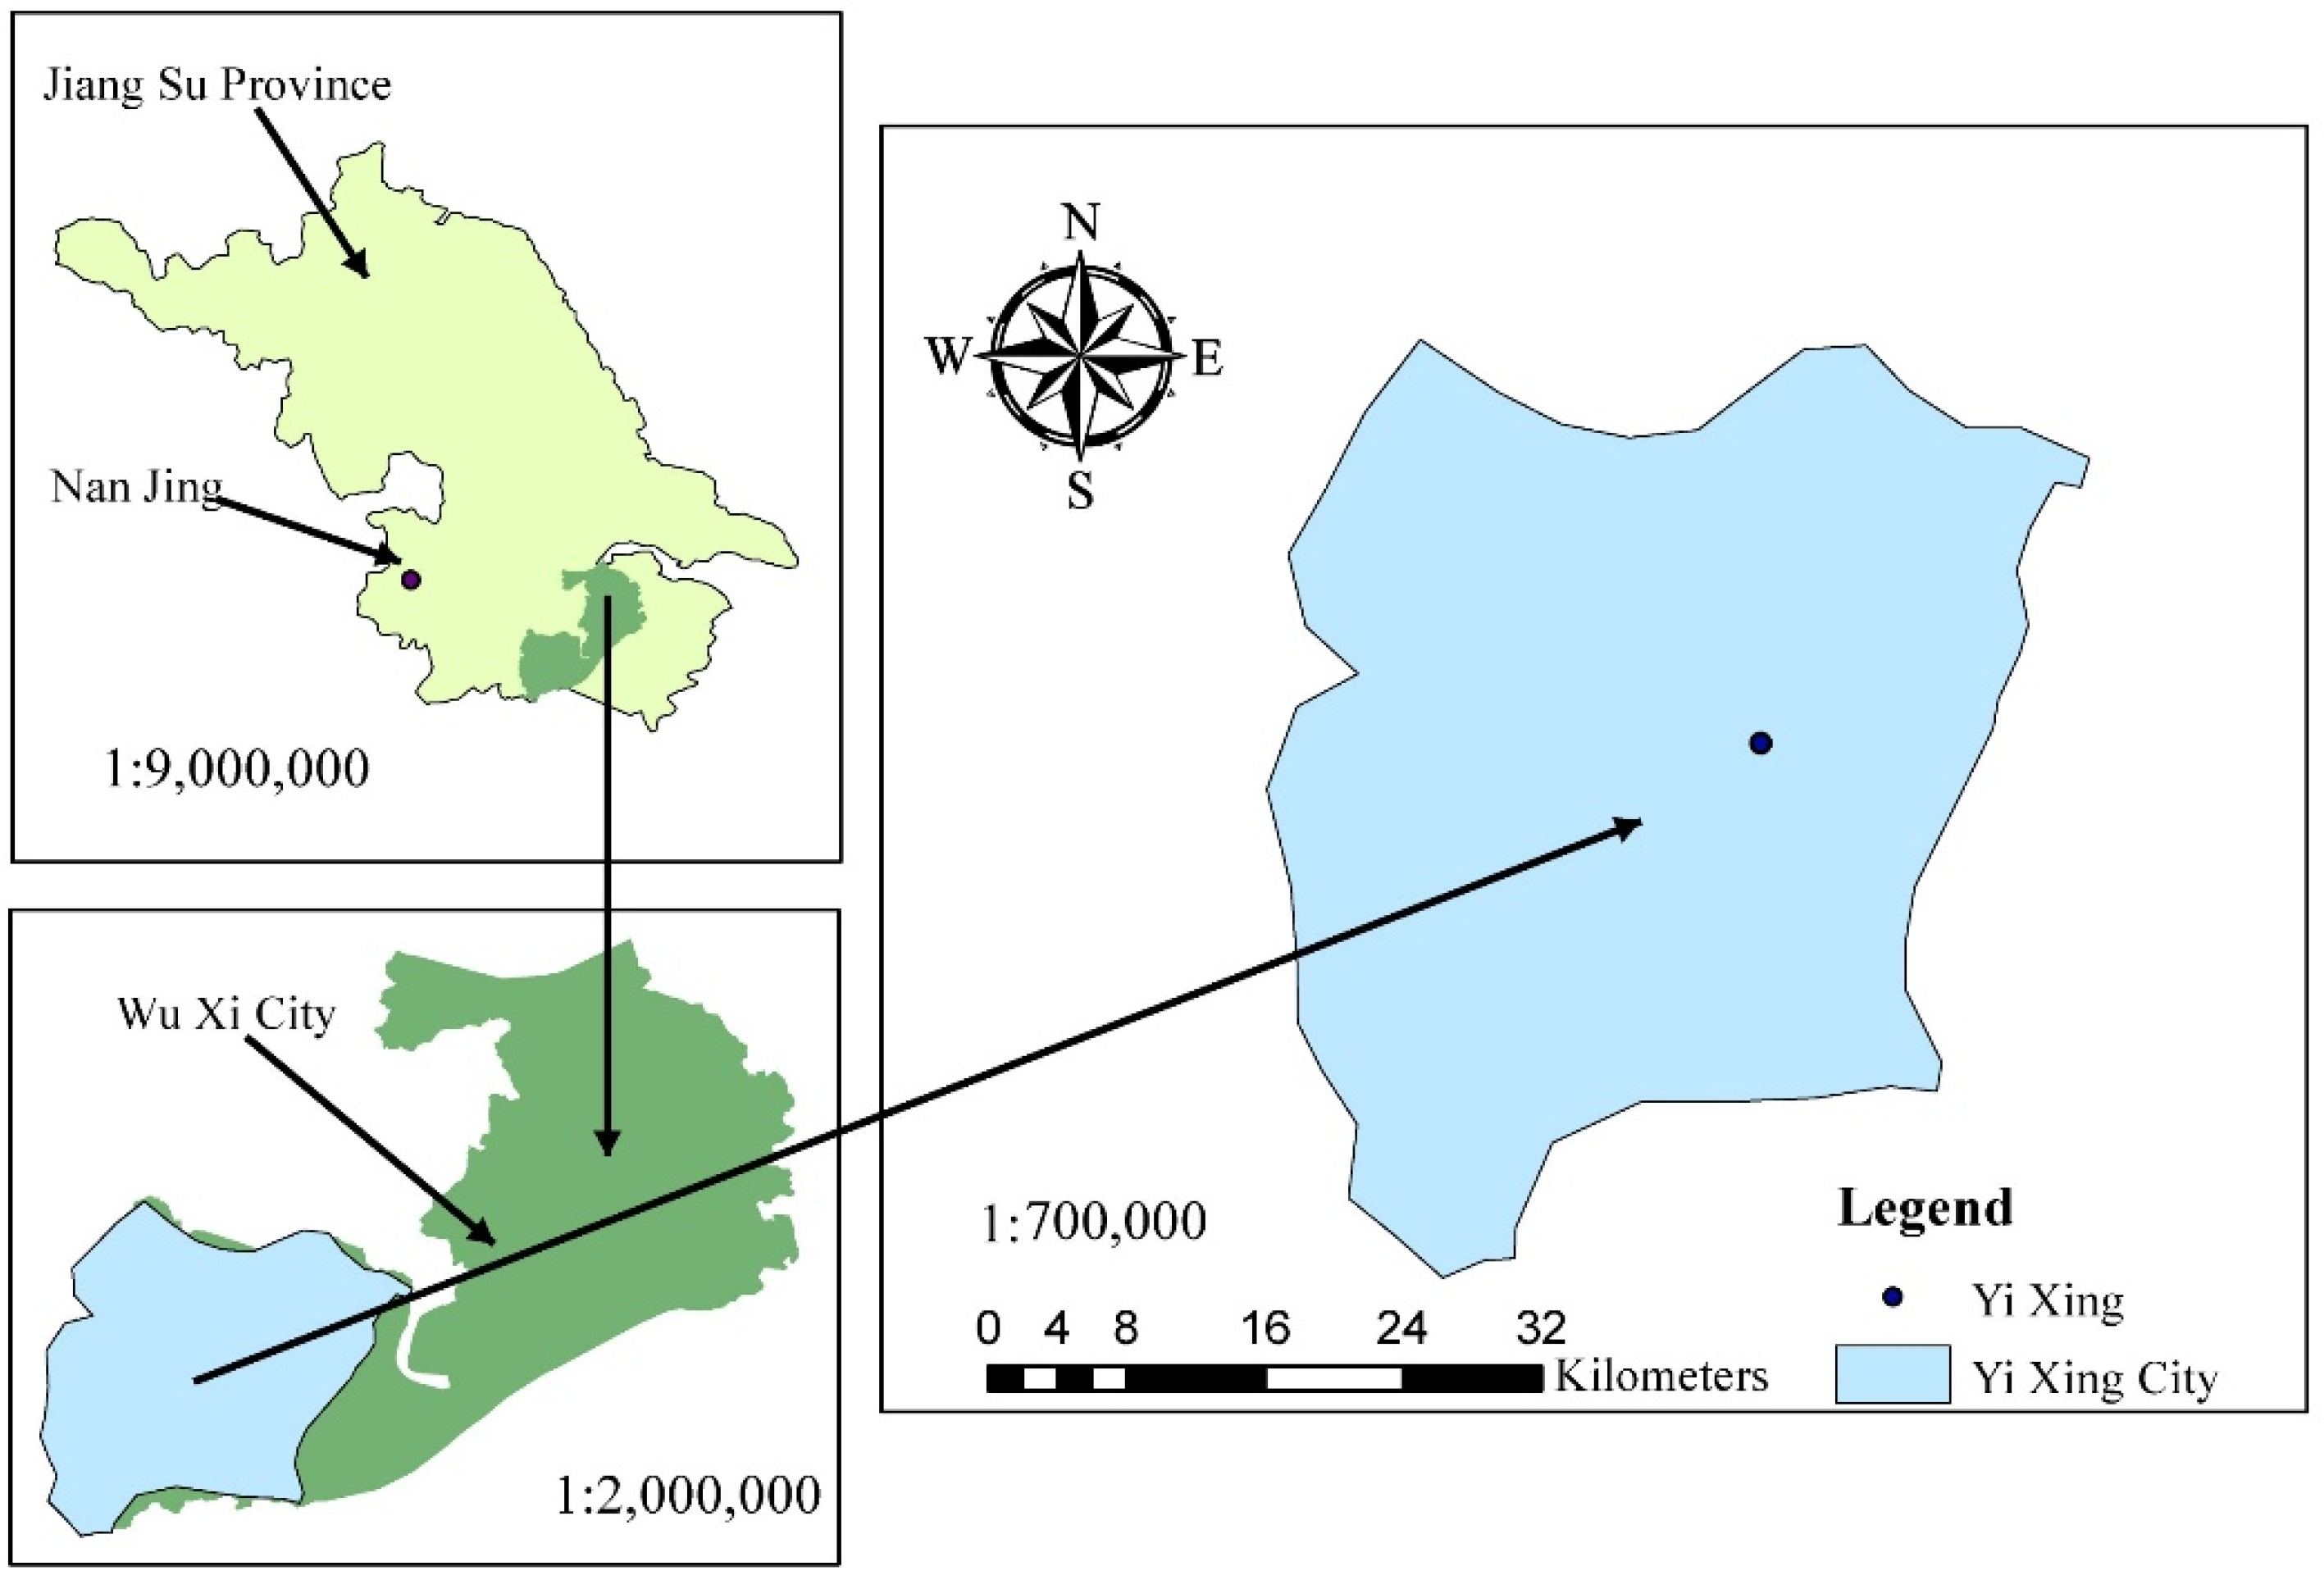
The study area is located on the Yixing state-owned forest farm, Jiangsu Province, western China (31°13′–31°15′ N, 119°41′–119°44′ E) (Figure 1). Yixing City covers a total area of 1996.6 square kilometers. It belongs to the junction of the northern scattered bamboo area and Jiangnan bamboo area and is at the northeast edge of the Moso bamboo distribution area.
Yixing City has a subtropical monsoon climate, with an average annual rainfall of 1805.4 mm and a mean annual temperature of 16.7 °C. The main types of traditional management measures adopted in Moso bamboo forests in this region include bamboo forest cutting (cutting bamboo over three degrees old), shrub and grass cutting, winter bamboo shoot and spring bamboo shoot harvesting, bamboo cutting, and tourism. Yixing forest farms do not fertilize Moso bamboo forests. All human behavior in the experimental area was controlled. The stand density of Moso bamboo was 2000–4000 plants/hm2, the average DBH was approximately 9.8 cm, and the age structure of grade I, grade II, and grade III bamboo was 3:4:3.
2.2. Data Collection
Field sampling was conducted in January 2022 in the Moso bamboo forest of the Yixing state-owned forest farm in Jiangsu Province. First, bamboo in the study area was measured to obtain the DBH distribution of the bamboo forest in the study area. Then, according to the two factors of DBH (7–14 cm) and age (1–4 degrees), a stratified sampling method was adopted. Taking 1 cm as the diameter class, 10 stems were sampled from each diameter class. Because there was little bamboo in the large-diameter and small-diameter classes, eight stems were taken for each diameter class. A total of 66 bamboo samples were obtained. The DBH, base diameter, and node length of each bamboo plant were measured in the field. After the bamboo was cut down, its height and the height to the crown base (HCB) were measured. Bamboo age (A) was determined based on the features of the culms, such as external color, branch, and leaf development, and the status of the culm sheaths. The bamboo culm biomass was sampled, and the fresh weight of each section of bamboo was determined using the full weight method, marked, and recorded. Samples were taken from the upper, middle, and lower parts of each 2 m section of the bamboo trunk, and 500–1000 g was sampled after mixing. The standard branch method was adopted for the determination of bamboo branch biomass. After the bamboo stem was divided into 2 m sections, three standard branches were selected according to the average base diameter and length in each section, the fresh weight was weighed, the average value was obtained, and the number of live branches in the section was multiplied to obtain the total fresh weight of the branches in the section. After mixing the standard branches, samples of 500–1000 g were obtained. For the biomass of bamboo leaves, all the leaves of the selected standard branches were removed, the fresh weight was obtained, and 100–200 g was taken as a sample and taken back to the laboratory.
2.3. Laboratory Tests
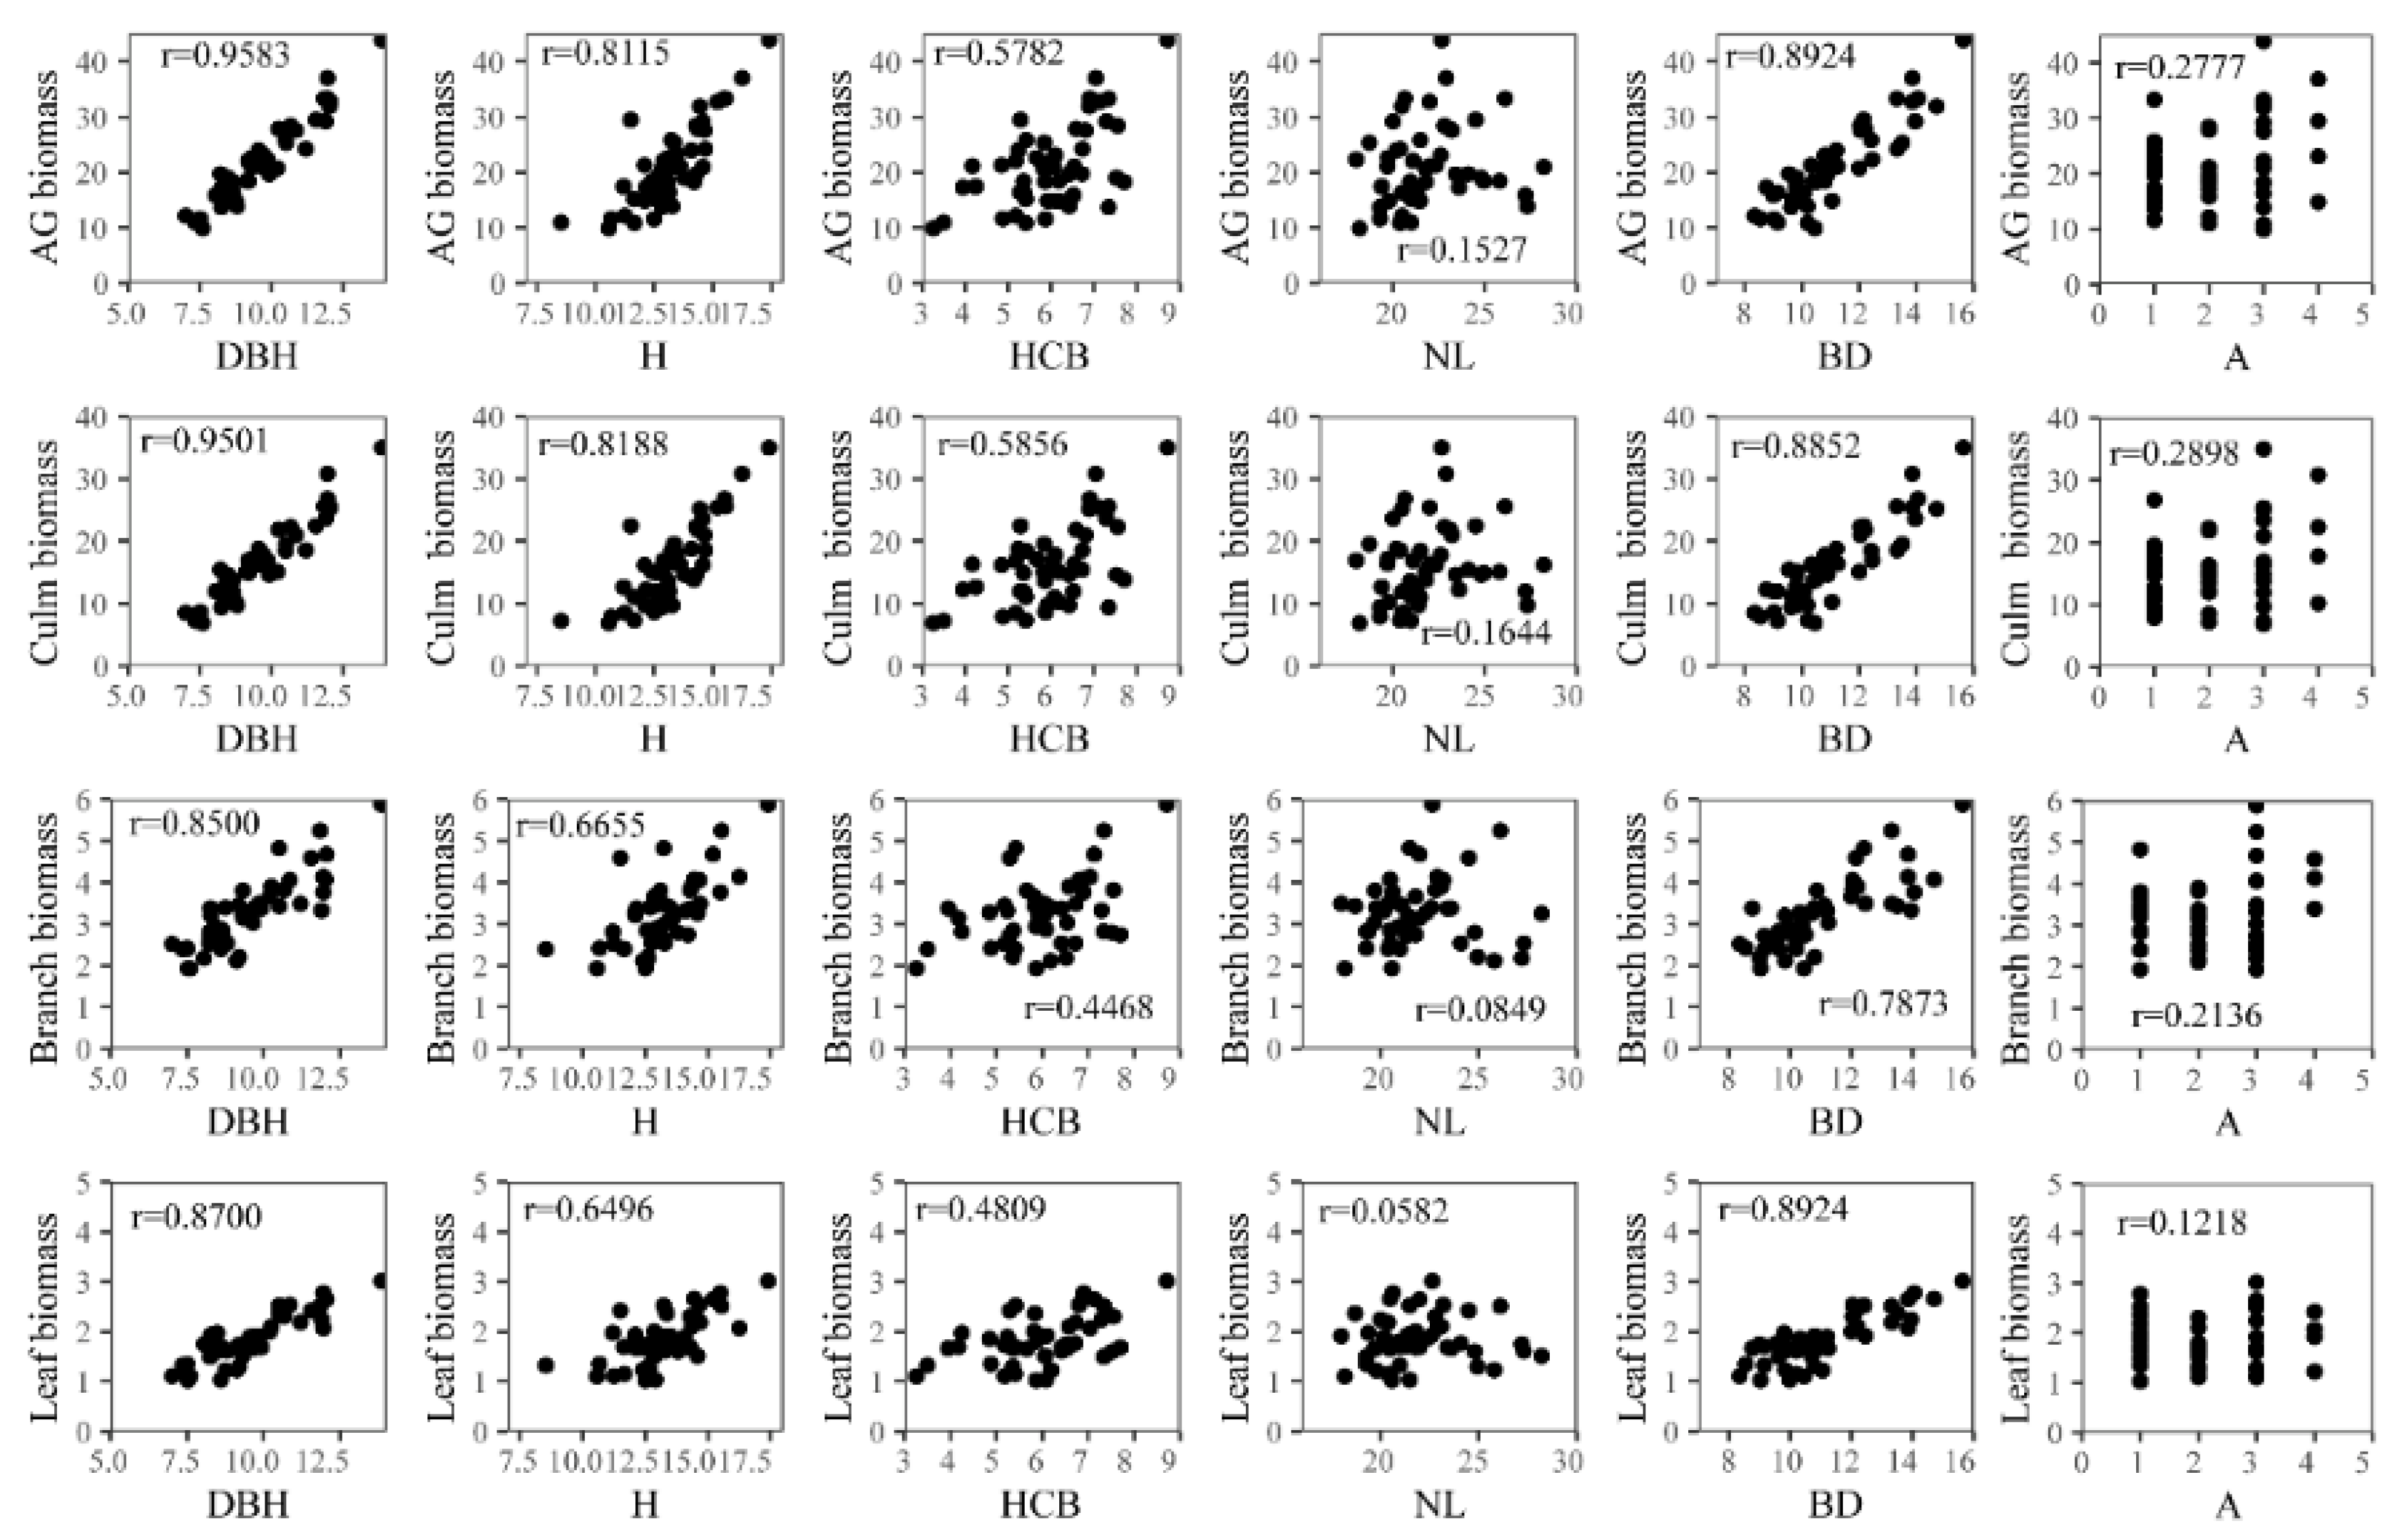
The samples were placed in an oven at 105 °C for 30 min and dried at a temperature of 75 °C until a constant weight was obtained. The total biomass of bamboo in each component was calculated according to the ratio of dry weight to fresh weight. Figure 2 shows the relationship between the biomass of various organs of bamboo and different variables (DBH, H, HCB, NL, BD, and A). The biomass of the bamboo components and variation ranges of the bamboo variables are listed in Table 1.
2.4. Methods
2.4.1. Nonlinear Error-in-Variable Models (NEIVM)
When the observed values of the dependent variables contain measurement errors, the usual model estimation methods will no longer be applicable, and the measurement error model can better solve this problem [32,33]. Fuller (1987) proposed the general form of nonlinear error-in-variable models (NEIVM) [26]. On this basis, Tang extended it and divided the model’s variables into two categories: error-in-variables and error-out-variables, according to whether the measurement error was included [29]. According to Tang’s expansion, the formula is as follows:
where N is the number of observed values of the target object; represents the model form (m-dimensional vector function); represents the independent variable without measurement error (error-out-variables); is the dependent variable with measurement error (error-in-variables) (p-dimensional EIV, p ≥ m); ∑ is the p∗p-dimensional positive-definite variance–covariance matrix of the error term . This study considered only the measurement error of the dependent variables.
Model (1) can be solved using the two-stage error (TSEM) algorithm in the variable model. Please refer to Tang 2001 and 2002 for the specific calculation process [29,30].
For Model (1), we chose two forms to develop the nonlinear measurement error model (to ensure the additivity of the model). One method is to divide bamboo biomass into three basic components: bamboo culm, bamboo branch, and bamboo leaf; this is called the one-step method. The one-step method ensures that the sum of the biomass values of all bamboo components is equal to the total bamboo biomass. Its expression is as follows:
where represents the observed biomass values of aboveground, bamboo culm, bamboo branch, and bamboo leaf of the ith bamboo and their values contain measurement errors. are the measured value. , , and represent the equation functions for culm, branch, and leaf biomass, respectively. is the estimated aboveground biomass of the ith bamboo plant. The structural matrix is used to explain the internal correlation between the components of various organs [30,34].
The second method is to divide the total biomass into bamboo culm and crown and then divide the bamboo crown into bamboo branches and leaves. This method is known as the two-step method. The advantage is that it also ensures that bamboo crown = bamboo branch + bamboo leaf. Its expression is as follows:
where is a function corresponding to bamboo crown biomass. The other variables have the same meaning as in Equation (2).
2.4.2. Nonlinear Seemingly Unrelated Regression (NSUR)
The NSUR is also a commonly used estimation method for measurement error models [13,35]. We mainly use this method to estimate the following two model forms (Equation (4): proportion method; Equation (5): summation method).
where , , , and represent the aboveground biomass and residuals of culms, branches, and leaves, respectively. The meanings of the other variables are described in Equation (2).
2.5. Selection of Predictor Variables
According to the number of variables contained in , we divided the model into one, two, and three predictor variables. By comparing the effects of the six variables on the biomass of different components of bamboo forest, we selected the variables with significant effects to develop the model. The common form of the allometric growth equation was selected by [36].
Five indicators were used to evaluate the significance of variables: mean residual (), variance (), root mean square error (RMSE), determination coefficient (R2), and total relative error (TRE) (Equations (6)–(10)). In addition, the fitted model also requires stable parameters (t value of the estimated value of the parameter > 2 or the coefficient of variation (CV) < 50%) and a random residual distribution (the positive and negative residuals of each diameter order were offset, and 0 was used as the reference line and distributed symmetrically below). Therefore, the stability of parameter estimation in this study mainly refers to the CV. Some studies have proposed that the parameter estimation is unbiased when the sample size is 50 [37,38,39]. In the study of bamboo forest biomass, Yang (2016) and Guo et al. (2015) established biomass models using the measured data of 32 and 25 Moso bamboos, respectively [40,41]. Therefore, the sample data size estimation in this study was unbiased.
where is the measured value of the ith bamboo biomass and represents the estimated value of the ith bamboo biomass. is the average of the samples, and N is the number of observations.
2.6. Heteroscedasticity
The biomass model is a heteroscedastic model. Heteroscedasticity must be eliminated when nonlinear joint estimation is used. The weighted regression method was used to eliminate heteroscedasticity. We used and as weight functions.
2.7. Model Evaluation
Five indicators (Equations (6)–(10)) are mainly used to evaluate the prediction ability of biomass simultaneous equations. In this study, a leave-one-out cross-validation (LOOCV) method was used to verify the model. The LOOCV method deletes one bamboo at a time and uses the remaining data for fitting, and the fitted equation is used to predict the deleted bamboo value. This is repeated 66 times and each index is calculated using the predicted and observed values. NEIVM methods were calculated using the software ForStat 3.0 [34], and NSUR was calculated using the R Software (version 4.1.0) systemfit package.
3. Results
By comparing the six independent variables, we found that DBH, H, BD, and HCB had significant effects on the total aboveground biomass and component biomass (Figure 2). Because DBH and BD have strong collinearity, only one was considered in this study. Therefore, using three variables (DBH, H, and HCB), we developed a one-predictor system with only DBH, a two-predictor system with DBH and H, and a three-predictor system with DBH, H, and HCB. Table 2 shows the parameters of the basic model.
3.1. One-Predictor System of Biomass Equations
The parameter estimates of the bamboo components based on different estimation methods (one-step, two-step, proportion, and summation methods) are shown in Table 3. The CV of the system parameters of each model was less than 50% and the parameters were stable. The evaluation indicators are presented in Table 4. These estimation methods have a common premise: ensuring that the sum of the biomass of each component is equal to the total biomass. The fitting indicators of the four methods are almost the same; however, the fitting effect of NEIVM’s one-step method is slightly better than that of the two-step method, and the proportional method of NSUR is better than the summation method (larger R2 and smaller TRE and RMSE). Among the four methods, the NEIVM one-step method exhibited the best fit. Thus, the NEIVM one-step method was selected as the best one-predictor system for predicting the aboveground biomass and its three components.
3.2. Two-Predictor System of Biomass Equations
The model parameter estimates for the two prediction variables using the four estimation methods are listed in Table 5. The CV of the system parameters of each model was less than 50% and the parameters were stable. The model-fitting indicators are listed in Table 6. The evaluation indicators of each component are slightly different under the calculation of the four different estimation methods. Overall, the fitting index of the NEIVM one-step model was slightly better than those of the other models. Under the same estimation method, the fitting accuracy was as follows: above ground > bamboo culm > bamboo branch > bamboo leaf. The NEIVM one-step method had a larger and smaller TRE and RMSE. Therefore, we chose the NEIVM one-step method as the best two-predictor equation system for predicting bamboo biomass and its three components.
3.3. Three-Predictor System of Biomass Equations
The parameter estimates of the simultaneous models of the bamboo components based on the different estimation algorithms are listed in Table 7. The CV of the system parameters of each model was less than 50% and the parameters were stable. The evaluation indicators for the simultaneous models are listed in Table 8. For the TSEM estimation, the model-fitting accuracies of the one-step and two-step models were similar, but the form of the one-step model is relatively simple; therefore, the one-step model was selected. The fitting accuracy of the NSUR proportional method was better than that of the summation method. The values of the NEIVM one-step and NSUR proportional methods were slightly higher than those of other models. However, the differences between the other indices were not substantial. In summary, we chose the NEIVM one-step and NSUR proportional methods as the three best prediction equation systems for predicting the aboveground biomass and its components.
3.4. Model Evaluation
Using leave-one-out cross-validation (LOOCV), we evaluated the biomass system of one-, two-, and three-predictors selected above. The statistical indicators of each equation for the biomass system are shown in Table 9. The one-predictor and three-predictor systems (NSUR proportional method) showed a slight underestimation of aboveground, culm, and leaf biomass; the other models showed a slight overestimation of aboveground and other component biomasses. The mean residual for each biomass system was very small. The fitting accuracy of each index of the biomass system of the three predictors (NEIVM one-step estimate) was better than that of the other model systems (was larger, and RMSE and TRE were smaller). For example, the R2 values of the culm, branch, leaf, and AG (total aboveground) were greater than those of the two predictors, which were 0.79%, 1.31%, 1.89%, and 0.59%, respectively. These results show that the three predictors using the NEIVM one-step method are more accurate than those using the other equations. Therefore, we chose the three predictors using the NEIVM one-step method to predict the aboveground biomass and its components in Moso bamboo in southern China.
3.5. Model Evaluation
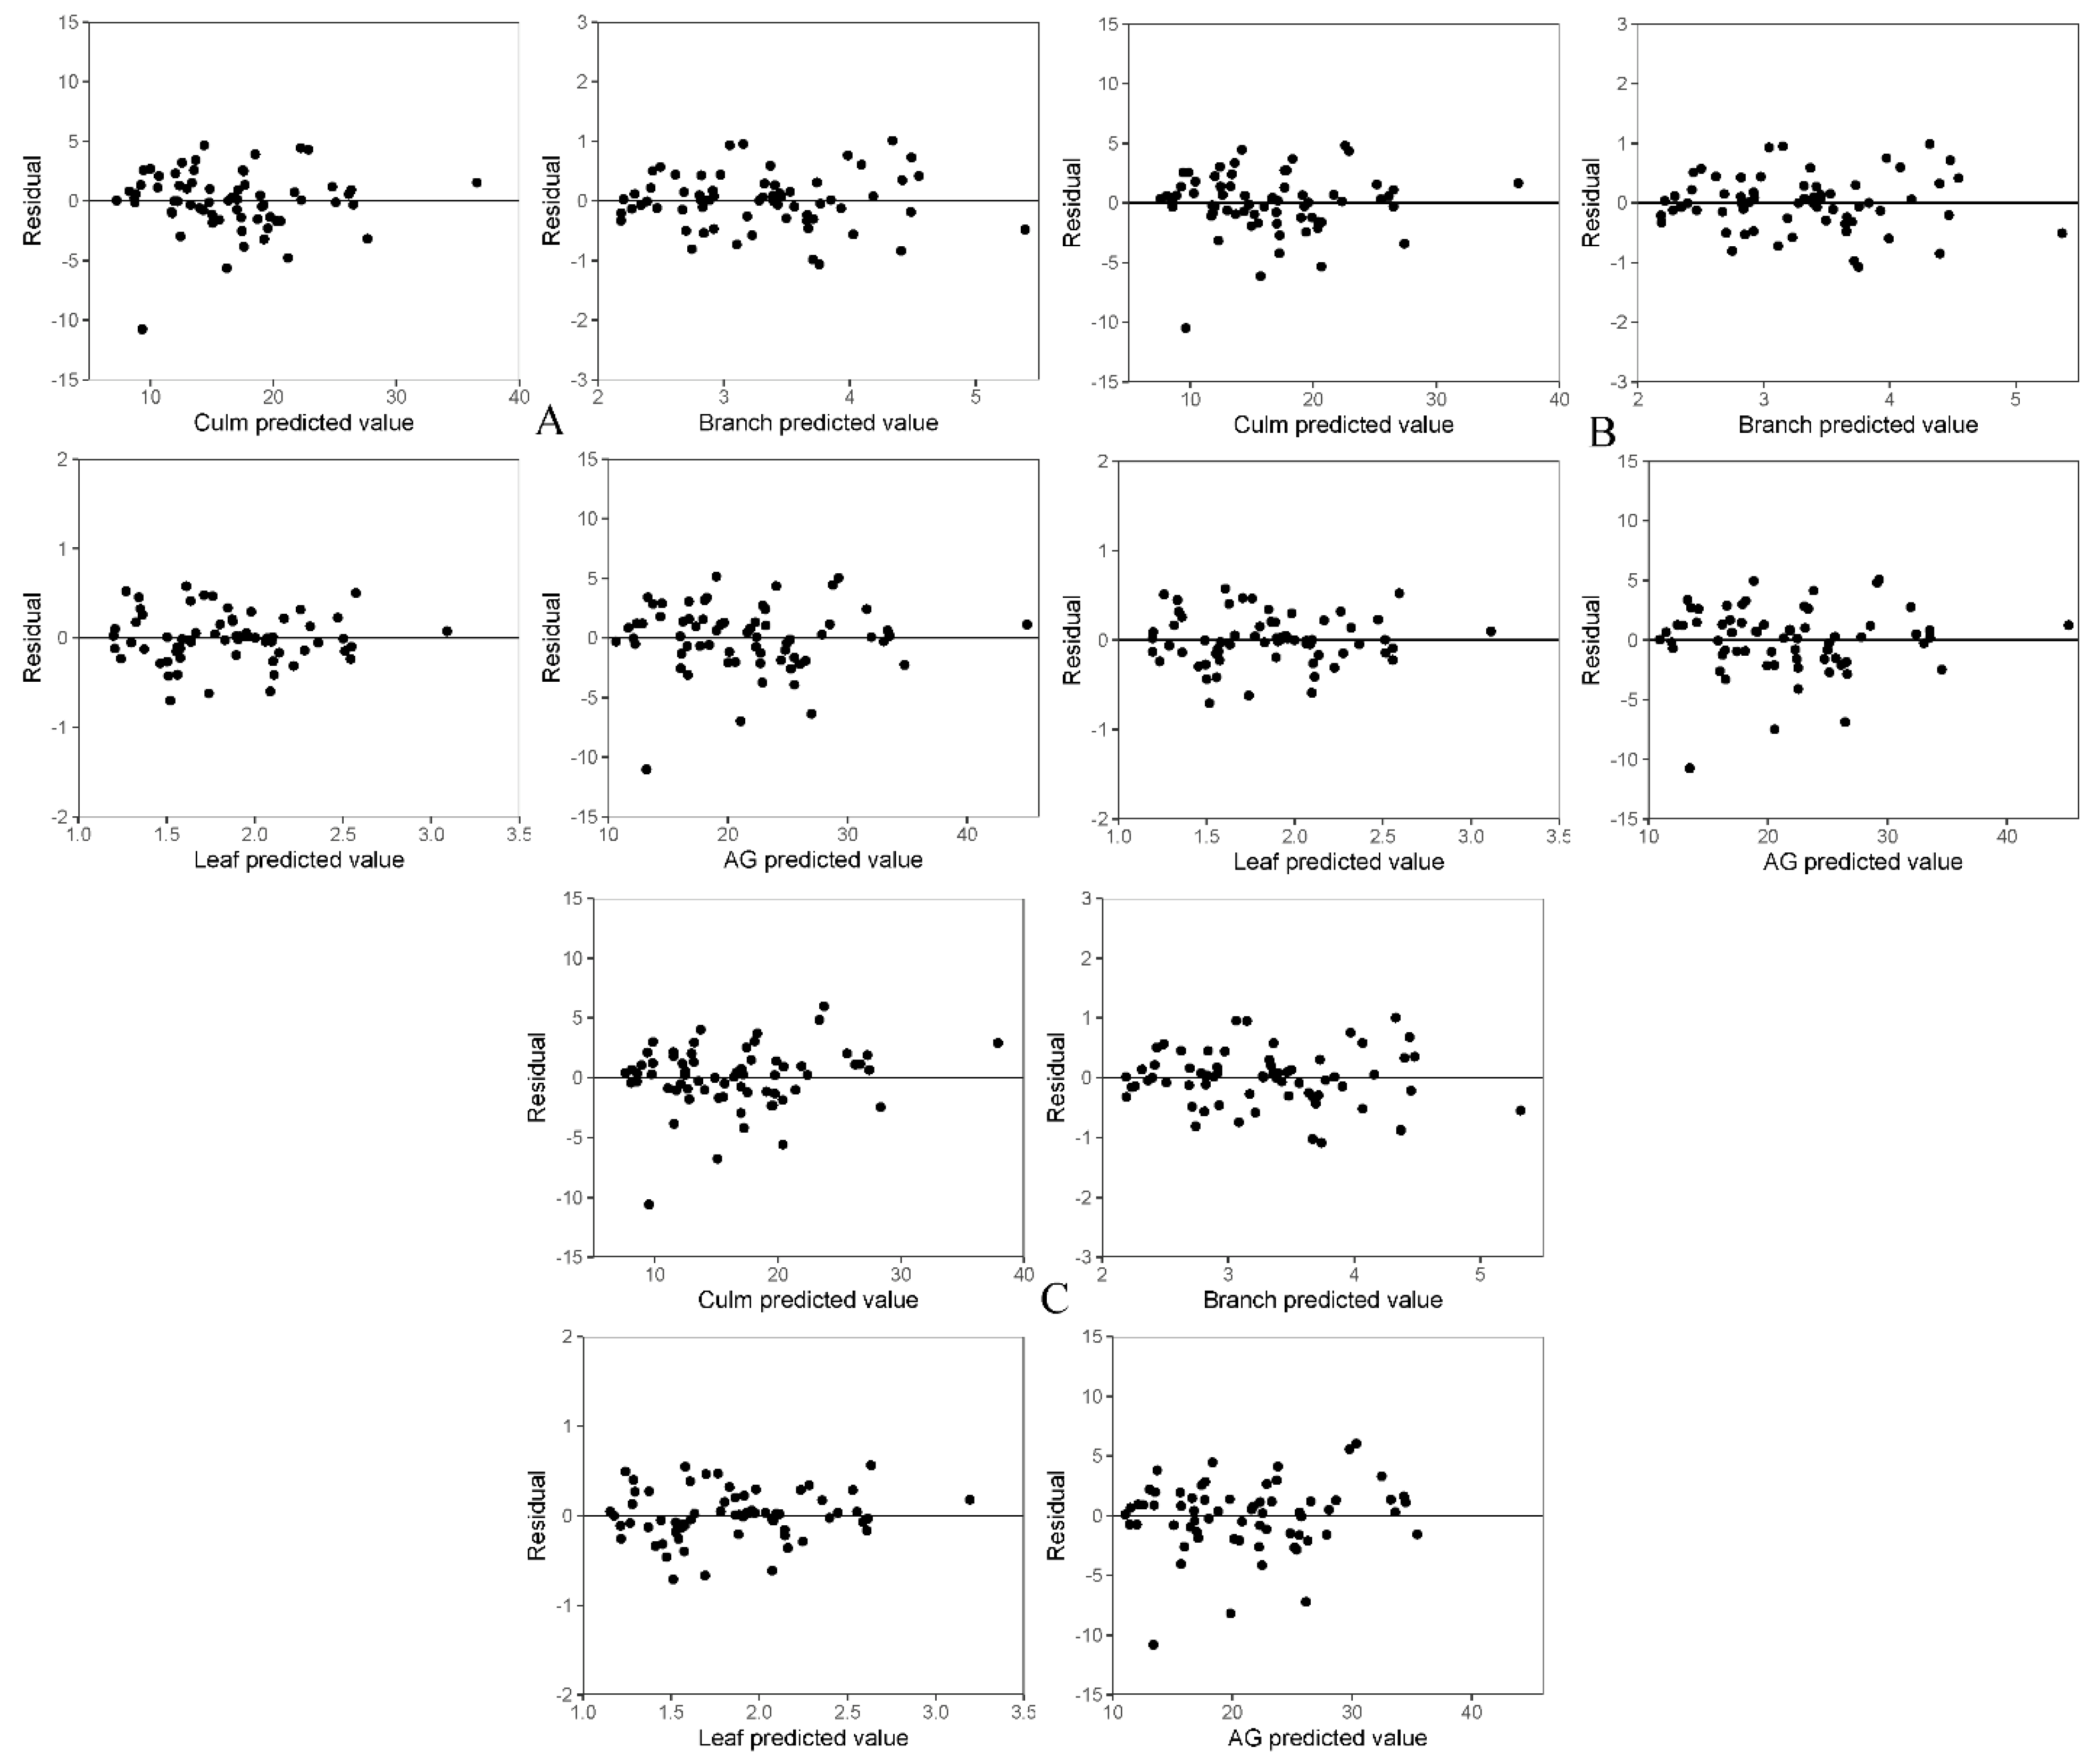
Figure 3 shows the residual distribution of the no-use weight function and the weight function. Using the weight function , the original heteroscedasticity in the model can be eliminated (Figure 3C). When using the weight function to eliminate heteroscedasticity, the residual distribution was the same as that of the original function (Figure 3B). Therefore, the following equation, , is recommended as a weight function to eliminate heteroscedasticity. Therefore, it is feasible to use a weight function to eliminate heteroscedasticity in this study.
The one-, two-, and three-prediction variable model systems estimated by the NEIVM one-step method proposed in this study can calculate the aboveground biomass and that of each component. Under the same site conditions as the study area, the stand density was 2000–3500 and the average DBH was 8–10 cm. The biomass value required by the operator can be obtained from the collected bamboo forest factors combined with the model form in this study.
4. Discussion
In this study, four commonly used measurement error model estimation methods were used to establish the aboveground biomass and compatibility model between the components of Moso bamboo. These estimation methods are obtained through nonlinear joint estimation, and the parameters are estimated to ensure compatibility between the components [16,42]. They not only ensured the additivity between different biomass components, but also considered the internal correlation between components (i.e., bamboo crown = bamboo branch + bamboo leaf).
In this study, we used the ratio of aboveground biomass on each component as the basic model (direct control method), and the model parameters were estimated by NEIVM in one step. According to the investigation and demonstration, it was found that this method is more in line with the law of biomass distribution and estimated by the NEIVM two-step method, which may lead to over-prediction of some bamboo leaves and branches. In this study, the fitting result of the one-step method was slightly better than that of the two-step method regardless of the number of prediction variables (Table 4, Table 6, and Table 8). This is similar to the findings of Zeng and Tang [16,32]. This may be because, according to the law of error propagation, the greater the number of layers in the equations, the greater the error accumulation and the greater the difference in the estimated values of biomass parameters with finer classification [43].
Table 4, Table 6, and Table 8 show that for the one-predictor system, the fitting indexes of each component estimated by NSUR and NEIVM are similar, but the fitting indexes of branch and leaf biomass equations of the two-predictor and three-predictor systems are quite different. This may be related to the fitting ability of NSUR. It may lead to non-convergence of parameter estimation, mainly because the convergence of the iterative optimization algorithm (i.e., Gauss–Newton) used in its calculation depends on the initial value given [13]. When NEIVM estimates the model system, the convergence problem will not occur [34].
Some studies have shown that age is an important variable in bamboo forests [9]. However, we took this into consideration in this study and discovered that its impact was not significant. Therefore, age is not considered in this study.
In this study, NEIVM modeled and solved the components jointly, which ensured the compatibility between the biomass of each component and obtained a more optimized parameter estimation. In summary, the total amount control simultaneous equations method (one step) is better than the other methods in terms of fitting accuracy and model stability. The prediction accuracy of this method is verified using the LOOCV method (Table 9).
Six variables (DBH, H, HCB, NL, BD, and A) were used as candidate factors to construct the compatibility model. Through the analysis and evaluation of each factor, it was discovered that diameter at breast height (DBH) had the greatest impact, followed by height. Parresol and Zeng also revealed similar results [13,32]. In studies of bamboo forests, HCB is a key index for evaluating the vitality and quality of bamboo [44,45]. Therefore, we chose DBH; DBH and H; and DBH, H, and HCB as predictors for the one-, two-, and three-predictor systems, respectively. Therefore, we compared the prediction results of the one-predictor, two-predictor, and three-predictor systems in each method (Table 4, Table 6, and Table 8). The prediction accuracy of the three-predictor system corresponding to each component was the highest, followed by the two-predictor and the one-predictor system. Theoretically, the greater the number of prediction factors, the higher the model’s accuracy. However, in our study, we found differences among the system models, but these differences were very small. Therefore, the three-predictor system considered in this model can be used in practical applications.
The TSEM one-step, two-step, and NSUR proportional methods calculate AG biomass first, and then distribute it to each component; however, the summation method of NSUR calculates each component first, and then sums it. In forestry practice, the goal is to obtain the whole plant or aboveground biomass [46,47]. Therefore, it is more practical to choose a biomass model estimated using the TSEM one-step method.
Owing to the operational needs of this area, there was no bamboo older than 4 degrees in the bamboo forest. If bamboo older than 4 degrees is included in the calculation, there may be a certain deviation in the calculation of the biomass. When the site conditions to be calculated are similar to those of this study (stand density of 2000–3500 and the average DBH of 8–10 cm), the model can be used directly for calculation.
However, the application of biomass models has limitations in terms of scale or region. Moso bamboo grown in different regions often exhibits differences in stem shape and biomass distribution. When the biomass model established on a small scale or in a small watershed is extrapolated to a larger scale or regions, samples need to be collected for model verification and parameter adjustment.
5. Conclusions
In this study, based on the measured data of the aboveground biomass of Moso bamboo in the Yixing state-owned forest farm of Jiangsu Province, a biomass equation was constructed using NEIVM and NSUR estimation models. NEIVM (one-step and two-step) and NSUR (proportional and summation methods) were adopted to ensure additivity between the components. We found that DBH, H, and HCB had significant effects on aboveground and component biomass. We developed a one-predictor system using D, two-predictor system using DBH and H, and a three-predictor system using DBH, H, and HCB. The accuracy of the one-step NEIVM method is better than that of the two-step method, regardless of the number of prediction variables used. The accuracy of each biomass system was verified using the leave-one-out cross-validation method. The heteroscedasticity in the equation is eliminated by the weight function. We recommend using a three-predictor system estimated by NEIVM to construct a biomass equation for Moso bamboo.
Author Contributions
X.Z. (Xiao Zhou), X.Z. (Xuan Zhang), C.L., X.X. and F.G. collected data; X.Z. (Xiao Zhou) and Y.Z. analyzed data; X.Z. (Xiao Zhou), Y.Z. and F.G. wrote manuscript and contributed critically to improve the manuscript and gave a final approval for publication. All authors have read and agreed to the published version of the manuscript.
Funding
This research was supported by the Basic scientific research funding of International Center for Bamboo and Rattan (Grant No. 1632021009).
Acknowledgments
We would like to thank the Basic scientific research funding of International Center for Bamboo and Rattan (Grant No. 1632021009) for the financial support of this study.
Conflicts of Interest
The authors declare no conflict of interest.
References
- Lobovikov, M.; Schoene, D.; Lou, Y. Bamboo in climate change and rural livelihoods. Mitig. Adapt. Strateg. Glob. Chang. 2012, 17, 261–276. [Google Scholar] [CrossRef]
- Song, X.; Zhou, G.; Jiang, H.; Yu, S.; Fu, J.; Li, W.; Wang, W.; Ma, Z.; Peng, C. Carbon sequestration by Chinese bamboo forests and their ecological benefits: Assessment of potential, problems, and future challenges. Environ. Rev. 2011, 19, 418–428. [Google Scholar] [CrossRef] [Green Version]
- He, C.Y.; Cui, K.; Zhang, J.G.; Duan, A.G.; Zeng, Y.F. Next-generation sequencing- based mRNA and microRNA expression profiling analysis revealed pathways involved in the rapid growth of developing culms in Moso bamboo. BMC Plant Biol. 2013, 13, 119. [Google Scholar] [CrossRef] [PubMed] [Green Version]
- Li, Z.C.; Fu, M.Y.; Xu, D.Y. Bamboo ecosystem and carbon dioxide Sequestration. J. Bamboo Res. 2003, 22, 1–6. (In Chinese) [Google Scholar]
- Whittaker, R.H.; Woodwell, G.M. Measurement of NPP of forests. In Productivity of Forest Ecosystems; Duvigneaud, P., Ed.; UNESCO: Paris, France, 1971; pp. 159–175. [Google Scholar]
- Esser, G. The signi6cance of biospheric carbon pools and >uxes for the atmospheric CO2: A proposal mode structure in progress in Biometerology. Prog. Biometeorol. 1984, 3, 253–294. [Google Scholar]
- Ohrnberger, D. The Bamboos of the World: Annotated Nomenclature and Literature of the Species and the Higher and Lower Taxa; Elsevier: Amsterdam, The Netherlands, 1999. [Google Scholar]
- Zhou, B.Z.; Fu, M.-Y.; Xie, J.Z.; Yang, X.-S.; Li, Z.-C. Ecological functions of bamboo forest: Research and Application. J. For. Res. 2005, 16, 143–147. [Google Scholar]
- Zhou, G.M. Carbon Storage, Fixation and Distribution in Mao Bamboo (Pjyllostachys pubescens) Stands Ecosystem. Ph.D. Thesis, ZheJiang University, Hangzhou, China, 2006. (In Chinese). [Google Scholar]
- Willebrand, E.; Eedin, S.; Verwijst, T. Willow coppice systems in short rotation forestry: Effects of plant spacing, rotation length and clonal composition on biomass production. Biomass Bioenergy 1993, 4, 323–331. [Google Scholar] [CrossRef]
- Verwijst, T.; Telenius, B. Biomass estimation procedures in short rotation forestry. For. Ecol. Manag. 1999, 121, 137–146. [Google Scholar] [CrossRef]
- Zellner, A. An efficient method of estimating seemingly unrelated regressions and tests for aggregation bias. J. Am. Stat. Assoc. 1962, 57, 348–368. [Google Scholar] [CrossRef]
- Parresol, B.R. Additivity of nonlinear biomass equations. Can. J. For. Res. 2001, 31, 865–878. [Google Scholar] [CrossRef]
- Bi, H.; Turner, J.; Lambert, M.J. Additive biomass equations for native eucalypt forest trees of temperate Australia. Trees 2004, 18, 467–479. [Google Scholar] [CrossRef]
- Bi, H.; Long, Y.; Turner, J.; Lei, Y.; Snowdon, P.; Li, Y.; Harper, R.; Zerihun, A.; Ximenes, F. Additive prediction of aboveground biomass for Pinus radiata (D. Don) plantations. Ecol. Manag. 2010, 259, 2301–2314. [Google Scholar] [CrossRef]
- Fu, L.; Lei, Y.; Wang, G.; Bi, H.; Tang, S.; Song, X. Comparison of seemingly unrelated regressions with error-in-variable models for developing a system of nonlinear additive biomass equations. Trees 2016, 30, 839–857. [Google Scholar] [CrossRef]
- Yen, T.M. Culm height development, biomass accumulation and carbon storage in an initial growth stage for a fast-growing moso bamboo (Phyllostachy pubescens). Bot. Stud. 2016, 57, 10. [Google Scholar] [CrossRef] [PubMed] [Green Version]
- Nath, A.J.; Das, G.; Das, A.K. Above ground standing biomass and carbon storage in village bamboos in North East India. Biomass Bioenergy 2009, 33, 1188–1196. [Google Scholar] [CrossRef]
- Fu, W.; Jiang, P.; Zhao, K.; Wu, J. The carbon storage in moso bamboo plantation and its spatial variation in Anji County of southeastern China. J. Soils Sediments 2014, 14, 320–329. [Google Scholar] [CrossRef]
- Zhou, G.M.; Liu, E.B.; Shi, Y.J.; Xu, X. Accurate Estimation for Moso Bamboo (Phyllostachys edulis) Biomass in Zhejiang Province Based on the Lowest Scale Technique. Sci. Silvae Sin. 2011, 47, 1–5. [Google Scholar]
- Wi, S.G.; Lee, D.S.; Nguyen, Q.A.; Bae, H.J. Evaluation of biomass quality in short-rotation bamboo (Phyllostachys pubescens) for bioenergy products. Biotechnol. Biofuels 2017, 10, 127. [Google Scholar] [CrossRef]
- Lin, M.Y.; Hsieh, I.F.; Lin, P.H.; Laplace, S.; Ohashi, M.; Chen, T.H.; Kume, T. Moso bamboo (Phyllostachys pubescens) forests as a significant carbon sink? A case study based on 4-year measurements in central Taiwan. Ecol. Res. 2017, 32, 845–857. [Google Scholar] [CrossRef]
- Parresol, B.R. Assessing tree and stand biomass: A review with examples and critical comparisons. For. Sci. 1999, 45, 573–593. [Google Scholar]
- Lei, X.; Zhang, H.; Bi, H. Additive aboveground biomass equations for major species in over-logged forest region in northeast China. In Proceedings of the IEEE 4th International Symposium on Plant Growth Modelling, Simulation, Visualization and Applications, Shanghai, China, 31 October–3 November 2011. [Google Scholar]
- Fu, L.; Liu, Q.; Sun, H.; Wang, Q.; Li, Z.; Chen, E.; Pang, Y.; Song, X.; Wang, G. Development of a System of Compatible Individual Tree Diameter and Aboveground Biomass Prediction Models Using Error-In-Variable Regression and Airborne LiDAR Data. Remote Sens. 2018, 10, 325. [Google Scholar] [CrossRef] [Green Version]
- Fuller, W.A. Measurement Error Models; Wiley: New York, NY, USA, 1987. [Google Scholar]
- Kangas, A.S. Effect of errors-in-variables on coefficients of a growth model and on prediction of growth. For. Ecol. Manag. 1998, 102, 203–212. [Google Scholar] [CrossRef]
- Tang, S.; Zhang, S. Measurement error models and their applications. J. Biomath. 1998, 13, 161–166. [Google Scholar]
- Tang, S.; Li, Y.; Wang, Y. Simultaneous equations, errors-in-variable models, and model integration in systems ecology. Ecol. Model 2001, 142, 285–294. [Google Scholar] [CrossRef]
- Tang, S.; Li, Y. Statistical Foundation for Biomathematical Models; Science Press: Beijing, China, 2002. (In Chinese) [Google Scholar]
- Carroll, R.; Ruppert, D.; Stefanski, L.A.; Crainiceanu, C.M. Measurement Error in Nonlinear Models: A Modern Perspective, 2nd ed.; Chapman & Hall/CRC Press: Boca Raton, FL, USA, 2006. [Google Scholar]
- Zeng, W.S.; Tang, S.Z. Using measurement error modeling method to establish compatible single-tree biomass equations system. For. Res. 2010, 23, 797–802, (In Chinese with English abstract). [Google Scholar]
- Tang, S.Z.; Li, Y. An algorithm for estimating multivariate non-linear error-in-measure models. J. Biomath. 1996, 11, 23–27. (In Chinese) [Google Scholar]
- Tang, S.Z.; Lang, K.J.; Li, H.K. Statistics and Computation of Biomathematical Models (ForStat Course); Science Press: Beijing, China, 2008. (In Chinese) [Google Scholar]
- Bi, H.; Birk, E.; Turner, J.; Lambert, M.; Jurskis, V. Converting stem volume to biomass with additivity, bias corrections and confidence bands for two Australian tree species. N. Z. J. For. Sci. 2001, 31, 298–319. [Google Scholar]
- Ruark, G.A.; Martin, G.L.; Bockheim, J.G. Comparison of constant and variable allometric ratios for estimating populus tremuloides biomass. For. Sci. 1987, 33, 294–300. [Google Scholar]
- Goldstein, H. Multilevel Statistical Models, 3rd ed.; Arnold: London, UK, 2003. [Google Scholar]
- Hox, J.J. Multilevel Analysis: Techniques and Applications; Erlbaum: Mahwah, NJ, USA, 2002. [Google Scholar]
- Maas, C.J.M.; Hox, J.J. Sufficient sample sizes for multilevel modeling. Methodology 2005, 1, 86–92. [Google Scholar] [CrossRef] [Green Version]
- Yang, X.H. A Study on Per Plant Aboveground Biomass Compatible Models for Phyllostachy Edulis. Master’s thesis, Beijing Forestry University, Beijing, China, 2016. (In Chinese). [Google Scholar]
- Guo, X.Y.; Sun, Y.J.; Liu, J. Compatible single-tree biomass models with measurement error for moso bamboo. Acta Agric. Univ. Jiangxiensis 2015, 37, 849–858. (In Chinese) [Google Scholar]
- Tang, S.Z.; Zhang, H.R.; Xu, H. Study on establish and estimate method of compatible biomass model. Sci. Silvae Sin. 2000, 36, 19–27. (In Chinese) [Google Scholar]
- Feng, Z.K.; Liu, Y.X. Precision analysis of forest biomass measurements. J. Beijing For. Univ. 2005, S2, 108–111. [Google Scholar]
- Pan, L.; Mei, G.Y.; Wang, Y.F.; Saeed, S.; Chen, L.; Cao, Y.; Sun, Y. Generalized nonlinear mixed-effect model of individual tree height to crown base for Larix Olgensis Henry in Northeast China. J. Sustain. For. 2020, 39, 827–840. [Google Scholar] [CrossRef]
- Zhang, H.X.; Zhuang, S.; Sun, B.; Ji, H.; Li, C.; Zhou, S. Estimation of biomass and carbon storage of moso bamboo (Phyllostachys pubescens Mazel ex Houz.) in southern China using a diameter-age bivariate distribution model. Forestry 2014, 87, 674–682. [Google Scholar] [CrossRef] [Green Version]
- Dong, Y.F.; Kuang, X.X.; Qin, N.H.; Sang, Y. Effects of initial planting spacing on growth and above-ground biomass of poplous plantation. J. Northeast For. Univ. 2015, 43, 30–33. (In Chinese) [Google Scholar]
- Liu, X.H.; Jiang, C.Q.; Xu, R.; He, X.; Qi, M. Comparison of methods to construct individual tree biomass models: A case study of Cyclobalanopsis glauca. Sci. Silvae Sin. 2020, 56, 164–173. (In Chinese) [Google Scholar]
Figure 1.
Sampling location map of bamboo forest biomass.

Figure 2.
Relationship between total aboveground (AG) biomass and each component (culm, branch, and leaf) of six bamboo variables, including diameter at breast height (DBH), bamboo height (H), height to crown base (HCB), node length at DBH (NL), base diameter (BD), and bamboo age (A); r is the correlation between predictive variables and biomass of different components; the p value between each variable is less than 0.001.

Figure 3.
Based on the leave-one-out cross-validation method, the residual diagram of aboveground and component biomass drawn with the predicted value of the three predictors by using NEIVM one-step method. (A) Represents the residual diagram of the three predictors using the NEIVM one-step method, and (B,C) represent the residual diagrams of eliminating heteroscedasticity through and as weight functions, respectively.


Table 1.
Statistics of bamboo biomass variables.
| Variables | Minimum | Maximum | Mean | Standard Deviation |
|---|---|---|---|---|
| DBH (cm) | 6.8500 | 13.8500 | 9.4590 | 1.5106 |
| H (m) | 8.5300 | 17.4000 | 13.1600 | 1.5661 |
| HCB (m) | 3.2600 | 8.7100 | 5.9890 | 1.1731 |
| A (degree) | 1.0000 | 4.0000 | 2.200 | 0.9640 |
| NL (cm) | 17.3000 | 28.2000 | 21.8600 | 2.2682 |
| BD (cm) | 7.8500 | 15.6300 | 11.0700 | 1.7054 |
| Culm (kg) | 6.8690 | 35.010 | 16.4420 | 6.1108 |
| Branch (kg) | 1.9290 | 5.8720 | 3.2820 | 0.8217 |
| Leaf (kg) | 0.7479 | 3.0143 | 1.8407 | 0.4901 |
| AG (kg) | 9.9010 | 43.8960 | 21.5650 | 7.2138 |
Notes: diameter at breast height (DBH), bamboo height (H), height to crown base (HCB), bamboo age (A), node length at DBH (NL), base diameter (BD), and total aboveground (AG) biomass.
Table 2.
Estimation of basic model parameters using a different number of predictive variables.
| One-Predictor | Two-Predictor | Three-Predictor | |
|---|---|---|---|
| AG | |||
| Culm | |||
| Branch | |||
| Leaf |
Table 3.
Parameter estimates for the one-predictor systems of biomass equations.
| Equation System | Component | Fixed Parameters | ||
|---|---|---|---|---|
| a | b | CV (%) | ||
| NEIVM one step | Culm | 0.1599 | 2.0439 | 17.2305 |
| Branch | 0.1697 | 1.3096 | 14.0972 | |
| Leaf | 0.0837 | 1.3666 | 15.0497 | |
| NEIVM two step | Culm | 0.1634 | 2.0401 | 17.2301 |
| Branch | 0.3295 | 1.1194 | 14.0973 | |
| Leaf | 0.1625 | 1.1764 | 15.0497 | |
| NSUR-P | Culm | 0.1466 | 2.1493 | 17.5228 |
| Branch | 0.1713 | 1.3730 | 14.5962 | |
| Leaf | 0.0904 | 1.4007 | 15.8605 | |
| NSUR-S | Culm | 0.1684 | 2.0280 | 16.6988 |
| Branch | 0.1562 | 1.3515 | 13.8897 | |
| Leaf | 0.0743 | 1.4240 | 15.0906 | |
Notes: nonlinear, seemingly unrelated regression (NSUR); NSUR-P is the proportional method used to estimate the parameters by NSUR; NSUR-S is the summation method; nonlinear error-in-variable model (NEIVM); coefficient of variation (CV). a and b are parameter estimation.
Table 4.
Evaluation indicators of the one-predictor variable model system using different estimation methods.
Table 4.
Evaluation indicators of the one-predictor variable model system using different estimation methods.
| Component | Method | R2 | TRE | RMSE | |
|---|---|---|---|---|---|
| Bamboo culm | NEIVM-one step | 0.8046 | 2.4291 | 2.7219 | −0.0175 |
| NEIVM-two step | 0.8045 | 2.4349 | 2.7224 | −0.0037 | |
| NSUR-P | 0.8046 | 2.4286 | 2.7218 | −0.0146 | |
| NSUR-S | 0.8042 | 2.4339 | 2.7245 | −0.0255 | |
| Bamboo branch | NEIVM-one step | 0.7022 | 1.7881 | 0.4518 | −0.0004 |
| NEIVM-two step | 0.7008 | 1.8002 | 0.4529 | 0.0098 | |
| NSUR-P | 0.7020 | 1.7891 | 0.4520 | −0.0025 | |
| NSUR-S | 0.7016 | 1.7930 | 0.4523 | 0.0056 | |
| Bamboo Leaf | NEIVM-one step | 0.6902 | 2.0938 | 0.2749 | −0.0010 |
| NEIVM-two step | 0.6892 | 2.1040 | 0.2753 | 0.0041 | |
| NSUR-P | 0.6898 | 2.0958 | 0.2750 | −0.0029 | |
| NSUR-S | 0.6885 | 2.1074 | 0.2756 | 0.0038 | |
| Total aboveground | NEIVM-one step | 0.8314 | 2.9846 | 1.7288 | 0.0100 |
| NEIVM-two step | 0.8314 | 2.9846 | 1.7288 | 0.0100 | |
| NSUR-P | 0.8314 | 2.9844 | 1.7258 | −0.0200 | |
| NSUR-S | 0.8311 | 2.9870 | 1.7286 | −0.0161 |
Notes: mean residual (), root mean square error (RMSE); determination coefficient (R2); total relative error (TRE); nonlinear, seemingly unrelated regression (NSUR); NSUR-P is the proportional method used to estimate the parameters by NSUR; NSUR-S is the summation method; nonlinear error-in-variable model (NEIVM); coefficient of variation (CV).
Table 5.
Parameter estimates for the two-predictor systems of biomass equations.
| Equation System | Component | Fixed Parameters | |||
|---|---|---|---|---|---|
| a | b | c | CV (%) | ||
| NEIVM-one step | Culm | 0.0529 | 1.5475 | 0.8696 | 14.0623 |
| Branch | 0.1415 | 1.2121 | 0.1646 | 15.8615 | |
| Leaf | 0.0688 | 1.2618 | 0.1763 | 15.009 | |
| NEIVM-two step | Culm | 0.0528 | 1.5388 | 0.8794 | 14.0623 |
| Branch | 0.1407 | 1.2233 | 0.1499 | 15.8616 | |
| Leaf | 0.0684 | 1.2727 | 0.1621 | 15.0086 | |
| NSUR-P | Culm | −0.0012 | 1.8261 | 0.7126 | 16.7149 |
| Branch | −0.0029 | 1.4375 | 0.0823 | 15.0731 | |
| Leaf | −0.0012 | 1.3640 | 0.2578 | 16.4680 | |
| NSUR-S | Culm | 0.0518 | 1.5117 | 0.9065 | 15.4741 |
| Branch | 0.1530 | 1.4211 | −0.0529 | 14.0863 | |
| Leaf | 0.0508 | 1.1181 | 0.4157 | 13.6757 | |
Nonlinear, seemingly unrelated regression (NSUR); NSUR-P is the proportional method used to estimate the parameters by NSUR; NSUR-S is the summation method; nonlinear error-in-variable model (NEIVM); coefficient of variation (CV). a, b and c are parameter estimation.
Table 6.
Evaluation results of the biomass equation with two prediction variables.
| Component | Method | R2 | TRE | RMSE | |
|---|---|---|---|---|---|
| Bamboo culm | NEIVM-one step | 0.8344 | 2.0507 | 2.5057 | −0.0114 |
| NEIVM-two step | 0.8342 | 2.0524 | 2.5074 | −0.0430 | |
| NSUR-P | 0.8346 | 2.0491 | 2.5045 | −0.0098 | |
| NSUR-S | 0.8343 | 2.0517 | 2.5066 | −0.0154 | |
| Bamboo branch | NEIVM-one step | 0.7037 | 1.7792 | 0.4507 | 6.13 × 10⁻⁵ |
| NEIVM-two step | 0.7035 | 1.7813 | 0.4508 | 0.0031 | |
| NSUR-P | 0.7018 | 1.7917 | 0.4521 | −0.0009 | |
| NSUR-S | 0.6666 | 1.9984 | 0.4781 | 0.0041 | |
| Bamboo Leaf | NEIVM-one step | 0.6919 | 2.0822 | 0.2741 | −0.0008 |
| NEIVM-two step | 0.6917 | 2.0835 | 0.2742 | 9.69 × 10⁻⁵ | |
| NSUR-P | 0.6889 | 2.1046 | 0.2755 | 0.0013 | |
| NSUR-S | 0.6913 | 2.0814 | 0.2744 | −0.0013 | |
| Total aboveground | NEIVM-one step | 0.8552 | 1.4787 | 2.7660 | −0.0121 |
| NEIVM-two step | 0.8551 | 1.4788 | 2.7670 | −0.0397 | |
| NSUR-P | 0.8552 | 1.4791 | 2.7661 | −0.0094 | |
| NSUR-S | 0.8566 | 1.4646 | 2.7525 | −0.0126 |
Note: nonlinear, seemingly unrelated regression (NSUR); NSUR-P is the proportional method used to estimate the parameters by NSUR; NSUR-S is the summation method; nonlinear error-in-variable model (NEIVM); coefficient of variation (CV); mean residual (), root mean square error (RMSE); determination coefficient(R2); total relative error (TRE).
Table 7.
Parameter estimates for the three-predictor systems of biomass equations.
| Equation System | Component | Fixed Parameters | ||||
|---|---|---|---|---|---|---|
| a | b | c | d | CV (%) | ||
| NEIVM-one step | Culm | 0.0651 | 1.7926 | 0.6882 | −0.0822 | 15.8574 |
| Branch | 0.1482 | 1.4616 | 0.1047 | −0.1779 | 13.7621 | |
| Leaf | 0.0782 | 1.5111 | 0.0577 | −0.1343 | 15.2208 | |
| NEIVM-two step | Culm | 0.0373 | 1.7716 | 0.8251 | −0.1500 | 15.3539 |
| Branch | 0.2285 | 1.3803 | 0.1360 | −0.1553 | 14.2135 | |
| Leaf | 0.1198 | 1.4297 | 0.0890 | −0.1117 | 15.2208 | |
| NSUR-P | Culm | 0.5462 | 1.2560 | 0.3478 | −0.2594 | 17.3672 |
| Branch | 0.9548 | 0.7043 | 0.1187 | −0.4355 | 15.7943 | |
| Leaf | 0.7832 | 1.1205 | −0.7258 | 0.0386 | 17.8646 | |
| NSUR-S | Culm | 0.0486 | 1.3796 | 1.0644 | −0.0230 | 15.6681 |
| Branch | 0.4566 | 3.0008 | −1.6722 | −0.2994 | 24.4795 | |
| Leaf | 0.0662 | 0.4328 | 0.1472 | 1.0924 | 22.9157 | |
Notes: nonlinear, seemingly unrelated regression (NSUR); NSUR-P is the proportional method used to estimate the parameters by NSUR; NSUR-S is the summation method; nonlinear error-in-variable models (NEIVM); coefficient of variation (CV). a, b, c and d are parameter estimation.
Table 8.
Evaluation index of biomass equations with three prediction variables.
| Component | Method | TRE | RMSE | ||
|---|---|---|---|---|---|
| Bamboo culm | NEIVM-one step | 0.8345 | 2.0496 | 2.5050 | −0.0113 |
| NEIVM-two step | 0.8345 | 2.0497 | 2.5050 | −0.0110 | |
| NSUR-P | 0.8346 | 2.0488 | 2.5045 | −0.0106 | |
| NSUR-S | 0.8330 | 2.0560 | 2.5160 | −0.1046 | |
| Bamboo branch | NEIVM-one step | 0.7071 | 1.7586 | 0.4481 | −6.99 × 10⁻⁵ |
| NEIVM-two step | 0.7071 | 1.7586 | 0.4481 | −6.20 × 10⁻⁵ | |
| NSUR-P | 0.6986 | 1.8092 | 0.4546 | −0.0070 | |
| NSUR-S | 0.1022 | 5.4693 | 0.7844 | 0.1292 | |
| Bamboo Leaf | NEIVM-one step | 0.6930 | 2.0745 | 0.2736 | −0.0009 |
| NEIVM-two step | 0.6930 | 2.0745 | 0.2736 | −0.0009 | |
| NSUR-P | 0.6596 | 2.3128 | 0.2881 | 0.0159 | |
| NSUR-S | 0.3042 | 4.6487 | 0.4120 | 0.0113 | |
| Total aboveground | NEIVM-one step | 0.8554 | 1.4768 | 2.7642 | −0.0122 |
| NEIVM-two step | 0.8554 | 1.4768 | 2.7642 | −0.0123 | |
| NSUR-P | 0.8553 | 1.4786 | 2.7651 | −0.0016 | |
| NSUR-S | 0.8591 | 1.4444 | 2.7283 | 0.0359 |
Notes: nonlinear, seemingly unrelated regression (NSUR); NSUR-P is the proportional method used to estimate the parameters by NSUR; NSUR-S is the summation method; nonlinear error-in-variable models (NEIVM); coefficient of variation (CV); mean residual (), root mean square error (RMSE); determination coefficient (R2); total relative error (TRE).
Table 9.
The evaluation results for the one-, two-, and three-prediction variable model systems estimated by the NEIVM one-step method and three-prediction variable model systems esti-mated by the NSUR using a leave-one-out cross-validation method.
Table 9.
The evaluation results for the one-, two-, and three-prediction variable model systems estimated by the NEIVM one-step method and three-prediction variable model systems esti-mated by the NSUR using a leave-one-out cross-validation method.
| Method | Component | R2 | TRE | RMSE | |
|---|---|---|---|---|---|
| One-predictor | |||||
| NEIVM one-step | Culm | 0.7950 | 2.5490 | 2.7878 | −0.0125 |
| Branch | 0.6801 | 1.9251 | 0.4683 | −0.0003 | |
| Leaf | 0.6698 | 2.2315 | 0.2838 | −0.0017 | |
| AG | 0.8233 | 1.8101 | 3.0553 | −0.0146 | |
| Two-predictor | |||||
| NEIVM one-step | Culm | 0.8111 | 2.3430 | 2.6766 | 0.0132 |
| Branch | 0.6589 | 2.0634 | 0.4835 | 0.0086 | |
| Leaf | 0.6565 | 2.3276 | 0.2894 | 1.53 × 10⁻⁵ | |
| AG | 0.8342 | 1.6975 | 2.9597 | 0.0219 | |
| Three-predictor | |||||
| NEIVM one-step | Culm | 0.8175 | 2.2685 | 2.6302 | 0.0172 |
| Branch | 0.6675 | 2.0042 | 0.4775 | 0.0008 | |
| Leaf | 0.6687 | 2.2466 | 0.2843 | −0.0012 | |
| AG | 0.8391 | 1.6501 | 2.9159 | 0.01678 | |
| NSUR-P | Culm | 0.8107 | 2.3484 | 2.6794 | 0.0087 |
| Branch | 0.6882 | 1.8379 | 0.4623 | −0.0331 | |
| Leaf | 0.6373 | 2.4741 | 0.2974 | 0.0056 | |
| AG | 0.8383 | 1.6499 | 2.9222 | −0.0188 |
Notes: nonlinear, seemingly unrelated regression (NSUR); NSUR-P is the proportional method used to estimate the parameters by NSUR; NSUR-S is the summation method; nonlinear error-in-variable models (NEIVM); coefficient of variation (CV); mean residual (), (RMSE); determination coefficient (R2); total relative error (TRE).
Publisher’s Note: MDPI stays neutral with regard to jurisdictional claims in published maps and institutional affiliations. |
© 2022 by the authors. Licensee MDPI, Basel, Switzerland. This article is an open access article distributed under the terms and conditions of the Creative Commons Attribution (CC BY) license (https://creativecommons.org/licenses/by/4.0/).
Share and Cite
MDPI and ACS Style
Zhou, X.; Zheng, Y.; Guan, F.; Xiao, X.; Zhang, X.; Li, C. Compatible Biomass Model of Moso Bamboo with Measurement Error. Forests 2022, 13, 774. https://0-doi-org.brum.beds.ac.uk/10.3390/f13050774
AMA Style
Zhou X, Zheng Y, Guan F, Xiao X, Zhang X, Li C. Compatible Biomass Model of Moso Bamboo with Measurement Error. Forests. 2022; 13(5):774. https://0-doi-org.brum.beds.ac.uk/10.3390/f13050774
Chicago/Turabian StyleZhou, Xiao, Yaxiong Zheng, Fengying Guan, Xiao Xiao, Xuan Zhang, and Chengji Li. 2022. "Compatible Biomass Model of Moso Bamboo with Measurement Error" Forests 13, no. 5: 774. https://0-doi-org.brum.beds.ac.uk/10.3390/f13050774
Note that from the first issue of 2016, this journal uses article numbers instead of page numbers. See further details here.