
How to Improve Forest Carbon Sequestration Output Performance: An Evidence from State-Owned Forest Farms in China


School of Economics and Management, Beijing Forestry University, Beijing 100083, China
*
Authors to whom correspondence should be addressed.
Forests 2022, 13(5), 778; https://0-doi-org.brum.beds.ac.uk/10.3390/f13050778
Submission received: 24 April 2022
/
Revised: 11 May 2022
/
Accepted: 14 May 2022
/
Published: 18 May 2022
(This article belongs to the Special Issue Circular Bioeconomy in Forest-Based Sector: Governance and Policy)
Abstract
:China’s state-owned forest farms are the basic sectors of forestry production, and their carbon cycle functions, such as timber processing and forest carbon sequestration, are of great significance to the national emission reduction strategy. By three-stage DEA and Tobit models, this paper measures the carbon sequestration output efficiency of 3706 state-owned forest farms involved in China’s National Forestry and Grassland Administration’s 2008–2018 survey. We figure out how the mechanism on the carbon sequestration impacts output efficiency of these forest farms and analyze the temporal trends and spatial distributions of their outputs in various regions. Our results indicate that the overall output efficiency of state-owned forest farms in China is relatively low compared with the international advanced level and show that distinctive north-south regional differences exist. Specifically, the carbon storage of the state-owned forest farms in Northeast China and Inner Mongolia occupies more than half of the carbon storage of total amounts, but their output efficiency is unsatisfactory. Conversely, the forest farms in Southwest China have a medium amount of carbon storage and the highest output efficiency. After improving the external environments of these farms, the efficiency value in each province appears as a significant increment. Moreover, the effects of afforestation, timber harvests, the under-forest economy, and other operating behaviors exhibit regional heterogeneity to some extent. Therefore, this paper advocates reforming the current forest cultivation strategy that emphasizes afforestation and neglects management, and relevant government departments are supposed to adjust operations according to local conditions to promote sustainable forest management.
1. Introduction
Forest carbon sequestration is the most economic strategy of carbon absorption that plays a vital role in addressing climate change [1,2,3]. Since the 1970s, China has implemented large-scale artificial afforestation and forest protection projects, continuously increasing forested areas and playing an important role in carbon sequestration [4,5]. China approved the Paris Climate Agreement in 2016, assuming the responsibility of reducing greenhouse gas emissions as a responsible country. In recent years, the Chinese government has taken practical actions to address its commitments and has introduced a series of legal frameworks, policies, and action plans related to carbon reduction and fixation, with some achievements. Meanwhile, China highlights the important function of forests in the carbon cycle. At present, China has 220 million hectares of forest area and 17.56 billion cubic meters of forest volume, and forest coverage has reached 22.96% of the country [6]. With China becoming the country with the largest and fastest increase in global forest resources, the forests have experienced 30 years of continuous growth in both area and volume. In 2020, at the 75th United Nations General Assembly, Chinese President Xi Jinping solemnly pledged to “strive to peak carbon dioxide emissions by 2030 and strive to achieve carbon neutrality by 2060” [7]. To achieve that, the Chinese government put forward a series of policies to promoting two goals: carbon peaking and carbon neutrality. It also clearly proposed a continuous improvement in carbon sequestration capacity. The above behaviors fully reflect China’s commitment to promote green development.
Under the carbon peaking and carbon neutrality goals, the low carbon and sustainable development of forestry have attracted extensive attention. In earlier years, the forest sector began to transition from a traditional economy to a circular economy [8,9]. A circular economy aims to find value throughout a product’s life cycle [10]. Fully exploiting the efficient utilization of resources in forestry production is crucial to the sustainable development of forestry. In the 1940s, to meet timber needs, the Chinese government began to establish state-owned forest farms nationwide. Then, until the end of the 20th century, with the implementation of the Natural Forest Protection Project, the development of state-owned forest farms gradually realized their ecological benefits [11]. By 2020, there were 4297 state-owned forest farms in the country, more than 95% of which were established as public welfare forest farms to protect and improve ecology. As the backbone of forest resource cultivation in China, state-owned forest farms can not only undertake the country’s main timber production but also provide a carbon cycle function. However, due to the differences in the natural environments, infrastructure construction, and operating behaviors of state-owned forest farms in different regions, the forest output levels of forest farms in different regions are also quite different. Therefore, combined with China’s strategic goals, it is meaningful to improve forest carbon sequestration and economic output performance and explore the factors affecting output performance.
Estimating the carbon storage in forests is the basis for researching carbon sequestration potential, which usually relies on the biomass method to estimate the carbon storage of a forest. Many studies propose biomass methods such as method (MBM), biomass expansion factor (BEF) method, and continuous BEF method (CBM). They reveal the correlation between forest inventory data and biomass to help estimate carbon storage at the regional scale. They also improve the estimation accuracy [12,13,14,15]. In the past 20 years, the BEF method and CBM have been widely used to study carbon storage in forests [16,17]. To take into account the actual needs of regions and provinces, several studies are committed to building a stand biomass model at the provincial level by tree species [18,19]. Zhang and Wang [20] divided China into seven regions and established a biomass model of 25 tree species in 21 coniferous forests, broad-leaved forests, and mixed coniferous and broad-leaved forests in different zones to calculate the carbon storage in forests more accurately. This carbon storage estimation method is more suitable for a comparative study of carbon storage at the microlevel of provinces and cities.
With the enhancement of China’s environmental regulations and improvement in the carbon trading market, forestry carbon sequestration projects have become an important part of the carbon trading market. Their ecological and economic benefits have been attracting the attention of more and more researchers. Nowadays, there are abundant achievements in the research of forestry carbon sequestration efficiency at the macro-level [21,22], Most of them are based on data such as continuous forest resource inventory data and forestry statistical yearbooks. Lin and Ge [23] used the three-stage SBM model and the Malmquist–Luenberger index to measure and analyze China’s forest ecological and economic efficiency. On the microlevel, based on bamboo growers’ survey data, Ao et al. [24] proposed a three-stage data envelopment analysis (DEA) model to calculate the production efficiency of carbon sequestration in bamboo forests in Zhejiang Province.
Combined with the current strategic goal in China, the transition of forest-based enterprises to a sustainable circular economy is critical [25], and enhancing forest sequestration output in forestry production is a suitable model for the cyclic development of state-owned forest farms. Tong et al. [26] showed that short-term, high amounts of carbon storage in forests were generated in South China through a series of land-use policies for forest management. Koponen et al. [27] revealed that sustainably managed commercial forests can serve as energy reserves and act as areas of carbon sequestration. Ni et al. [28] found that increasing logging over the next 100 years will increase carbon sequestration so that forest carbon sequestration will not conflict with wood production. The timber production and forest carbon sequestration functions of state-owned forest farms are crucial to China’s carbon sequestration and emission reduction capacities. At the same time, the important role of forestland as an opportunity cost related to harvest production goals should not be ignored, which further reflects that operators must fully consider how to allocate planting space and make optimal harvesting decisions [29]. Gu et al. [30] found that strengthening management improved the economic benefits of the bamboo forest carbon sequestration project they studied.
The above research serves as a reference for improving the carbon sequestration output efficiency, sustainable forest management, and the decision-making of forestry-related enterprise managers. They also become the important motivations that inspire us to do this study. By far, China’s research on forestry production and carbon sequestration management is mainly concentrated at the provincial level. Few studies have focused on state-owned forest farms to analyze their output efficiency, spatial and temporal distribution patterns, and improvement directions. Due to the state-owned and public welfare attributes of state-owned forest farms, they play an important role in China’s current goals of carbon peaking and carbon neutrality. Therefore, it is of great significance to deeply analyze its output efficiency and adjust its operating strategy.
By sorting out the research background, we put forward three hypotheses. (1) The carbon sequestration and efficiency of state-owned forest farms in China have spatial distribution characteristics. Especially after the reform of state-owned forest farms in 2015, the carbon sequestration output efficiency of forest farms may change. (2) The effects of external environmental factors on carbon sequestration output and economic output may be different. (3) In different regions, whether the impact of certain internal operating behavior on the carbon sequestration output efficiency of the forest farm will have different significance, or even have the opposite effect. To test these hypotheses, this paper relies on a three-stage DEA model and combines the 2008–2018 data for China’s state-owned forest farms, calculating the output efficiency of these forest farms after the removal of external environmental factors. Based on it, we further analyze the mechanism through which external environmental factors and internal operating behaviors affect the output efficiency of forest farms through the second-stage stochastic frontier analysis (SFA) and panel Tobit model. The results will be conducive to China’s state-owned forest farms to increase carbon sequestration output and sustainable management.
2. Materials and Methods
2.1. Methodology
2.1.1. Carbon Storage Measurement Model
This study area encompasses state-owned forest farms nationwide. Because the dominant tree species are different in different areas, the carbon sequestration capacities of different tree species are also different. If only forest volume is considered when calculating the carbon storage on each state-owned forest farm, then there will be substantial errors. Each forest farm actively cultivates dominant tree species suitable for planting according to the natural conditions of the area where it is located. The first two dominant tree species occupy most of the forest volume on each farm and effectively represent the forest carbon sequestration capacity of each forest farm. Therefore, this paper calculates the carbon storage of each state-owned forest farm based on the forest accumulation biomass model established by Zhang and Wang. The study area contains 3706 state-owned forest farms in 25 provinces of China. According to the principles of having similar climatic conditions, natural geographical environments, and tree species distributions, China is divided into 6 regions. Northeast China includes three provincial units in Heilongjiang, Jilin, and Liaoning; North China includes three provincial units in Hebei, Inner Mongolia, and Shanxi; Northwest China includes three provincial units in Shaanxi, Ningxia, and Xinjiang; Central South China includes six provincial units in Jiangsu, Shandong, Anhui, Henan, Hubei, and Hunan; Southeast China includes six provincial units in Zhejiang, Jiangxi, Fujian, Guangdong, Guangxi and Hainan; and Southwest China includes 4 provincial units in Sichuan, Chongqing, Guizhou, and Yunnan.
The basic formula for the regression model of forest biomass per unit volume is
and the calculation formulas for forest carbon density and carbon storage are
where is the total biomass per unit area , referred to as biomass density, is the carbon storage per unit area , referred to as carbon density, and is the forest carbon storage . In this study, the carbon content coefficient is taken as 0.5, is the storage volume per unit area , is the forest area , and and are the model parameters.
The carbon storage model of a state-owned forest farm can be expressed as
where is the carbon storage of the forest farm in region, is the carbon storage of the first dominant tree species on forest farm, is the carbon storage of the second dominant tree species on forest farm, is the carbon storage except for the dominant tree species on forest farm, and , and are the forest carbon density of the first dominant tree species, the second dominant tree species and the forest carbon density other than the dominant tree species in the forest farm, respectively. , and are the forest area of the first dominant tree species, the forest area of the second dominant tree species, and the forest area other than the dominant tree species on the forest farm, respectively.
2.1.2. Three-Stage DEA Model
DEA is a classical method for measuring efficiency. Fried et al. [31] proposed a three-stage DEA model that combines the traditional DEA model with the SFA model. The key to the three-stage DEA model is that the environmental factors and statistical noise are eliminated in the second-stage SFA. This approach overcomes the disadvantage that the one-stage DEA method cannot measure the influence factors of the efficiency value, and the two-stage DEA method can only give the function form of the influence factors but cannot eliminate them. In this paper, the three-stage DEA model effectively eliminates the influence of social environmental factors such as a state-owned forest farm’s attributes, location, infrastructure, and statistical noise on the output efficiency value. Therefore, the results can more objectively and truly reflect the output efficiency value of carbon sequestration of each state-owned forest farm. This study involves the calculation of output efficiency in a cross-year time series. Based on the methods of Liu et al. [32], the same decision-making unit (DMU) at different times is regarded as different DMUs. The DMUs are placed under a unified frontier for the efficiency measurements, and then the output values of all DMUs are adjusted using the second stage SFA results. Finally, the adjusted output value and the initial input value are used to calculate the output efficiency value under a unified frontier. The results can be compared across periods.
Stage 1: Initial efficiency measurement. Based on the initial input-output data, the same DMU at different times is regarded as a different DMU, and the DEA efficiency is measured under a unified frontier. Given the different operating scales of the different state-owned forest farms and the large differences in their input and output levels, this paper uses a more realistic BBC model with variable returns at scale to estimate output efficiency [33]. In addition, compared with economic and carbon sequestration output, the labor input, land input, and capital investment of China’s state-owned forest farms cannot be easily changed. Improving operational efficiency and increasing the output of state-owned forest farms have also been goals since the reform of state-owned forest farms. Therefore, this paper uses the output-oriented BBC model to measure the output efficiency of each state-owned forest farm. The model is relatively mature at present; thus, the model principle will not be described.
Stage 2: The SFA method is used to analyze the slack variables of each DMU in the first stage. Fried et al. believed that the slack variables in the results of the first stage are affected by environmental factors, statistical noise, and management efficiency. Through the SFA in the second stage, the influence of three factors at the observation site is observed, and the influence of the environmental factors and statistical noise can be eliminated. In this paper, the output slack variable is used as the explained variable, the social environment factor indicators of the forest farm are used as the explanatory variable, and the SFA model is established as follows:
In the formula, represents the slack variable of the ith output of the jth DMU in period ; ; ; represents the p environmental variables of the jth DMU; represents the coefficient of the environmental variable to be estimated; represents the influence of the environmental variable on the output slack variable; and represents the mixed error term, and the terms are independent of each other.
Through the above regression results, all DMUs are adjusted to the same optimal external environment to eliminate the influence of environmental heterogeneity and output-oriented adjustment of the output of each DMU:
where are the adjusted and initial output values, respectively, and represents the parameter estimates of the environmental variables. Finally, the output values for the same external environment and random errors are obtained, and then, we calculate more objective output efficiency values.
Stage 3: The adjusted output efficiency is calculated. Based on the adjusted output values and initial input values, using the BBC model in the first stage, all DMUs are still placed under a unified frontier, and the actual efficiency values of the carbon sequestration output of state-owned forest farms are calculated. The efficiency values at this time are not affected by external environmental factors and random errors.
2.1.3. Panel Data Tobit Model
The output efficiency of state-owned forest farms is affected not only by social environmental factors but also by the internal operating behaviors of the farms. To improve the carbon sequestration efficiency of forest farms, it is necessary to identify and analyze the mechanisms and effects of various operating behaviors on the carbon sequestration efficiency of state-owned forest farms in different regions. The efficiency value range measured by the DEA model is [0, 1], which has the characteristics of nonnegative truncation as an explanatory variable. Using the ordinary least squares (OLS) method to estimate the limited dependent variable will lead to biased estimation results. Therefore, the Tobit model [34] is suitable for exploring the internal influencing factors of the output efficiency of state-owned forest farms. Previous studies have suggested that efficiency values calculated by the DEA method combined with the Tobit model can effectively identify the factors affecting efficiency. In the efficiency evaluations of forestry and environmental development, many studies have used the Tobit model to identify and evaluate the factors affecting its efficiency [35,36,37].
Technical efficiency (abbreviated to TE) refers to the optimal allocation state between input and output factors [38]. It can be decomposed into pure technical efficiency (abbreviated to PTE) and scale efficiency (abbreviated to SE). By definition, PTE is affected by factors such as management and technology, while SE is affected by scale factors. To analyze the influencing factors of operating behavior affecting the carbon sequestration output efficiency of state-owned forest farms, the PTE obtained in the third stage is used as the explained variable, and six internal operating behaviors are selected as explanatory variables. Tobit models are constructed for 6 regions to analyze the impact mechanism of internal operating behaviors on the output efficiency of forest farms. The models are as follows:
where is the latent variable; is the actual dependent variable, which is the pure technical efficiency value of the jth DMU in period t; when , the explanatory variable is the actual observed value; when , the observed value is truncated to 0, is the coefficient vector to be estimated, is the explanatory variable, and is the random error term.
2.2. Variables and Data
2.2.1. Data Sources
This paper uses investigation and tracking data (2008–2018) for 4855 state-owned forest farms in China that were obtained from the State Forestry and Grassland Administration’s State-owned Forest Farm Management and Reform Research Group. These data contain the most comprehensive and authoritative statistical information on state-owned forest farms in China to date, which is a nationwide inventory of all state-owned forest farms complied with by China’s forestry authorities. They include information on forest farm infrastructure, forest resources, financial revenue and expenditures, ecological construction, general conditions of the workforce, and operational conditions of forestry industries.
Considering that it will take a long time for carbon storage in forests to change significantly and that state-owned forest farm reform started in 2015, this paper divides the study time into three periods: 2008–2010 (period I), 2012–2014 (period II), and 2015–2018 (period III). The indicators in the study use the annual average of each period.
With the reform of state-owned forest farms in 2015, small-scale forest farms are simplified and integrated into large-scale forest farms. As of 2020, there were 4297 state-owned forest farms in China. After removing outliers and using the moving average of adjacent years to address missing values, 3706 state-owned forest farms in 25 provinces were obtained, with a total of 11,118 observations. The sample data in this paper accounts for more than 75% of the original dataset and more than 85% of the number of existing forest farms, which can effectively represent China’s state-owned forest farms.
2.2.2. Input and Output Variables
Land, labor, and capital are recognized as the necessary input indicators for the production and development of state-owned forest farms. Specifically, land input is the total operational area of a state-owned forest farm (104 mu); labor input is the total number of on-the-job employees of a forest farm (person); capital is the total expenditure of a forest farm (104 yuan), in which the total expenditure includes the management and protection of forest production, infrastructure maintenance, employee wages, and social security.
The output indicators are based on the economic and carbon sequestration benefits of forest farms. The total income of a forest farm (104 yuan) is used to represent the economic benefits. Since the implementation of the natural forest protection project to stop timber harvesting, the public welfare attributes of state-owned forest farms have been increasingly strengthened, resulting in severe economic losses in terms of operation. Therefore, the total income of the forest farm in this study not only includes the operating income but also includes the forest ecological benefit compensation funds. The carbon storage (104 tons) calculated in this paper is used to represent the carbon sequestration benefit.
2.2.3. Environmental Variables
This paper proposes the SFA model to eliminate the impact of environmental factors on the output efficiency of carbon sequestration. Natural resource endowment is the most important explanatory variable for forest carbon sequestration [38]. According to forest classification and management theory, the innate endowment of forestry carbon sequestration in various regions is inherent and unchanged over the long term. Therefore, this paper does not consider natural environmental factors and only selects economic and social environment variables.
Managing forestry carbon sequestration mainly affects carbon sequestration through the protection of existing forest resources, reductions in deforestation, and increases in forest area and forest management [39]. However, different forest farm management environments will lead to different operating behaviors. China’s state-owned forest farms are grassroot forestry units that the state has invested in and specifically established to engage in forestry construction, production, and forest protection [40]. The management modes of various state-owned forest farms are not uniform, and these farms do not have sufficient rights to self-operate and obtain benefits. From the perspective of affiliation, state-owned forest farms can be divided into provincial, municipal, and county-owned farms. As a result, different state-owned forest farms have different financial support mechanisms, and thus different development capabilities. Impoverished state-owned forest farms are those that have experienced severe losses and have poor infrastructure, poor production, and living conditions. Research shows that there is a correlation between resource endowment and poverty [41], so both poor forest farms and poor areas may have an adverse impact on local producers’ production and operational modes. The human capital incentive mechanism is a key factor in realizing the sustainable management of state-owned forest farms. For example, the education level of forest farm workers can reflect their ability to attract human capital to the location. It will also have an impact on a forest farm’s management methods and the implementation of a management system [42]. This is contrasted by the substantial aging of state-owned forest farm workers, the imbalance in talent structure, and the minimal ability to attract high-quality labor in forest farms. Those are the challenges state-owned forest farms face in terms of upgrading industrially and developing a high-quality industry [43]. At the same time, forestry production and the development of state-owned forest farms are inseparable from the need for material resources. For example, factory buildings are an important production factor in terms of being able to maintain the daily operation of state-owned forest farms [44]. However, during the survey, it was found that there are still forest farms that have water, electricity, and communication facilities that are not fully functional. In summary, this paper selects environmental variables from three aspects: forest farm attributes, labor factors, and material resources, as shown in Table 1.
2.2.4. Operating Behaviors
Farm Forest Cover (FFC). Forestry land refers to the land specifically used for forestry production on forest farms, and it is expressed as the ratio of the forestry land area to the total managed area (unit: %). The main operational income of state-owned forest farms is derived from forest resources, so the change in land use on forest farms will have an impact on the carbon sequestration and operational income of forest farms.
Forestry Land Use Structure (FLUS). FLUS is expressed by the proportion of forestland type within a forestry land area (unit: %). According to the classification of forestry land-use types, forestry land can be divided into secondary land-use types such as forestland, shrub forestland, sparse forestland, and immature forestland. There are obvious differences in the amounts of carbon sequestered by different types of forestland [45].
Afforestation Intensity (AI). AI is expressed by the proportion of afforestation area on forest farms in a forestry land area (unit: %). China has carried out a large-scale afforestation project since the 1970s, but studies indicate that China’s mode of emphasizing afforestation and neglecting management may lead to poor forest quality and limited forest carbon sequestration potential [46].
Harvest (HAR). HAR is expressed as the proportion of timber production and processing income of a forest farm to the total operating income (unit: %). Forests can harvest timber as energy fuel and can continue to conduct carbon sequestration without harvesting timber [29].
Under-forest Economy (UFE). UFE is expressed as the proportion of the income of forest planting and aquaculture to the total operating income (unit: %). The UFE refers to under-forest planting and aquaculture developed by relying on forest resources and the ecological environment. Forest farms make full use of forestland and can generate certain economic benefits without logging, which can be regarded as a side benefit of state-owned forest farms.
Forest Tourism (FT). FT is expressed by the ratio of the tourism income of a forest farm to its total operating income (unit: %). Forest tourism brings considerable income to forest farms, improves the regional economy of forest parks, and promotes forest conservation and management. However, a large number of tourists may also put pressure on natural resources [47].
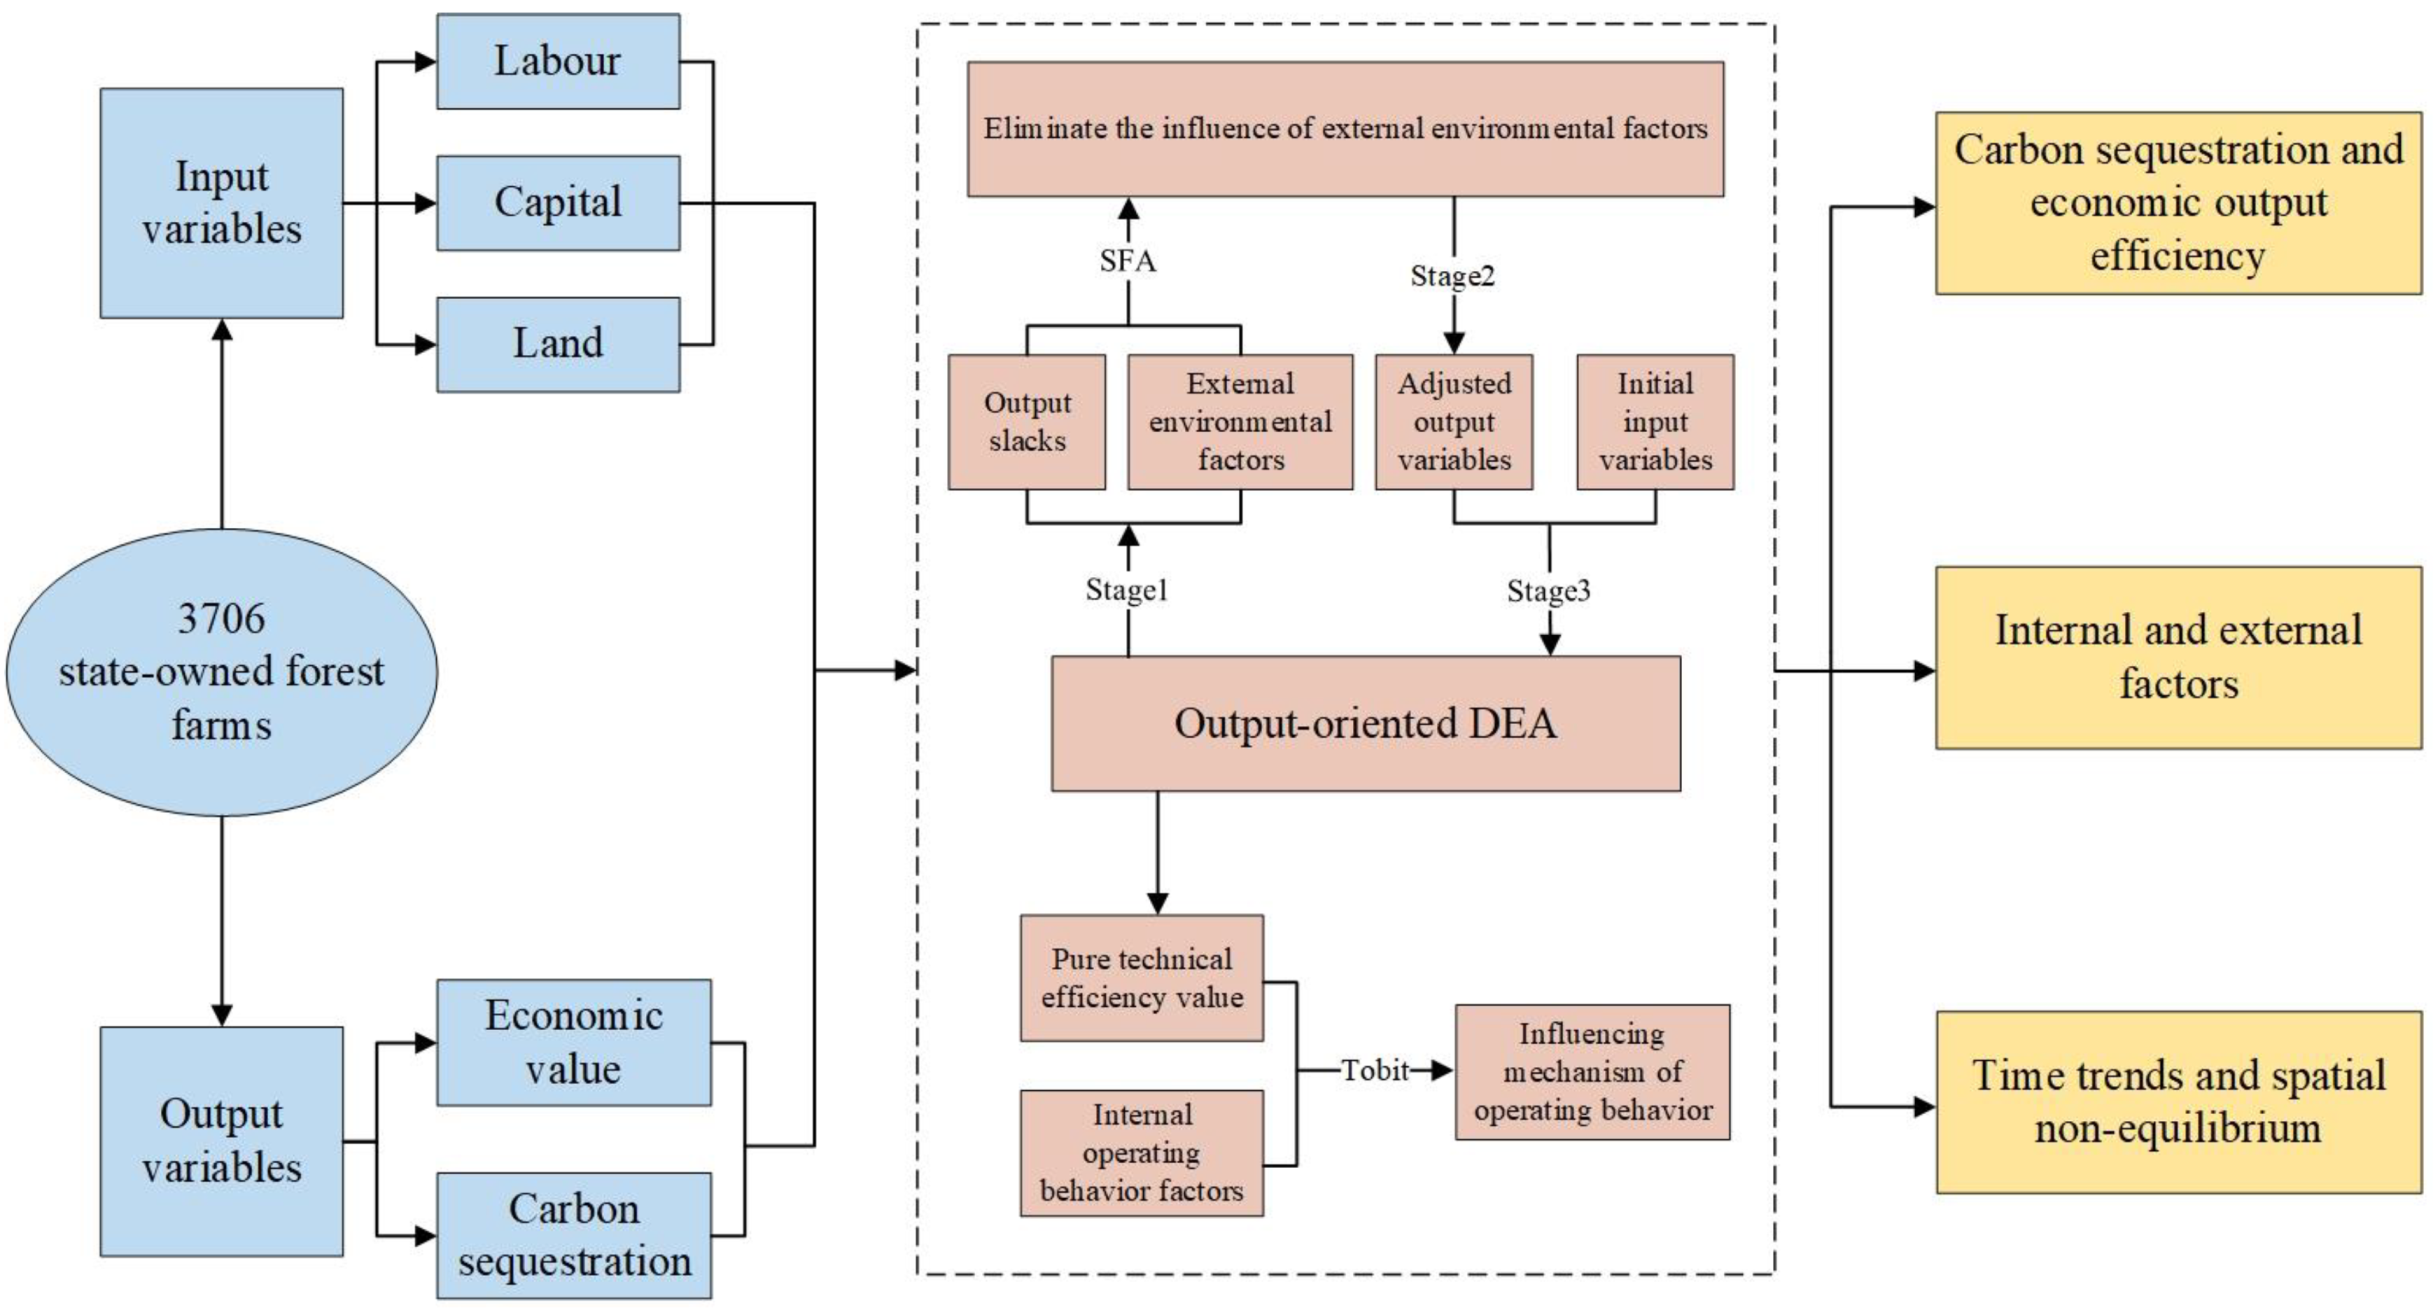
Combined with the above analysis, the model system for carbon sequestration output performance of state-owned forest farms is shown in Figure 1.
3. Results
3.1. Carbon Storage
To evaluate the output efficiency of state-owned forest farms, we used a carbon storage measurement model to calculate the carbon storage and carbon density of state-owned forest farms in each province during the three study periods. The results are shown in Table 2. From a national perspective, the carbon storage and carbon density of state-owned forest farms show an overall upward trend between 2008 and 2018, incrementing by 10.95% in carbon storage. From a regional and provincial perspective, the carbon storage and carbon density of the farms in most regions and provinces also show an upward trend. Only the provinces in Northwest China and Central South China experience a slight decline and fluctuation in carbon storage and carbon density on their forest farms.
As of 2018, among the 25 provinces, Heilongjiang, Inner Mongolia, Jilin, and Xinjiang provinces store the most carbon on their state-owned forest farms, accounting for more than 50% of the carbon storage on all state-owned forest farms in China. The state-owned forest farms in Jiangsu, Ningxia, Shandong, Anhui, and Zhejiang store the least amount of carbon. Among them, Jiangsu, Shandong, Anhui and Zhejiang appear the characteristics of rapid economic development and a high-density population. In particular, there are many rivers and lakes in Jiangsu Province, so the forest resource endowment is minimal. Ningxia is located on the Loess Plateau, with an arid climate and severe soil erosion. In terms of the amount of carbon storage in each region, Northeast, North China, and Northwest China store the most carbon, at 351.61 million tons, 196.21 million tons, and 129.43 million tons, respectively. These areas are vast, sparsely populated, and rich in forest resources, and among them, Inner Mongolia accounts for the vast majority of carbon storage in North China.
In terms of the carbon density of each region, as of 2018, Southwest, Northwest, and Northeast China have the highest carbon densities at 45.24 , 43.97 and 41.07 , respectively. The carbon density of the state-owned forest farms in North China and Central South China is low at 29.38 and 34.55 , respectively, which is lower than the national average.
3.2. Output Efficiency of Carbon Sequestration and Economics
3.2.1. DEA in the First Stage
In the first stage of the DEA model, based on the initial input-output value, efficiency is calculated, and the results include TE, PTE, and SE. The same state-owned forest farms in the three periods are regarded as different DMUs, the DMUs in the three periods are placed under a unified frontier to measure efficiency, and the output-oriented BBC method is used. The space here is limited, and the results are not displayed.
3.2.2. SFA in the Second Stage
Due to the large differences in the economic and social environment around the state-owned forest farms, the efficiency value of each state-owned forest farm in the first stage includes the impact of the external environment. Some forest farms rely on their advanced management systems, and they exist in an area where there is superior local economic development, convenient transportation, relatively high education and income levels of employees, and complete infrastructure construction. These factors are sufficient to support the high-quality development and transformation of state-owned forest farms; thus, these farms have higher output efficiencies. However, some forest farms exist in poverty-stricken areas, and there are low educational and income levels, a weak understanding of sustainable forest farm management, and poor forestry production conditions, resulting in low output efficiencies and even losses. Under these conditions, it is not objective or fair to evaluate the output efficiency of each forest farm. Therefore, it is necessary to exclude the impact of environmental heterogeneity on the results. The differences between natural environmental factors, such as climate and ecosystem, are based on the natural endowments in the region and will not change for a long time. Therefore, we should not eliminate the natural environmental factors of a forest farm.
The logarithm of the output slack values in the first stage DEA results are used as the dependent variables, and the environmental variables are used as the independent variables. First, the time-varying decay model is tested, and the decay coefficient test is not significant; thus, this paper adopts a time-invariance model, and the panel SFA model results are shown in Table 3.
It can be seen that the is between 0.7 and 0.9 and passes the 1% significance test, and most of the environmental variables pass the significance test, indicating that the environmental variables selected by the SFA model have strong explanatory power in terms of the amount of output slack. When the regression coefficient is positive, it means that increasing the value of this environment variable can promote an increase in output slack and improve efficiency, and vice versa.
Organizing the management system of forest farms, improving infrastructure construction, and fully using idle factory buildings can significantly increase the carbon sequestration and income outputs of forest farms. Reducing the aging degree of workers and introducing professional and technical personnel can significantly increase the carbon sequestration output of forest farms. In addition, alleviating poverty and improving the incomes of on-the-job workers can significantly increase the income of forest farms.
3.2.3. DEA in the Third Stage
After eliminating the environmental factors and statistical noise in the second stage of the SFA, all DMUs are in the same environment, and the output efficiency values are calculated using the initial input values and the adjusted output values. The results are shown in Table 4.
Table 4 shows that after excluding the environmental factors, the carbon sequestration output efficiencies of the state-owned forest farms still show an overall upward trend. Based on the three efficiency values of each state-owned forest farm in the various regions, the TE in Southwest and Southeast China is higher than the national average; the TE, PTE, and SE in Southwest China are at their highest levels in the three periods; the TE and PTE in Southeast China are second highest. After excluding the environmental factors, the TE and PTE rankings in Northeast China are increasing, while the TE and PTE rankings in North China have declined. In addition, the TE and SE rankings in Northeast China have always been decreasing, but the PTE has improved. The PTE rankings in Central South China decreased in the first two periods but increased in the third period.
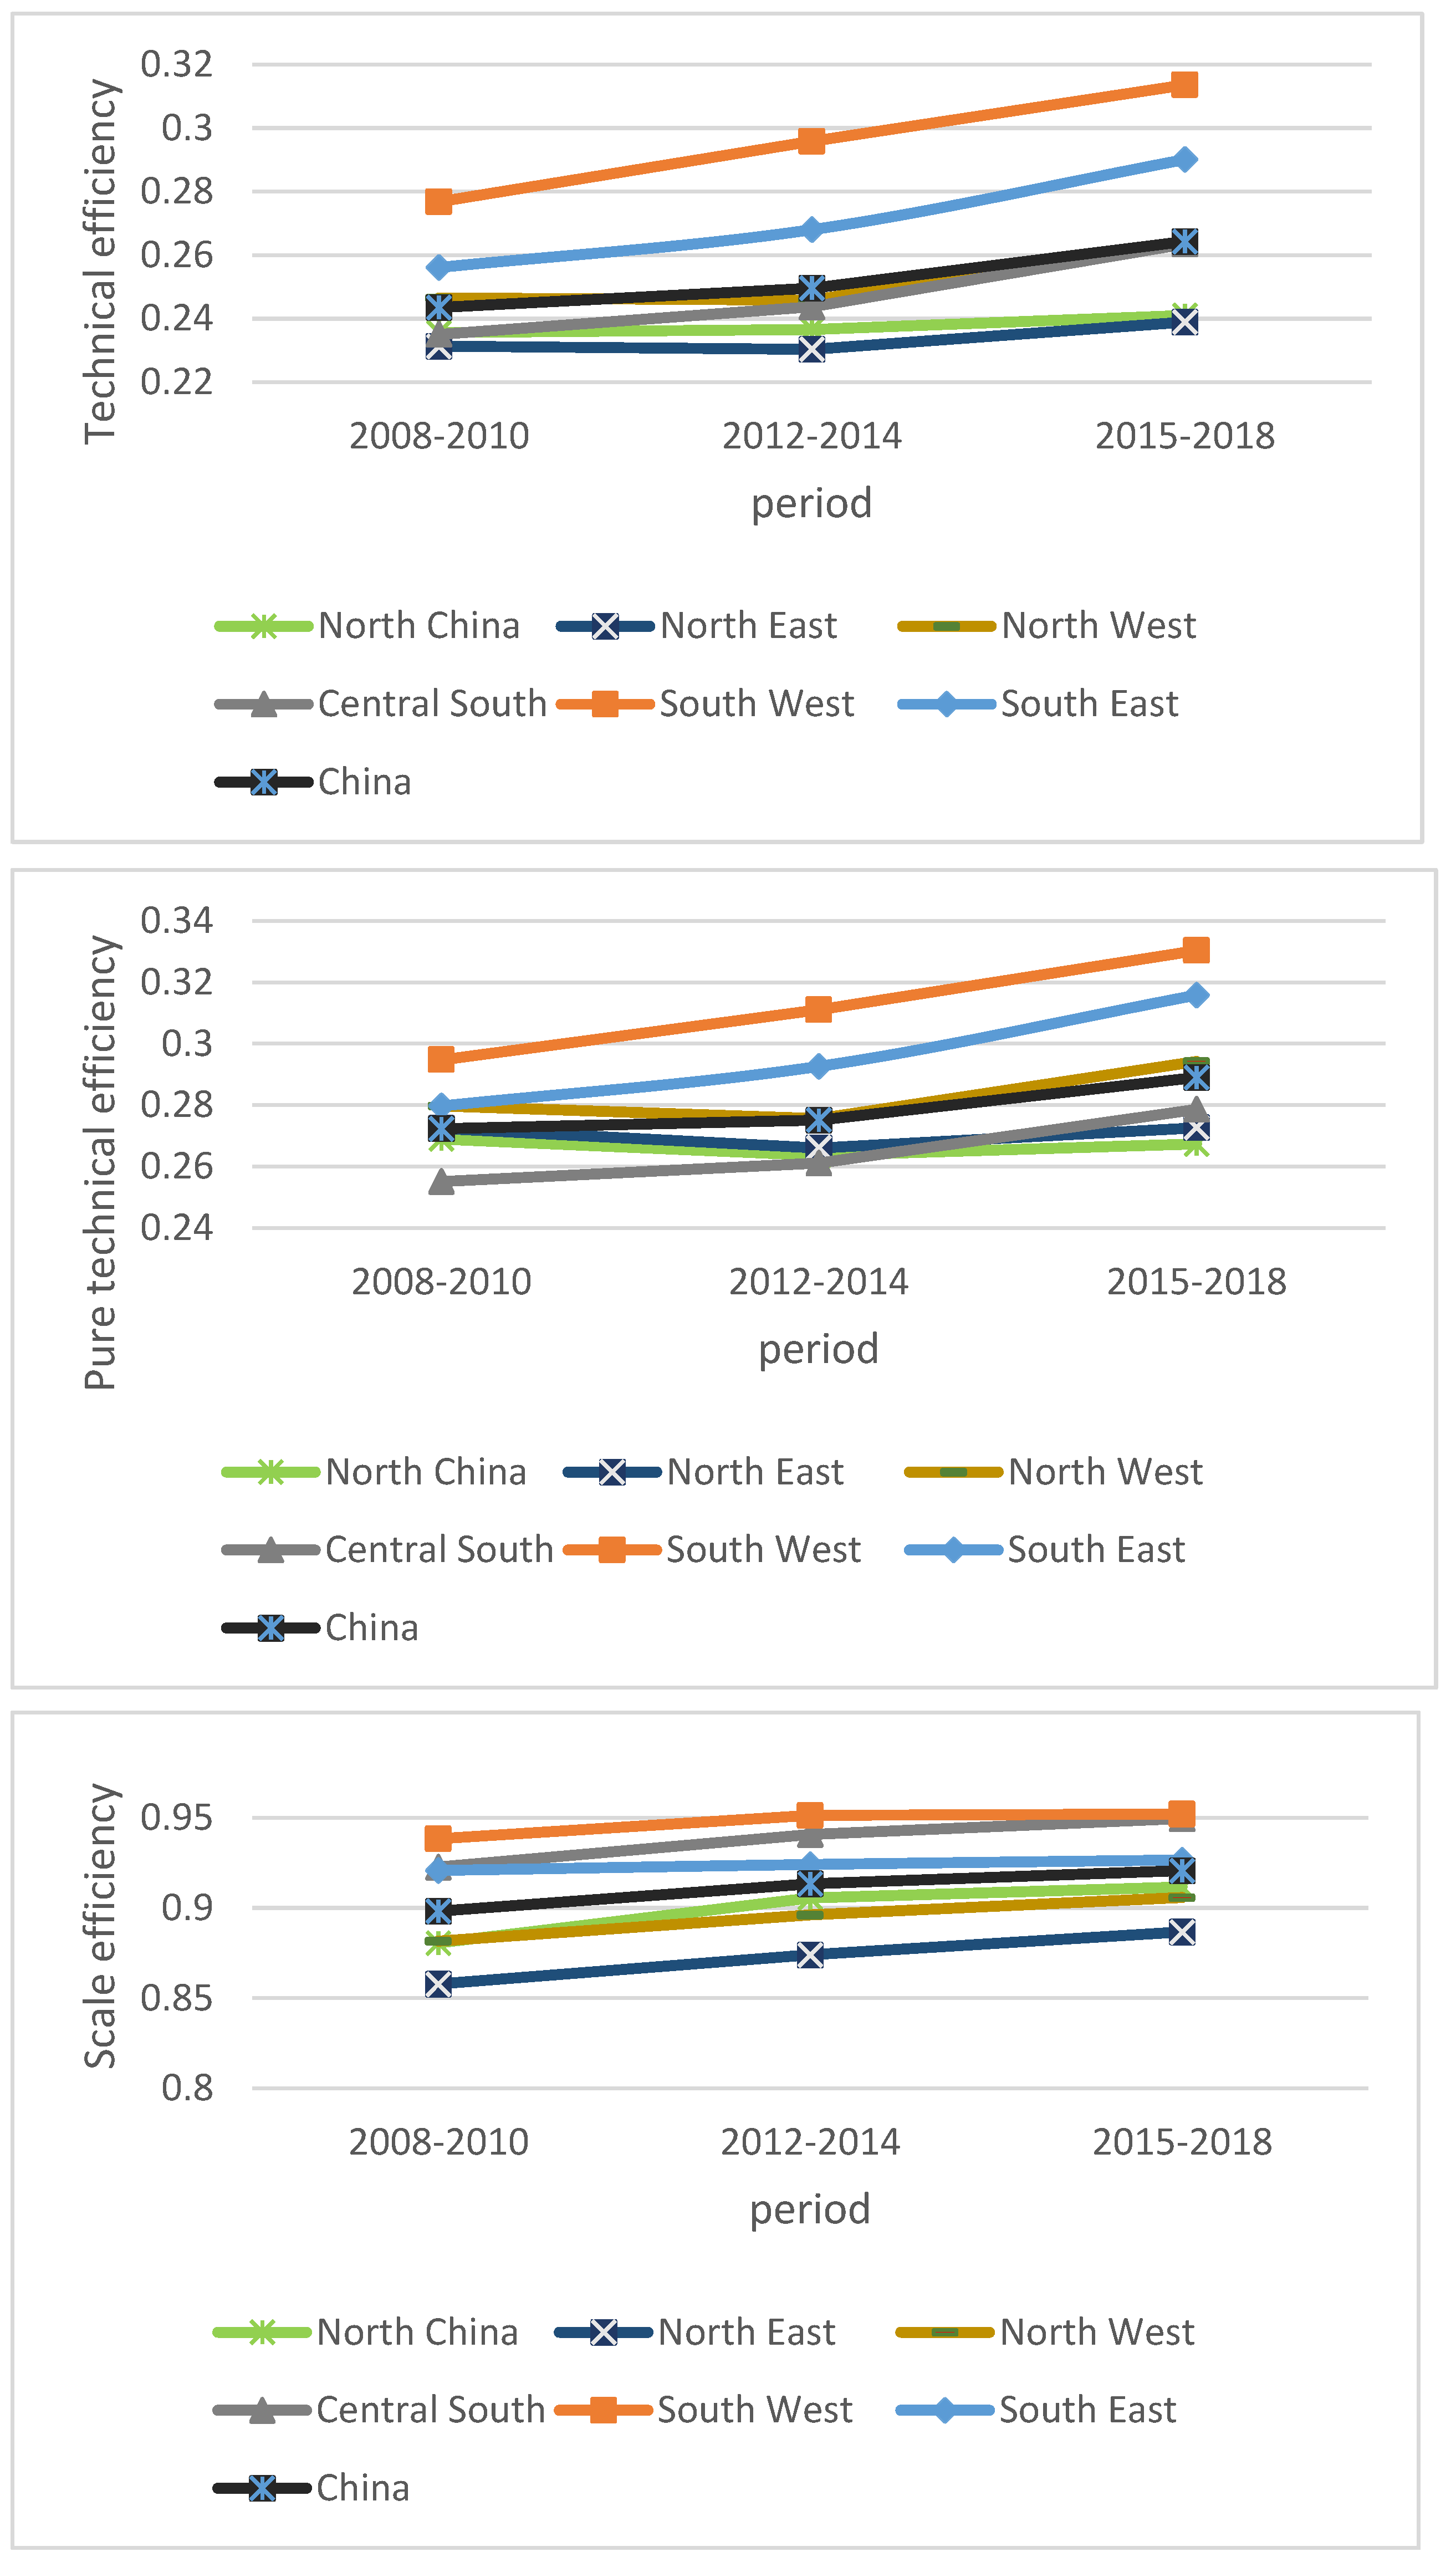
Figure 2 shows time trends. Finally, we find the TE in Northeast China is relatively low due to low SE, and similarly, the TE in Central South China is also relatively low due to low PTE.
The following section compares the average values of the efficiency during the three periods in the first and third stages in each province to further determine the characteristics of the output efficiency in each province. Table 5 shows the change rate of the average value of the output efficiency of the state-owned forest farms in each province from the first stage to the third stage, the ranking of the efficiency value in the third stage, and the ranking change from the first stage to the third stage.
Based on the change rate of efficiency values in the first and third stages of the analysis, as shown in Table 5, we find that after eliminating the environmental factors and random noise, the TE and PTE of each province increase, and the SE decreases. This result again shows that the overall low level of TE is limited by the low level of PTE, which indicates that the forest cultivation mode that China has long attached importance to afforestation and ignoring forest management. Given the ranking of the efficiency values in the third stage shown in Table 5, the three efficiency values of state-owned forest farms in the north are lower than those in the south, especially those in Inner Mongolia, Heilongjiang, Jilin, and Shanxi. The output efficiency values of the state-owned forest farms in South China are quite different. The output efficiency values of the forest farms in Anhui, Henan, Hunan, and Jiangsu in Central South China and Jiangxi in Southeast China are generally low. In Southeast China, those in Guangdong, Hainan, Zhejiang, and Fujian have higher efficiency values.
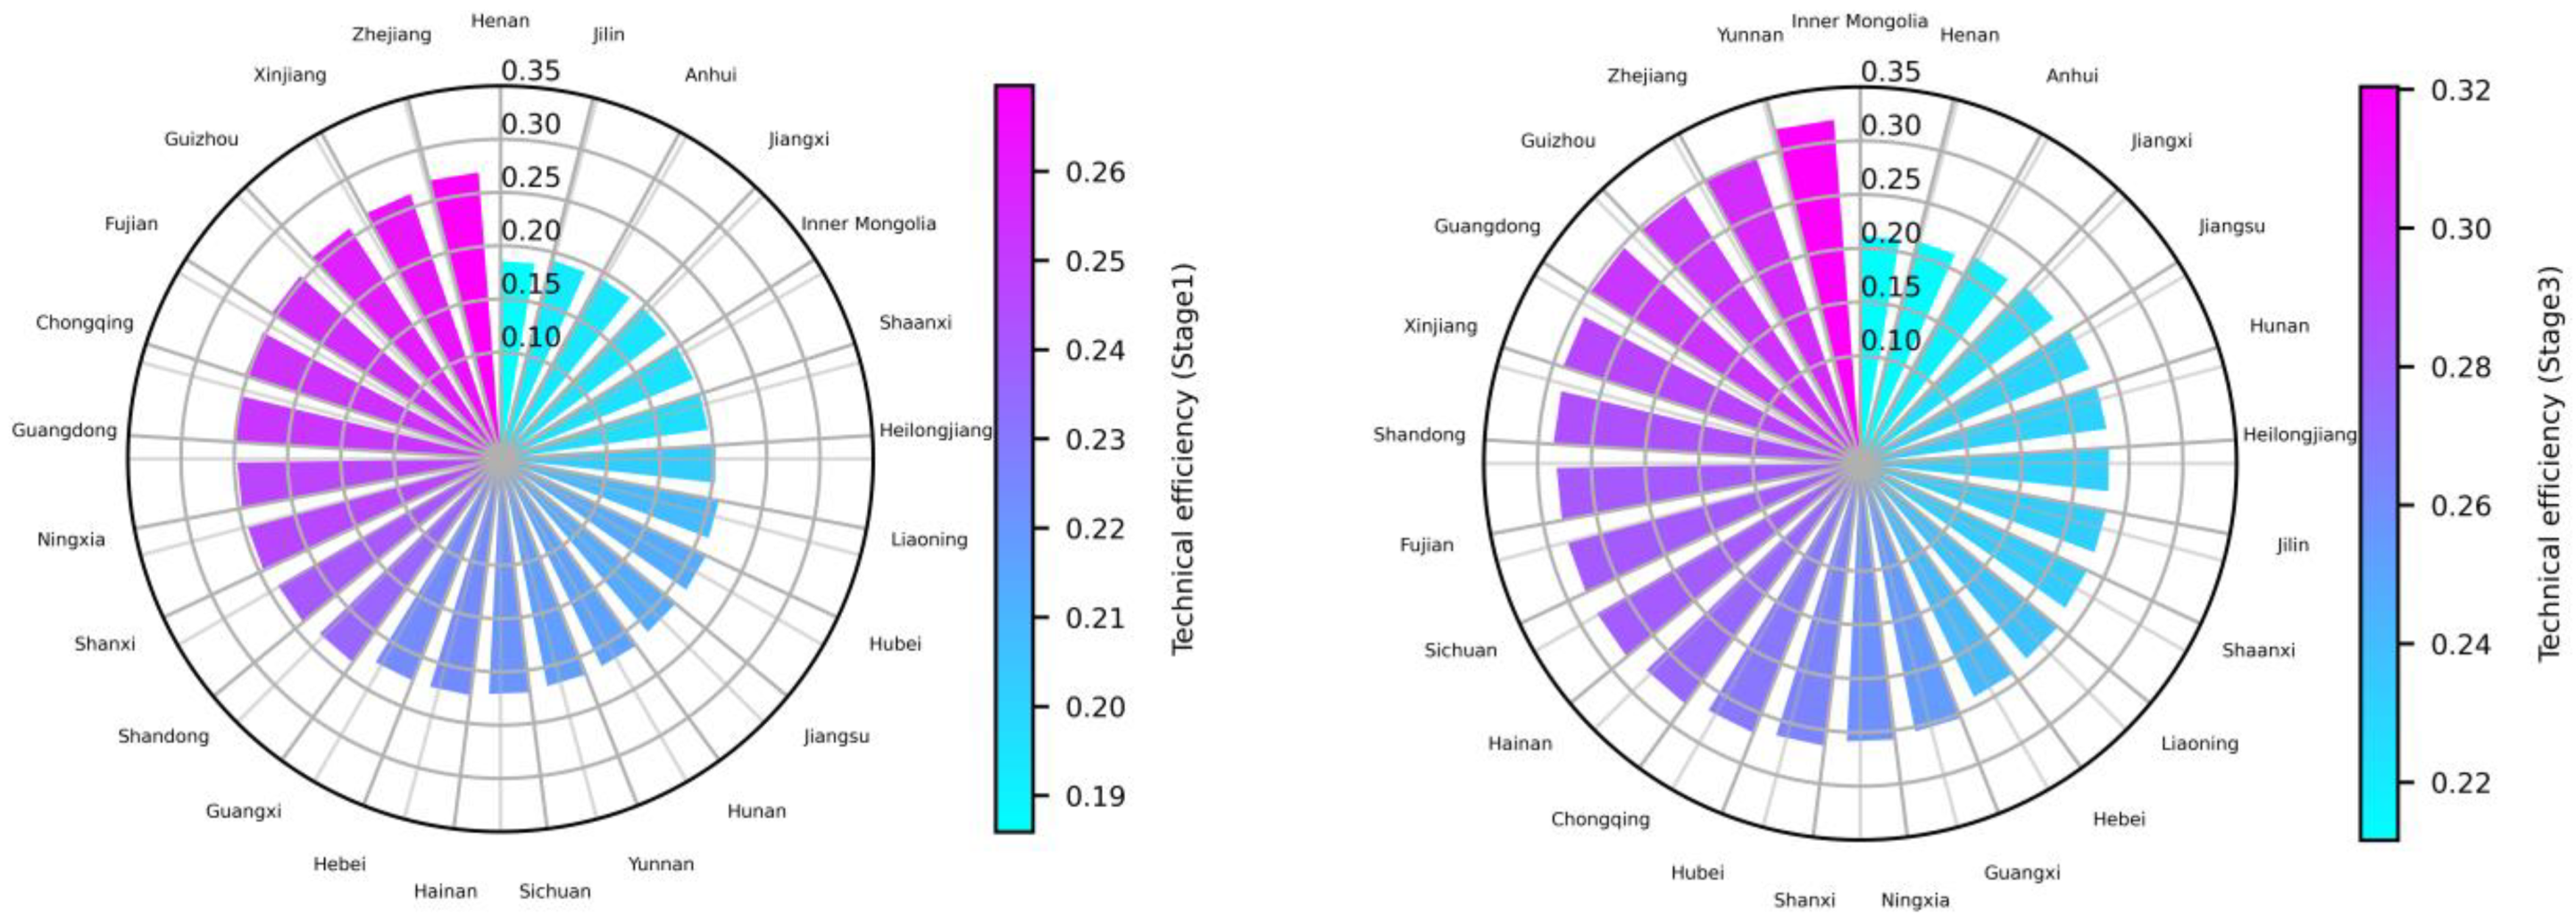
Figure 2 shows the efficiency improvements and ranking changes in each province after improving the external environmental factors. Based on Table 5 and Figure 3, after excluding the environmental factors, the TE and PTE of Yunnan, Hubei, Sichuan, Hainan, and Jilin have greatly increased. Given the changes in ranking, after excluding the environmental factors and statistical noise, the rankings of Yunnan, Sichuan, Jilin, Hubei, Hainan, Shaanxi, and other provinces have increased significantly, indicating that the external environmental factors of the state-owned forest farms in above provinces have substantial room for improvement, and improvements will enable them to unleash their carbon sequestration output potentials. But the rankings of Ningxia, Hunan, Jiangsu, Chongqing, and Hebei provinces decline.
3.3. Analysis of the Influencing Factors
The low TE of the carbon sequestration output of the forest farms is mainly limited by PTE. Therefore, in this study, pure technical efficiency is used as the dependent variable to explore the impact of operating behaviors. The Tobit model panel data was used to build models from the whole of China, Northeast, North, Northwest, Central South, Southwest, and Southeast China. The estimated results are shown in Table 6. Each operating behavior has different effects in different regions.
4. Discussion
The purpose of this study is to measure the carbon sequestration output efficiency of state-owned forest farms in China. The impact of their external environments and operating behaviors are also explored. In addition, we analyze the empirical results from three dimensions: temporal and spatial nonequilibrium changes, external environmental factors, and internal operating behaviors, to explore sustainable management methods for state-owned forest farms.
4.1. Temporal Trends and Spatial Nonequilibrium
From the time trend changes shown in Table 2 and Table 4, the carbon storage, carbon density, and output efficiency values of China’s state-owned forest farms showed an overall upward trend in the three periods, and only a few provinces experienced slight declines. Specifically, the carbon storage, carbon density, and output efficiency values of state-owned forest farms in various provinces increased significantly from 2015 to 2018 (period III), which may be attributed to the policy dividends produced by the implementation of the reform of state-owned forest farms and the promotion effects of forest farm management [48].
Table 4 shows the temporal and spatial changes in the output efficiency values in various provinces. From the perspective of time trend changes, the efficiency values of most provinces in the second period are lower than those in the previous period, and the efficiency values for only Yunnan, Guizhou, Hainan, Guangdong, and Shandong improve compared with those in the previous period. Before the reform of state-owned forest farms, the forest carbon sequestration output of most state-owned forest farms in China is in a downturn. After the reform, the carbon sequestration output and management efficiency of state-owned forest farms improve [49]. From the first period to the third period, the value of the output efficiency of the state-owned forest farms in each province greatly improves.
From a spatial perspective, the output of carbon sequestration from state-owned forest farms in China shows an obvious spatial imbalance, with a north-south inequality in the total amount of carbon storage and the output efficiency of carbon sequestration, and an east-west difference in carbon density. Table 4 shows that the areas with high output efficiency values are concentrated in four provinces in Southwest China, Xinjiang in Northwest China, and parts of Southeast China. Table 2 shows the total carbon storage by the forest farms. In Heilongjiang, Jilin and Inner Mongolia store the most carbon, but their output efficiency values are low, which sufficiently shows that their forest management efficiency has not reached an optimal level. The result occurs because development constraints such as management systems and technical support have not been resolved, and the high carbon sequestration output potential of these farms has not been released. This is consistent with the conclusion drawn by Yin et al. [50,51]. In contrast, the farms in Southwest China have moderate carbon storage but have the highest carbon density and output efficiency values, which is consistent with the conclusion drawn by Lin and Ge [23].
Of the state-owned forest farms, those in Southwest, Northwest, and Northeast China have the highest carbon density values, which is consistent with the results of forest stand carbon density values calculated by Zhang and Wang [20]. The distribution of forests in Northwest China is uneven, with forests mainly concentrated in Xinjiang, while Ningxia has lower forest coverage and forest carbon density [22]. The carbon density values of the state-owned forest farms in North China and Central South China are lower than the national average, which is mainly due to population density and industrial development.
4.2. External Environmental Impacts
In the second stage of the three-stage DEA model, environmental factors are identified and eliminated. The following explains the effect of external environmental factors on carbon sequestration and income in Table 3:
- (1)
- Forest farm attributes. The affiliation coefficient has a 1% significant positive effect on the slack of carbon sequestration and income, and it can be seen that in comparison to the other state-owned forest farms, those under provincial management systems are more able to increase carbon sequestration and income output. At present, the management systems of state-owned forest farms in China are different. It leads to differences in funding sources, personnel allocation, and policy implementation for each forest farm. Yan et al. [52] pointed out that most state-owned forest farms are located in remote areas. If they are not under provincial management, then they are mostly subordinate to economically underdeveloped cities or counties. As a result, financial allocation, policy implementation, and infrastructure construction cannot be effectively guaranteed. Poverty has a significant negative impact of 1% on income slack. The fact that state-owned forest farms are located in poverty-stricken areas hinders these forest farms from expanding their economic benefits, especially after logging is stopped in forest areas, and forest farms in underdeveloped areas face issues related to traffic and industrial transformation. Slow management, a lack of motivation for development, and a sharp decline in forest farm incomes have also made a serious impact on forest farm workers in underdeveloped areas.
- (2)
- Labor factor. The aging of workers has a 1% significant negative impact on carbon sequestration slack and a 1% significant positive impact on income slack. The aging of forest farm workers results in forest farm labor shortages and increases the economic burden of social security. However, this factor has not been reflected in this study. Because the special fund for Natural Forest Protection Project and the financial fund for forest ecological benefits are also included in the definition of the total income of forest farms, and the issue of retired employees has been properly addressed [53]. Therefore, only the negative effect of aging workers on carbon sequestration output is considered in this study. The education level of on-the-job employees has a significant positive impact of 1% on carbon sequestration slack. Forestry professional has a strong ability to accept the new forestry industrial practices and implement policies [54], which is an important factor in promoting the transformation of the forestry industry [44]. The per capita annual income of on-the-job employees has a 5% significant negative impact on carbon sequestration slack and a 1% significant positive impact on income. Due to low forestry incomes, an appropriate income performance mechanism will promote the economic benefits of forest farms [55]. However, to a certain extent, it will also cause the ecological benefits of forest farms to be neglected.
- (3)
- Material resources. Infrastructure has a 10% significant positive effect on carbon sequestration slack and a 1% significant positive effect on income slack. The per capita factory floor area has a significant negative impact of 1% on carbon sequestration and income. After the implementation of the Natural Forest Protection Project, idle fixed assets and inadequate utilization of factory buildings appeared in state-owned forest farms mainly based on timber production and processing [56]. Therefore, the factory resources of many state-owned forest farms are in a redundant state.
Based on Table 5 and Figure 3, after excluding environmental factors, the output efficiency of carbon sequestration in some provinces has greatly improved, while in some provinces, although the efficiency values have also increased, the ranking has declined. Results indicate that Jiangsu, Chongqing, and Hebei output efficiency values are overestimated due to economic and location factors. This is consistent with the conclusion drawn by Yin et al. [22]. Ningxia is in an arid region lacking forests and rain, and the carbon sequestration capacity of trees is insufficient [57]. However, it has carried out a series of targeted forestry-related poverty alleviation work in recent years, leading to more policy support, so its output efficiency value is also overestimated.
4.3. Operating Behavior Impacts
From the estimated results of the influencing factors of operating behaviors in Table 6, improving forest cover, increasing forestland, developing under-forest economy, and encouraging forest tourism can significantly improve the output efficiency values of forest farms across the country.
From a regional perspective, the effects of operating behaviors are different, but it is certain that improving forest cover and increasing forestland in each region can significantly improve output efficiency. Increasing afforestation intensity in North China can significantly improve output efficiency. However, the effects of timber harvesting and the under-forest economy differ regionally [58]. Many scholars have studied the decision-making related to the rotation period, the opportunity costs of planting space, and the trade-off between timber as energy fuel and forest carbon sequestration [27,28,29,59,60]. Timber harvest rotation planning aimed at carbon sequestration outputs of state-owned forest farms is a problem we have not considered. This paper only identifies the effect of timber harvest on the output efficiency of forest farms in different regions. Increasing timber harvests in North China could significantly improve the output efficiency values there, but this approach would have significant negative effects in South China. The under-forest economy is an associated activity that effectively increases the output of state-owned forest farms, but if it is excessively developed, then it may hurt forest cultivation. In North China, Northwest China, and Central South China, under-forest economy could significantly improve output efficiency [61], but it would have significant negative effects in Southwest China. Forest tourism has produced significant positive effects in Northwest and Southeast China [62].
Overall, increasing forest coverage and afforestation is a crude but effective approach to improving the output on forest farms. However, timber harvesting, developing under-forest economy, and conducting forest tourism on forest farms in different regions should be considered according to local conditions.
5. Conclusions
In this study, the three-stage DEA model and Tobit model are used to investigate the output efficiency of carbon sequestration and its influencing factors in state-owned forest farms in China.
The application of the three-stage DEA model obtains the carbon sequestration output efficiency and the spatial and temporal distribution characteristics. The state-owned forest farms in the north are large but rough management, while those in the south are small in scale but well managed. The results also expose the defective forest cultivation mode, in which state-owned forest farms attach importance to afforestation but ignore management.
By the SFA model and Tobit model, the influence mechanism of external environmental factors and internal operating behaviors on the output efficiency of carbon sequestration in state-owned forest farms is analyzed. For forest farms with unsatisfactory efficiency, improving infrastructure, financial support, staff professionalism, and other external environmental factors will promote their output efficiency. Afforestation and increasing forest coverage can effectively promote the output efficiency of carbon sequestration in forest farms. However, there is regional heterogeneity in timber harvesting, under-forest economy, and forest tourism, which need to be adjusted according to local conditions.
This paper provides necessary information for state-owned forest farms to improve carbon sequestration output, participate in forestry carbon sequestration projects, and promote sustainable forest management. Future work should consider the individual management of the forest farm. The wood of the forest farm can be used as biomass energy fuel and bring certain economic benefits. When the forest is not harvested, the forest can continue to play its carbon storage capacity. In addition, forest tourism also provides cultural and recreational value. For different types of forest farms, it is very meaningful to establish a multi-objective model of forest harvest scheduling problems. This requires a more detailed investigation basis and personnel support. We will continue the current work progress to promote the sustainable development of state-owned forest farms and maximize their benefits.
Author Contributions
All authors contributed to the study conception and design. Conceptualization: J.M.; Methodology, C.L. and J.M.; Software, C.L.; Validation, X.W.; Formal analysis, C.L. and J.M.; Investigation, W.C., C.L. and X.W.; Resources, J.M. and W.C.; Data curation, W.C.; Writing—original draft preparation, C.L. and J.M.; Writing—review and editing, C.L. and J.M.; Visualization, C.L. and X.W.; Supervision, J.M. and W.C.; Funding acquisition, J.M. and W.C. All authors have read and agreed to the published version of the manuscript.
Funding
(1) This work was supported by the National Natural Science Foundation of China (Grant No. 72101253). (2) This work was funded by the China-UK LTS Beijing representative offices. Research on the Impact of China’s National Reserve Forest Project from the Perspective of the Global Timber Supply Chain and Forest Governance (Grant No. L19-15 03/2022).
Institutional Review Board Statement
Not applicable.
Informed Consent Statement
Not applicable.
Data Availability Statement
Not applicable.
Conflicts of Interest
The authors declare no conflict of interest.
References
- Dixon, R.K.; Solomon, A.; Brown, S.; Houghton, R.; Trexier, M.; Wisniewski, J. Carbon Pools and Flux of Global Forest Ecosystems. Science 1994, 263, 185. [Google Scholar] [CrossRef]
- Pingoud, K.; Ekholm, T.; Soimakallio, S.; Helin, T. Carbon balance indicator for forest bioenergy scenarios. Gcb Bioenergy 2016, 8, 171. [Google Scholar] [CrossRef] [Green Version]
- Makkonen, M.; Huttunen, S.; Primmer, E.; Repo, A.; Hildén, M. Policy coherence in climate change mitigation: An ecosystem service approach to forests as carbon sinks and bioenergy sources. For. Policy Econ. 2015, 50, 153. [Google Scholar] [CrossRef]
- Fang, J.; Wang, G.; Liu, G.; Xu, S. Forest biomass of China: An estimate based on the biomass–volume relationship. Ecol. Appl. 1998, 8, 1084. [Google Scholar] [CrossRef]
- Pan, Y.; Birdsey, R.A.; Fang, J.; Houghton, R.; Kauppi, P.E.; Kurz, W.A.; Phillips, O.L.; Shvidenko, A.; Lewis, S.L.; Canadell, J.G. A large and persistent carbon sink in the world’s forests. Science 2011, 333, 988. [Google Scholar] [CrossRef] [Green Version]
- State Forestry and Grassland Administration SFGA. China Forest Resources Report (2014–2018); China Forestry Publishing: Beijing, China, 2019; pp. 3–5. [Google Scholar]
- Zhao, X.; Ma, X.; Chen, B.; Shang, Y.; Song, M. Challenges toward carbon neutrality in China: Strategies and countermeasures. Resour. Conserv. Recycl. 2022, 176, 105959. [Google Scholar] [CrossRef]
- Lazaridou, D.C.; Michailidis, A.; Trigkas, M. Exploring environmental and economic costs and benefits of a forest-based circular economy: A literature review. Forests 2021, 12, 436. [Google Scholar] [CrossRef]
- Song, C.; Zhang, C.; Zhang, S.; Lin, H.; Kim, Y.; Ramakrishnan, M.; Du, Y.; Zhang, Y.; Zheng, H.; Barceló, D. Thermochemical liquefaction of agricultural and forestry wastes into biofuels and chemicals from circular economy perspectives. Sci. Total Environ. 2020, 749, 141972. [Google Scholar] [CrossRef]
- Stević, Ž.; Karamaşa, Ç.; Demir, E.; Korucuk, S. Assessing sustainable production under circular economy context using a novel rough-fuzzy MCDM model: A case of the forestry industry in the Eastern Black Sea region. J. Enterp. Inf. Manag. 2021; ahead-of-print. [Google Scholar] [CrossRef]
- Xu, D.; Wang, L.; Liu, J. Assessing the social performance of state-owned forest farms in China: Integrating forest social values and corporate social responsibility approaches. Scand. J. For. Res. 2017, 32, 338. [Google Scholar] [CrossRef]
- Brown, S.; Lugo, A.E. Biomass of tropical forests: A new estimate based on forest volumes. Science 1984, 223, 1290. [Google Scholar] [CrossRef]
- Fang, J.Y.; Oikawa, T.; Kato, T.; Mo, W.H.; Wang, Z.H. Biomass carbon accumulation by Japan’s forests from 1947 to 1995. Glob. Biogeochem. Cy. 2005, 19, 2253. [Google Scholar] [CrossRef]
- Fang, J.; Chen, A.; Peng, C.; Zhao, S.; Ci, L. Changes in forest biomass carbon storage in China between 1949 and 1998. Science 2001, 292, 2320. [Google Scholar] [CrossRef] [PubMed]
- Guo, Z.; Fang, J.; Pan, Y.; Birdsey, R. Inventory-based estimates of forest biomass carbon stocks in China: A comparison of three methods. For. Ecol. Manag. 2010, 259, 1225. [Google Scholar] [CrossRef]
- Qiu, Z.; Feng, Z.; Song, Y.; Li, M.; Zhang, P. Carbon sequestration potential of forest vegetation in China from 2003 to 2050: Predicting forest vegetation growth based on climate and the environment. J. Clean. Prod. 2020, 252, 119715. [Google Scholar] [CrossRef]
- Zhou, X.; Lei, X.; Liu, C.; Huang, H.; Zhou, C.; Peng, C. Re-estimating the changes and ranges of forest biomass carbon in China during the past 40 years. For. Ecosyst. 2019, 6, 51. [Google Scholar] [CrossRef] [Green Version]
- Zeng, W.; Sun, X.; Wang, L.; Wang, W.; Pu, Y. Developing stand volume, biomass and carbon stock models for ten major forest types in forest region of northeastern China. J. Beijing For. Univ. 2021, 43, 1–8. [Google Scholar] [CrossRef]
- Jagodziński, A.M.; Dyderski, M.K.; Gęsikiewicz, K.; Horodecki, P. Tree and stand level estimations of Abies alba Mill. aboveground biomass. Ann For. Sci 2019, 76, 56. [Google Scholar] [CrossRef] [Green Version]
- Zhang, Y.; Wang, X. Study on forest volume-to-biomass modeling and carbon storage dynamics in China. Sci. Sin. Vitae 2021, 51, 199. [Google Scholar] [CrossRef]
- Xue, L.; Luo, X.; Li, R.; Yu, W. Regional differences and dynamic evolution analysis of forest carbon sinks in China. J. China Agr. Univ. 2018, 23, 197–206. [Google Scholar]
- Yin, S.; Gong, Z.; Gu, L.; Deng, Y.; Niu, Y. Driving forces of the efficiency of forest carbon sequestration production: Spatial panel data from the national forest inventory in China. J. Clean. Prod. 2022, 330, 129776. [Google Scholar] [CrossRef]
- Lin, B.; Ge, J. Carbon sinks and output of China’s forestry sector: An ecological economic development perspective. Sci. Total Environ. 2019, 655, 1169. [Google Scholar] [CrossRef] [PubMed]
- Ao, G.; Wu, W.; Cao, X.; Liu, Q. Analysis on production efficiency of carbon sink bamboo forest based on three-stage DEA model: Evidence from Zhejiang Anji. J. Agr. For. Eco. Manag. 2019, 18, 656–666. [Google Scholar]
- Näyhä, A. Transition in the Finnish forest-based sector: Company perspectives on the bioeconomy, circular economy and sustainability. J. Clean. Prod. 2019, 209, 1294. [Google Scholar] [CrossRef]
- Tong, X.; Brandt, M.; Yue, Y.; Ciais, P.; Rudbeck Jepsen, M.; Penuelas, J.; Wigneron, J.-P.; Xiao, X.; Song, X.-P.; Horion, S. Forest management in southern China generates short term extensive carbon sequestration. Nat. Commun. 2020, 11, 129. [Google Scholar] [CrossRef] [PubMed]
- Koponen, K.; Soimakallio, S.; Kline, K.L.; Cowie, A.; Brandão, M. Quantifying the climate effects of bioenergy—Choice of reference system. Renew. Sust. Energ. Rev. 2018, 81, 2271. [Google Scholar] [CrossRef]
- Ni, Y.; Eskeland, G.S.; Giske, J.; Hansen, J.-P. The global potential for carbon capture and storage from forestry. Carbon Balance Manag. 2016, 11, 1172. [Google Scholar] [CrossRef] [PubMed] [Green Version]
- Koster, R.; Fuchs, J.M. Opportunity costs of growing space—An essential driver of economical single-tree harvest decisions. For. Policy Econ. 2022, 135, 102668. [Google Scholar] [CrossRef]
- Gu, L.; Wu, W.; Ji, W.; Zhou, M.; Xu, L.; Zhu, W. Evaluating the performance of bamboo forests managed for carbon sequestration and other co-benefits in Suichang and Anji, China. For. Policy Econ. 2019, 106, 101947. [Google Scholar] [CrossRef]
- Fried, H.O.; Lovell, C.K.; Schmidt, S.S.; Yaisawarng, S. Accounting for environmental effects and statistical noise in data envelopment analysis. J. prod. Ana. 2002, 17, 157. [Google Scholar] [CrossRef]
- Liu, Z.; Zhang, X.; Yang, D. Research on efficiency change of chinese government health investment:based on panel three stage DEA mode. J. Cent. Univ. Financ. Econ. 2014, 6, 97–104. [Google Scholar]
- Banker, R.D.; Charnes, A.; Cooper, W.W. Some models for estimating technical and scale inefficiencies in data envelopment analysis. Manag. Sci. 1984, 30, 1078. [Google Scholar] [CrossRef] [Green Version]
- Tobin, J. Estimation of relationships for limited dependent variables. Econom. J. Eco. Soc. 1958, 26, 24–36. [Google Scholar] [CrossRef] [Green Version]
- Młynarski, W.; Prędki, A.; Kaliszewski, A. Efficiency and factors influencing it in forest districts in southern Poland: Application of data envelopment analysis. For. Policy Econ. 2021, 130, 102530. [Google Scholar] [CrossRef]
- Shuai, S.; Fan, Z. Modeling the role of environmental regulations in regional green economy efficiency of China: Empirical evidence from super efficiency DEA-Tobit model. J. Environ. Manag. 2020, 261, 110227. [Google Scholar] [CrossRef]
- Zhang, M.; Li, L.; Cheng, Z. Research on carbon emission efficiency in the Chinese construction industry based on a three-stage DEA-Tobit model. Environ. Sci. Pollut. Res. 2021, 28, 51120. [Google Scholar] [CrossRef]
- Farrell, M.J. The measurement of productive efficiency. J. R. Stat. Soc. Ser. 1957, 120, 253. [Google Scholar] [CrossRef]
- Mustalahti, I. The responsive bioeconomy: The need for inclusion of citizens and environmental capability in the forest based bioeconomy. J. Clean. Prod. 2018, 172, 3781. [Google Scholar] [CrossRef]
- Penman, J.; Kruger, D.; Galbally, I.; Hiraishi, T.; Nyenzi, B.; Emmanuel, S.; Buendia, L.; Hoppaus, R.; Martinsen, T.; Meijer, J. Good Practice Guidance And Uncertainty Management In National Greenhouse Gas Inventories; Intergovernmental Panel on Climate Change: Kanagawa, Japan, 2000. [Google Scholar]
- Tian, M.; Wang, Z.; Li, H. The system reform of state-owned forest farms in China. J. Beijing For. Univ. 2018, 7, 54–59. [Google Scholar]
- Ross, M.L. The political economy of the resource curse. World Politics 1999, 51, 297. [Google Scholar] [CrossRef]
- Ke, S.; Wang, B.; Zhu, L.; Tang, Z. Industrial transformation in state-owned forest region: Dilemmas and paths. World For. Res. 2018, 31, 44–50. [Google Scholar] [CrossRef]
- Bai, J.; Tan, P.; Chen, W.; Liu, J. Evaluation of self-development ability and study of its obstacle factors for state—Owned forest farms: Applying the SEM–PPM. Sustainability 2021, 13, 3119. [Google Scholar] [CrossRef]
- Jia, B.; Guo, W.; He, J.; Sun, M.; Chai, L.; Liu, J.; Wang, X. Topography, diversity, and forest structure attributes drive aboveground carbon storage in different forest types in Northeast China. Forests 2022, 13, 455. [Google Scholar] [CrossRef]
- Chen, J.; Yang, H. Advances and frontiers in global forest and harvested wood products carbon science. J. Nanjing For. Univ. 2018, 61, 1. [Google Scholar]
- Chen, B.; Nakama, Y. Thirty years of forest tourism in China. J. For. Res. 2017, 18, 285–292. [Google Scholar] [CrossRef]
- Chen, R.; Chen, W.; Hu, M.; Huang, W. Measuring improvement of economic condition in state-owned forest farms’ in China. Sustainability 2020, 12, 1593. [Google Scholar] [CrossRef] [Green Version]
- Han, X.; Frey, G.E.; Geng, Y.; Cubbage, F.W.; Zhang, Z. Reform and efficiency of state-owned forest enterprises in Northeast China as “social firms”. J. For. Eco. 2018, 32, 18. [Google Scholar] [CrossRef]
- Liu, S.; Ding, Z.; Lin, Y.; Yao, S. The efficiency of forest management investment in key state-owned forest regions under the carbon neutral target: A case study of Heilongjiang Province, China. Forests 2022, 13, 609. [Google Scholar] [CrossRef]
- Yin, Z.; Lu, C.; Liu, Q. Research on carbon sink potential of forest regionin the northeast and Inner Mongolia based on the perspective of carbon trade. Guangdong Soc. Sci. 2014, 41, 194. [Google Scholar]
- Yan, Q.; Tian, M.; He, C.; Chen, W.; Wu, C.; Yuan, C. Suggestion on reform about the operation and management system of state forest farms in China. For. Eco. 2014, 36, 11. [Google Scholar]
- Wei, Y.; Yu, D.; Lewis, B.J.; Zhou, L.; Zhou, W.; Fang, X.; Zhao, W.; Wu, S.; Dai, L. Forest carbon storage and tree carbon pool dynamics under natural forest protection program in northeastern China. Chin. Geogr. Sci. 2014, 24, 397. [Google Scholar] [CrossRef]
- Larson, A.M.; Ribot, J.C. The poverty of forestry policy: Double standards on an uneven playing field. Sustain. Sci. 2007, 2, 189–204. [Google Scholar] [CrossRef]
- Peterson, R.S.; Smith, D.B.; Martorana, P.V.; Owens, P.D. The impact of chief executive officer personality on top management team dynamics: One mechanism by which leadership affects organizational performance. J. Appl. Psychol. 2003, 88, 795. [Google Scholar] [CrossRef] [Green Version]
- Wu, S.; Li, J.; Zhou, W.; Lewis, B.J.; Yu, D.; Zhou, L.; Jiang, L.; Dai, L. A statistical analysis of spatiotemporal variations and determinant factors of forest carbon storage under China’s Natural Forest Protection Program. J. For. Res. 2017, 29, 415–424. [Google Scholar] [CrossRef]
- Chen, Z.; Yu, G.; Wang, Q. Magnitude, pattern and controls of carbon flux and carbon use efficiency in China’s typical forests. Glob. Planet. Change 2019, 172, 464. [Google Scholar] [CrossRef]
- Thomas, J.; Brunette, M.; Leblois, A. The determinants of adapting forest management practices to climate change: Lessons from a survey of French private forest owners. For. Policy Econ. 2022, 135, 102662. [Google Scholar] [CrossRef]
- González-González, J.M.; Vázquez-Méndez, M.E.; Diéguez-Aranda, U. Multi-objective models for the forest harvest scheduling problem in a continuous-time framework. For. Policy Econ. 2022, 136, 102687. [Google Scholar] [CrossRef]
- Lin, B.; Ge, J. To harvest or not to harvest? Forest management as a trade-off between bioenergy production and carbon sink. J. Clean. Prod. 2020, 268, 122219. [Google Scholar] [CrossRef]
- Hou, F.; Wu, J.; Li, H.; Yang, Y.; Luo, X.; Shen, Y. Analysis on the development of Chinese under-forest economy and its effect on the increase of farmers’ income. J. Discret. Math. Sci. C. 2017, 20, 1263. [Google Scholar] [CrossRef]
- Hall, C.M.; Scott, D.; Gössling, S. Forests, climate change and tourism. J. Herit. Tour. 2011, 6, 353. [Google Scholar] [CrossRef]
Figure 1.
A model system of carbon sequestration output performance of state-owned forest farms.

Figure 2.
Mean of technical efficiency, pure technical efficiency, and scale efficiency of state-owned forest farms in China from 2008 to 2018 (Efficiency value after excluding external environmental factors of state-owned forest farms for the third stage).
Figure 2.
Mean of technical efficiency, pure technical efficiency, and scale efficiency of state-owned forest farms in China from 2008 to 2018 (Efficiency value after excluding external environmental factors of state-owned forest farms for the third stage).

Figure 3.
Technical efficiency values of state-owned forest farms in China (the two figures are the efficiency values of the first and third stages, respectively).
Figure 3.
Technical efficiency values of state-owned forest farms in China (the two figures are the efficiency values of the first and third stages, respectively).


Table 1.
Description of environment variables.
| First-Level Indicator | Second-Level Indicator | Variables and Their Descriptions | Mean | S.D. |
|---|---|---|---|---|
| Forest farm attributes | Aff (Affiliation) | County = 1; Municipal = 2; Provincial = 3 | 1.18 | 0.44 |
| Pov (Poverty) | Yes = 1; No = 0 | 0.32 | 0.47 | |
| Labor factors | Edu (Education) | The proportion of the total number of employees with a college degree or above (%) | 22.69% | 0.16 |
| Agi (Aging) | The proportion of retired workers to total workers (%) | 39.13% | 0.19 | |
| Inc (Income) | Per capita annual income of in-service employees (104 yuan) | 3.01 | 1.86 | |
| Material resources | Inf (Infrastructure) | Access to electricity, internet, telephone, and sufficient water, completed four = 4; three = 3; two = 2; one = 1; none = 0 | 3.03 | 0.89 |
| Fac (Factory) | Per capita factory buildings area (m2/person) | 60.48 | 131.28 |
Table 2.
Carbon storage and carbon density of state-owned forest farms in China’s provinces in three periods (2008–2018).
Table 2.
Carbon storage and carbon density of state-owned forest farms in China’s provinces in three periods (2008–2018).
| Region | Provincial Unit | Number of Forest Farms (Pieces) | 2008–2010 | 2012–2014 | 2015–2018 | |||
|---|---|---|---|---|---|---|---|---|
| Carbon Storage (106t) | Carbon Density (t/ha) | Carbon Storage (106t) | Carbon Density (t/ha) | Carbon Storage (106t) | Carbon Density (t/ha) | |||
| North China | Inner Mongolia | 262 | 131.63 | 28.51 | 145.26 | 30.87 | 151.55 | 31.65 |
| Shanxi | 243 | 33.53 | 23.02 | 34.75 | 23.63 | 35.49 | 23.76 | |
| Hebei | 82 | 7.18 | 19.89 | 8.19 | 21.91 | 9.18 | 23.15 | |
| total | 587 | 172.33 | 26.78 | 188.19 | 28.74 | 196.21 | 29.38 | |
| North East | Jilin | 327 | 120.91 | 43.16 | 125.73 | 47.33 | 129.77 | 48.95 |
| Liaoning | 177 | 21.85 | 34.39 | 23.64 | 35.58 | 23.77 | 36.18 | |
| Heilongjiang | 424 | 180.96 | 35.15 | 188.89 | 35.87 | 198.06 | 37.71 | |
| total | 928 | 323.72 | 37.71 | 338.25 | 39.40 | 351.61 | 41.07 | |
| North West | Ningxia | 66 | 2.31 | 20.22 | 2.18 | 17.37 | 2.05 | 18.97 |
| Xinjiang | 58 | 70.25 | 55.17 | 69.29 | 56.03 | 77.97 | 66.03 | |
| Shaanxi | 142 | 48.40 | 30.52 | 48.97 | 30.55 | 49.41 | 29.86 | |
| total | 266 | 120.96 | 40.68 | 120.45 | 40.62 | 129.43 | 43.97 | |
| Central South | Anhui | 132 | 7.66 | 34.52 | 7.65 | 33.43 | 7.82 | 33.89 |
| Shandong | 140 | 3.72 | 31.18 | 4.07 | 32.66 | 4.17 | 33.48 | |
| Jiangsu | 31 | 1.07 | 20.98 | 1.81 | 30.30 | 1.01 | 26.38 | |
| Henan | 92 | 11.59 | 33.58 | 12.29 | 34.64 | 12.24 | 34.71 | |
| Hubei | 235 | 19.75 | 33.27 | 21.80 | 36.50 | 24.16 | 40.58 | |
| Hunan | 201 | 25.84 | 28.92 | 25.83 | 29.93 | 24.21 | 30.69 | |
| total | 831 | 69.63 | 31.30 | 73.44 | 32.96 | 73.61 | 34.55 | |
| South West | Yunnan | 110 | 48.86 | 51.72 | 48.89 | 51.44 | 49.46 | 51.65 |
| Sichuan | 123 | 35.85 | 44.08 | 35.72 | 44.23 | 38.14 | 44.61 | |
| Guizhou | 108 | 7.74 | 31.90 | 9.06 | 34.39 | 11.14 | 43.16 | |
| Chongqing | 69 | 7.76 | 29.62 | 9.01 | 31.90 | 10.99 | 30.97 | |
| total | 410 | 100.21 | 44.29 | 102.67 | 44.57 | 109.72 | 45.24 | |
| South East | Guangdong | 188 | 17.62 | 29.90 | 20.62 | 33.18 | 21.64 | 33.16 |
| Guangxi | 144 | 26.15 | 31.53 | 29.17 | 36.44 | 33.34 | 37.83 | |
| Jiangxi | 140 | 23.87 | 30.50 | 27.75 | 29.10 | 29.36 | 30.20 | |
| Zhejiang | 87 | 6.86 | 37.31 | 7.86 | 36.46 | 8.75 | 38.75 | |
| Hainan | 19 | 12.29 | 60.39 | 14.97 | 58.93 | 14.76 | 57.45 | |
| Fujian | 106 | 14.68 | 42.83 | 16.07 | 44.64 | 17.20 | 45.57 | |
| total | 684 | 101.46 | 34.61 | 116.44 | 36.33 | 125.04 | 37.15 | |
| Total | China | 3706 | 888.32 | 34.96 | 939.44 | 36.36 | 985.63 | 37.76 |
Table 3.
Stage 2 panel SFA model results (the effect of external environmental factors).
| Environment Variables | Carbon Sequestration Slack Variable | Income Slack Variable | |||
|---|---|---|---|---|---|
| Coefficient | S.D. | Coefficient | S.D. | ||
| Constant | 7.3338 *** | 0.1781 | 7.6280 *** | 0.1661 | |
| Forest farm attributes | Aff | 0.1802 *** | 0.0397 | 0.4622 *** | 0.0330 |
| Pov | 0.0229 | 0.0318 | −0.0576 ** | 0.0276 | |
| Labor factors | Agi | −0.2483 *** | 0.0757 | 0.2264 *** | 0.0683 |
| Edu | 0.4032 *** | 0.0840 | −0.0765 | 0.0793 | |
| LnInc | −0.0325 ** | 0.0154 | 0.3114 *** | 0.0152 | |
| Material resources | Inf | 0.0250 * | 0.0127 | 0.0881 *** | 0.0120 |
| Lnfac | −0.0490 *** | 0.0083 | −0.0329 *** | 0.0079 | |
| 2.8616 | 0.0695 | 1.7704 | 0.1370 | ||
| 0.8463 *** | 0.0044 | 0.7347 *** | 0.0187 | ||
| −16,455.693 | −15152.534 | ||||
Note: ***, **, and * indicate significance at the 1%, 5%, and 10% significance levels, respectively.
Table 4.
Carbon sequestration output efficiency of China’s state-owned forest farms in the third stage.
Table 4.
Carbon sequestration output efficiency of China’s state-owned forest farms in the third stage.
| Region | Provincial Unit | 2008–2010 | 2012–2014 | 2015–2018 | ||||||
|---|---|---|---|---|---|---|---|---|---|---|
| TE | PTE | SE | TE | PTE | SE | TE | PTE | SE | ||
| North China | Hebei | 0.2413 | 0.2644 | 0.9053 | 0.2576 | 0.2747 | 0.9345 | 0.2256 | 0.2373 | 0.9483 |
| Inner Mongolia | 0.2065 | 0.2491 | 0.8483 | 0.2139 | 0.2530 | 0.8672 | 0.2145 | 0.2548 | 0.8672 | |
| Shanxi | 0.2651 | 0.2918 | 0.9070 | 0.2540 | 0.2713 | 0.9372 | 0.2748 | 0.2908 | 0.9472 | |
| mean | 0.2356 | 0.2689 | 0.8806 | 0.2366 | 0.2636 | 0.9056 | 0.2410 | 0.2673 | 0.9116 | |
| North East | Heilongjiang | 0.2279 | 0.2730 | 0.8403 | 0.2249 | 0.2645 | 0.8550 | 0.2429 | 0.2773 | 0.8803 |
| Jilin | 0.2364 | 0.2829 | 0.8495 | 0.2359 | 0.2776 | 0.8639 | 0.2266 | 0.2690 | 0.8637 | |
| Liaoning | 0.2302 | 0.2517 | 0.9151 | 0.2330 | 0.2485 | 0.9382 | 0.2519 | 0.2679 | 0.9446 | |
| mean | 0.2313 | 0.2724 | 0.8578 | 0.2303 | 0.2660 | 0.8740 | 0.2389 | 0.2726 | 0.8867 | |
| North West | Ningxia | 0.2405 | 0.2617 | 0.9182 | 0.2582 | 0.2770 | 0.9332 | 0.2770 | 0.2967 | 0.9369 |
| Shaanxi | 0.2321 | 0.2692 | 0.8612 | 0.2321 | 0.2662 | 0.8783 | 0.2356 | 0.2652 | 0.8949 | |
| Xinjiang | 0.2884 | 0.3257 | 0.8898 | 0.2651 | 0.2973 | 0.8974 | 0.3183 | 0.3623 | 0.8971 | |
| mean | 0.2465 | 0.2797 | 0.8816 | 0.2458 | 0.2756 | 0.8961 | 0.2639 | 0.2942 | 0.9058 | |
| Central South | Anhui | 0.2169 | 0.2285 | 0.9527 | 0.2186 | 0.2278 | 0.9625 | 0.2233 | 0.2315 | 0.9664 |
| Henan | 0.1997 | 0.2257 | 0.8855 | 0.2241 | 0.2491 | 0.9032 | 0.2168 | 0.2383 | 0.9129 | |
| Hubei | 0.2589 | 0.2807 | 0.9249 | 0.2549 | 0.2739 | 0.9422 | 0.2946 | 0.3131 | 0.9487 | |
| Hunan | 0.2120 | 0.2399 | 0.8837 | 0.2281 | 0.2479 | 0.9218 | 0.2537 | 0.2699 | 0.9407 | |
| Jiangsu | 0.2225 | 0.2335 | 0.9490 | 0.2381 | 0.2527 | 0.9485 | 0.2316 | 0.2393 | 0.9690 | |
| Shandong | 0.2713 | 0.2835 | 0.9655 | 0.2854 | 0.2995 | 0.9682 | 0.3012 | 0.3130 | 0.9679 | |
| mean | 0.2350 | 0.2551 | 0.9227 | 0.2437 | 0.2611 | 0.9408 | 0.2635 | 0.2786 | 0.9496 | |
| South West | Guizhou | 0.2675 | 0.2805 | 0.9525 | 0.3045 | 0.3171 | 0.9619 | 0.3206 | 0.3358 | 0.9540 |
| Sichuan | 0.2771 | 0.2963 | 0.9392 | 0.2769 | 0.2951 | 0.9446 | 0.2914 | 0.3061 | 0.9603 | |
| Yunnan | 0.3118 | 0.3340 | 0.9254 | 0.3173 | 0.3349 | 0.9390 | 0.3321 | 0.3548 | 0.9359 | |
| Chongqing | 0.2352 | 0.2516 | 0.9356 | 0.2817 | 0.2918 | 0.9662 | 0.3127 | 0.3257 | 0.9607 | |
| mean | 0.2768 | 0.2947 | 0.9384 | 0.2958 | 0.3110 | 0.9513 | 0.3136 | 0.3303 | 0.9521 | |
| South East | Fujian | 0.2849 | 0.2962 | 0.9626 | 0.2793 | 0.2994 | 0.9301 | 0.2831 | 0.3049 | 0.9262 |
| Guangdong | 0.2624 | 0.2827 | 0.9369 | 0.2846 | 0.3051 | 0.9438 | 0.3453 | 0.3681 | 0.9485 | |
| Guangxi | 0.2359 | 0.2660 | 0.8974 | 0.2637 | 0.2933 | 0.9159 | 0.2637 | 0.2938 | 0.9165 | |
| Hainan | 0.2782 | 0.3553 | 0.8522 | 0.2915 | 0.3775 | 0.8439 | 0.2754 | 0.3491 | 0.8585 | |
| Jiangxi | 0.2228 | 0.2529 | 0.8762 | 0.2181 | 0.2453 | 0.8914 | 0.2342 | 0.2619 | 0.9001 | |
| Zhejiang | 0.2893 | 0.3026 | 0.9602 | 0.3007 | 0.3141 | 0.9576 | 0.3163 | 0.3321 | 0.9541 | |
| mean | 0.2561 | 0.2797 | 0.9208 | 0.2680 | 0.2926 | 0.9241 | 0.2901 | 0.3158 | 0.9266 | |
| China | mean | 0.2435 | 0.2723 | 0.8982 | 0.2496 | 0.2751 | 0.9134 | 0.2643 | 0.289 | 0.9207 |
Table 5.
Carbon sequestration output efficiency change rate, ranking, and ranking change of state-owned forest farms in China’s provinces from Stage 1 to Stage 3.
Table 5.
Carbon sequestration output efficiency change rate, ranking, and ranking change of state-owned forest farms in China’s provinces from Stage 1 to Stage 3.
| Region | Provincial Unit | Rate of Change of TE | Rate of Change of PTE | Rate of Change of SE | TE Ranking | PTE Ranking | SE Ranking | Ranking Change for TE | Ranking Change for PTE | Ranking Change for SE |
|---|---|---|---|---|---|---|---|---|---|---|
| North China | Hebei | 7.78% | 10.08% | −2.18% | 15 | 18 | 15 | −4 | −6 | −4 |
| Inner Mongolia | 7.87% | 18.69% | −6.79% | 25 | 22 | 22 | −4 | −2 | 2 | |
| Shanxi | 7.60% | 10.19% | −2.22% | 12 | 12 | 13 | −4 | −4 | −3 | |
| North East | Heilongjiang | 14.37% | 23.25% | −6.73% | 19 | 16 | 24 | 0 | 2 | 1 |
| Jilin | 20.83% | 32.32% | −7.13% | 18 | 15 | 23 | 6 | 8 | 0 | |
| Liaoning | 14.07% | 16.63% | −2.37% | 16 | 19 | 12 | 2 | 0 | −4 | |
| North West | Ningxia | 4.60% | 6.54% | −2.10% | 13 | 14 | 14 | −6 | −8 | −2 |
| Shaanxi | 18.45% | 26.06% | −5.63% | 17 | 17 | 21 | 3 | 4 | 1 | |
| Xinjiang | 10.63% | 17.76% | −4.88% | 5 | 3 | 19 | −3 | −2 | 0 | |
| Central South | Anhui | 13.18% | 15.17% | −1.55% | 23 | 25 | 2 | 0 | −1 | −1 |
| Henan | 14.89% | 20.25% | −4.23% | 24 | 24 | 18 | 1 | 1 | 2 | |
| Hubei | 26.25% | 26.88% | −1.04% | 11 | 11 | 10 | 5 | 5 | 4 | |
| Hunan | 6.75% | 10.24% | −3.37% | 20 | 21 | 16 | −5 | −6 | 0 | |
| Jiangsu | 8.11% | 8.59% | −0.59% | 21 | 23 | 5 | −5 | −6 | 1 | |
| Shandong | 18.87% | 16.12% | 1.44% | 6 | 9 | 1 | 3 | 0 | 8 | |
| South West | Guizhou | 14.92% | 15.88% | −1.02% | 3 | 6 | 4 | 0 | −2 | 1 |
| Sichuan | 27.53% | 29.17% | −1.21% | 8 | 8 | 7 | 5 | 5 | 0 | |
| Yunnan | 47.11% | 47.68% | −1.61% | 1 | 2 | 11 | 13 | 12 | 2 | |
| Chongqing | 9.40% | 11.10% | −1.37% | 10 | 10 | 6 | −5 | −3 | −2 | |
| South East | Fujian | 10.87% | 14.22% | −3.16% | 7 | 7 | 9 | −3 | −2 | −6 |
| Guangdong | 18.37% | 17.56% | −0.51% | 4 | 4 | 8 | 2 | −1 | 7 | |
| Guangxi | 7.72% | 11.18% | −3.47% | 14 | 13 | 17 | −4 | −3 | 1 | |
| Hainan | 25.80% | 52.10% | −10.07% | 9 | 1 | 25 | 3 | 10 | −8 | |
| Jiangxi | 15.26% | 21.11% | −5.40% | 22 | 20 | 20 | 0 | 2 | 1 | |
| Zhejiang | 12.05% | 13.40% | −1.36% | 2 | 5 | 3 | −1 | −4 | −1 |
Table 6.
Estimated results of influencing factors of internal operating behavior in different regions.
Table 6.
Estimated results of influencing factors of internal operating behavior in different regions.
| Independent Variable | China | North East | North China | North West | Central South | South West | South East |
|---|---|---|---|---|---|---|---|
| FFE | 0.3240 *** | 0.2495 *** | 0.3490 *** | 0.3310 *** | 0.2864 *** | 0.1766 *** | 0.3000 *** |
| FLUS | 0.00003 * | 0.0638 *** | 0.00003 * | 0.0016 ** | 0.0128 *** | 0.1781 *** | 0.0348 *** |
| AI | 0.0005 | −0.0046 | 0.0734 *** | 0.0117 | −0.0024 | 0.0112 | −0.0023 |
| HAR | −0.0004 | 0.0042 * | 0.0166 * | 0.0542 * | −0.0094 * | −0.0452 *** | −0.0164 ** |
| UFE | 0.0315 *** | −0.0019 | 0.0409 *** | 0.0335 * | 0.0347 *** | −0.0398 ** | 0.0197 |
| FT | 0.0207 *** | 0.0058 | 0.0253 | 0.0852 *** | 0.0077 | −0.0129 | 0.0800 *** |
| 0.1058 *** | 0.0630 *** | 0.1220 *** | 0.1594 *** | 0.0859 *** | 0.1114 *** | 0.0989 *** | |
| 0.0873 *** | 0.0791 *** | 0.0774 *** | 0.0966 *** | 0.0805 *** | 0.0838 *** | 0.1059 *** | |
| 0.5947 | 0.3882 | 0.7129 | 0.7314 | 0.5322 | 0.6388 | 0.4658 | |
| 3671.43 *** | 368.40 *** | 885.37 *** | 415.55 *** | 628.64 *** | 480.71 *** | 399.72 *** |
Note: ***, **, and * indicate significance at the 1%, 5%, and 10% significance levels, respectively.
Publisher’s Note: MDPI stays neutral with regard to jurisdictional claims in published maps and institutional affiliations. |
© 2022 by the authors. Licensee MDPI, Basel, Switzerland. This article is an open access article distributed under the terms and conditions of the Creative Commons Attribution (CC BY) license (https://creativecommons.org/licenses/by/4.0/).
Share and Cite
MDPI and ACS Style
Liang, C.; Wei, X.; Meng, J.; Chen, W. How to Improve Forest Carbon Sequestration Output Performance: An Evidence from State-Owned Forest Farms in China. Forests 2022, 13, 778. https://0-doi-org.brum.beds.ac.uk/10.3390/f13050778
AMA Style
Liang C, Wei X, Meng J, Chen W. How to Improve Forest Carbon Sequestration Output Performance: An Evidence from State-Owned Forest Farms in China. Forests. 2022; 13(5):778. https://0-doi-org.brum.beds.ac.uk/10.3390/f13050778
Chicago/Turabian StyleLiang, Chen, Xue Wei, Jixian Meng, and Wenhui Chen. 2022. "How to Improve Forest Carbon Sequestration Output Performance: An Evidence from State-Owned Forest Farms in China" Forests 13, no. 5: 778. https://0-doi-org.brum.beds.ac.uk/10.3390/f13050778
Note that from the first issue of 2016, this journal uses article numbers instead of page numbers. See further details here.