Article

Changes in the Abundance of Monoterpenes from Breathable Air of a Mediterranean Conifer Forest: When Is the Best Time for a Human Healthy Leisure Activity?

by
Domingo Sancho-Knapik
1,2,*,
Eustaquio Gil-Pelegrín
1,*,
Juan Pedro Ferrio
1,3,
David Alonso-Forn
1,
Rubén Martín-Sánchez
1,
José Víctor dos Santos Silva
1,
Junichi Imanishi
4,
José Javier Peguero-Pina
1,2 and
María Ángeles Sanz
2,5
1
Departamento de Sistemas Agrícolas, Forestales y Medio Ambiente, Centro de Investigación y Tecnología Agroalimentaria de Aragón (CITA), Avda. Montañana 930, 50059 Zaragoza, Spain
2
Instituto Agroalimentario de Aragón-IA2 (CITA-Universidad de Zaragoza), 50018 Zaragoza, Spain
3
Aragón Agency for Research and Development (ARAID), 50018 Zaragoza, Spain
4
Department of Environmental Sciences and Technology, Graduate School of Agriculture, Osaka Metropolitan University, Osaka 599-8531, Japan
5
Área de Laboratorios de Análisis y Asistencia Tecnológica, Centro de Investigación y Tecnología Agroalimentaria de Aragón (CITA), Avda. Montañana 930, 50059 Zaragoza, Spain
*
Authors to whom correspondence should be addressed.
Submission received: 17 May 2022 / Revised: 17 June 2022 / Accepted: 18 June 2022 / Published: 20 June 2022
(This article belongs to the Special Issue Forest Recreation and Landscape Protection)

Abstract

:
The exposure to monoterpenes emitted by plants to the air might provide human health benefits during forest-based leisure activities. However, forests, especially Mediterranean ones, lack studies to relate forest production and the emission of monoterpenes, considering potential human forest exposure. Thus, the aim of this study was to analyze the variation in the abundance of monoterpenes in the human breathable air under the canopy of a Mediterranean conifer forest, evaluating the influence of different factors. For this purpose, from March to November 2018, we monitored the abundance of monoterpenes in the air at nose height, leaf development, air temperature and soil water potential in a mountain Mediterranean forest of Pinus pinaster located in Sierra de Albarracín (Teruel, Spain). We detected six monoterpenes, with α-pinene, β-pinene and limonene being the three most abundant. Temperature was the main environmental factor driving the abundance of monoterpenes in air, with a maxima of abundance found during summer. Leaf development in spring decreased the abundance, while after a drought period, the abundance increased. Thus, people enjoying forest-based activities in Mediterranean conifer areas would be more exposed to air monoterpenes when the temperature increases during the period after leaf development, as long as the trees are not severely water-stressed. If that is the case, the abundance of monoterpenes in the air would increase after the drought period.

1. Introduction

Tourists are becoming more and more sensitive to the environment and nature, turning towards rural areas and away from noise and chaos of city life, mainly due to a higher education level and an increased consciousness of a healthier lifestyle [1,2,3]. Over the last decades, this fact has promoted the development of a great diversity of ecotourism products and leisure activities related to nature and forests, such as ecological farms [3], green hotels [4], and mycotourism [5,6]. The implementation of most of these nature-based activities is mainly influenced by weather variables [7] such as temperature and precipitation, which are the two most common variables used in tourism-based weather impact studies [8,9,10,11,12,13,14,15]. Weather conditions have already been interpreted through relationships with personal characteristics [14] and used to predict thermal sensation [15,16,17]. Furthermore, the interaction between human and atmosphere has also been used to understand and predict nature-based tourist behavior [18,19] and to develop adaptation strategies [20].
Apart from the weather conditions, there are other environmental factors that could influence forest recreation plans [7], especially those that incorporate forest activities that aim to obtain diverse human health benefits, as in the case of so-called “shinrin-yoku” or forest bathing [21], which is becoming an important forest health practice around the world due to its capacity to provide relaxation and reduce stress [22,23]. Among these other environmental factors, the exposure to atmospheric volatile organic compounds (VOCs), specifically to the monoterpenes group, is one of the aspects most currently being evaluated, as apparently, they can provide human wellness [10,24,25]. Monoterpenes produced by plants, primarily conifers, as a defensive mechanism to pathogens [26,27,28], are supposed to exert anti-inflammatory, antioxidant, anti-cancer or neuroprotection effects on humans (see references within [24,25]). Thus, exposure to these compounds during forest-based activities may provide additional therapeutic benefits. However, evidence relating forest exposure to monoterpenes and human health benefits remains uncertain, due to the lack of forest type descriptions and the high heterogeneity of approaches and analyses within the studies performed [29]. In this sense, knowing the air abundance of monoterpenes in a particular forest would be a first step to establish further relationships between forest monoterpenes and human health.
The abundance of monoterpenes in forest air may change during the year, as they depend not only on their synthesis by plants, but also on their emission [30]. At the same time, both processes (synthesis and emission) may be subjected to several environmental stimuli [31]. On the one hand, the synthesis of monoterpenes may depend primarily on plant genetics, incident sunlight and air temperature, being influenced by other factors such as plant phenology, soil water availability, wind or physical disturbance that may generate deviations from the general patterns [30]. On the other hand, the emission of monoterpenes may also depend primarily on temperature, being influenced by relative humidity or water availability [30].
The combination and interaction of the different environmental stimuli would result in a particular abundance of monoterpenes for a specific forest type. While temperate and tropical forests from Asia appear to be well studied, Mediterranean forests from southern Europe seem to be scarcely analyzed [29]. As Mediterranean-type forests are characterized by particular climatic conditions such as a summer drought period [32], the variation in the atmospheric abundance of monoterpenes may have a distinct performance in these types of forests compared to others. Therefore, the aim of this study was to analyze the variation in the abundance of monoterpenes in the human breathable air under the canopy of a forest dominated by the Mediterranean conifer Pinus pinaster Ait. located in the east of the Iberian Peninsula, evaluating the influence of phenology and environmental factors. This would help to predict, from a few environmental factors, the composition and abundance of monoterpenes at nose height under Mediterranean forest canopies, important in human health-based forest activities.

2. Materials and Methods

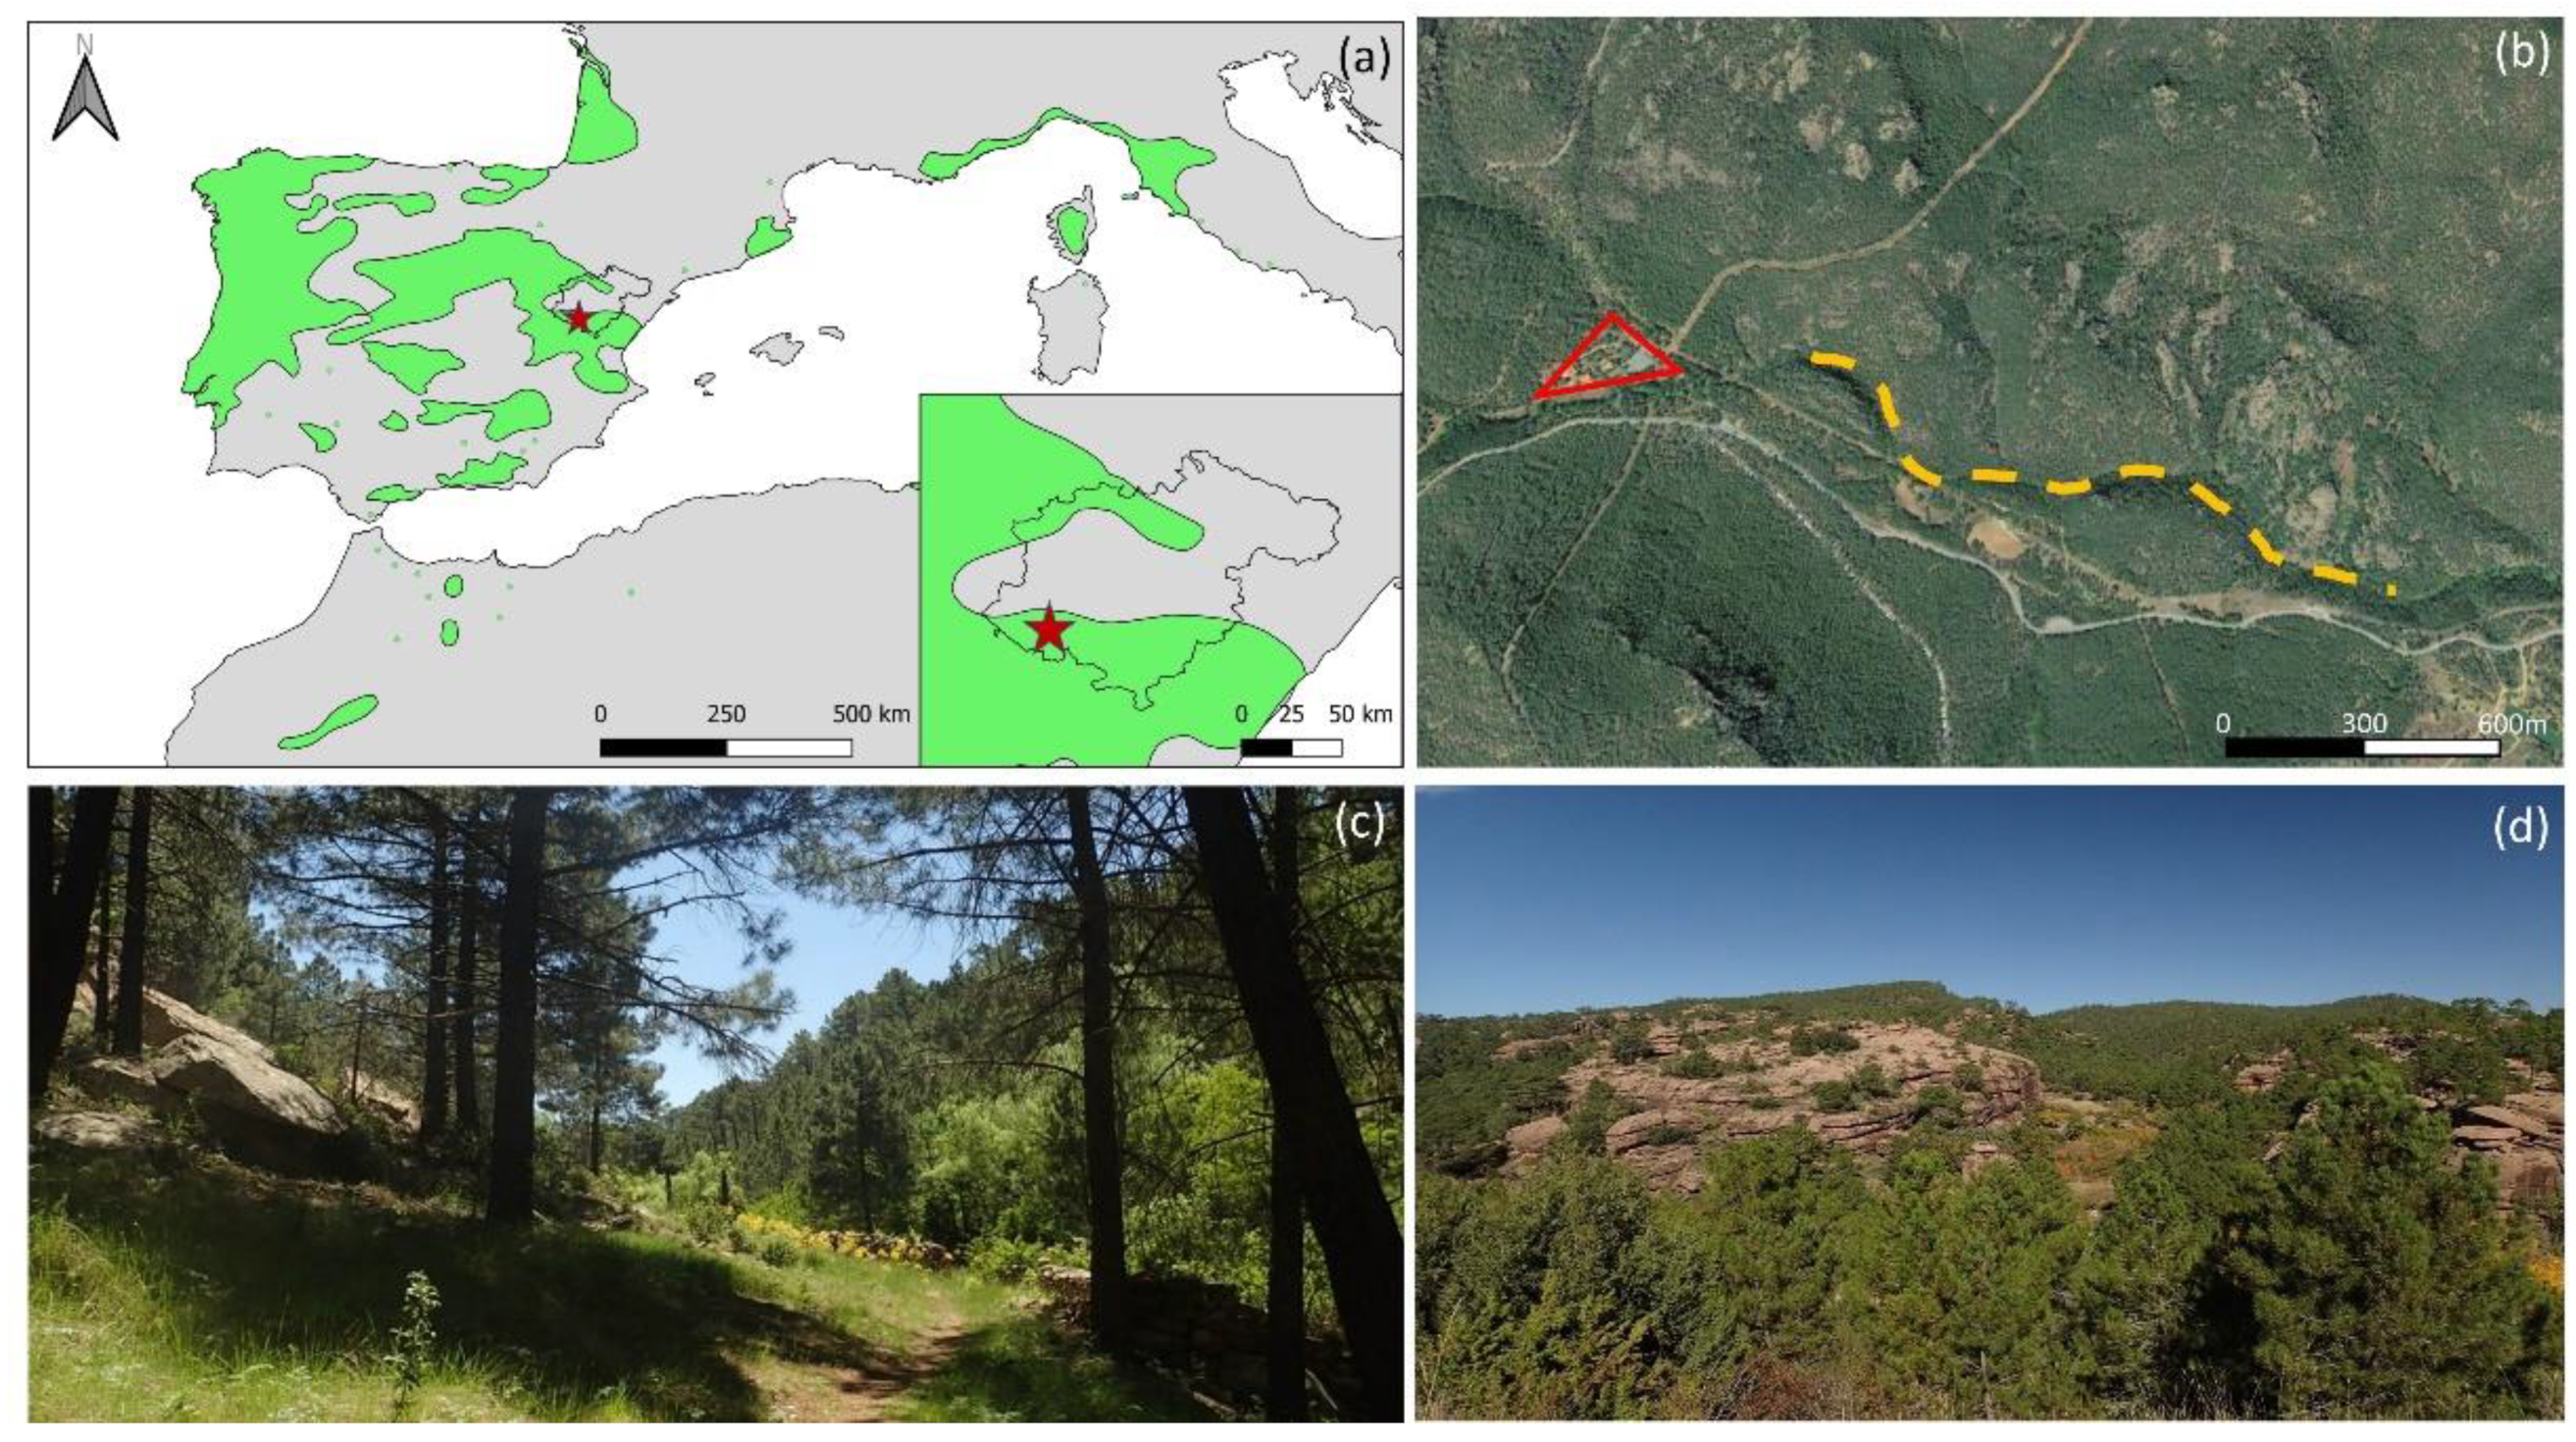
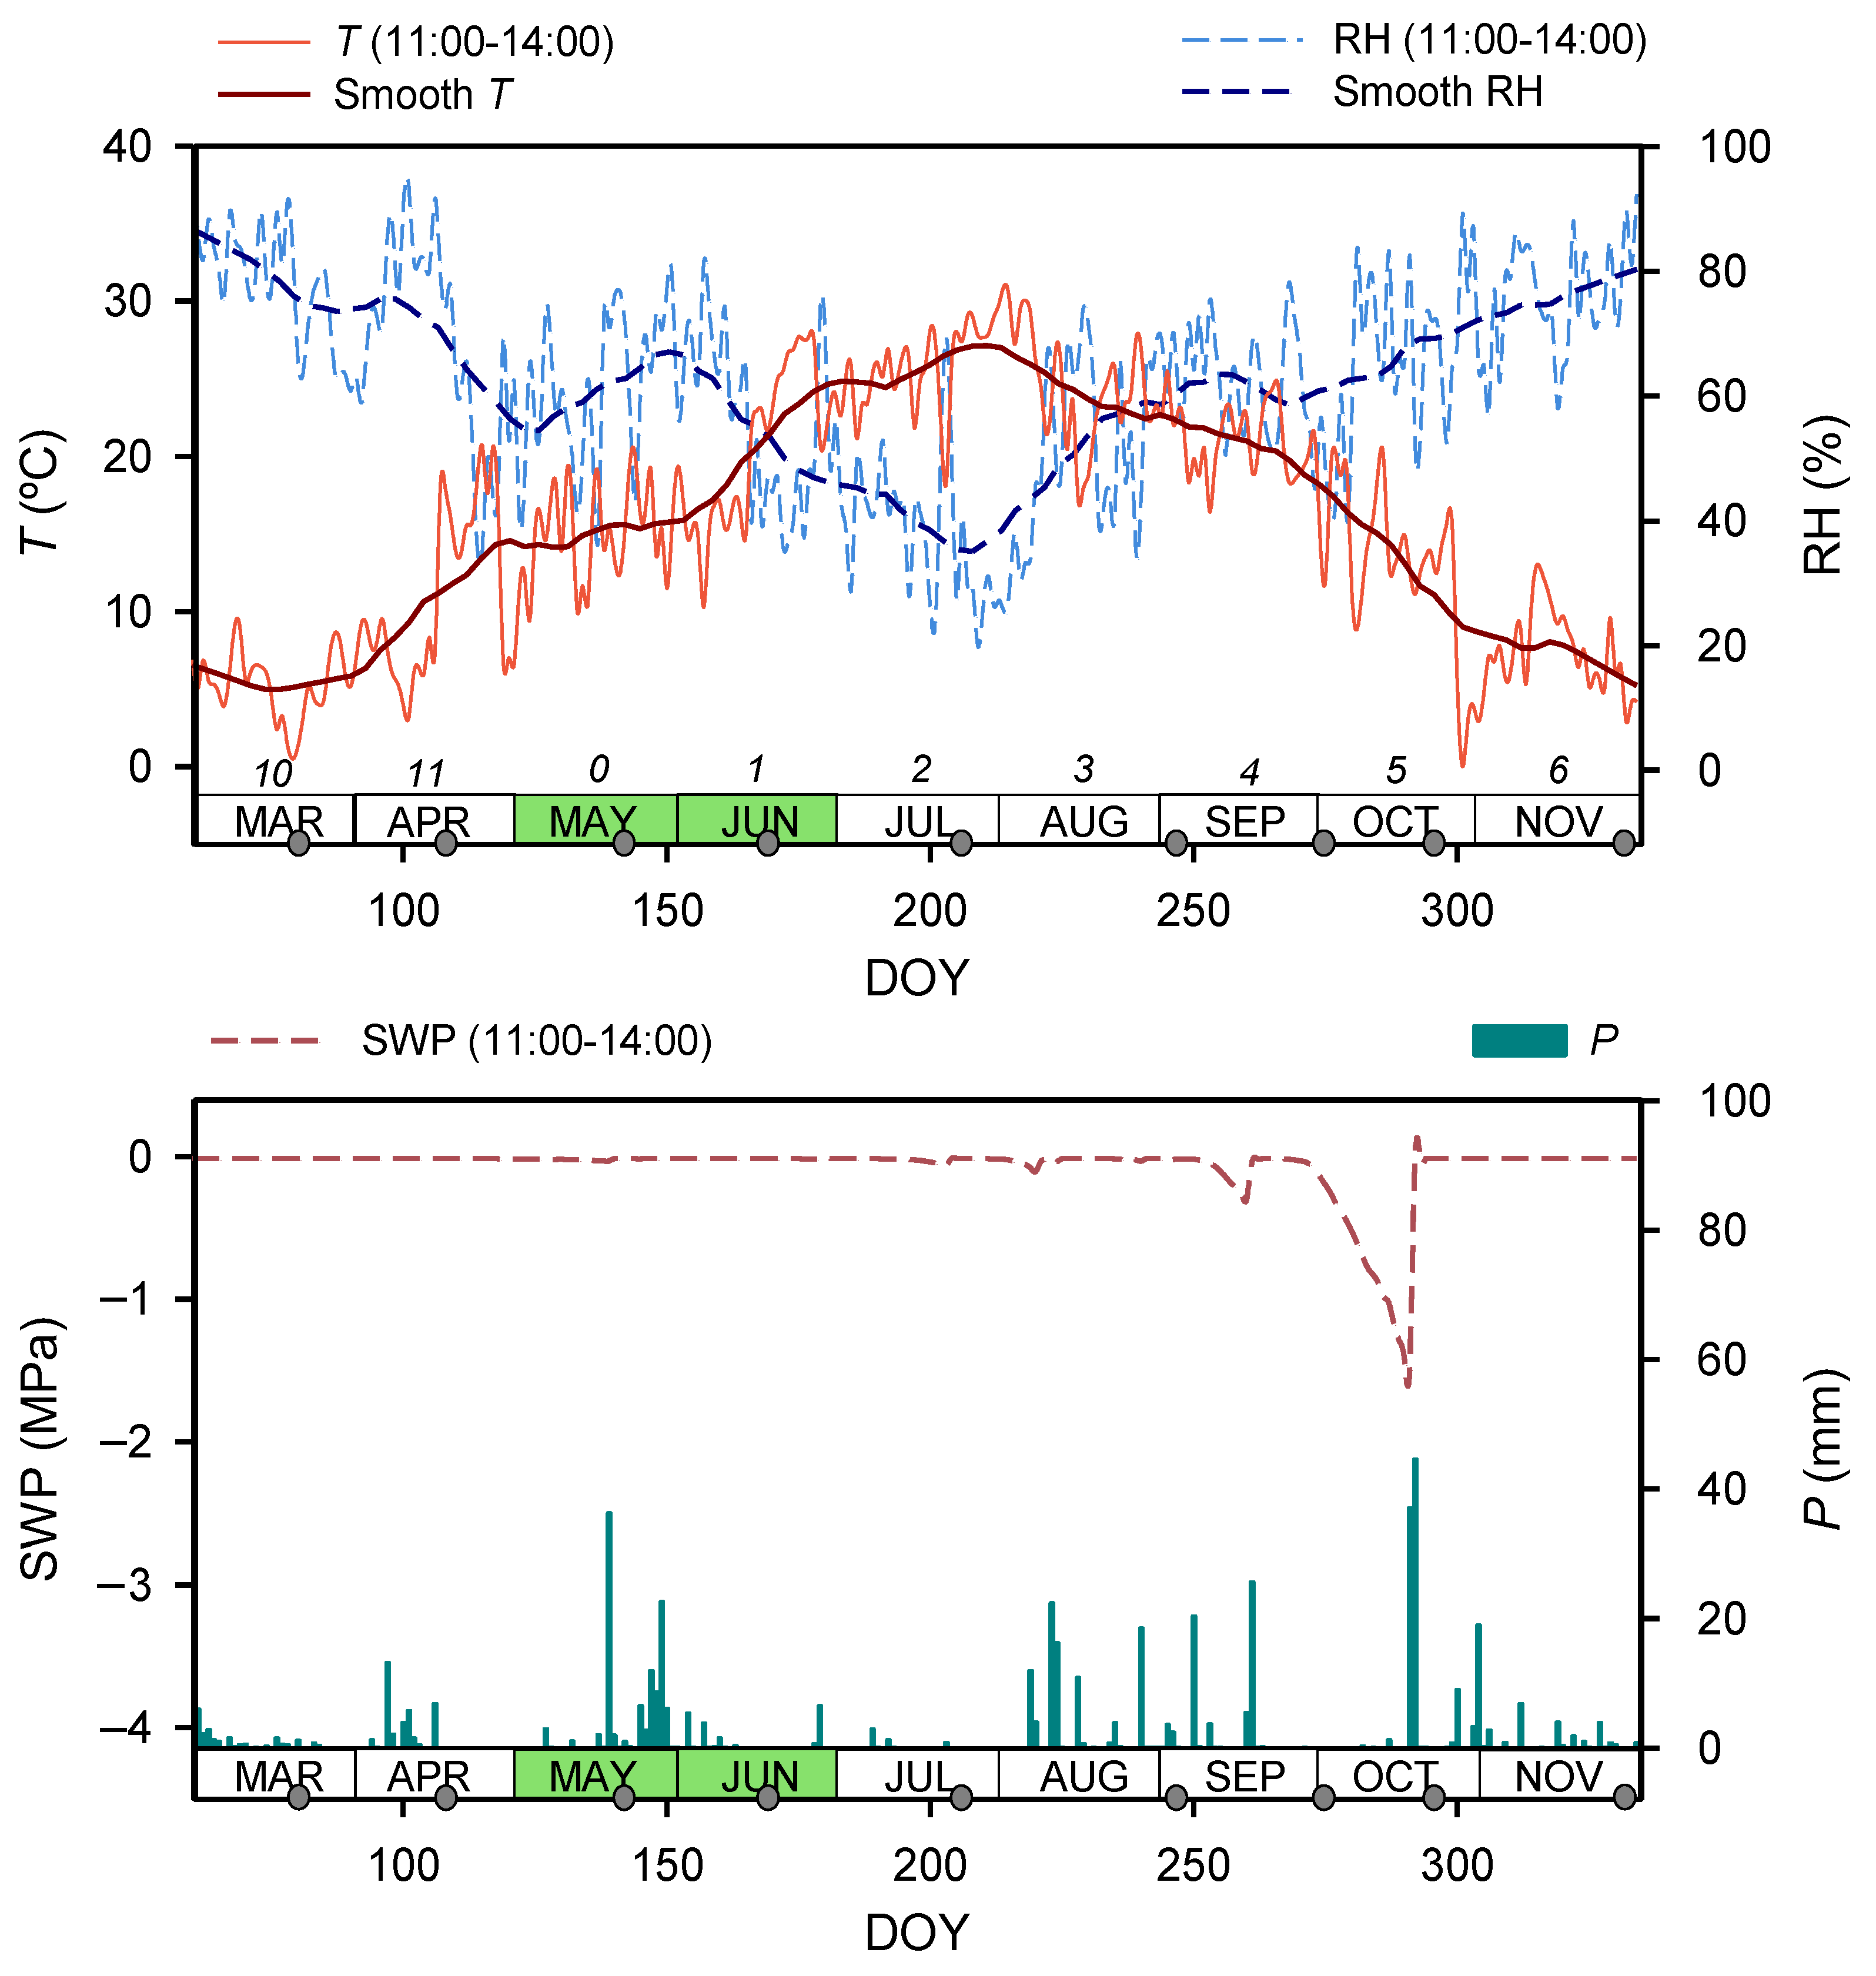
2.1. Experimental Site

The study site is composed of a healthy woodland dominated by Pinus pinaster located within a protected landscape area of ca. 6800 ha in the east of Spain (40°19′59.00″ N, 1°21′09.49″ W, 1206 m a.s.l., Pinares de Ródeno, Sierra de Albarracín, Teruel, Spain; Figure 1). This protected pine tree landscape is one of the most distinctive natural environments in Spain due to a particular combination of geology, geomorphology, flora and fauna that makes it an attractive area for visitors (http://wildsideholidays.co.uk/pinares-de-rodeno/, accessed on 7 June 2022).
The study site comprises naturally-regenerated pine forests with different age classes (from ca. 20 to ca. 60 years), with some interspersed individuals of Quercus pyrenaica Willd. and Cistus laurifolius L. The mean (± se) height and diameter at 1.30 m of pines were 10.5 ± 0.8 m and 30 ± 3 cm, respectively. The trees did not show any symptoms of either abiotic or biotic stress prior to or during the experiment. The area is characterized by a mountain Mediterranean climate with a mean annual temperature of 8.0 °C and annual precipitation of 567 mm (data obtained from the WorldClim database: http://www.worldclim.org/, accessed on 1 March 2022). The forest is mainly utilized for leisure activities, with a tourist information center, marked walking tracks and wild forest gyms. The environmental quality also adds value to the vast cultural heritage preserved for centuries by human hands. The best example is the Cave Paintings, a World Heritage Site by UNESCO, hidden in many rock shelters.
For the measurements of this study, we selected a flat path 1200 m in length, part of a forest walking track close to the information center (Figure 1). The measurements were performed from March to November 2018, a period that included a whole vegetative season and variability in the environmental conditions.

2.2. Environmental Factors and Phenology

Air temperature (T, °C) and relative humidity (RH, %) were recorded throughout the year using a Hobo Pro RH/Temp data logger (Onset Computer Bourne, MA, USA) installed under the canopy 3 m above the ground. To measure soil water availability, soil water potential (SWP, MPa) was recorded using two soil water potential sensors, connected to a data logger (Teros 21/Em50, METER Group, Inc., Pullman, WA, USA), and installed 40 cm below ground, representative of the root system. Both sensors for the air temperature and soil water potential were located halfway along the sampling path. Additionally, precipitation data was obtained from the closest meteorological station (40°31′00.55″ N, 1°16′06.32″ W, 1000 m a.s.l.).
Bud bursting and needle development were periodically observed every month during 2018. Based on the phenology observed, we defined the variable “leaf stage” to refer to the development of leaves. For the input of “leaf stage” in the statistical analysis, we assigned a value between 0 and 11 to each month, so that 0 was assigned to the first month observing leaf development, 1 to the next month, and so on consecutively up to 11, which was assigned to the month prior to the observation of leaf development.

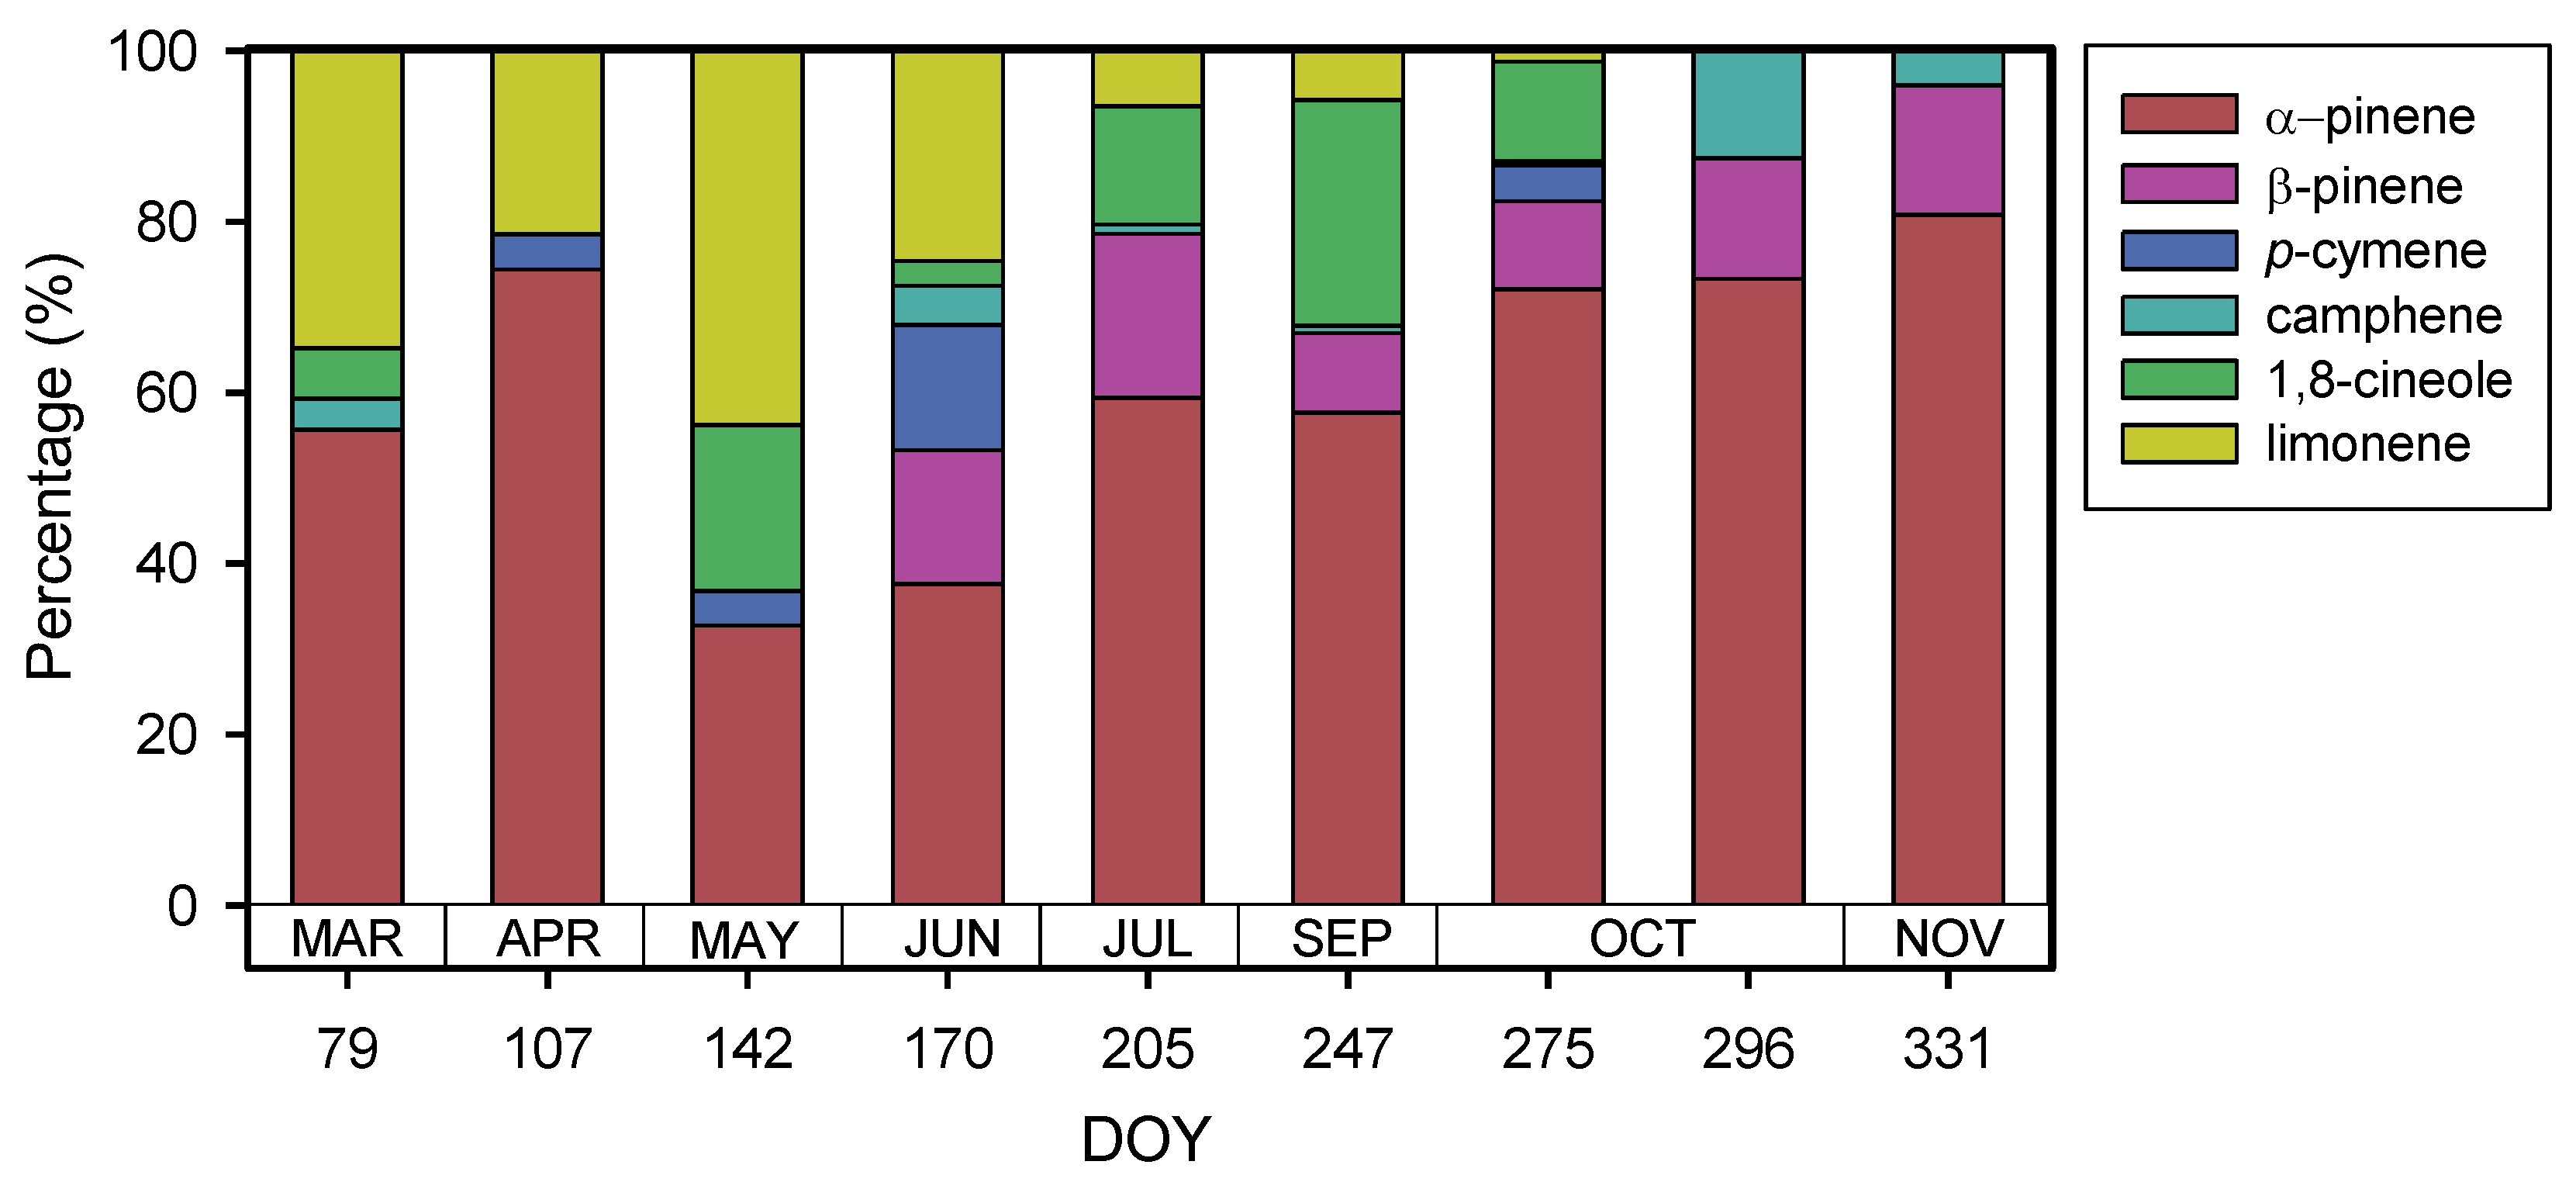
2.3. Monoterpenes Sampling

Air was sampled at nose height (ca. 1.50 m above ground) periodically from March to November 2018, around once per month, for a total of 9 days. For each sampling day, two samples of air per hour were collected throughout the pathway (Figure 1) at three different hours: 11:00 a.m., 12:00 a.m. and 13:00 p.m. h (local time), for 50 min for each sample (i.e., two samples per time x three times). For air sampling, we used adsorbent tubes (Tenax TA, Gerstel GmbH & Co. KG, Mülheim an der Ruhr, Germany) attached with 1 m plastic tubing (Tygon S3 E-3603, Tubes International Sp., Poznań, Poland) to air sampling pumps (flow rate 0.1 L/min, SKC AirChek TOUCH Model 220-5000TC, SKC Inc., Eighty Four, PA, USA). After each air sampling, the adsorbent tubes were hermetically enclosed and kept inside a portable fridge. At the end of the sampling day, a total of six samples (two samples per time × three times) were obtained and carried to the laboratory. The sampling days were selected to avoid weekends (i.e., peak visitor days), rain, or wind force higher than 5 km h−1. The air temperature was also recorded during each sampling time using another Hobo Pro RH/Temp data logger.
Once in the lab, the adsorbent tubes were thermally desorbed and volatile compounds were detected using a gas chromatography tandem mass spectrometer (model 5973N, Agilent Technologies, Santa Clara, CA, USA) [33]. The resulting chromatograms were analyzed to calculate the abundance of each monoterpene (given in area units) as the integrated area below each peak curve [34]. Moreover, we calculated the abundance of total monoterpenes as the sum of the individual areas of the monoterpenes detected.

2.4. Statistical Analysis
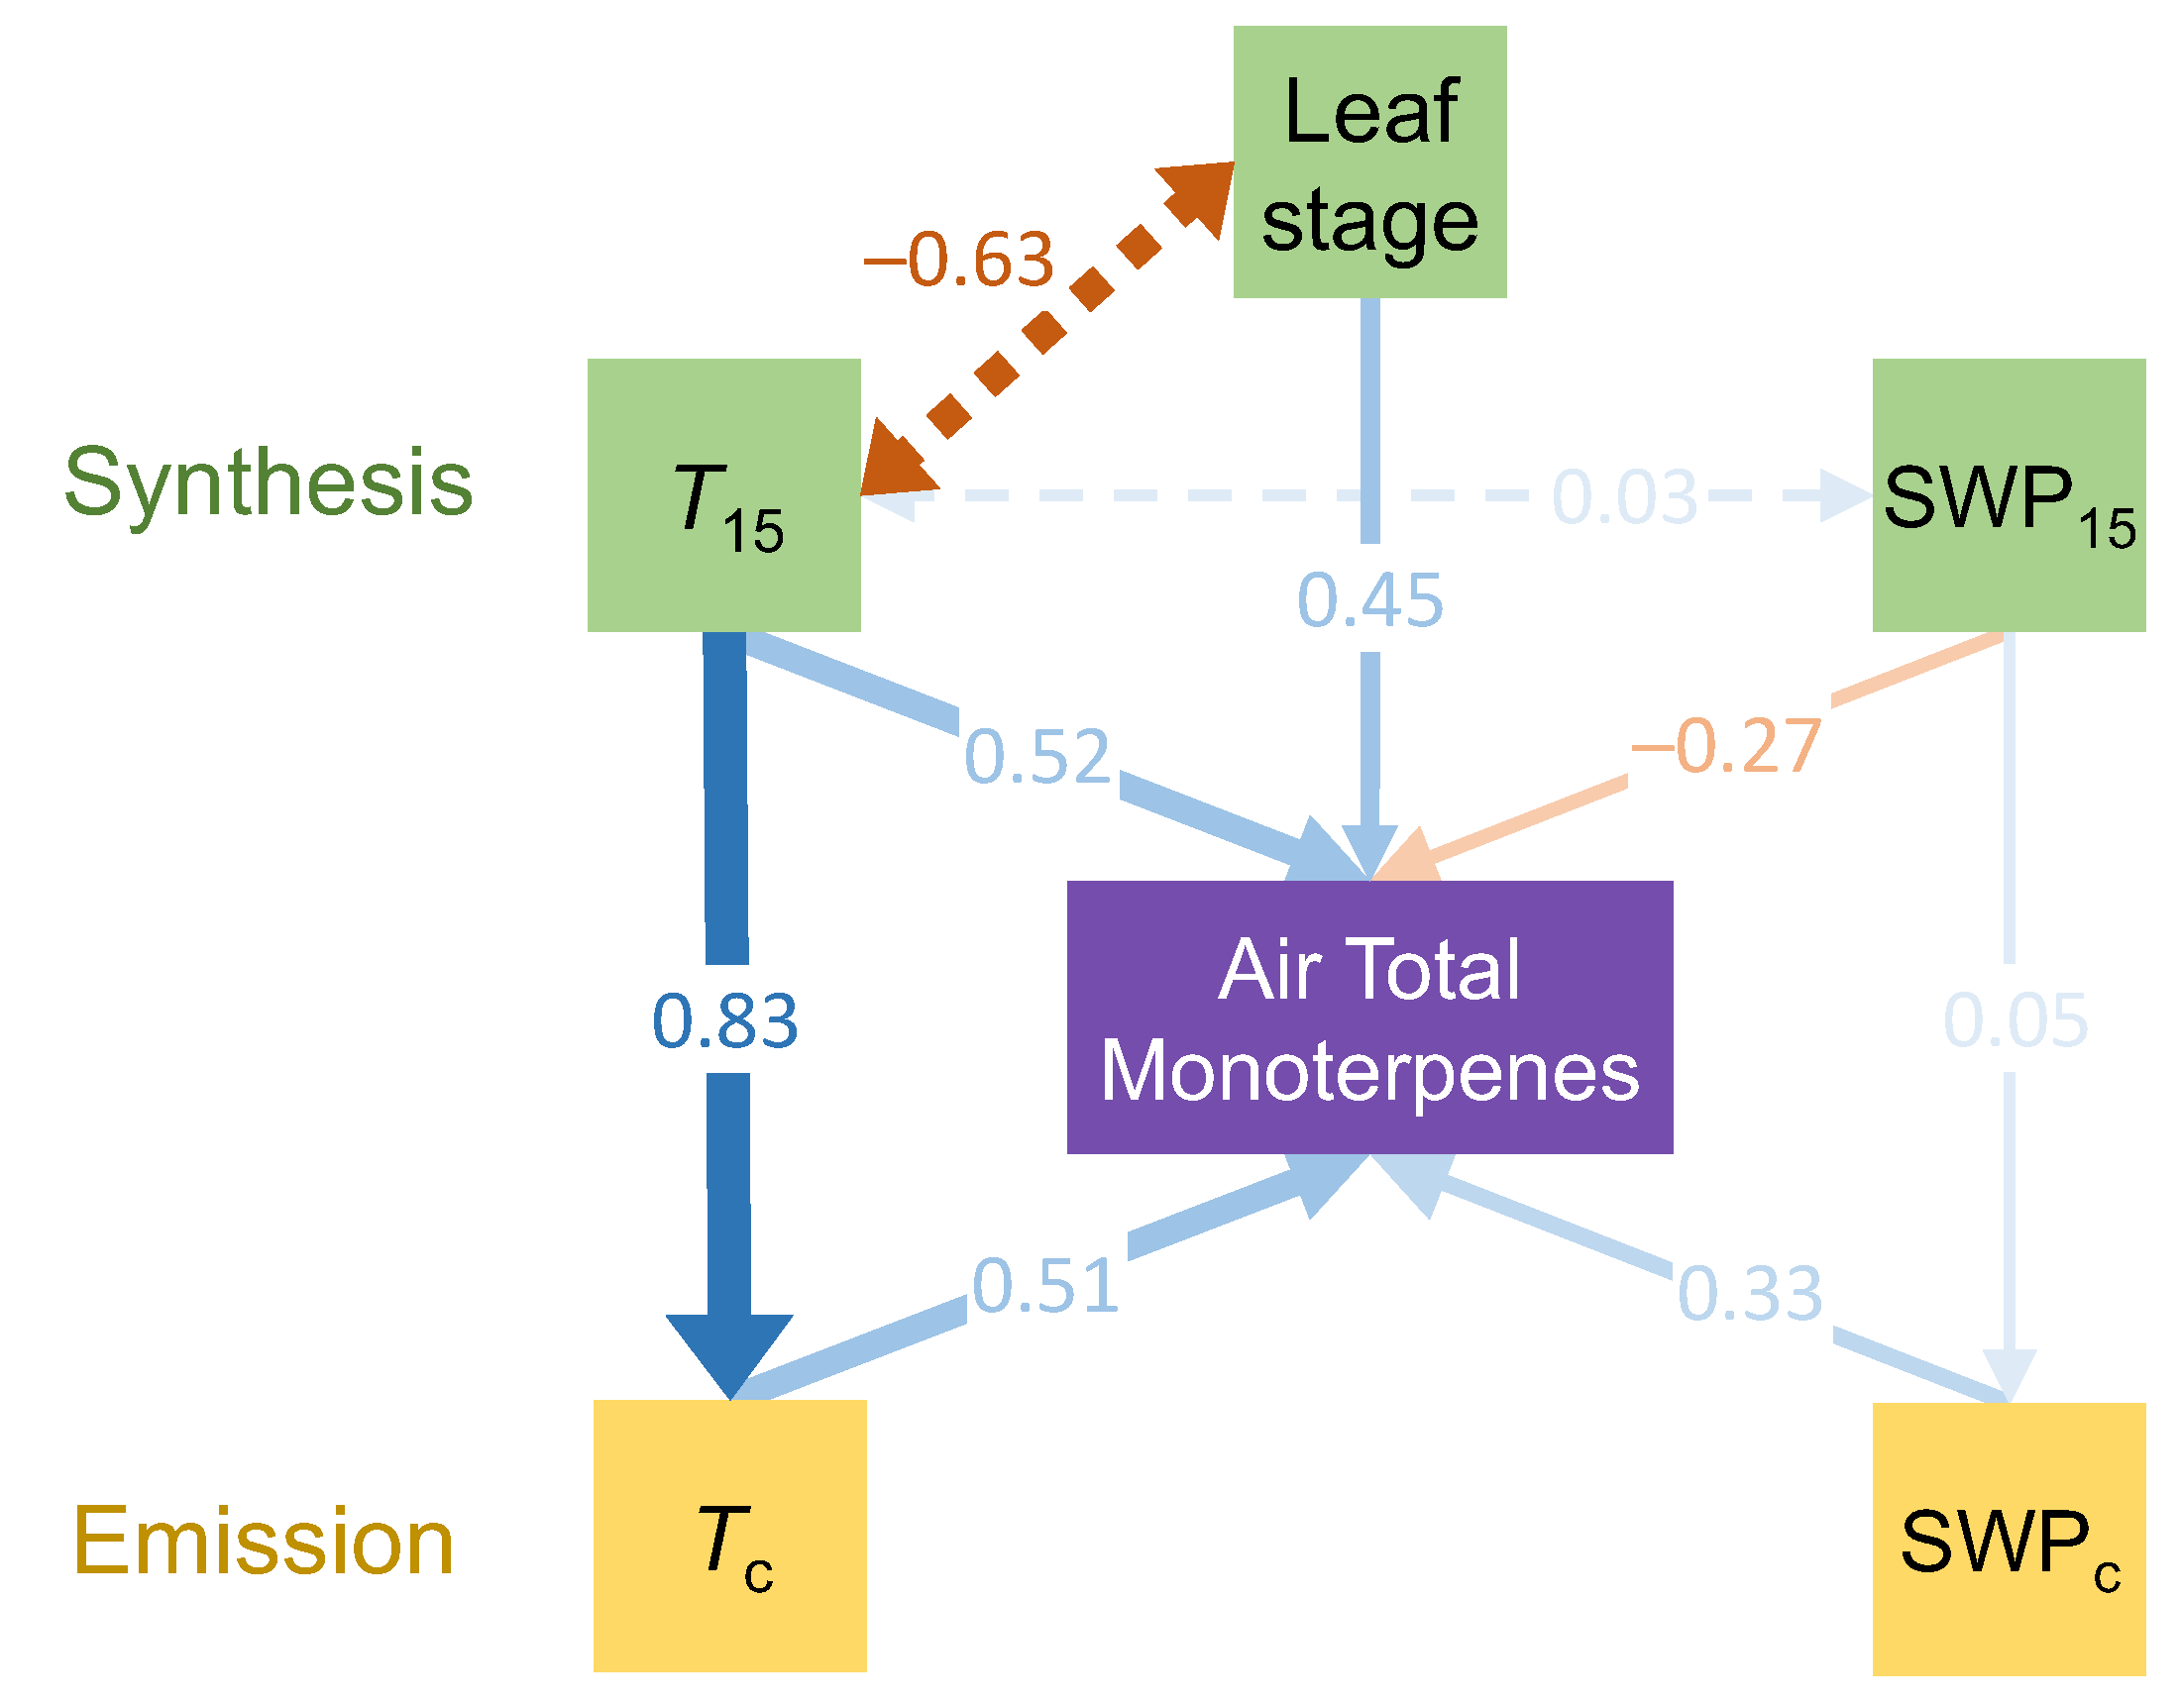
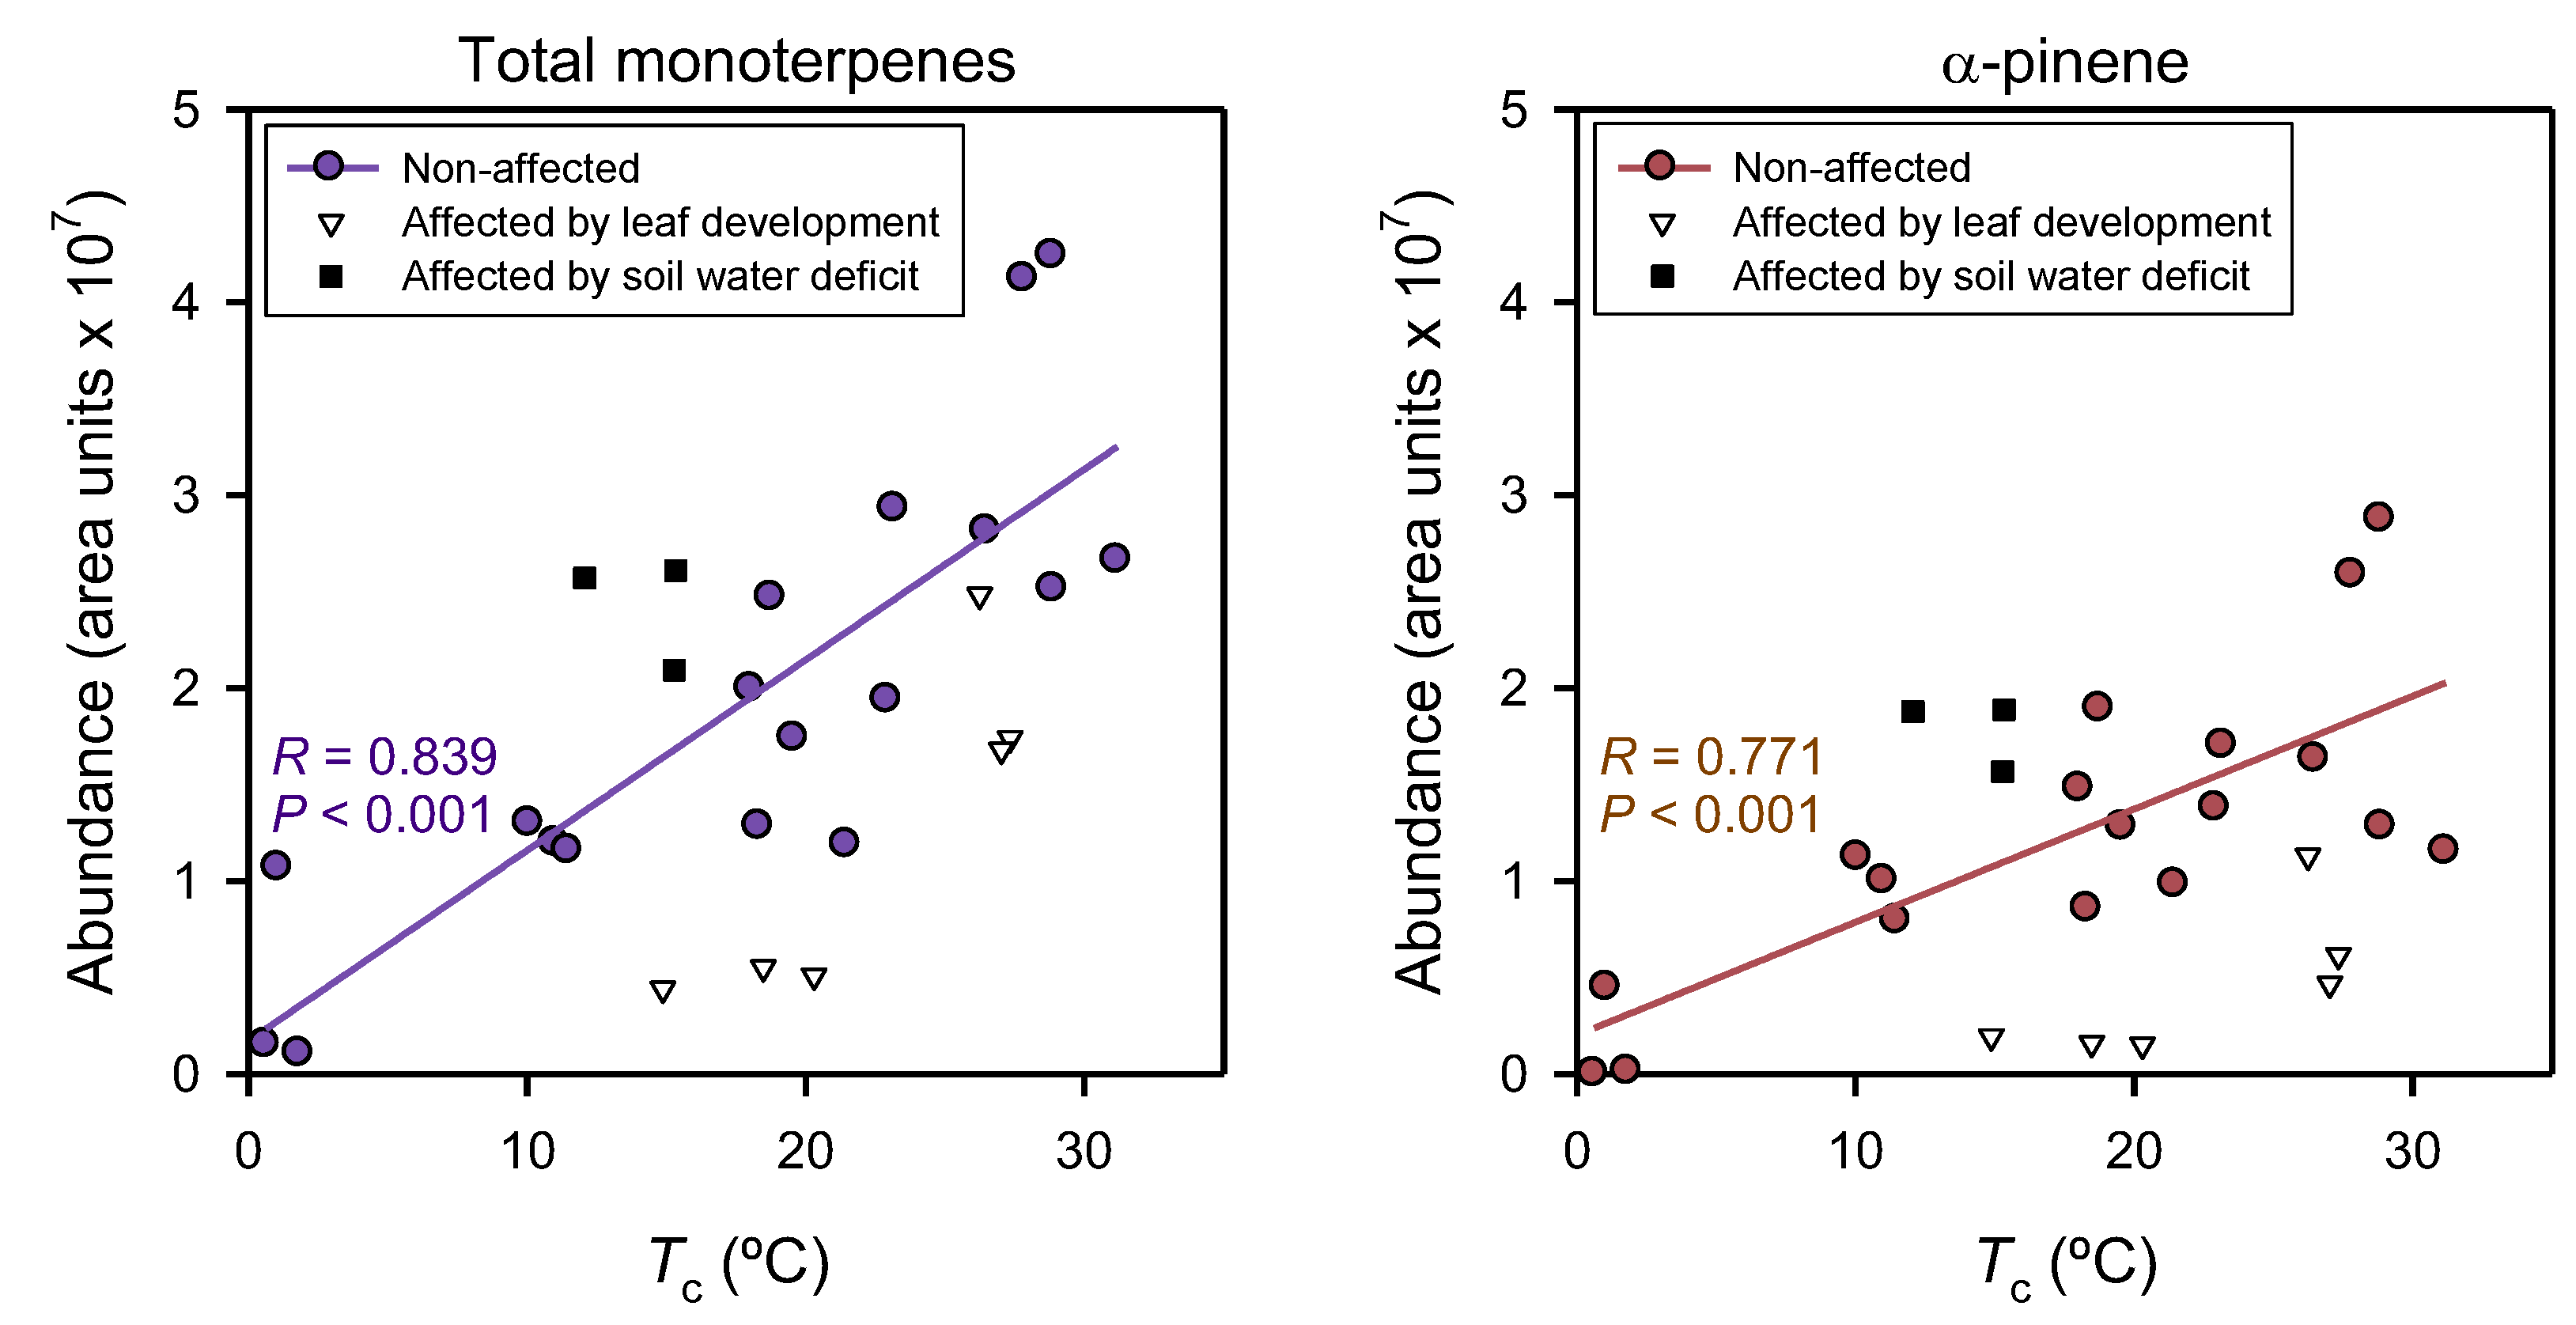
For each air-sampling day, we considered the environmental conditions during the previous 15 days (ca. half of the air-sampling period), as well as during the sampling time, as likely to affect, respectively, the synthesis and emission of monoterpenes. In particular, we selected the following environmental variables influencing the synthesis of monoterpenes: the mean maximum daily temperature of the previous 15 days to the air-sampling day (T15), and the minimum soil water potential of the previous 15 days to the air-sampling day (SWP15). As variables influencing monoterpene emissions, we selected the mean temperature of the current air-sampling time (Tc), and the mean soil water potential of the current air-sampling time (SWPc). For Tc, we calculated three mean values according to the three sampled periods during the day: from 11:00 a.m. to 11:50 a.m., 12:00 a.m. to 12:50 a.m. and from 13:00 p.m. to 13:50 p.m., respectively. For SWPc, we considered a single value, as it remained constant between 11:00 a.m. and 13:50 p.m.
To characterize the connections among the phenology and environmental variables, and determine their relative importance in influencing the monoterpenes in the air, we conducted a path analysis [35]. This analysis uses a path structure that consists of variables of interest with potential connectivity among the variables, where the connections are based on previously well-established knowledge. Based on the variables and the connections, a set of multiple linear regression models is constructed, and the partial regression coefficients are defined as path values that indicate the causative power of each connection [36]. Structural equation models for the path analysis were fitted using the function ‘sem’ from package Lavaan 0.6–10 [37]. The model included “leaf stage”, T15 and SWP15 as exogenous variables and Tc (as a function of T15), SWPc (as a function of SWP15) and air total monoterpenes (as a function of T15 SWP15, Tc and SWPc) as endogenous variables.

3. Results

The evolution of environmental factors in the study area during 2018 showed a general increase in temperature and a decrease in relative humidity from March to the end of July. From then, the temperature started to decrease and the relative humidity increased until November (Figure 2). The soil water potential remained close to zero for most of the studied period, indicating that there was soil water availability most of the time. However, during mid-October, we recorded a 12-day period with values of soil water potential below −0.5 MPa, indicating soil water scarcity (Figure 2). These general trends influenced the environmental variables selected in this study for each air-sampling day (Table 1). The mean maximum daily temperature of the previous 15 days (T15) and mean temperature of the current air-sampling time (Tc) increased from March to July and decreased towards November (Table 1). The minimum soil water potential of the previous 15 days to the air-sampling day (SWP15) showed values between 0 and −0.3 MPa for most of the sampling days; for DOY = 296, SWP15 reached a value of −1.495 MPa. The mean soil water potential of the current air-sampling time (SWPc) showed values close to zero for all sampling days (Table 1).
Bud bursting and needle development occurred during the months of May and June (Figure 2). The needles were fully mature by July. With this phenology, a value of “leaf stage” equal to zero was assigned to May, a value of 1 to June, and so on consecutively, up to 11, which was assigned to April (Figure 2).
Six monoterpenes were detected in the air at nose height below the canopy of the Pinus pinaster forest: α-pinene, β-pinene, limonene, p-cymene, camphene and 1,8-cineole. The evolution of their total abundance given as total monoterpenes, shows variations throughout the year, with minimums of abundance in March and May and a first peak of abundance in April; an increase in abundance from May to July, where the maximum peak was found; a decrease towards October; and a third peak of abundance at the end of October (Figure 3). The most abundant monoterpene detected was α-pinene, which followed the same pattern of variation as the total monoterpenes (Figure 3 and Figure 4). The next two monoterpenes in abundance (although much lower than α-pinene) were β-pinene and limonene. These two monoterpenes followed a similar general trend of variation throughout the year, but with some peculiarities: β-pinene was not detected until June, whereas limonene had its minimum at the beginning of October, not being detected at the end of the study period (Figure 3 and Figure 4). Concerning the other three monoterpenes detected (p-cymene, camphene and 1,8-cineole), the abundance was relatively very low, and variation did not clearly follow the same pattern as the others, being non-detected in some air samples through the study period. The relative maximum abundance of p-cymene, camphene and 1,8-cineole were detected in June, October and September, respectively (Figure 3). It should also be noted that the air samples with the most diversity in terms of the number of monoterpenes detected were those collected from June to the beginning of October, while those samples with less diversity were April, the end of October and November (Figure 3).
The model proposed for the path analysis (Akaike information criterion, AIC = 273) showed a good fitting, with both “leaf stage” and environmental factors (temperature and soil water potential) showing a significant effect on the abundance of total monoterpenes in the air at nose height (Figure 5, Table 2). “Leaf stage” showed a positive relation with total monoterpenes in the air, indicating that the older the current-year leaves, the higher the abundance of monoterpenes, or, i.e., the development of new leaves implied a lower abundance of monoterpenes in the air sampled. Concerning temperature, both the mean maximum daily temperature of the previous 15 days (T15) and the mean temperature of the current air-sampling time (Tc) had a similar positive effect on the abundance of monoterpenes in air. That is, an increase in the temperature might favor both the synthesis and emission of monoterpenes to the forest air (Figure 5, Table 2). Regarding soil water availability, the minimum soil water potential of the previous 15 days (SWP15) exerted a negative effect on total monoterpenes in the air (Figure 5, Table 2), indicating that the lower the soil water potential prior to the air sampling, the higher the abundance of monoterpenes in air. By contrast, the mean soil water potential of the current air-sampling time (SWPc) had a positive effect on total air monoterpenes, which indicates that abundance of monoterpenes in air is favored by well-hydrated soils during the air sampling (Figure 5, Table 2). With regard to the link between the different drivers, variations in Tc were, as expected, largely driven by T15. By contrast, SWP15 was not related to either SWPc or T15. Although both “leaf stage” and T15 had a positive effect on total air monoterpenes, the association between these two variables was negative, indicating that their effects were independent of each other.
Finally, the relationship between Tc and the abundance of monoterpenes is shown in Figure 6, confirming the result obtained from the path analysis: a higher Tc drives a higher abundance of monoterpenes in the air. α-pinene, the most abundant monoterpene detected, followed the same trend (Figure 6). It should be highlighted that both regression lines in Figure 6 excluded those air samples most affected by leaf development (white triangles below the regression lines) or soil water deficit (black squares above the regression lines).

4. Discussion

Six volatile monoterpenes with apparent benefits to human health [24,25] were detected during 2018 in the air below the canopy of a Mediterranean conifer (Pinus pinaster) forest, located in Sierra de Albarracín (Teruel, Spain). The three most abundant monoterpenes found in our study (α-pinene, β-pinene and limonene) coincide with the general abundance trends found in different conifer forests dominated by species from genus Pinus, Abies or Picea [38]. We also detected three additional monoterpenes, with less abundance in the study area (p-cymene, camphene and 1,8-cineole), but we did not detect two others (Δ3-carene and myrcene) often mentioned in the literature [31,39,40,41].
The maximum abundance peak of the monoterpenes in the air during the sampled period was found during the summer, specifically at the end of July, followed by early September, coinciding with the season with the highest resin flow rates found for P. pinaster in the northeast of Spain [42]. This maximum peak also coincides with the results found in previous work performed on another Mediterranean forest dominated by Quercus ilex L. [43]. Furthermore, the monoterpene emission rates measured at branch or canopy level have also proved to be higher during summer in the Mediterranean Pinus pinea [44,45]. This seasonality in the abundance of monoterpenes has been mainly associated with changes in air temperature [43,46,47]. In our study, temperature also seems to be the main driver likely to affect the synthesis and the emission of monoterpenes [30], with higher temperature values resulting in a higher abundance of monoterpenes in the air at nose height. However, we found two other factors—phenology and soil water deficit—that influenced and generated deviations from the main driver.
Concerning phenology, we found that during the months when leaf development occurred, the abundance of monoterpenes in the air was lower than expected, according to the recorded temperature values. This was especially noticed in May, when we detected an abundance of total monoterpenes in air four-fold lower than predicted for a mean temperature of ca. 18 °C (Figure 6). According to previous work [48,49,50], there is a trade-off between growth and defense, which assumes that plants possess a limited pool of resources that can be invested either in growth or in defense. During leaf development, Pinus pinaster seems to allocate most resources to growth, limiting the synthesis of monoterpenes for defense. By contrast, during the rest of the year, when there is hardly any growth, resources might be allocated to the production of defense compounds, such as terpenes [51,52].
Regarding the other factor influencing the general response of monoterpene abundance to changes in temperature, we found that a water deficit period followed by a soil water recovery due to precipitation during October was associated with a slight increase in the abundance of monoterpenes in the air (Figure 5 and Figure 6). In Mediterranean climates, it is common to find a drought period during summer that may affect the functioning of plants [32]. However, in the study site, we registered a drought period during the early autumn of 2018, a displacement likely due to being in a mountain Mediterranean climate [53]. Nevertheless, the literature states that a water deficit period can be associated with increased levels of needle volatile terpenes to increase plant defense [40,54,55], whereas emission may be constrained during water stress due to stomatal closure [56,57]. This suggests that species able to store terpenes, such as P. pinaster, would increase the synthesis and storage of monoterpenes during drought, while simultaneously restricting their emission [31,58] as a defensive mechanism to reduce palatability and as herbivore repellents [59,60]. Once water stress conditions disappear, the stomata can open again, and the leaves can release the volatile terpenes accumulated during the drought period into the air.
The highest peak of monoterpenes in the air found during summer in this study also coincides with the season of highest demand in the Mediterranean tourist sector, which is concerned about the future negative impacts of rising temperatures due to climate change [11,61,62]. Summer days with higher temperatures could bring significantly lower visitor numbers due to uncomfortable temperatures [63,64] and, therefore, may change the behavior of tourists [9,13,65]. However, leisure activities under the forest canopy during Mediterranean summers may not only provide greater benefits to human health due to the abundance of monoterpenes, but also may provide thermal comfort [66,67]. Thus, forest-based leisure activities during summer, such as shinrin-yoku [68,69,70], can be promising adaptive ways to minimize the impacts of climate change on the Mediterranean tourist sector.

5. Conclusions

Temperature was found to be the main environmental factor driving the abundance of monoterpenes in the air of a mountain Mediterranean forest of Pinus pinaster, with the maxima of abundance found during summer (July and August, according to this study). Leaf development in spring decreased the abundance, while during post-drought periods, the abundance may increase (end of October in this study). Therefore, people enjoying forest-based leisure activities would be more exposed to air monoterpenes, and apparently obtain more health benefits, when the temperature increases during the period after leaf development, as long as there is soil water available and the trees are not suffering from water stress at the time of forest exposure. If there is a summer drought period and the trees are water stressed, the abundance of monoterpenes in air will increase when the drought period ends.

Author Contributions

Conceptualization, D.S.-K.; methodology, D.S.-K. and M.Á.S.; validation, E.G.-P. and J.J.P.-P.; formal analysis, D.S.-K., J.P.F. and M.Á.S.; investigation, D.S.-K.; data curation, D.S.-K. and M.Á.S.; writing—original draft preparation, D.S.-K.; writing—review and editing, J.J.P.-P., J.P.F., R.M.-S., J.V.d.S.S., J.I. and M.Á.S.; visualization, D.A.-F. and R.M.-S.; supervision, E.G.-P. and M.Á.S.; project administration, D.S.-K.; funding acquisition, D.S.-K., E.G.-P., J.J.P.-P. and M.Á.S. All authors have read and agreed to the published version of the manuscript.

Funding

This research was funded by Gobierno de Aragón—Fondo de Inversiones de Teruel (FITE) and Gobierno de España, grant project FITE-2017-THERAPYFOREST and by Gobierno de Aragón research group H09_20R. The work of D.A-F. was supported by FPI-INIA, grant number BES-2017-081208; the work of J.V.dos S.S. was supported by MCIN/AEI, grant number PRE2020-094944; and the work of R.M-S. was supported by Gobierno de Aragón.

Acknowledgments

We thank Mercedes Vico for her valuable help during the air forest sampling.

Conflicts of Interest

The authors declare no conflict of interest.

References

  1. Barreiro-Hurle, J.; Gracia, A.; de-Magistris, T. The effects of multiple health and nutrition labels on consumer food choices. J. Agric. Econ. 2010, 61, 426–443. [Google Scholar] [CrossRef]
  2. Leelapattana, W.; Hsu, S.Y.; Thongma, W.; Chen, C.; Chiang, F.M. Understanding the impact of environmental education on tourists’ future visit intentions to leisure farms in mountain regions. Sustainability 2019, 11, 1567. [Google Scholar] [CrossRef] [Green Version]
  3. Ceylan, E.N.; Tülbentçi, T. Example of an ecotourism farm in the context of sustainability: Pastoral valley ecological life farm. Int. J. Adv. Appl. 2020, 7, 116–132. [Google Scholar] [CrossRef]
  4. Wang, S.Y.; Wang, J.; Wang, Y.; Yan, J.; Li, J. Environmental knowledge and consumers’ intentions to visit green hotels: The mediating role of consumption values. J. Travel Tour. Mark. 2018, 35, 1261–1271. [Google Scholar] [CrossRef]
  5. Büntgen, U.; Latorre, J.; Egli, S.; Martinez-Peña, F. Socio-economic, scientific, and political benefits of mycotourism. Ecosphere 2017, 8, e01870. [Google Scholar] [CrossRef]
  6. De Frutos, P.; Rodriguez-Prado, B.; Latorre, J.; Martinez-Peña, F. Environmental valuation and management of wild edible mushroom picking in Spain. For. Policy Econ. 2019, 100, 177–187. [Google Scholar] [CrossRef]
  7. Verbos, R.I.; Altschuler, B.; Brownlee, M.T.J. Weather studies in outdoor recreation and nature-based tourism: A research synthesis and gap analysis. Leis. Sci. 2018, 40, 533–556. [Google Scholar] [CrossRef]
  8. Becken, S. Measuring the effect of weather on tourism: A destination- and activity-based analysis. J. Travel Res. 2012, 52, 156–167. [Google Scholar] [CrossRef]
  9. Lise, W.; Tol, R.S.J. Impact of climate on tourist demand. Clim. Chang. 2002, 55, 429–449. [Google Scholar] [CrossRef]
  10. Matzarakis, A.; Hämmerle, M.; Endler, C.; Muthers, S.; Koch, E. Assessment of tourism and recreation destinations under climate change conditions in Austria. Meteorol. Z. 2012, 21, 157–165. [Google Scholar] [CrossRef] [Green Version]
  11. Brosy, C.; Zaninovic, K.; Matzarakis, A. Quantification of climate tourism potential of Croatia based on measured data and regional modeling. Int. J. Biometeorol. 2013, 58, 1369–1381. [Google Scholar] [CrossRef] [PubMed]
  12. Gómez-Martín, M. Weather, climate, and tourism: A geographical perspective. Ann. Tour. Res. 2005, 32, 571–591. [Google Scholar] [CrossRef]
  13. Bigano, A.; Hamilton, J.M.; Tol, R.S.J. The impact of climate on holiday destination choice. Clim. Chang. 2006, 76, 389–406. [Google Scholar] [CrossRef]
  14. Andrade, H.; Alcoforado, M.J.; Oliveira, S. Perception of temperature and wind by users of public outdoor spaces: Relationships with weather parameters and personal characteristics. Int. J. Biometeorol. 2011, 55, 665–680. [Google Scholar] [CrossRef] [PubMed]
  15. Pantavou, K.; Lykoudis, S. Modeling thermal sensation in a Mediterranean climate—A comparison of linear and ordinal models. Int. J. Biometeorol. 2014, 58, 1355–1368. [Google Scholar] [CrossRef]
  16. Rutty, M.; Scott, D. Bioclimatic comfort and the thermal perceptions and preferences of beach tourists. Int. J. Biometerol. 2014, 59, 37–45. [Google Scholar] [CrossRef]
  17. Rutty, M.; Scott, D. Thermal range of coastal tourism resort microclimates. Tour. Geogr. 2014, 16, 346–363. [Google Scholar] [CrossRef]
  18. Gómez-Martín, M.; Martínez-Ibarra, E. Tourism demand and atmospheric parameters: Nonintrusive observation techniques. Clim. Res. 2012, 51, 135–145. [Google Scholar] [CrossRef] [Green Version]
  19. Lindner-Cendrowska, K. Assessment of bioclimatic conditions in cities for tourism and recreational purposes (a Warsaw case study). Geogr. Pol. 2013, 86, 55–66. [Google Scholar] [CrossRef]
  20. Matzarakis, A.; Hämmerle, M.; Koch, E.; Rudel, E. The climate tourism potential of Alpine destinations using the example of Sonnblick, Rauris and Salzburg. Theor. Appl. Climatol. 2012, 110, 645–658. [Google Scholar] [CrossRef]
  21. Hansen, M.M.; Jones, R.; Tocchini, K. Shinrin-Yoku (Forest Bathing) and Nature Therapy: A State-of-the-Art Review. Int. J. Environ. Res. Public Health 2017, 14, 851. [Google Scholar] [CrossRef] [Green Version]
  22. Tsunetsugu, Y.; Park, B.J.; Miyazaki, Y. Trends in research related to ‘‘Shinrin-yoku’’ (taking in the forest atmosphere or forest bathing) in Japan. Environ. Health Prev. Med. 2010, 15, 27–37. [Google Scholar] [CrossRef] [Green Version]
  23. Wen, Y.; Yan, Q.; Pan, Y.; Gu, X.; Liu, Y. Medical empirical research on forest bathing (Shinrin-yoku): A systematic review. Environ. Health Prev. Med. 2019, 24, 70. [Google Scholar] [CrossRef] [Green Version]
  24. Cho, K.S.; Lim, Y.-R.; Lee, K.; Lee, J.; Lee, J.H.; Lee, I.-S. Terpenes from forests and human health. Toxicol. Res. Vol. 2017, 33, 97–106. [Google Scholar] [CrossRef]
  25. Antonelli, M.; Donelli, D.; Barbieri, G.; Valussi, M.; Maggini, V.; Firenzuoli, F. Forest volatile organic compounds and their effects on human health: A state-of-the-art review. Int. J. Environ. Res. Public Health 2020, 17, 6506. [Google Scholar] [CrossRef]
  26. Gershenzon, J.; Dudareva, N. The function of terpene natural products in the natural world. Nat. Chem. Biol. 2007, 3, 408–414. [Google Scholar] [CrossRef]
  27. Mewalal, R.; Rai, D.K.; Kainer, D.; Chen, F.; Külheim, C.; Peter, G.F.; Tuskan, G.A. Plant-derived terpenes: A feedstock for specialty biofuels. Trends Biotechnol. 2017, 35, 227–240. [Google Scholar] [CrossRef] [Green Version]
  28. Martin, D.M.; Gershenzon, J.; Bohlmann, J. Induction of volatile terpene biosynthesis and diurnal emission by methyl jasmonate in foliage of Norway spruce. Plant Physiol. 2003, 132, 1586–1599. [Google Scholar] [CrossRef] [Green Version]
  29. Bach, A.; Peñuelas, J.; Clarà, J.; Llusià, J.; Campillo, I.; López, F.; Maneja, R. How should forests be characterized in regard to human health? Evidence from existing literature. Int. J. Environ. Res. Public Health 2020, 17, 1027. [Google Scholar] [CrossRef] [Green Version]
  30. Peñuelas, J.; Lluisá, J. The complexity of factors driving volatile organic compound emissions by plants. Biol. Plant. 2001, 44, 481–487. [Google Scholar] [CrossRef]
  31. Kopaczyk, J.M.; Warguła, J.; Jelonek, T. The variability of terpenes in conifers under developmental and environmental stimuli. J. Exp. Bot. 2020, 180, 104197. [Google Scholar] [CrossRef]
  32. Gil-Pelegrín, E.; Saz, M.A.; Cuadrat, J.M.; Peguero-Pina, J.J.; Sancho-Knapik, D. Oaks under mediterranean-type climates: Functional response to summer aridity. In Oaks Physiological Ecology. Exploring the Functional Diversity of Genus Quercus L.; Gil-Pelegrín, E., Saz, M.A., Cuadrat, J.M., Peguero-Pina, J.J., Sancho-Knapik, D., Eds.; Springer International Publishing: Cham, Switzerland, 2017; pp. 137–193. [Google Scholar]
  33. Kännaste, A.; Copolovici, L.; Niinemets, Ü. Gas chromatography-mass spectrometry method for determination of biogenic volatile organic compounds emitted by plants. Methods Mol. Biol. 2014, 1153, 161–169. [Google Scholar] [CrossRef] [PubMed]
  34. Mucciarelli, M.; Camusso, W.; Maffei, M.; Panicco, P.; Bicchi, C. Volatile terpenoids of endophyte-free and infected peppermint (Mentha piperita L.): Chemical partitioning of a symbiosis. Microb. Ecol. 2007, 54, 685–696. [Google Scholar] [CrossRef]
  35. Li, C.C. Path Analysis—A Primer; The Boxwood Press: Pacific Grove, CA, USA, 1975. [Google Scholar]
  36. Kimm, H.; Guan, K.; Gentine, P.; Wu, J.; Bernacchi, C.J.; Sulman, B.N.; Griffis, T.J.; Link, C. Redefining droughts for the U.S. Corn Belt: The dominant role of atmospheric vapor pressure deficit over soil moisture in regulating stomatal behavior of maize and soybean. Agric. Forest Meteorol. 2020, 287, 107930. [Google Scholar] [CrossRef]
  37. Rosseel, Y. Lavaan: An R package for structural equation modeling. J. Stat. Softw. 2012, 48, 1–36. [Google Scholar] [CrossRef] [Green Version]
  38. Pokorska, O.; Dewulf, J.; Amelynck, C.; Schoon, N.; Šimpraga, M.; Steppe, K.; Van Langenhove, H. Isoprene and terpenoid emissions from Abies alba: Identification and emission rates under ambient conditions. Atmos. Environ. 2012, 59, 501–508. [Google Scholar] [CrossRef]
  39. Simon, V.; Clement, B.; Riba, M.L.; Torres, L. The Landes experiment: Monoterpenes emitted from the maritime pine. J. Geophys. Res. Atmos. 1994, 99, 16501–16510. [Google Scholar] [CrossRef]
  40. Blanch, J.S.; Peñuelas, J.; Sardans, J.; Llusià, J. Drought, warming and soil fertilization effects on leaf volatile terpene concentrations in Pinus halepensis and Quercus ilex. Acta Physiol. Plant. 2009, 31, 207–218. [Google Scholar] [CrossRef]
  41. Lee, D.H.; Kim, M.H.; Park, O.H.; Park, K.S.; An, S.S.; Seo, H.J.; Jin, S.H.; Jeong, W.S.; Kang, Y.J.; An, K.W.; et al. A study on the distribution characteristics of terpene at the main trails of Mt. Mudeung. J. Environ. Health Sci. 2013, 39, 211–222. [Google Scholar] [CrossRef] [Green Version]
  42. Zas, R.; Quiroga, R.; Touza, R.; Vázquez-González, C.; Sampedro, L.; Lema, M. Resin tapping potential of atlantic maritime pine forests depends on tree age and timing of tapping. Ind. Crops Prod. 2020, 157, 112940. [Google Scholar] [CrossRef]
  43. Bach, A.; Yáñez-Serrano, A.M.; Llusià, J.; Filella, I.; Maneja, R.; Penuelas, J. Human breathable air in a mediterranean forest: Characterization of monoterpene concentrations under the canopy. Int. J. Environ. Res. Public Health 2020, 17, 4391. [Google Scholar] [CrossRef]
  44. Staudt, M.; Bertin, N.; Hansen, U.; Seufert, G.; Cicciolij, P.; Foster, P.; Frenzel, B.; Fugit, J.L. Seasonal and diurnal patterns of monoterpene emissions from Pinus pinea (L.) under field conditions. Atmos. Environ. 1997, 31, 145–156. [Google Scholar] [CrossRef]
  45. Staudt, M.; Bertin, N.; Frenzel, B.; Seufert, G. Seasonal variation in amount and composition of monoterpenes emitted by young Pinus pinea trees–implications for emission modeling. J. Atmos. Chem. 2000, 35, 77–99. [Google Scholar] [CrossRef]
  46. Loreto, F.; Forster, A.; Durr, M.; Csiky, O.; Seufert, G. On the monoterpene emission under heat stress and on the increased thermotolerance of leaves of Quercus ilex L. fumigated with selected monoterpenes. Plant Cell Environ. 1998, 21, 101–107. [Google Scholar] [CrossRef]
  47. Loreto, F.; Pinelli, P.; Manes, F.; Kollist, H. Impact of ozone on monoterpene emissions and evidence for an isoprene-like antioxidant action of monoterpenes emitted by Quercus ilex leaves. Tree Physiol. 2004, 24, 361–367. [Google Scholar] [CrossRef]
  48. Coley, P.D.; Bryant, J.P.; Chapin, F.S. Resource availability and plant antiherbivore defense. Science 1985, 230, 895–899. [Google Scholar] [CrossRef] [Green Version]
  49. Simms, E.L.; Rausher, M.D. Costs and benefits of plant resistance to herbivory. Am. Nat. 1987, 130, 570–581. [Google Scholar] [CrossRef]
  50. Herms, D.A.; Mattson, W.J. The dilemma of plants: To grow or defend. Q. Rev. Biol. 1992, 67, 283–335. [Google Scholar] [CrossRef] [Green Version]
  51. Lerdau, M.; Matson, P.; Fall, R.; Monson, R. Ecological controls over monoterpene emissions from douglas-fir (Pseudotsuga menziesii). Ecology 1995, 76, 2640–2647. [Google Scholar] [CrossRef]
  52. Burney, O.T.; Davis, A.S.; Jacobs, D.F. Phenology of foliar and volatile terpenoid production for Thuja plicata families under differential nutrient availability. Environ. Exp. Bot. 2012, 77, 44–52. [Google Scholar] [CrossRef]
  53. Breckle, S.W. Walter’s Vegetation of the Earth. The Ecological Systems of the Geo-Biosphere, 4th ed.; Springer: Berlin/Heidelberg, Germany, 2002; p. 527. [Google Scholar]
  54. Turtola, S.; Manninen, A.M.; Rikala, R.; Kainulainen, P. Drought stress alters the concentration of wood terpenoids in Scots pine and Norway spruce seedlings. J. Chem. Ecol. 2003, 29, 1981–1995. [Google Scholar] [CrossRef]
  55. Sancho-Knapik, D.; Sanz, M.Á.; Peguero-Pina, J.J.; Niinemets, Ü.; Gil-Pelegrín, E. Changes of secondary metabolites in Pinus sylvestris L. Needles under increasing soil water deficit. Ann. For. Sci. 2017, 74, 24. [Google Scholar] [CrossRef]
  56. Llusià, J.; Peñuelas, J. Changes in terpene content and emission in potted Mediterranean woody plants under severe drought. Can. J. Bot. 1998, 76, 1366–1373. [Google Scholar] [CrossRef]
  57. Niinemets, Ü.; Reichstein, M.; Staudt, M.; Seufert, G.; Tenhunen, J.D. Stomatal constraints may affect emission of oxygenated monoterpenoids from the foliage of Pinus pinea. Plant Physiol. 2002, 130, 1371–1385. [Google Scholar] [CrossRef] [PubMed] [Green Version]
  58. Copolovici, L.; Niinemets, U. Environmental impacts on plant volatile emission. In Deciphering Chemical Language of Plant Communication; Blande, J.D., Glinwood, R., Eds.; Springer International Publishing: Cham, Switzerland, 2016; pp. 175–210. [Google Scholar]
  59. Hodges, J.D.; Lorio, P.L. Moisture stress and composition of xylem oleoresin in loblolly pine. For. Sci. 1975, 21, 283–290. [Google Scholar] [CrossRef]
  60. Wainhouse, D. Hylobius abietis—Host utilisation and resistance. In Bark and Wood Boring Insects in Living Trees in Europe, a Synthesis; Lieutier, F., Day, K.R., Battisti, A., Gregoire, J.C., Evans, H.F., Eds.; Springer: Dordrecht, The Netherlands, 2004; pp. 365–379. [Google Scholar]
  61. Amelung, B.; Viner, D. Mediterranean tourism: Exploring the future with the Tourism Climatic Index. J. Sustain. Tour. 2006, 14, 349–366. [Google Scholar] [CrossRef]
  62. Bafaluy, D.; Amengual, A.; Romero, R.; Homar, V. Present and future climate resources for various types of tourism in the Bay of Palma, Spain. Reg. Environ. Chang. 2014, 14, 1995–2006. [Google Scholar] [CrossRef]
  63. Paudyal, R.; Stein, T.V.; Kc, B.; Adams, D.C. Effects of weather factors on recreation participation in a humid subtropical region. Int. J. Biometeorol. 2019, 63, 1025–1038. [Google Scholar] [CrossRef]
  64. Wilkins, E.J.; Chikamoto, Y.; Miller, A.B.; Smith, J.W. Climate change and the demand for recreational ecosystem services on public lands in the continental United States. Glob. Environ. Chang. 2021, 70, 102365. [Google Scholar] [CrossRef]
  65. Buckley, L.B.; Foushee, M.S. Footprints of climate change in US national park visitation. Int. J. Biometeorol. 2012, 56, 1173–1177. [Google Scholar] [CrossRef]
  66. Schiller, G. Biometeorology and recreation in east Mediterranean forests. Landsc. Urban Plan. 2001, 57, 1–12. [Google Scholar] [CrossRef]
  67. Takayama, N.; Kagawa, T.; Kasetani, T.; Park, B.; Tsunetsugu, Y.; Oishi, Y.; Hirano, H.; Miyazaki, Y. The comfortableness of the light/thermal environment for bathing in the forest atmosphere. J. Jpn. Inst. Landsc. Arch. 2005, 68, 819–824. [Google Scholar] [CrossRef] [Green Version]
  68. Richardson, M.; McEwan, K.; Maratos, F.; Sheffield, D. Joy and calm: How an evolutionary functional model of affect regulation informs positive emotions in nature. Evol. Psychol. Sci. 2016, 2, 308–320. [Google Scholar] [CrossRef] [Green Version]
  69. Farrow, M.R.; Washburn, K. A review of field experiments on the effect of forest bathing on anxiety and heart rate variability. Glob. Adv. Health Med. 2019, 8, 1–7. [Google Scholar] [CrossRef]
  70. Kotera, Y.; Richardson, M.; Sheffield, D. Effects of Shinrin-yoku (forest bathing) and nature therapy on mental health: A systematic review and meta-analysis. Int. J. Ment. Health Addict. 2022, 20, 337–361. [Google Scholar] [CrossRef]
Figure 1. (a) Location of the experimental site in Teruel, Spain (red star). Green areas are the natural distribution of the Mediterranean conifer Pinus pinaster. (b) Aerial photo of the experimental site. The yellow dashed line indicates the sampling path, while the red triangle indicates the tourist information center. (c,d) provide detail of the sampling path and the landscape, respectively.
Forests 13 00965 g001
Figure 2. Evolution of environmental factors in the study area during 2018. T, temperature; RH, relative humidity; SWP, soil water potential; P, precipitation; DOY, day of the year. T, RH and SWP are the mean values recorded between 11:00 a.m. and 14:00 p.m. (local time). P was obtained from the closest meteorological station. Months colored in green represent the period of leaf development. “Leaf stage” is given by the italic numbers above each month. Grey circles are the volatile air-sampling days.
Forests 13 00965 g002
Figure 3. Evolution of the abundance of monoterpenes measured in the air at nose height in the study area during 2018. Figure shows total monoterpenes and the three most abundant monoterpenes measured: α-pinene, β-pinene and limonene. DOY, day of the year. Values are mean ± se (n = 6).
Forests 13 00965 g003
Figure 4. Relative percentage of abundance of each monoterpene measured in the air at nose height in the study area during 2018. DOY, day of the year.
Forests 13 00965 g004
Figure 5. Path analysis relating the abundance of total monoterpenes in air, leaf stage and environmental factors. T15, mean maximum daily temperature of the 15 days prior to the air-sampling day; SWP15, minimum soil water potential of the 15 days prior to the air-sampling day; Tc, mean temperature of the current air-sampling time; SWPc, mean soil water potential of the current air-sampling time. Blue are positive correlations and red are negative ones. Line thickness is proportional to the standardized coefficients (also shown in numerical labels). Bi-directional dashed lines indicate associations between exogenous variables. Unidirectional solid lines indicate the ‘causal’ associations included in the structural model.
Forests 13 00965 g005
Figure 6. Relationships between the mean temperature of the current air-sampling time (Tc) and the abundance of total monoterpenes and α-pinene. We have excluded from the regression line those air samples affected by leaf development (white triangle) or soil water deficit (black squares). For each linear relationship, the P-value is <0.001 and the correlation coefficient (R) is shown in the graph.
Forests 13 00965 g006
Table 1. Values of environmental variables for each air-sampling day. DOY, day of year; T15 and SWP15 are the mean maximum daily temperature and minimum soil water potential of the previous 15 days to the air-sampling day, respectively; Tc and SWPc are the mean temperature and soil water potential of the current air-sampling time, respectively.
DOYMonthT15 (°C)
Mean ± se (min; max)
SWP15 (Mpa)Tc (°C) Mean ± se 1SWPc (Mpa) 2
11:00 a.m. h12:00 a.m. h13:00 p.m. h
79March9.8 ± 0.7 (5.3; 14.4)−0.0131.8 ± 0.30.6 ± 0.11.1 ± 0.1−0.013
107April12.2 ± 1.2 (2.8; 19.3)−0.01318 ± 0.718.8 ± 0.419.6 ± 0.3−0.013
142May18.8 ± 0.7 (13.8; 23.7)−0.03120.3 ± 0.518.5 ± 0.214.9 ± 0.2−0.012
170June20.4 ± 1.0 (13.2; 27.0)−0.01226.2 ± 0.527.3 ± 0.327 ± 0.3−0.012
205July28.7 ± 0.7 (20.1; 31.3)−0.06327.8 ± 0.328.9 ± 0.331.2 ± 0.5−0.012
247September28.6 ± 0.6 (24.9; 32.7)−0.03423.2 ± 0.326.8 ± 0.228.9 ± 0.8−0.015
275October24.6 ± 0.7 (19.4; 29.6)−0.28818.3 ± 0.321.5 ± 0.822.9 ± 0.2−0.198
296October16.6 ± 0.8 (11.3; 22.6)−1.49512.1 ± 0.315.3 ± 0.615.3 ± 0.4−0.011
331November9.9 ± 0.7 (6.7; 15.1)−0.01110.1 ± 1.011 ± 0.611.5 ± 0.4−0.011
1 Tc at 11:00 a.m., 12:00 a.m. and 13:00 p.m. are the mean values of the three sampled periods during a day: from 11:00 a.m. to 11:50 a.m., 12:00 a.m. to 12:50 a.m. and from 13:00 p.m. to 13:50 p.m., respectively. 2 For SWPc, we considered a single value as it remained constant between 11:00 a.m. and 13:50 p.m.
Table 2. Main statistics of the structural equation model tested in the path analysis (Figure 5). R2, coefficient of determination for each estimate in the model; UC, unstandardized coefficients and their SE, standard errors; SC, standardized coefficients; P, statistical significance. Meaning of environmental variables are in caption of Figure 5.
R2UCSESCP
Monoterpenes~Tc + SWPc + Leaf stage + SWP15 + T150.795 <0.001
Tc 0.7270.2210.5090.001
SWPc 67.50718.0910.325<0.001
Leaf stage 1.550.3820.453<0.001
SWP15 −7.1942.303−0.2730.002
T15 0.9040.2950.5210.002
Tc~T150.683 <0.001
T15 1.0040.1320.826<0.001
SWPc~SWP150.002 0.812
SWP15 0.0060.0240.0460.812
Publisher’s Note: MDPI stays neutral with regard to jurisdictional claims in published maps and institutional affiliations.

