1. Introduction
Shrublands are one of the most widely distributed biomes globally [
1], and make a significant contribution to terrestrial carbon (C) storage [
2]. In addition, shrublands are often a key step in post-cultural indigenous forest succession [
3,
4,
5,
6,
7]. Accurate documentation of C gain during succession from shrubland to forest is vital for including abandoned agricultural land in afforestation-based emissions trading schemes. Further, accurate models of C gain during succession are needed for assessing potential C sequestration under different scenarios of land-use change [
8,
9], and these can, then, be used by landowners to assess economic viability of carbon farming as an alternative to traditional grazing [
8].
Individual-level allometric approaches for shrublands are required for building mechanistic models of C sequestration (e.g., [
10]) during succession from shrubland to forest, as these models require information on the establishment, growth, and mortality of individual plants. Use of an individual-level allometric approach in shrublands would allow these demographic processes to be documented from the very beginning of post-agricultural woody succession. This, in turn, would permit a unified modelling approach to be applied to all stages of succession, rather than a decoupled framework where shrublands and forests are modelled separately.
There are numerous studies presenting individual-level allometric equations for estimating the biomass of shrubs and trees in regenerating shrublands (e.g., [
11,
12,
13,
14]). However, very little work has examined the degree of uncertainty in using such allometric equations to estimate shrubland C storage (see [
15]). Further, there appears to be no work assessing the power of individual-based allometries to detect C gains during shrubland succession. These are important questions, as the usefulness of any individual-based model for predicting C gain during succession depends on the accuracy with which the allometries it uses estimate C storage. In view of this, our study aims to estimate the degree of uncertainty around shrubland C estimates, using a novel individual-level allometric approach, and tests whether observed changes in C storage between repeated plot surveys are beyond the margin of error produced by this uncertainty.
1.1. Potential Sources of Uncertainty
Many studies have quantified the amount and sources of uncertainty involved in using individual-level allometric approaches to estimate forest C storage (e.g., [
16,
17,
18,
19,
20]). There seems to be a growing consensus that allometries using tree dimensions (e.g., height, trunk diameter, and canopy architecture) to predict tree biomass are the largest source of uncertainty in forest C storage estimates (e.g., [
18]). Consequently, we might expect allometry to be a major source of error for shrubland C estimates. While many studies have focused on the choice of allometric function, it seems less attention has been paid to uncertainty of predictions within models.
Within-model uncertainty depends not only on the ability of individual tree or shrub dimensions to predict biomass for harvested individuals, but also on how well the harvested individuals sample the population of interest. Often, many small and very few large individuals are harvested, due to logistical constraints (e.g., [
21]). Such a sampling design will obviously inflate the uncertainty of biomass estimates for large individuals. This may have serious consequences for plot-level C storage estimates in forests, since the largest individuals within a plot usually contribute the vast majority of aboveground carbon [
22]. There is some evidence this may also be true for shrublands [
15], but for now there is too little evidence to be sure.
Further, it is often assumed, without justification, that measurement error for the dimensions of harvested individuals is negligible. We are unaware of any work estimating how measurement errors for the dimensions of harvested individuals might influence the uncertainty of plot-level C estimates. This could potentially be a large effect since any source of uncertainty in fitting allometric models affects biomass estimates for all individuals sampled in plots. The final obvious source of uncertainty is errors in the measurement of individual dimensions (usually trunk diameter and height) on plots. Available evidence suggests this should not be a major source of uncertainty at the plot level, since measurement errors should balance out, as long as there is no bias in the error distribution (e.g., [
18]).
1.2. Aims and Objectives
We aim to assess uncertainty in C storage estimates from three error sources: (1) uncertainty in the shrub biomass predictions provided by the allometric equations, (2) uncertainty in the allometric equations due to errors in the measurement of harvested shrub dimensions, and (3) errors in the measurement of the dimensions of shrubs in survey plots (these error sources are defined in more detail in
section 2). We also assess uncertainty for all possible combinations of these error sources. Finally, we test whether observed C gains between repeated measurements of survey plots exceed variation expected, or are within the margin of error due to these sources of uncertainty.
2. Experimental Section
2.1. Study Sites
Our study was conducted at two sites: Oxford in the eastern South Island of New Zealand (43°10'34" S 172°06'48" E), and d’Urville Island, off the northern coast of the South Island (40°49'21" S 173°50'22" E). Shrublands eligible for carbon credits cover 461 ha at the Oxford site and 179 ha at the d’Urville site. The major shrubland species at the Oxford site were the invasive shrubs
Ulex europaeus and
Cytisus scoparius (both Fabaceae), the native shrubs
Leptospermum scoparium (Myrtaceae)
, Ozothamnus leptophyllus (Asteraceae)
, Coprosma tayloriae (Rubiaceae), and
Corokia cotoneaster (Cornaceae). The most abundant shrubland species at the d’Urville site were the early-successional tree
Kunzea ericoides (Myrtaceae) and the native shrub species
L. scoparium, and
O. leptophyllus. Of the species in both study sites, very rapid C sequestration has been demonstrated for
K. ericoides [
4], so we might expect sequestration rates to be higher, on average, for the D’Urville plots than the Oxford plots. However, recruitment of tree species was noted at the Oxford site and it is possible that these recruits could enhance C sequestration, as this has been observed in shrublands elsewhere in New Zealand [
7].
2.2. Field Sampling
A total of 27 plots (17 plots at Oxford and 10 plots at d’Urville) were located randomly within shrubland areas and surveyed in 2008. A stratified random sampling design was employed where plots were randomly located within vegetation types and the sampling intensity was proportional to the area covered by each of the major vegetation types. Of this full set of plots, a representative subset of 18 plots (8 plots at Oxford and 10 plots at d’Urville) were re-measured in 2012. Within each 20 × 20 m plot, a 5 × 5 m sub-plot was selected for shrub basal diameter and height measurements. Each shrub was allocated a unique shrub number. If a shrub forked below 10 cm, each stem (with diameter > 0.5 cm and height > 30 cm) was assigned a unique tag ID. Basal diameter (and stem status: live or dead) of all tagged stems and height of the tallest stem were re-measured. For shrubs with basal or breast height diameter < 2.5 cm, callipers were used to measure two orthogonal diameters to record the maximum width and the diameter at right angles to this. For diameters > 2.5 cm a tape was used for measurement of both biomass and shrub dimensions. To compare with diameter measured with a tape, orthogonal diameters (d1 and d2) were converted to an average (dav) from the formula dav = sqrt(d1 × d2). For calculation purposes, the basal areas of stems from the same shrub were summed for each shrub, and the measured height assigned to the shrub. Shrubs that were dead at time of first measurement and shrubs that had died over the period between 2008 and 2012 were considered to be “litter”, because diameters were less than 10 cm, and, hence, not big enough to be “coarse woody debris” according to standard New Zealand forest mensuration protocols [
23,
24]. This litter was not included in C estimates, as we were interested in uncertainty in C storage estimates associated with our allometric approach. Stems that were recruited between measurements were tagged and measured, and are included in estimates of 2012 C storage.
2.3. Biomass Sampling
Shrubs and small trees outside the plot boundary were harvested in order to construct allometric relationships. Harvests were conducted for both survey dates. Selected individuals were representative of the plot as a whole in terms of species composition, weighted by contribution to biomass. Therefore, average- to large-sized shrubs were selected. A total of four shrubs were harvested per plot and weighed. Overall, 162 shrubs were harvested. Large shrubs that had woody stems and branches were subdivided into foliage and stem before weighing as separate categories. Sub-samples of shrubs were transported to the laboratory in order to derive fresh weight:dry weight comparisons. Biomass samples were oven-dried at 65 °C to a constant mass (i.e., until further drying made no difference in weight).
2.4. Using Allometric Equations to Calculate Carbon
Plot inventory data in 2008 and 2012 were converted to oven-dry weight per hectare using an allometric equation developed from biomass data collected in both years (2008 and 2012), across both sites and across all species present in the plots. To estimate C stocks per plant, allometric models of the following general form were derived from the biomass data:
where BA is total shrub basal area (m
2), Height is maximum shrub height (m), and
a and
b are fitted coefficients. Dry weight was converted to carbon storage using a multiplication factor of 0.5, which is standard in New Zealand [
25]. This function form is analogous to applying a logarithmic link function in a generalized linear modelling (GLM) framework. Using a logarithmic link function has the advantage over ordinary linear least squares regression (OLS) in that it reduces bias in fitted dry weight. In particular, using this type of function prevents negative fitted values for small shrubs, since the result of the exponential transformation is always non-negative. Previous generalized linear modelling (GLM) analyses on the same harvested shrub dataset demonstrated that there was no AIC support for including site- or species-specific coefficients in the allometric equation [
26].
Our approach differed from GLM in that the coefficients (a and b) were fitted using an iterative function-minimization procedure, which sought the combination of parameter values minimizing the residual sum of squares (i.e., minimizing the sum of squared deviances). The advantage of this approach is that it does not require any assumption about the shape of the distribution for the response or the distribution of errors. This was particularly useful for our study since we used bootstrapping to simulate the effect of allometric uncertainty on C storage estimate error (see next paragraph), and response and error distribution types may not have been consistent across all simulations.
To apply the allometric function to plot measurement data, summed basal areas were obtained for each shrub and multiplied by maximum plant height. For a small number of shrubs (<0.2% of all shrubs surveyed) height was not measured and these missing heights were estimated from species-specific height/diameter functions. The allometric function was then applied to each plant to estimate its dry weight, and these were summed to provide per-hectare values for each plot. For re-measured plots, stock changes were obtained by subtracting the 2008 stock estimate from the 2012 stock.
2.5. Simulating Allometric Uncertainty
We used bootstrapping to assess the uncertainty in the coefficient estimates for the allometric equations and for the fitted shrub-dry-weight estimates. To perform bootstrapping we randomly selected 70% of the harvested shrub dataset (without replacement) on which the allometric equations were fitted. We then used the remaining 30% of the dataset to assess goodness of fit of the allometric equations. This process was repeated for 10
4 permutations to generate a bootstrapped mean and 95% confidence interval (CI) for regression coefficients and predicted-dry-weight values. We stored the coefficient values for each permutation to estimate the effect of allometric uncertainty on C storage estimate error (see
section “Simulating Uncertainty in C Storage Estimates” below).
2.6. Simulating Measurement Errors
We based our simulations of measurement errors on the data quality limits (DQLs) stipulated for estimation of shrubland C storage in New Zealand. These limits require 95% of basal diameters to be with 1 cm of the “true” measurement and shrub-canopy-height measurements to be within 10 cm of the “true” measurement. We used these DQLs to define Gaussian measurement error distributions for basal diameter and height measurements, with a 95% probability of measurement error occurring within ±2 DQL units. To simulate measurement errors for harvested shrubs and shrubs occurring in survey plots we randomly selected error values from these distributions for each measurement.
2.7. Simulating Uncertainty in C Storage Estimates
Harvest shrub measurement errors and bootstrapping introduced uncertainty into C storage estimates by causing variation in values for the linear coefficient and intercept in the allometric equation. Measurement errors for shrubs in plots introduced uncertainty by causing variation in C estimates for individual shrubs.
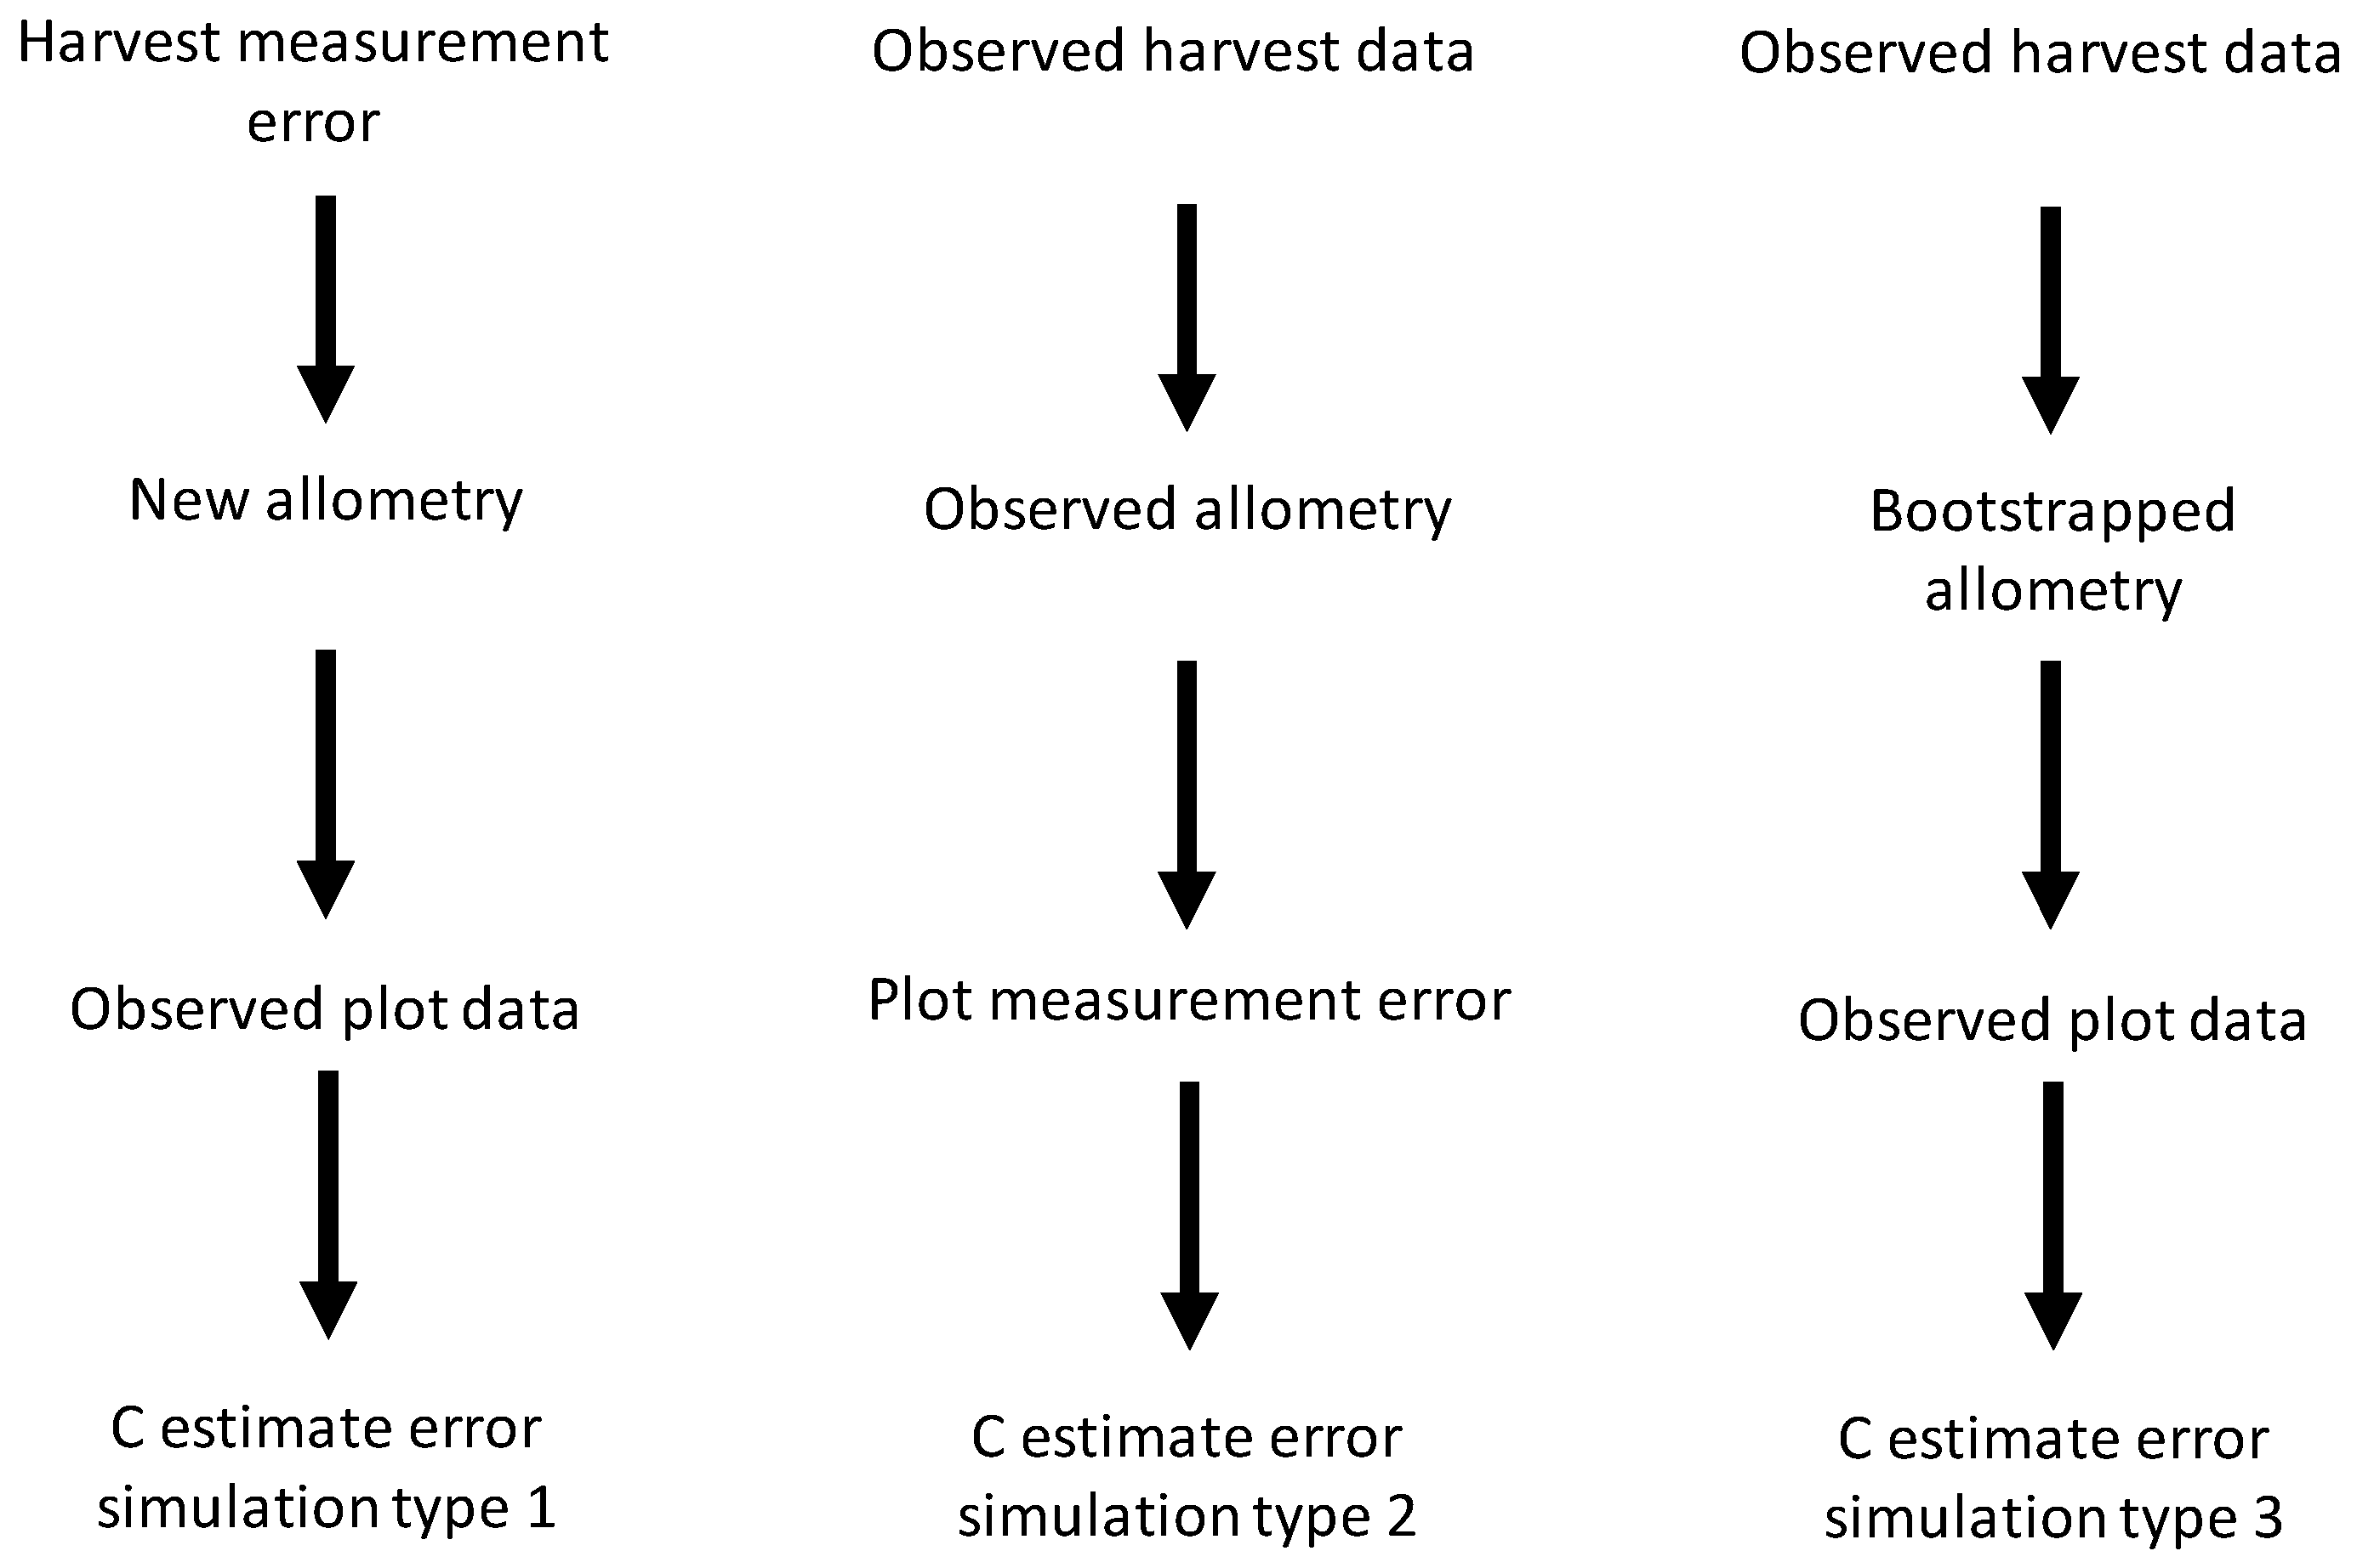
We simulated C measurement uncertainty for all possible combinations of the uncertainty sources we studied. This gave seven types of simulation in total: (1) harvest shrub measurement error, (2) plot shrub measurement error, (3) bootstrapped allometric uncertainty, (4) harvest and plot shrub measurement error, (5) harvest measurement error and bootstrapped allometric uncertainty, (6) plot measurement and allometric uncertainty, and (7) harvest and plot measurement error and allometric uncertainty. For simulations incorporating only a single source of uncertainty (simulation types 1–3), all data, except those involved in the source of uncertainty being simulated, were identical to the original dataset (see
Figure 1 for schematic representation of simulation process).
Figure 1.
Schematic diagram for simulation of independent effects of the three sources of uncertainty studied—harvest and plot measurement error and bootstrapped allometry uncertainty—on carbon (C) storage estimate errors.
Figure 1.
Schematic diagram for simulation of independent effects of the three sources of uncertainty studied—harvest and plot measurement error and bootstrapped allometry uncertainty—on carbon (C) storage estimate errors.
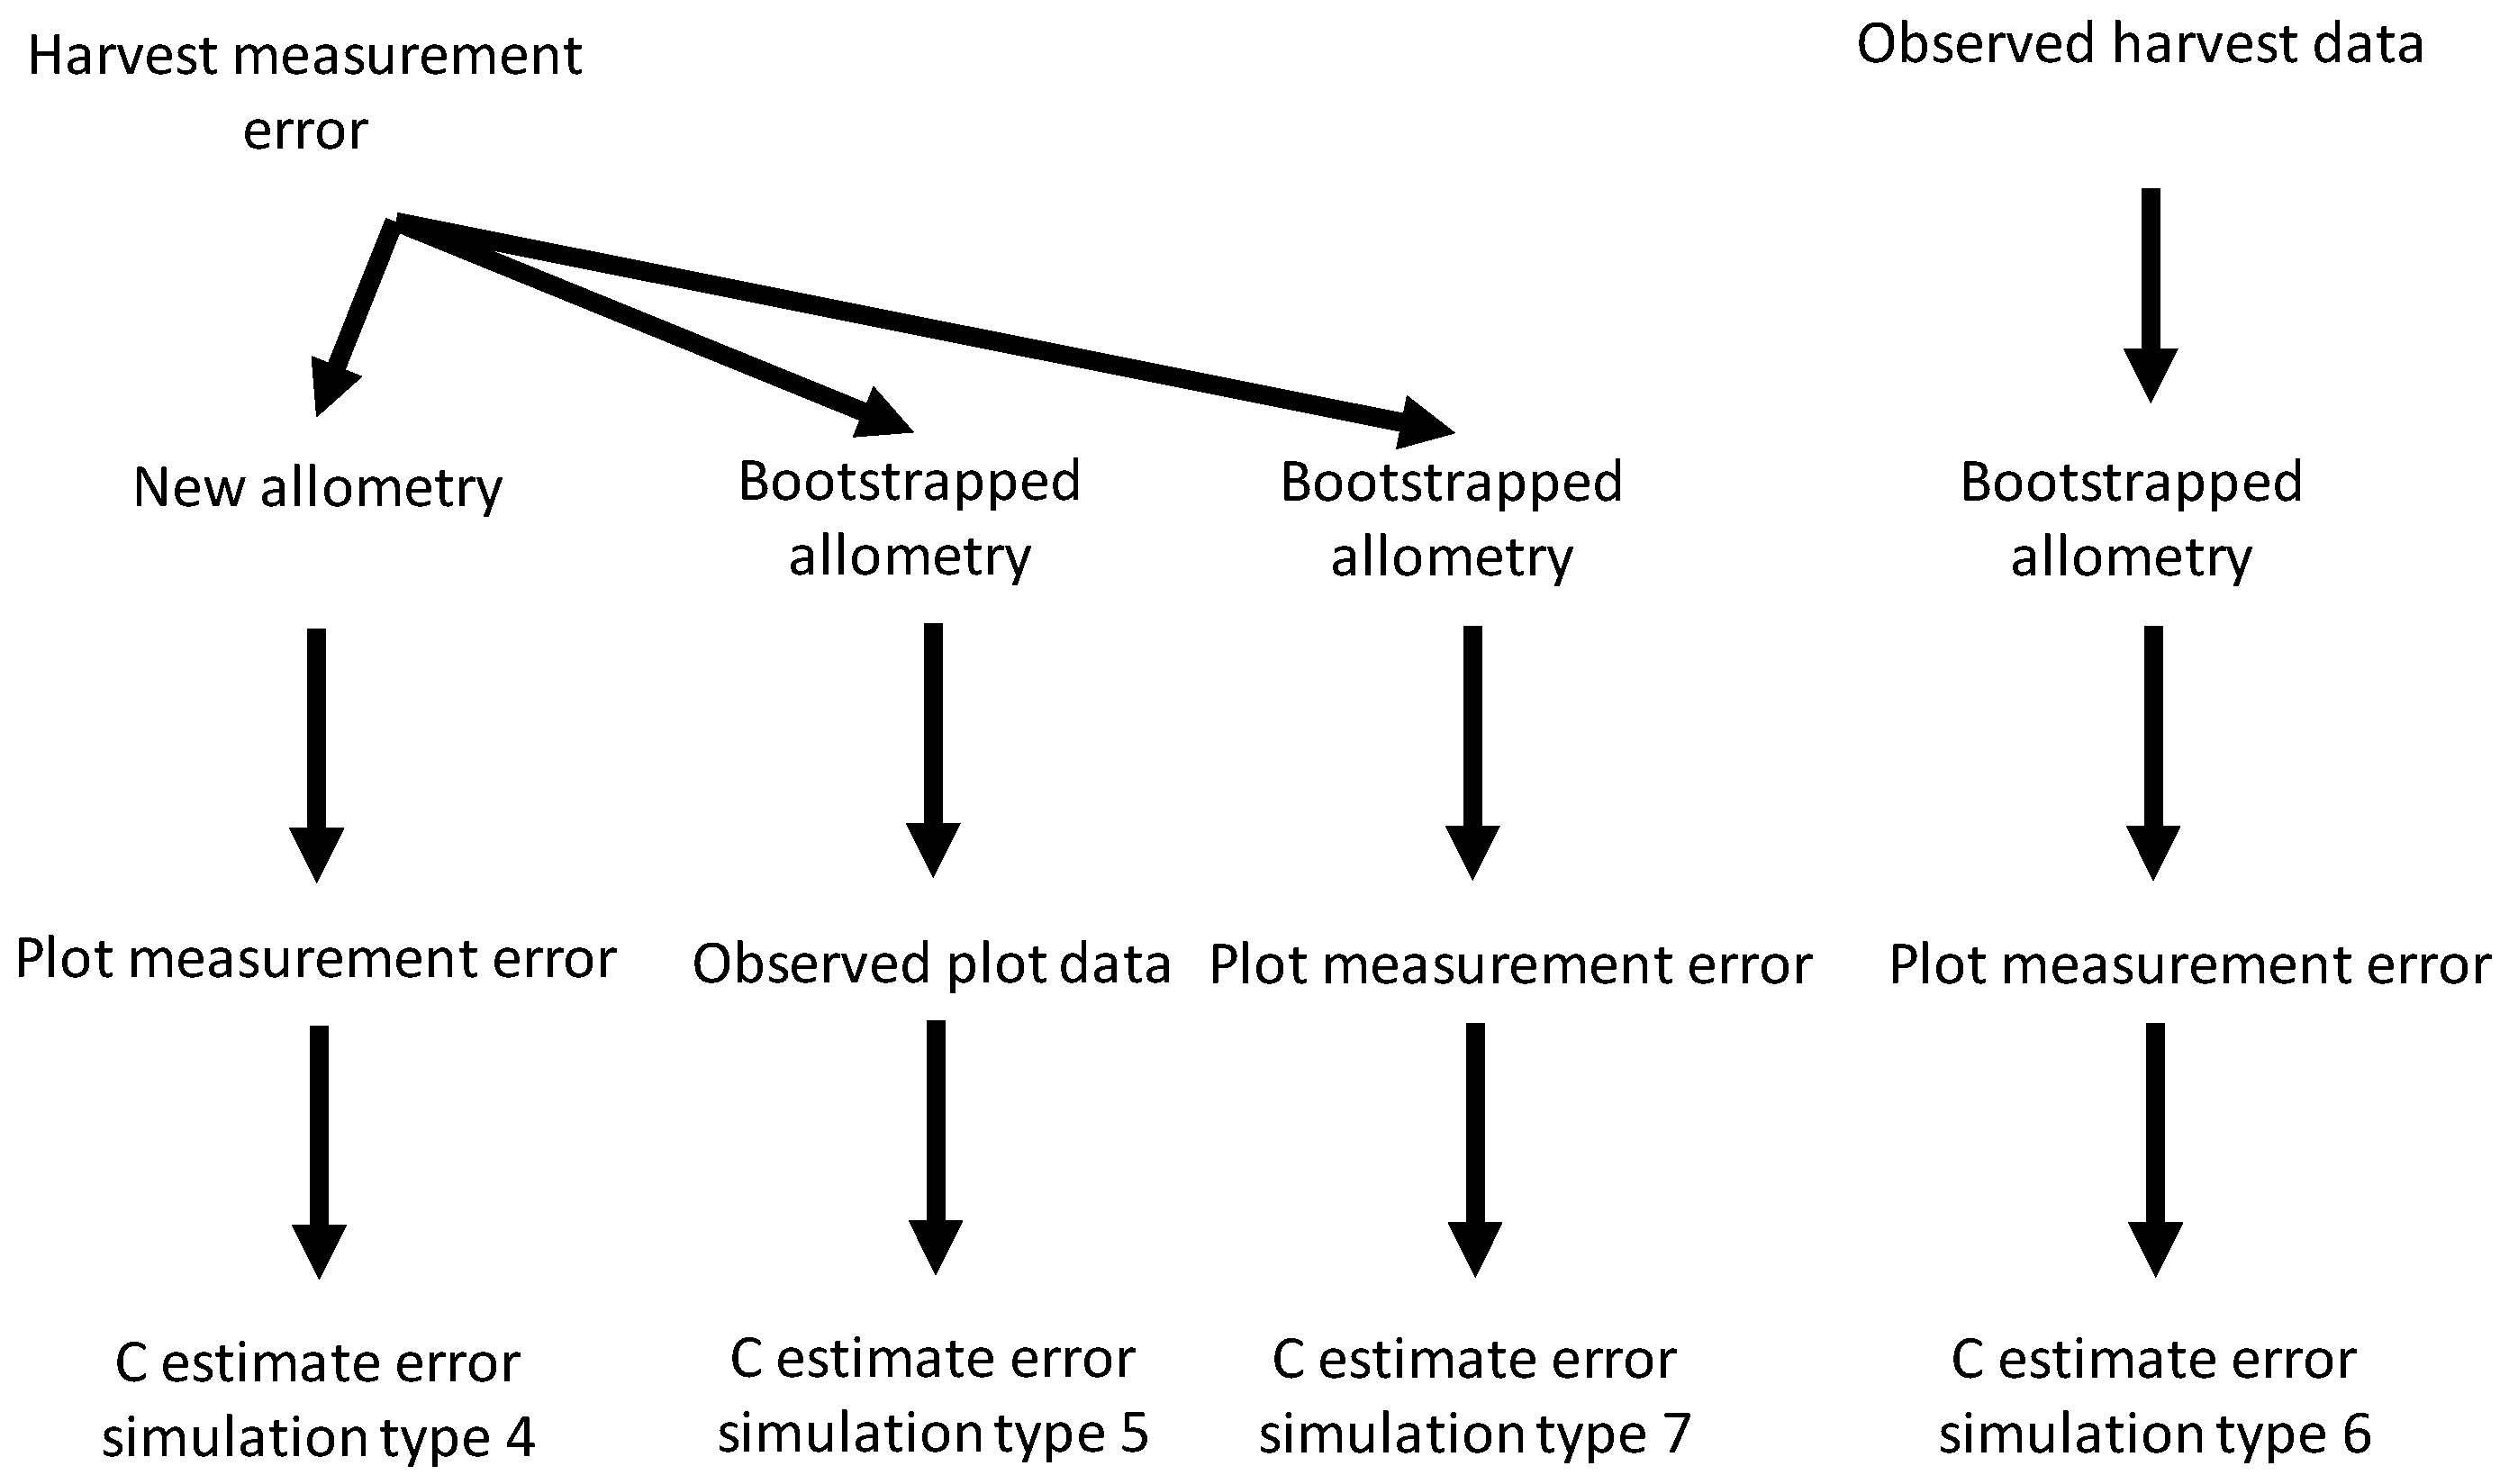
Figure 2 provides a schematic representation of how different sources of uncertainty were combined. When combining harvest shrub measurement errors with plot measurement errors (simulation type 4), we first ran 1000 harvest error simulations. For each simulation, the new harvest measurement values were used to generate values for the allometric linear coefficient and intercept. The simulated coefficient values were then used to estimate C on 1000 plot measurement error simulations (giving 10
6 simulations in total). When combining harvest measurement error and bootstrapped allometric uncertainty (simulation type 5) for each harvest error simulation we generated 1000 bootstrapped values for the linear coefficient and intercept, and then combined these coefficient values with the observed measurements for shrubs in plots to estimate C storage (again giving 10
6 simulations in total). When combining bootstrapped allometric uncertainty and plot measurement errors (simulation type 6) for each bootstrapped estimate of allometric coefficients we ran 1000 plot measurement error simulations. When combining all three sources of uncertainty (simulation type 7), we used 1000 harvest measurement error simulations. For each harvest error simulation, we generated 1000 bootstrapped values for the allometric coefficients and then ran 1000 plot measurement error simulations (giving 10
9 simulations in total).
Figure 2.
Schematic diagram for simulation of interactive effects between the three sources of uncertainty studied—harvest and plot measurement error and bootstrapped allometry uncertainty—on carbon (C) storage estimate errors.
Figure 2.
Schematic diagram for simulation of interactive effects between the three sources of uncertainty studied—harvest and plot measurement error and bootstrapped allometry uncertainty—on carbon (C) storage estimate errors.
For each simulation, we recorded the estimated C storage of individual plots, as well as the mean C storage across plots. For each type of simulation we used these results to estimate the mean and 95% CI bounds (i.e., values for 2.5th and 97.5th quantiles) of simulation values for individual plot C storage and for mean C storage across plots. This provided an estimate of C estimate errors arising from all possible combinations of uncertainty sources.
3. Results
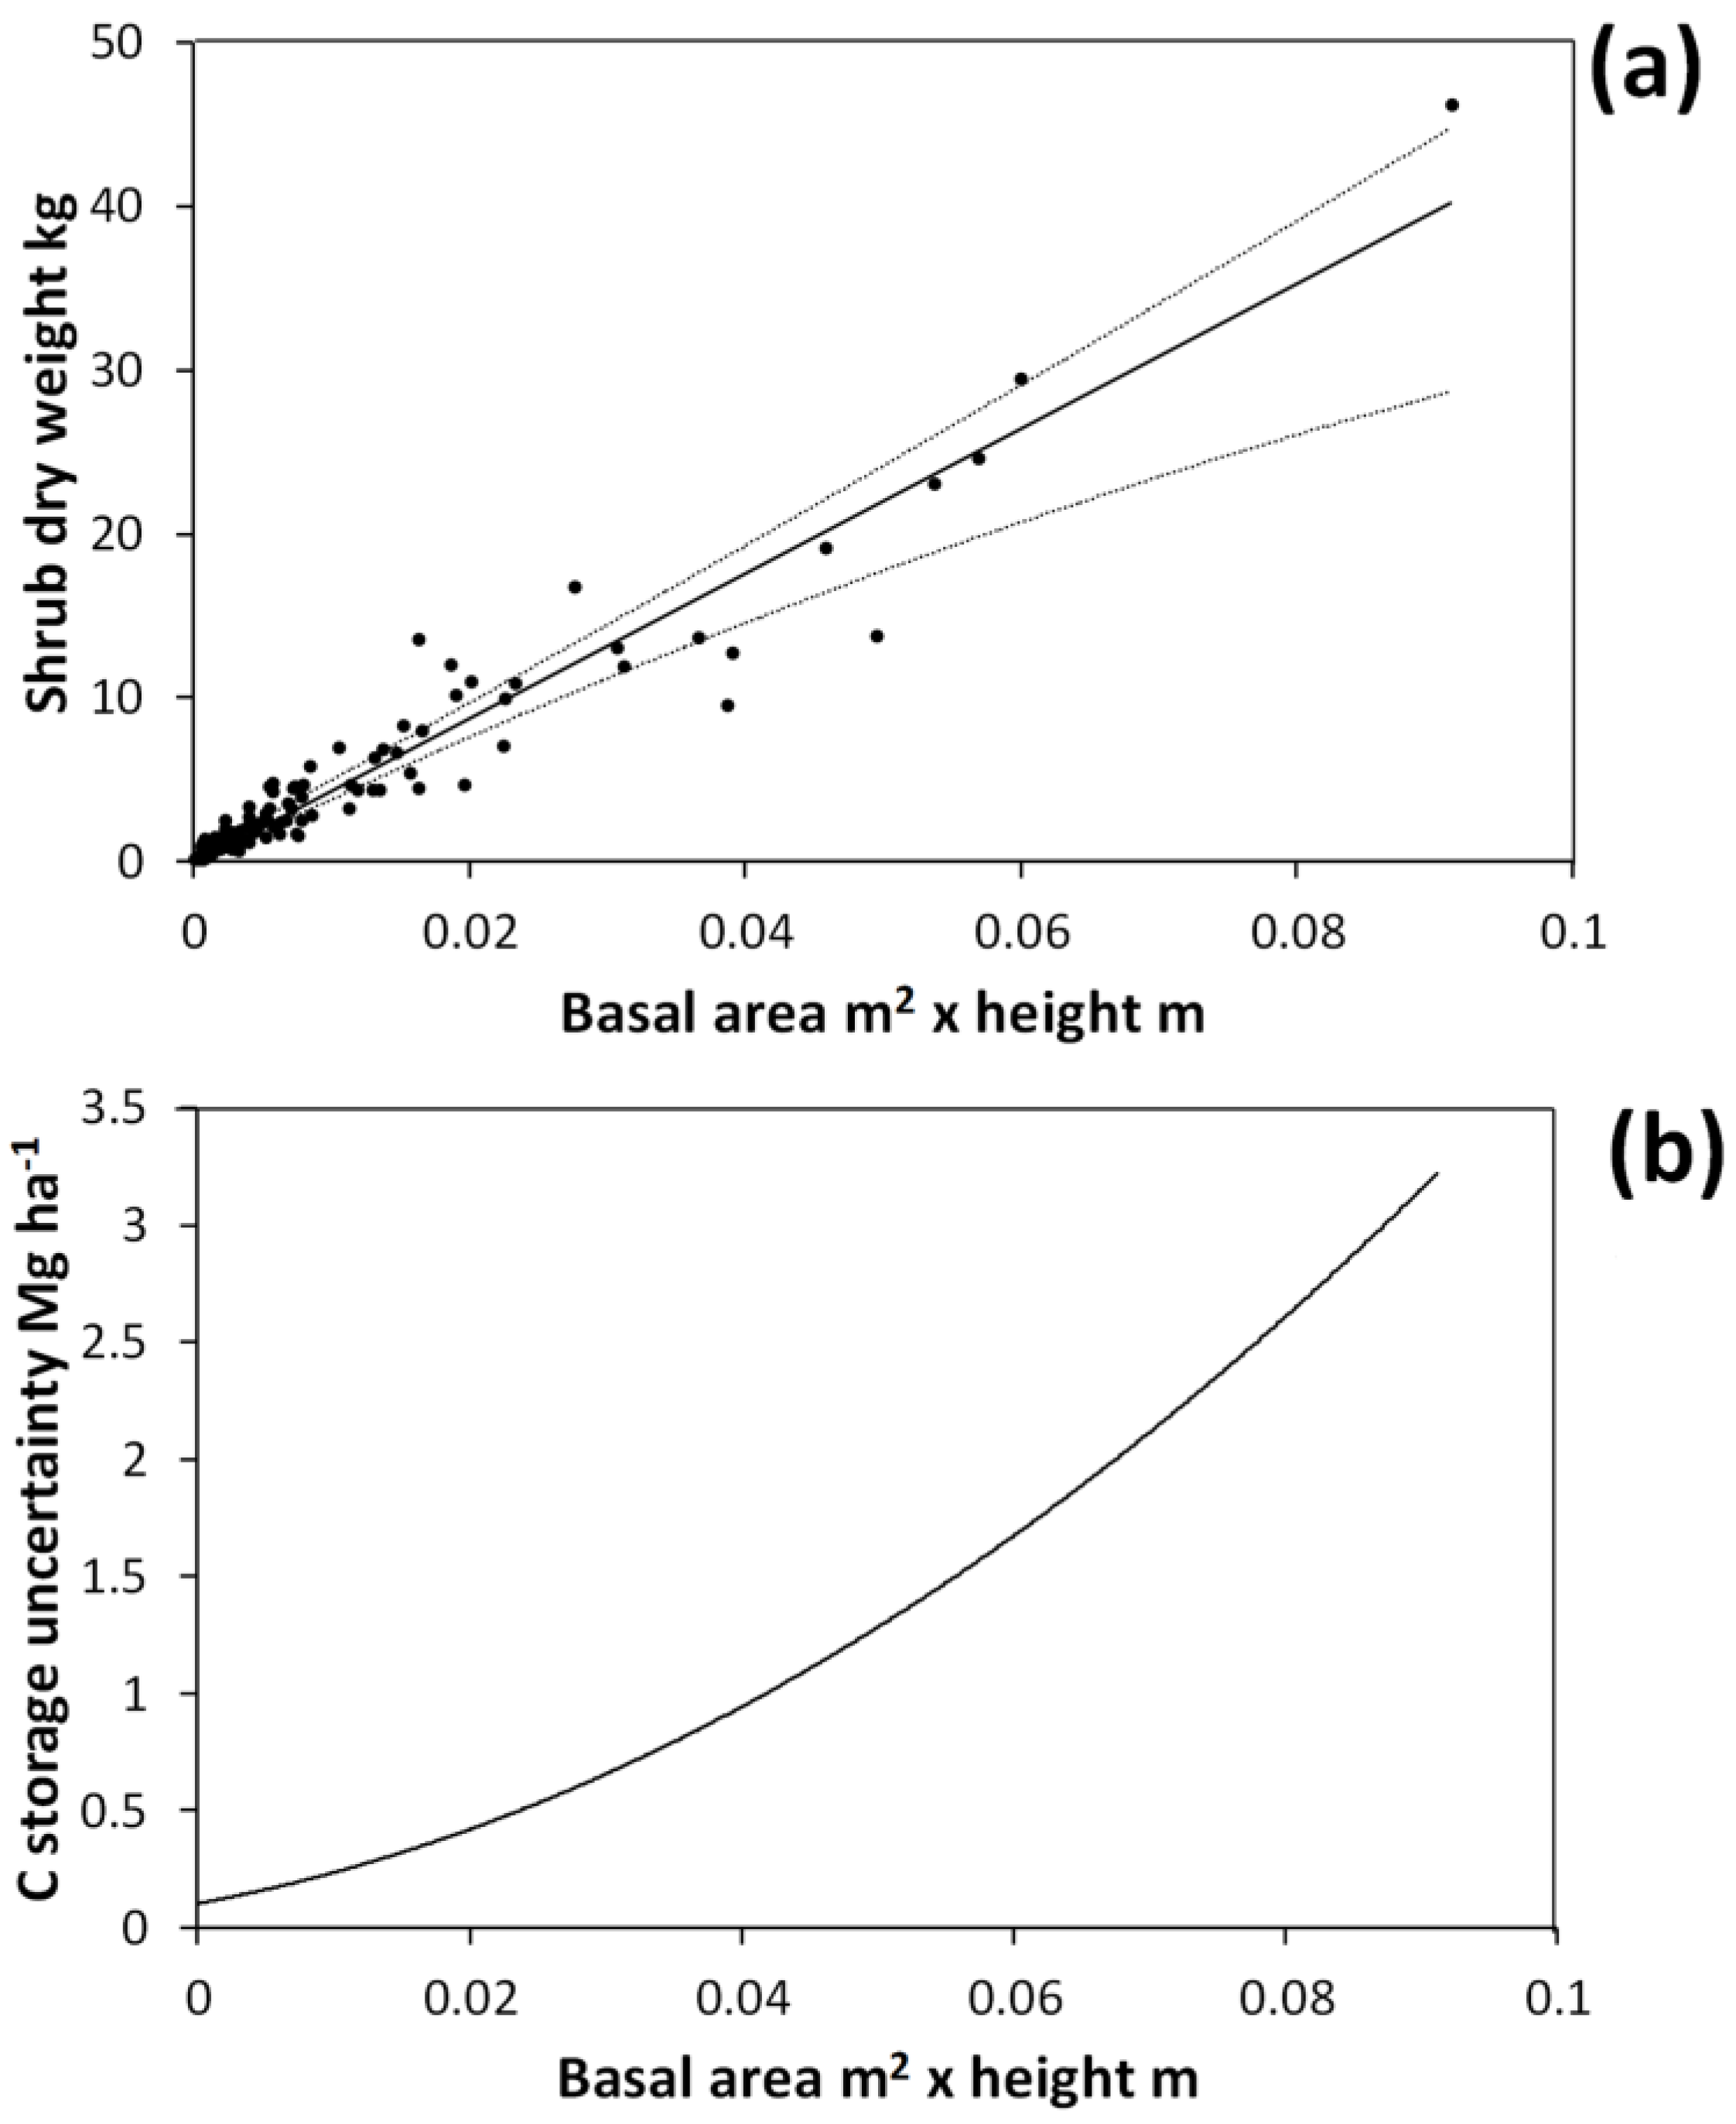
The basal area × height allometric equation accurately (
R-square = 0.93) predicted shrub dry weight (
Figure 3). The mean R-square under bootstrapping was 0.90, indicating that this allometric function should be able to predict on to independent data with good accuracy. However, the breadth of the bootstrapped 95% CI for the linear coefficient (
a in Equation 1) was 30% of the observed value (
i.e., the fitted coefficient for the entire harvested shrub dataset). Thus, variability in the co-efficient values under bootstrapping arose because the few large shrubs harvested have a great deal of leverage in allometric equation fitting. Under bootstrapping there is a reasonable probability that for some simulations no large shrubs will be included in the data used to fit the relationship, leading to a high degree of variability across simulations. When simulating harvested shrub measurement errors, the breadth of the 95% CI for the linear coefficient was 17% of the observed value. This indicates that simulated measurement errors for harvested shrubs had a non-negligible effect on the allometric equation.
Figure 3.
Allometric relationship between harvested shrub dry weight and shrub total basal area multiplied by shrub height (a). This curve was obtained by fitting the equation: Dry weight = exp(a • ln(basal area • height) + b). Solid line in (a) shows the curve fitted on the entire harvested shrub dataset with a = 1.0215 and b = 6.1512. Dotted lines show the upper and lower bounds of the 95% confidence interval for predicted values under bootstrapping. Confidence interval breadths for predicted values are expressed in terms of carbon (C) storage in (b).
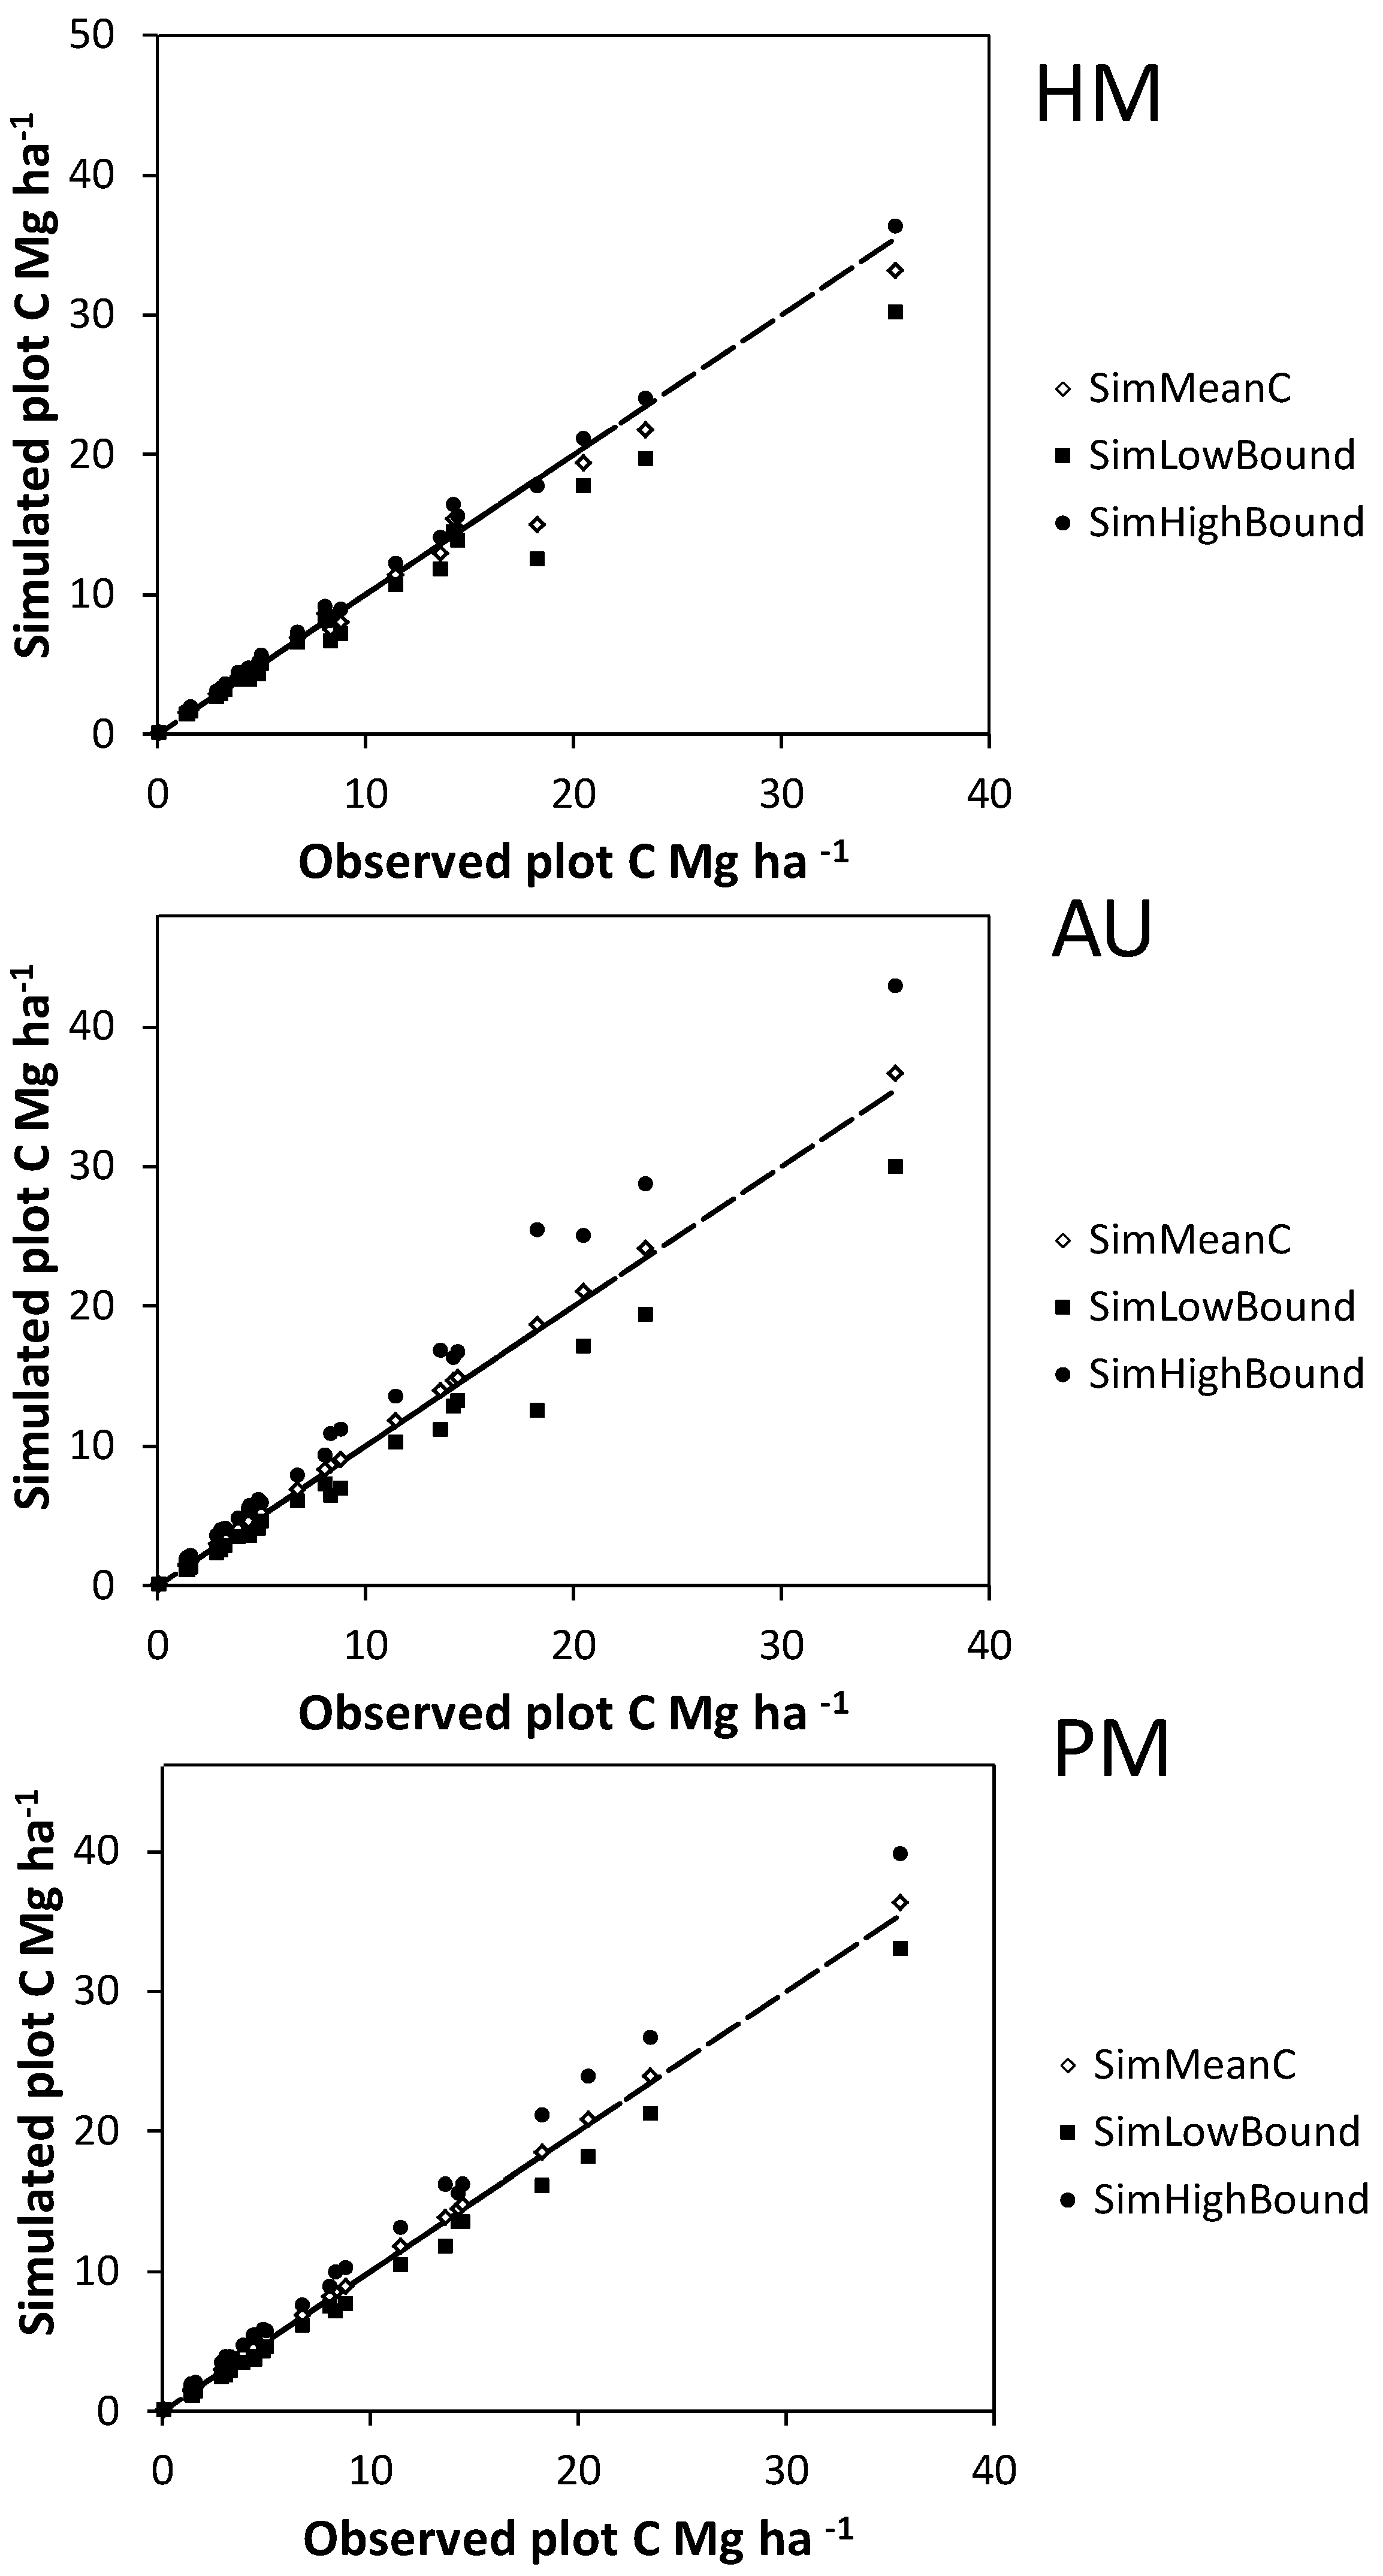
Bootstrapped allometric uncertainty had the greatest independent effect on C storage estimates for individual plots (
Figure 4 and
Figure 5), followed by measurement errors for shrubs in plots and measurement errors for harvested shrubs. The largest interaction effects all included bootstrapped allometric uncertainty (
Figure 5 and
Figure 6), with the largest error arising when all three error sources were included in simulations (with the 95% CI of simulated values averaging 3.3 Mg C ha
–1 or 42% of observed C storage). However, in all simulations the degree of uncertainty varied considerably amongst individual plots (
Figure 4,
Figure 5 and
Figure 6). This variation was strongly related to the “observed” C storage of plots. Plots with large observed C storage tended to have greater uncertainty in C storage (
i.e., larger confidence interval breadth for simulated values) expressed in absolute terms (
Figure 7a). By contrast, plots with low C storage tended to have high uncertainty in percentage terms (
Figure 7b). The greatest uncertainty in estimates of mean C storage across plots was observed for the three-way interaction including all sources of uncertainty (
Figure 8), with the 95% CI for mean C estimates spanning over 2 Mg ha
–1 or 28% of observed mean C.
Figure 4.
Mean (SimMeanC) and lower and upper 95% confidence interval limits (SimHighBound and SimLowBound) for carbon (C) estimate uncertainty simulations using the basal area approach. Simulated sources of uncertainty were diameter and height measurement errors for harvested shrubs (HM), bootstrapped allometry uncertainty (AU), and diameter and height measurement errors for shrubs on plots (PM). The trend lines indicate a y = x curve.
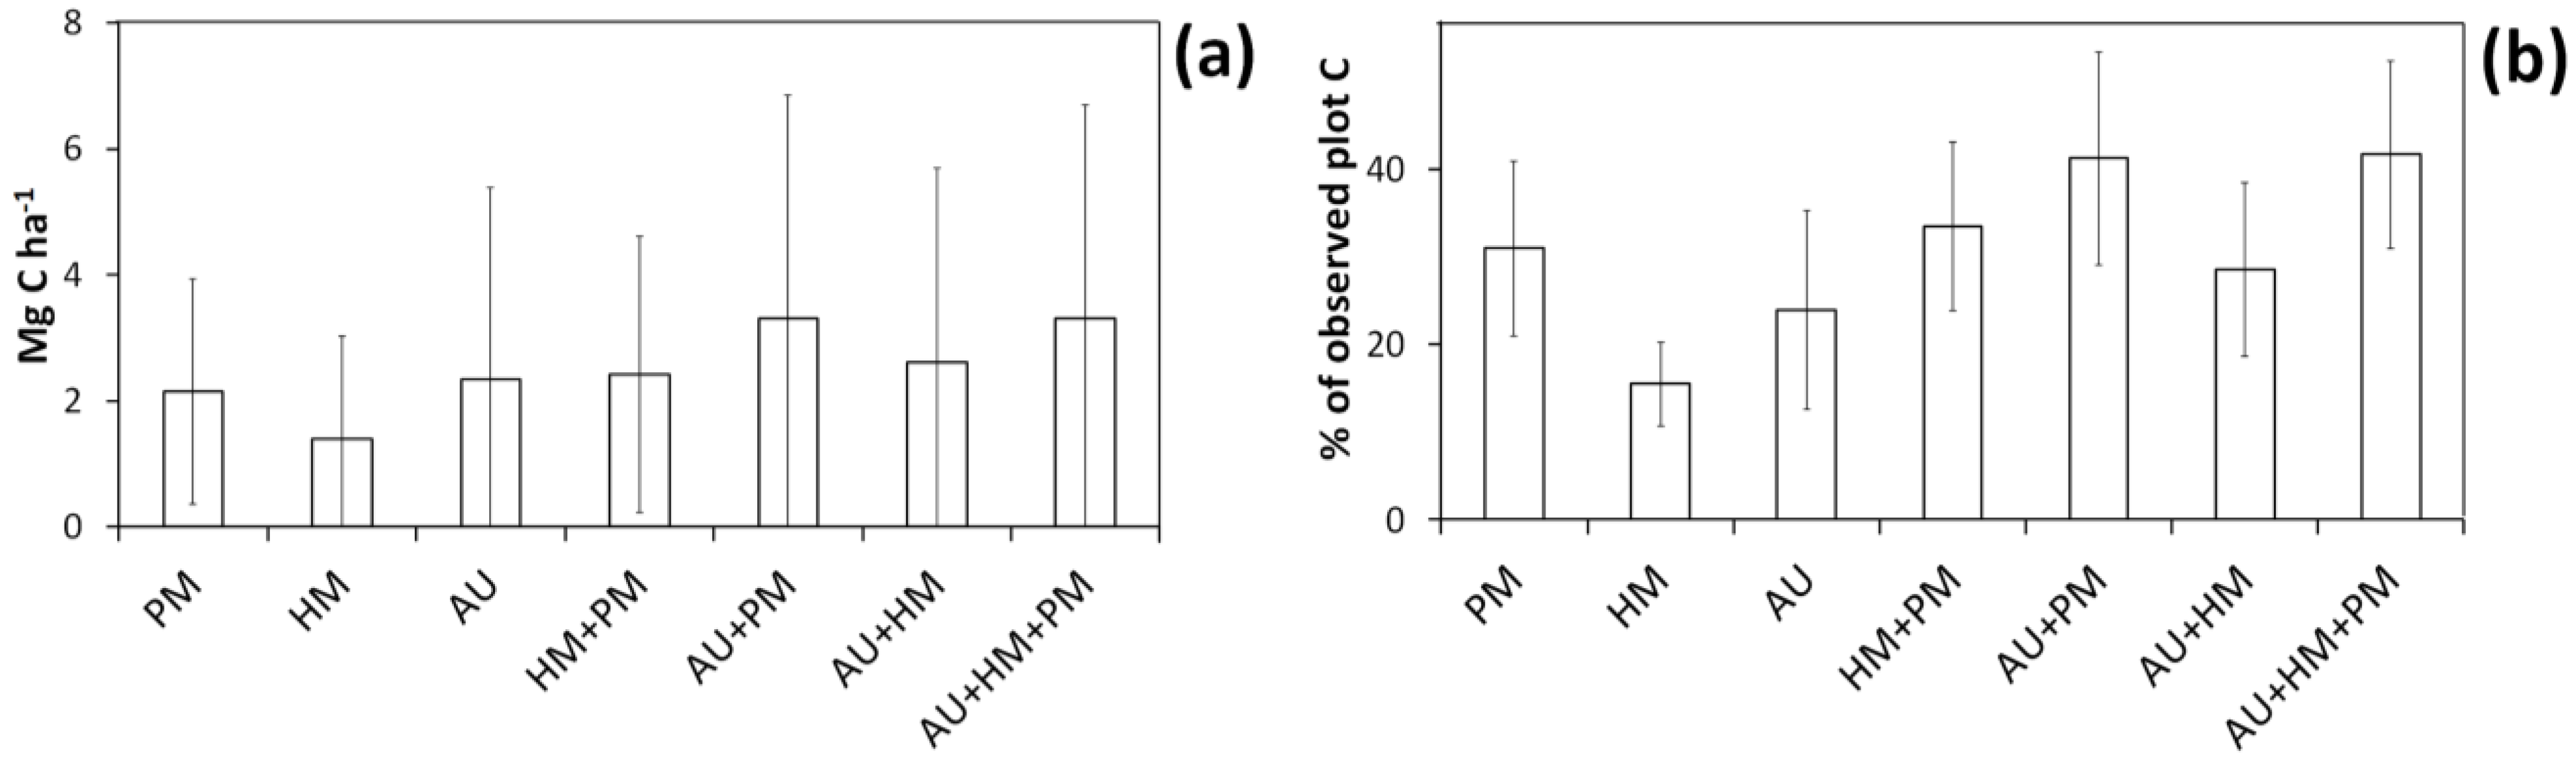
Figure 5.
Mean 95% confidence interval breadth (i.e., difference between 2.5th and 97.5th percentile) for simulated C storage of individual plots using the basal area approach. Confidence interval breadths are expressed either in absolute terms (a) or as a percentage of “observed” plot C estimates (b). The error bars show standard deviation (taken across plots). Codes are as follows: HM, harvest measurement error; PM, plot measurement error; AU, bootstrapped uncertainty in the allometry.
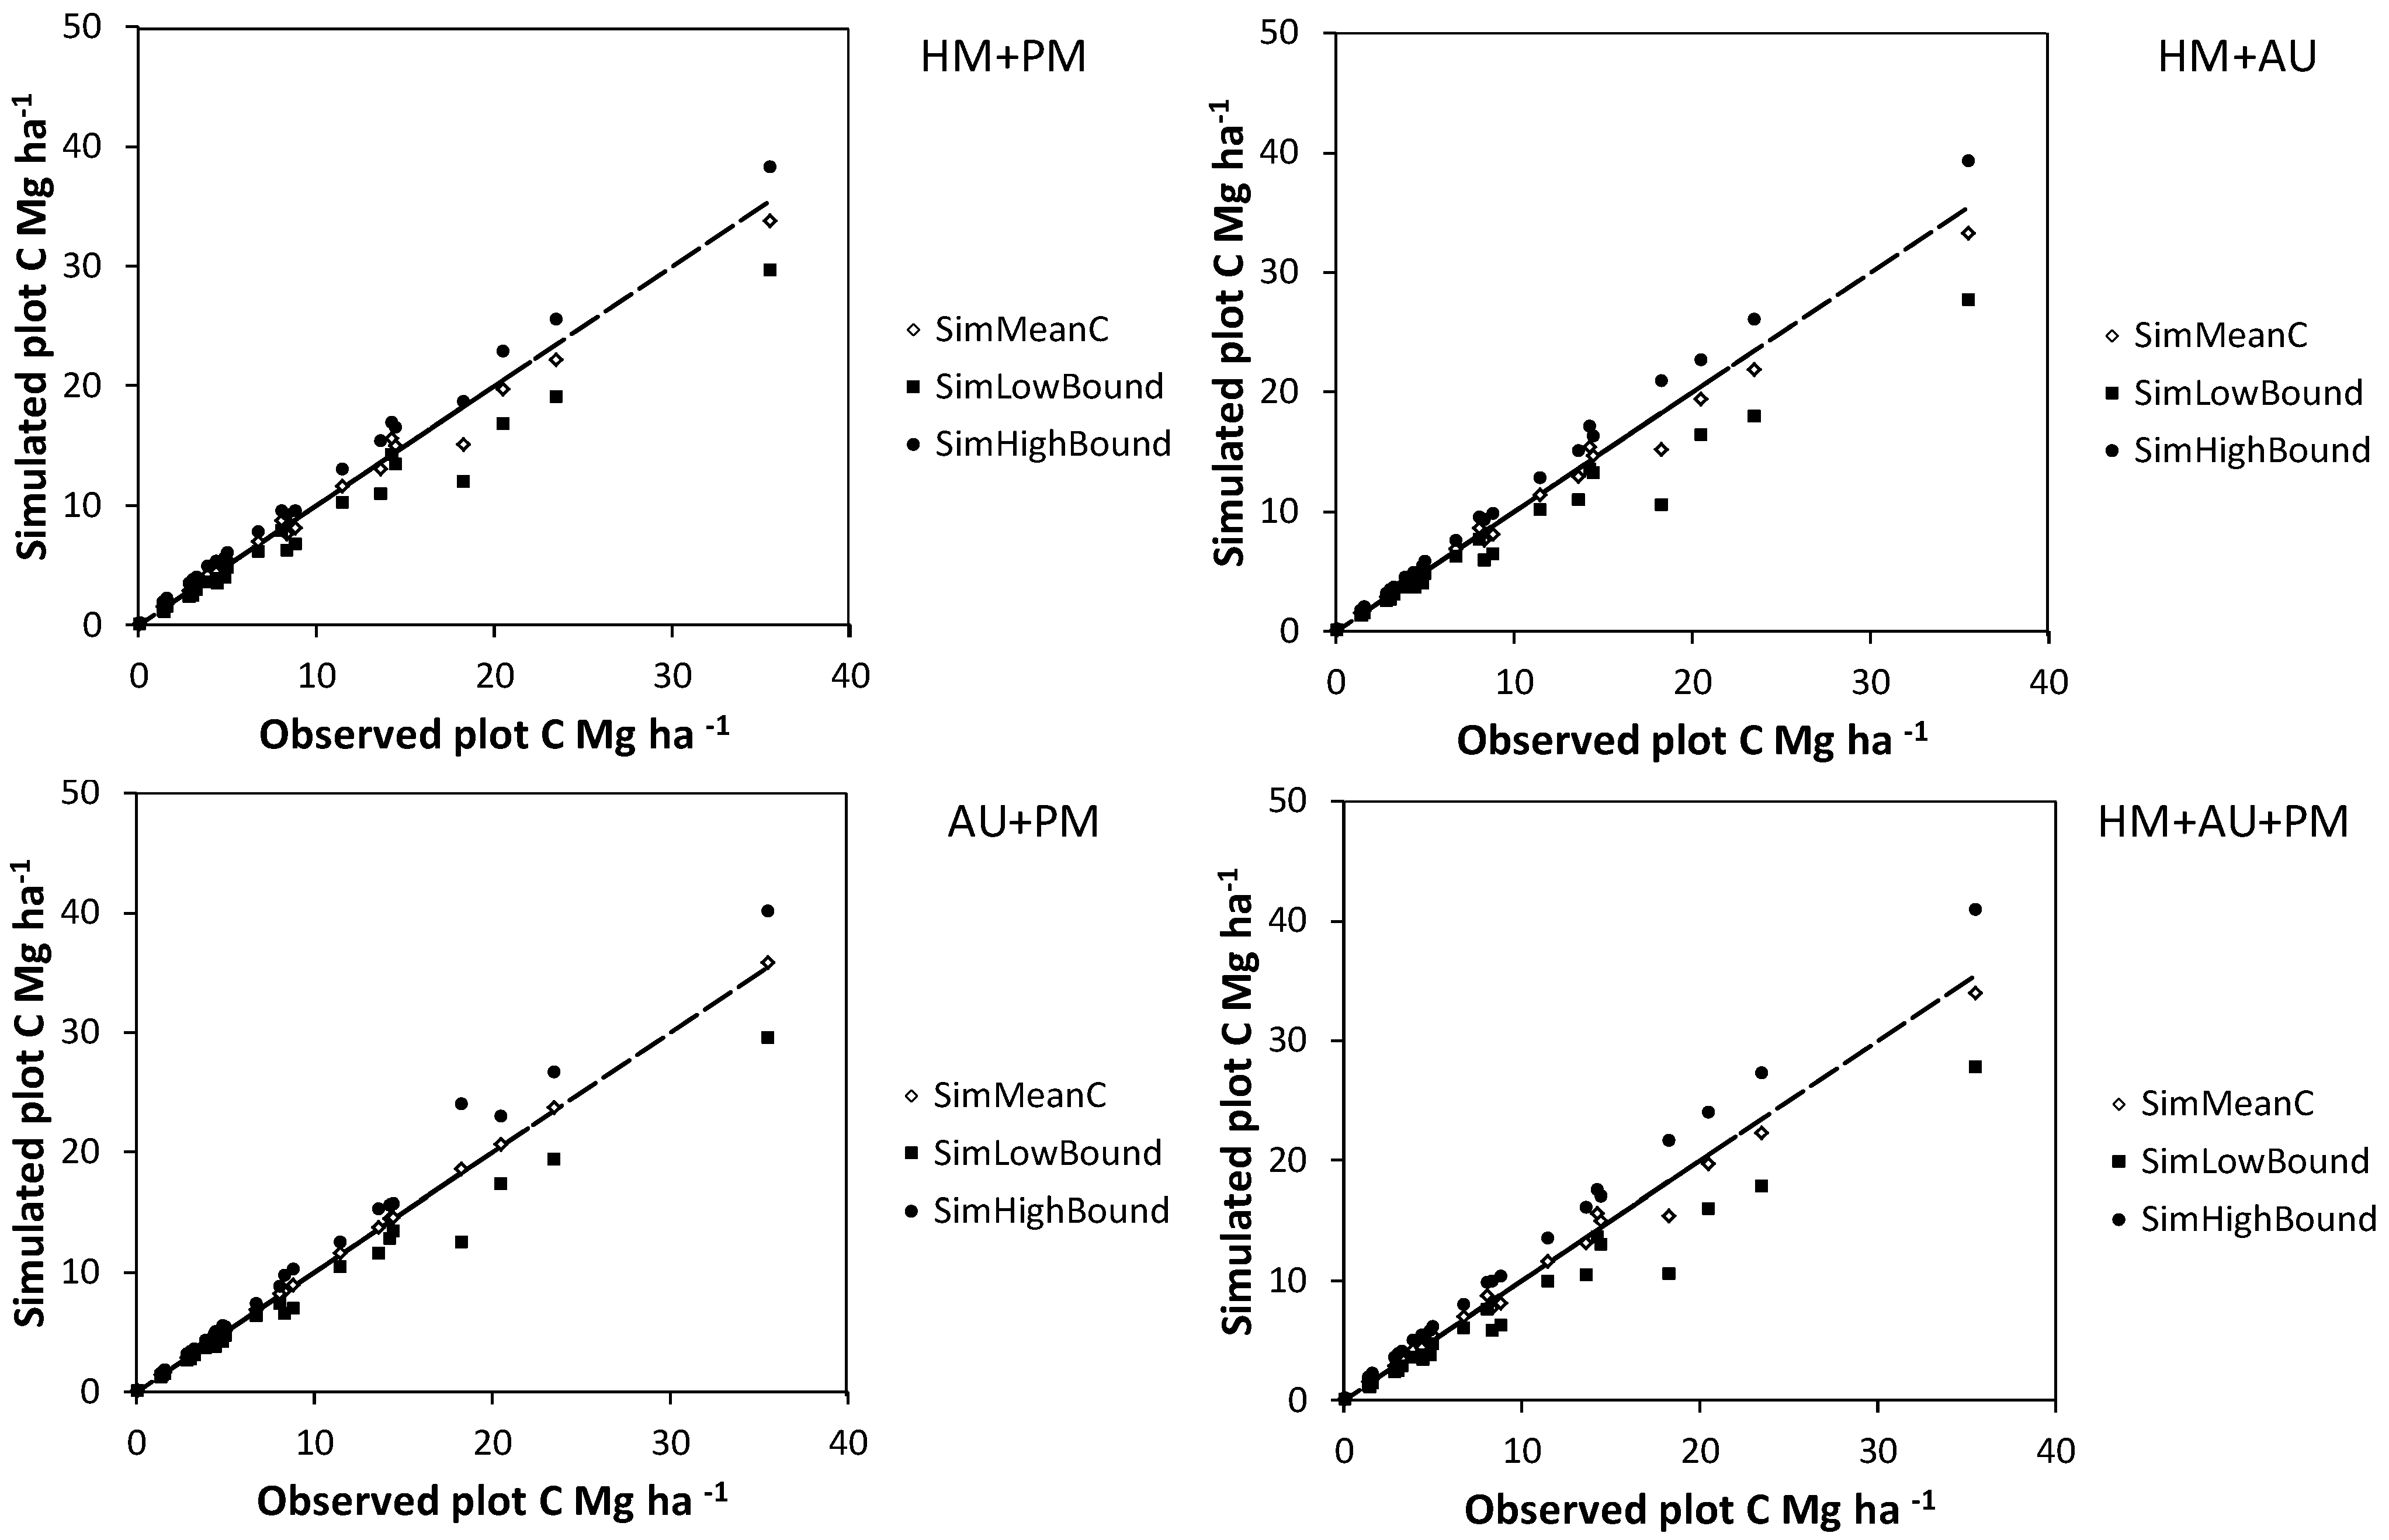
Figure 6.
Mean (SimMeanC) and lower and upper 95% confidence interval limits (SimHighBound and SimLowBound) for the effect of interactions between different sources of error on carbon (C) estimate uncertainty simulations using the basal area approach. Simulated sources of uncertainty were diameter and height measurement errors for harvested shrubs (HM), bootstrapped allometry uncertainty (AU), and diameter and height measurement errors for shrubs on plots (PM). The trend lines indicate a y = x curve.
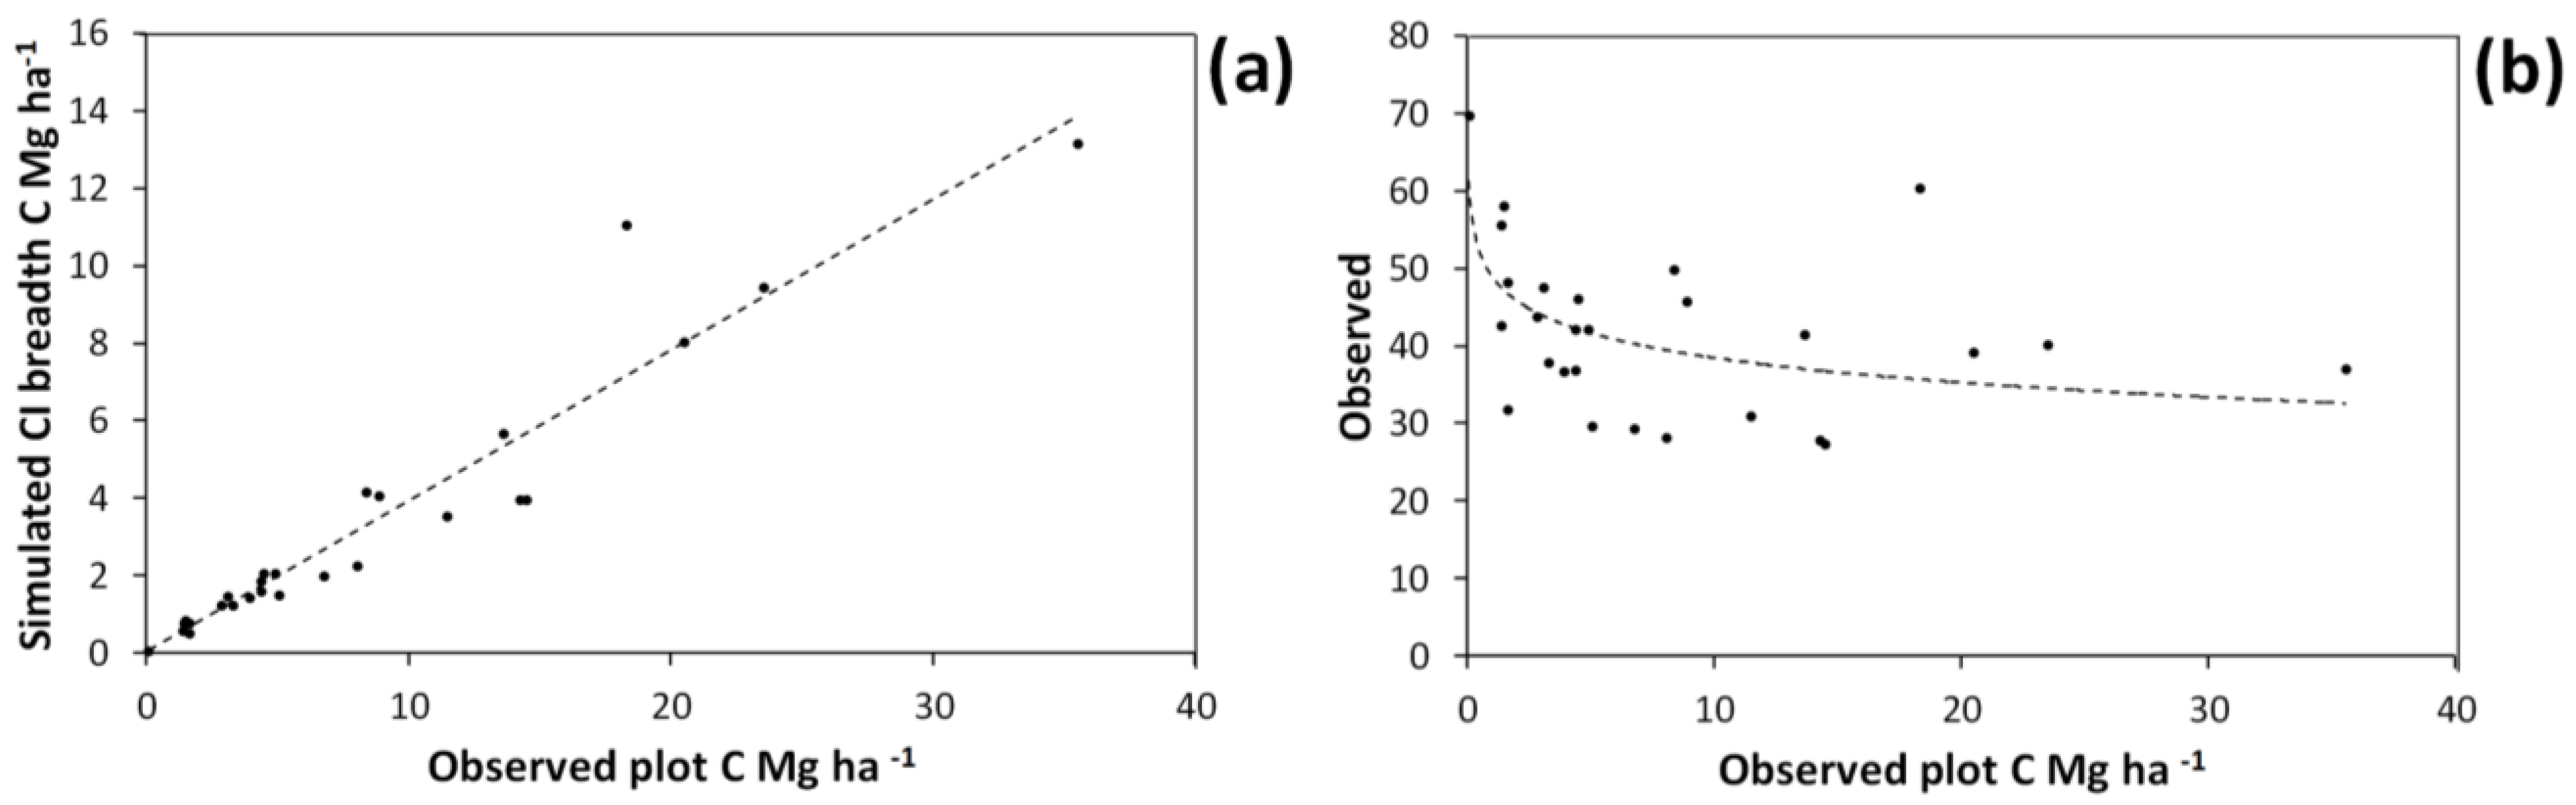
Figure 7.
95% confidence interval (CI) breadth for simulated C storage estimates of individual plots expressed in absolute terms (a), or as a percentage of “observed” C storage (b). The confidence intervals were taken from the simulations including all three error sources–harvest shrub measurement error, plot shrub measurement error and bootstrapped allometry uncertainty (i.e., simulation type 7).
Figure 8.
Mean and 95% confidence interval breadth (i.e., difference between 2.5th and 97.5th percentile) for simulated mean C storage taken across plots using the basal area approach (a); Confidence interval breadths expressed either in absolute terms (b) or as a percentage of “observed” mean C across plots (c). Codes are as follows: HM, harvest measurement error; PM, plot measurement error; AU, bootstrapped uncertainty in the allometric equation.
In all of the re-measured plots, C storage in 2012 was greater than for 2008 (
Figure 9a). C storage in 2012 also exceeded the 95% CI of simulated values for the 2008 measurement in all of the re-measured plots. This indicates that, for all re-measured plots, increases in estimated C storage were beyond the bounds of C estimate uncertainty for 2008 estimates.
Figure 9.
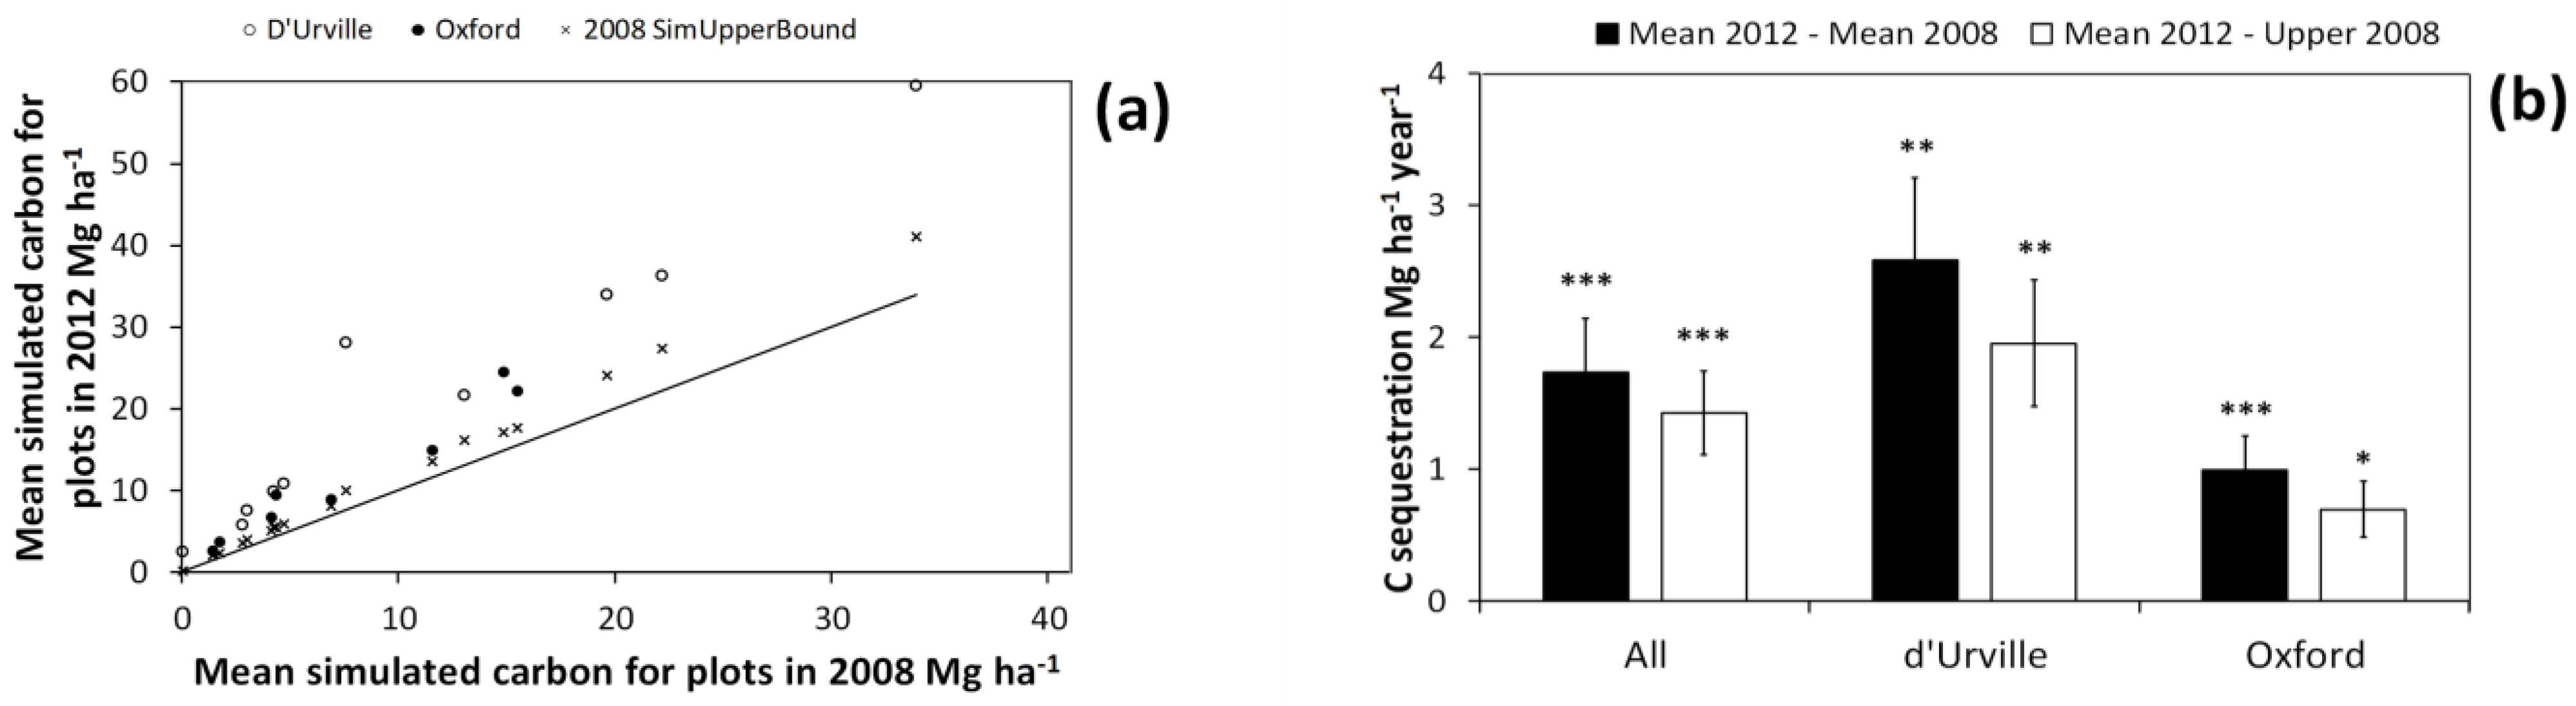
Mean simulated carbon (C) storage estimates for individual plots in the 2012 measurement vs. that for 2008 (a). The line indicates a y = x curve. 2008 SimUpperBound is the upper bound of 95% confidence interval for simulated C estimates of individual plots in the 2008 measurement. The confidence intervals in (a) were taken from the simulations including all three error sources: harvest shrub measurement error, plot shrub measurement error, and bootstrapped allometry uncertainty (i.e., simulation type 7); (b) Mean and standard error of C sequestration across all plots and those in either the d’Urville or Oxford site. Mean 2012−Mean 2008 refers to C sequestration estimates using the mean of the simulated values (for each plot) in both 2012 and 2008, while Mean 2012−Upper 2008 refers to estimates derived by subtracting the upper bound of 95% confidence interval for each plot in 2008 from the mean of simulated values in 2012. This provides a test of whether or not we can detect C sequestration beyond the margin of error introduced by the uncertainty sources we simulated. Significance of paired t-tests for differences in C storage between 2008 and 2012 are as follows: * p < 0.05; ** p < 0.01; *** p < 0.001.
Figure 9.
Mean simulated carbon (C) storage estimates for individual plots in the 2012 measurement vs. that for 2008 (a). The line indicates a y = x curve. 2008 SimUpperBound is the upper bound of 95% confidence interval for simulated C estimates of individual plots in the 2008 measurement. The confidence intervals in (a) were taken from the simulations including all three error sources: harvest shrub measurement error, plot shrub measurement error, and bootstrapped allometry uncertainty (i.e., simulation type 7); (b) Mean and standard error of C sequestration across all plots and those in either the d’Urville or Oxford site. Mean 2012−Mean 2008 refers to C sequestration estimates using the mean of the simulated values (for each plot) in both 2012 and 2008, while Mean 2012−Upper 2008 refers to estimates derived by subtracting the upper bound of 95% confidence interval for each plot in 2008 from the mean of simulated values in 2012. This provides a test of whether or not we can detect C sequestration beyond the margin of error introduced by the uncertainty sources we simulated. Significance of paired t-tests for differences in C storage between 2008 and 2012 are as follows: * p < 0.05; ** p < 0.01; *** p < 0.001.
![Forests 05 00309 g009]()
Across all plots and for both of the study sites considered separately, C sequestration was significantly greater than zero (
Figure 9b). This was true whether we estimated sequestration rates using either the mean or the upper bound of the 95% CI of simulated values for the first measurement. This provides strong evidence that the observed increase in mean C storage between measurements was beyond the bounds of C storage uncertainty. This in turn suggests that even when the major potential sources for C estimate uncertainty are accounted for, we should be able to detect relatively modest gains in shrubland C storage.
4. Discussion
Our results show that the allometric equation used to estimate the biomass of individual shrubs is likely to be the greatest source of uncertainty in shrubland C storage estimates. This concurs with existing studies of uncertainty in forest C storage, where allometries for estimating tree biomass are generally the greatest source of uncertainty (e.g., [
18]). Uncertainty for individual plots was often considerable (with 95% CI averaging 41% of observed C storage), and the uncertainty of mean C storage estimates was also fairly large (with the 95% CI averaging 28%). Despite this, we obtained mean C sequestration rates that exceeded the margin of error introduced by the sources of uncertainty we modelled. This was true for all plots considered together and for either of the two study sites considered separately. Thus, our results show that the allometric approach we used provides a powerful means of detecting change in shrubland C storage, even when uncertainty in C storage estimates is included. Indeed, it is impressive that we were able to demonstrate significant gains in C storage with a relatively small number of plots, despite a relatively modest sequestration rate (mean across all plots of 1.73 Mg C ha
–1 year
–1). Considerable time and effort may be required for basal diameter measurements when stem densities are high. However, this might be offset by the requirement of fewer plots relative to more rapid, but less precise methods (e.g., [
27]).
We can scale up our plot level results for either site to assess the potential economic viability of the approach used in our study. Post-cultural shrublands at the two study sites combined cover a total area of 640 ha. Using our estimated mean sequestration rate for each site, post-cultural shrublands across the combined areas will have sequestered around 3680 Mg C, or 13,520 Mg CO2e (± s.e. 2907) between 2008 and 2012. Obviously, the economic viability of our survey method would depend heavily on carbon prices. With a unit price of US $20 per Mg CO2e our method could be applied for less than 10% of the money gained from carbon credits. Further, it may be possible that a reduction in sampling intensity would still allow us to detect changes in C storage with reasonable accuracy. Indeed, the sampling intensity we have used to estimate C sequestration (one plot per 37 ha) is much greater than that used in New Zealand’s national carbon monitoring system (one plot per 6400 ha).
In New Zealand, methods for estimating C storage in shrublands differ greatly from those used in forests [
7,
24,
25,
28]. Shrubland C estimates in early shrubland succession use allometries where the biomass of isolated individuals or clumps of individuals is estimated using crown volume. As crowns of shrubs merge and cover becomes continuous, stand-level allometric equations linking canopy height and percentage cover to biomass on a per-area basis are used. By contrast, forest C estimation is largely dependent on allometric equations linking individual tree dimensions to individual-level biomass [
21,
24].
This difference in allometric approaches could potentially cause biases in documenting C stock changes during succession from shrubland to forest. This is because stand- and individual-level approaches are unlikely to scale in exactly the same way as shrubs and saplings are replaced by trees, potentially leading to under- or over-estimation of C gains during the transition from shrubland to forest. Use of the individual-based allometric approach we have presented here through all stages of shrubland succession would provide much better continuity in C storage estimates during succession. This is especially true since, like tree allometries, the individual shrub allometry uses stem diameter and plant height to estimate biomass.
The individual-based allometric approach we have presented here, if applied to large-scale carbon monitoring programs, could greatly increase our power to model C sequestration during early woody succession. This is because it would permit application of individual-based forest dynamics models such as the perfect plasticity approximation (PPA) of Purves
et al. [
10]. Our results show that an individual-based allometric approach gives a high degree of confidence in C storage estimates, so that we should be able to scale up individual-based growth models to predict stand-scale C storage. Accurate models of C sequestration on abandoned agricultural land are vital to assessing the impact of future land use scenarios on greenhouse emissions management [
8]. Robust models of post-agricultural C sequestration could also have broader benefits for catchment-level environmental management. For instance, having models that provide a high degree of confidence on the potential financial gain from woody succession could help to convince landowners to retire marginal land [
8]. By encouraging woody succession on erosion-prone land, this could also help reduce sedimentation and erosion, thus increasing the longevity of flood protection and water storage infrastructure.
It is possible that we have underestimated the true uncertainty in our shrubland C storage estimates. The errors we have included are only a small subset of the potential causes of uncertainty in plot-based C mensuration methods. Some of these additional uncertainty sources are errors in plot layout and horizontal area estimation, missed or double-counted stems, and data-entry errors. Holdaway
et al. [
29] performed a comprehensive analysis of uncertainty sources in plot-based forest C storage estimates. They found that of these additional uncertainty sources, errors associated with very large trees (especially species identification errors and missing or double-counted diameter measurements) caused the most uncertainty. This is because large trees account for a huge proportion of forest C storage. However, the potential for this is much less in shrublands because size differences between individual stems are much less pronounced. Further, recent evidence suggests that more sophisticated allometric approaches than the one we used could considerably reduce uncertainty in C storage estimates [
15]. Thus, overall it seems we can be fairly confident that our analyses have captured the majority of the true uncertainty in C storage estimates.


